orlando, florida’s urban and community forests and their...
TRANSCRIPT

FOR290
Orlando, Florida’s Urban and Community Forests and Their Ecosystem Services1
Edem K. Empke, Elizabeth Becker, Jessica Lab, Ross Hinkle, Francisco Escobedo, and Basil Iannone2
1. This document is FOR290, one of a series of the School of Forest Resources and Conservation Department, UF/IFAS Extension. Original publication date February 2012. Revised May 2018. Visit the EDIS website at http://edis.ifas.ufl.edu.
2. Edem K. Empke, graduate student; Elizabeth Becker, graduate student; Jessica Lab, graduate student, Department of Biology, University of Central Florida; Ross Hinkle, professor, Department of Biology, University of Central Florida; Francisco Escobedo, assistant professor, School of Forest Resources and Conservation; and Basil Iannone, assistant professor, geospatial analytics of sustainable human and ecological development, School of Forest Resources and Conservation; UF/IFAS Extension, Gainesville, FL 32611.
The Institute of Food and Agricultural Sciences (IFAS) is an Equal Opportunity Institution authorized to provide research, educational information and other services only to individuals and institutions that function with non-discrimination with respect to race, creed, color, religion, age, disability, sex, sexual orientation, marital status, national origin, political opinions or affiliations. For more information on obtaining other UF/IFAS Extension publications, contact your county’s UF/IFAS Extension office.
U.S. Department of Agriculture, UF/IFAS Extension Service, University of Florida, IFAS, Florida A & M University Cooperative Extension Program, and Boards of County Commissioners Cooperating. Nick T. Place, dean for UF/IFAS Extension.
The City of Orlando, Florida, comprises different land uses ranging from suburban forests and pastures to residential, industrial, and commercial areas. Urban forests, or the trees and shrubs on these land uses, play an important role in providing ecosystem services and are often key components in urban planning and management as well as in envi-ronmental regulations (Andreu and others 2009). Urban forest assessments can, therefore, be used as a baseline for monitoring changes due to natural and human factors such as hurricanes and land use changes and to better understand other issues such as biodiversity conservation and mitigation of climate change. Urban sustainability and green infrastructure are also a key focus of current city planning and development efforts.
To provide information for these purposes, an assessment of urban forests within the limits of the City of Orlando was conducted during the summer of 2010. This publication is based on this assessment and provides information on the structure and composition of Orlando’s urban forest, the occurrence of invasive trees in the city, the ecosystem services trees provide—including estimating the mitigation of climate change effects and their role in urban hydrol-ogy—and how this information can be used to define sustainable urban planning objectives and goals.
MethodsThe methods employed in this assessment followed the protocols of the USDA Forest Service’s Urban Forest Effects (UFORE) model, (https://www.nrs.fs.fed.us/tools/ufore/; Nowak and others 2008). In Florida, the model has been used in Gainesville (Escobedo and others 2009b [http://edis.ifas.ufl.edu/fr276]), Pensacola (Escobedo and others 2010 [http://edis.ifas.ufl.edu/fr293]), Miami-Dade (Escobedo and others 2011 [http://edis.ifas.ufl.edu/fr347]) and Tampa (Andreu and others 2009 [http://edis.ifas.ufl.edu/fr265]). Overall, 150 randomly selected 0.1-acre plots across 64,600 acres in Orlando were located and sampled for urban forest characteristics. Specifically field data were collected for surface ground cover, tree species and charac-teristics (woody plants greater than 2.5 cm in diameter at breast height or 4.5 feet above the surface), shrubs species and size, and tree to building distances. Specific methods and field data collected can be found in Escobedo and others 2010 and 2011 and land-use descriptions are based on the protocols from St. Johns River Water Management District (Florida Department of Environmental Protection 2018). The locations of the plots and the area for each land-use type are shown in Figure 1 and Table 1 respectively.

2Orlando, Florida’s Urban and Community Forests and Their Ecosystem Services
We assessed the following urban forest ecosystem services: carbon storage, carbon sequestration, energy effects, reduction of air pollution, and rainfall interception. Carbon storage, carbon sequestration, energy effects, and air pollutant removal were estimated using the Urban Forest Effects model Version 6.0 (https://www.nrs.fs.fed.us/tools/ufore/). For the purposes of this study, carbon storage is the amount of carbon stored in the biomass of vegetation at a given point in time. Carbon sequestration is the amount of atmospheric carbon used for growth in vegetation each year.
Landscape-level rainfall interception estimates were based on a one-dimensional mass and energy balance rainfall interception model (Xiao and others 1998). We calculated rainfall interception by urban tree canopies using leaf area estimates from this study and average urban tree crown-lev-el rainfall interception loss rates from California USA (27%, based on Xiao and McPherson 2002). Total annual rainfall interception was then adjusted according to the contribu-tion to total rainfall interception by different tree types in the study area based on Florida pine-cypress flatwoods (18%) and rates for percent of total annual rainfall intercep-tion (23% conifer, 13% palms, 60% broadleaf evergreen and 4% broadleaf deciduous as per Xiao and McPherson 2002). Adjusted total annual rainfall interception by tree type was then multiplied by that tree type’s contribution to total leaf area in Orlando.
ResultsGround CoverImpervious ground cover (for example, buildings, asphalt, concrete) was estimated to be the most common ground cover (29%; Figure 2). We estimate that approximately 35.2% of the study area is appropriate for planting shade trees. We estimate that the highest proportion (77.9%) of plantable space is in parks and agricultural land use types (Table 2). This is the result of the low proportion (3.4%) of impervious ground cover in parks and agricultural lands and the fact that much of the agricultural component of this land use category was vacant land and pasture with no trees. The highest impervious cover was estimated in commercial and institutional areas. Utility areas of about 543 acres (220 ha), 66% of which was plantable space, were also a component of this land use type. The 0.4% of impervious cover in wetlands was due to the concrete used on the banks of some water bodies within the city.
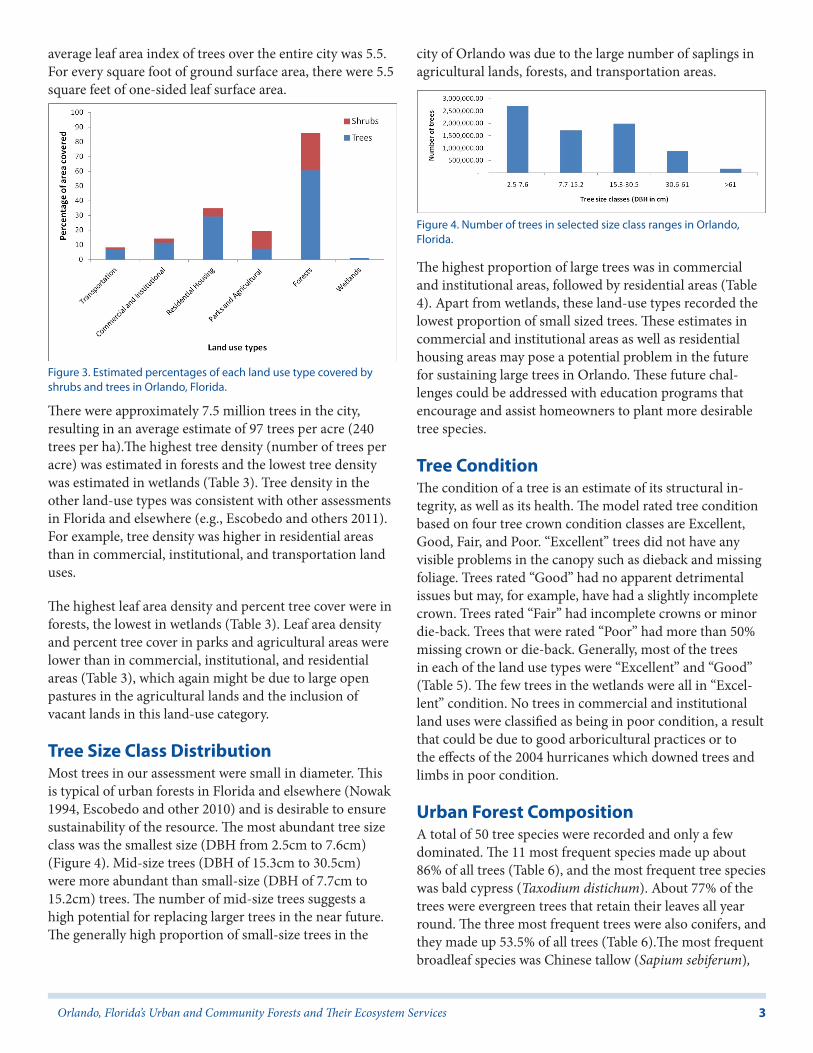
Urban Forest Cover and DensityEstimates of the total cover of trees, woody shrubs, and palms were 22.1%, 8.7%, and 0.6% respectively. In all land use types except wetlands, all plots were covered by a mix of shrubs and trees (Figure 3). In forests, about 25% and 61% of the area was covered by shrubs and trees respectively. In parks and agricultural lands, 7% and 12% of the land was covered by shrubs and trees respectively. About 6% and 29% of residential areas were covered by shrubs and trees respectively.
Leaf area index (LAI) is the ratio of the one-sided area of green leaf to the ground surface area in an individual tree (Breda 2003) and it can be used to indicate tree canopy con-dition and the capacity of the plants to fix or take up carbon dioxide from the atmosphere. Increased LAI contributes to energy savings from shading and rainfall interception. The
Figure 1. Land use cover in the City of Orlando. The black diamonds show the location of sample plots.Credits: St. Johns River Water Management District
Figure 2. Ground cover in the city of Orlando showing the different cover types by percent estimates.
3Orlando, Florida’s Urban and Community Forests and Their Ecosystem Services
average leaf area index of trees over the entire city was 5.5. For every square foot of ground surface area, there were 5.5 square feet of one-sided leaf surface area.
There were approximately 7.5 million trees in the city, resulting in an average estimate of 97 trees per acre (240 trees per ha).The highest tree density (number of trees per acre) was estimated in forests and the lowest tree density was estimated in wetlands (Table 3). Tree density in the other land-use types was consistent with other assessments in Florida and elsewhere (e.g., Escobedo and others 2011). For example, tree density was higher in residential areas than in commercial, institutional, and transportation land uses.
The highest leaf area density and percent tree cover were in forests, the lowest in wetlands (Table 3). Leaf area density and percent tree cover in parks and agricultural areas were lower than in commercial, institutional, and residential areas (Table 3), which again might be due to large open pastures in the agricultural lands and the inclusion of vacant lands in this land-use category.
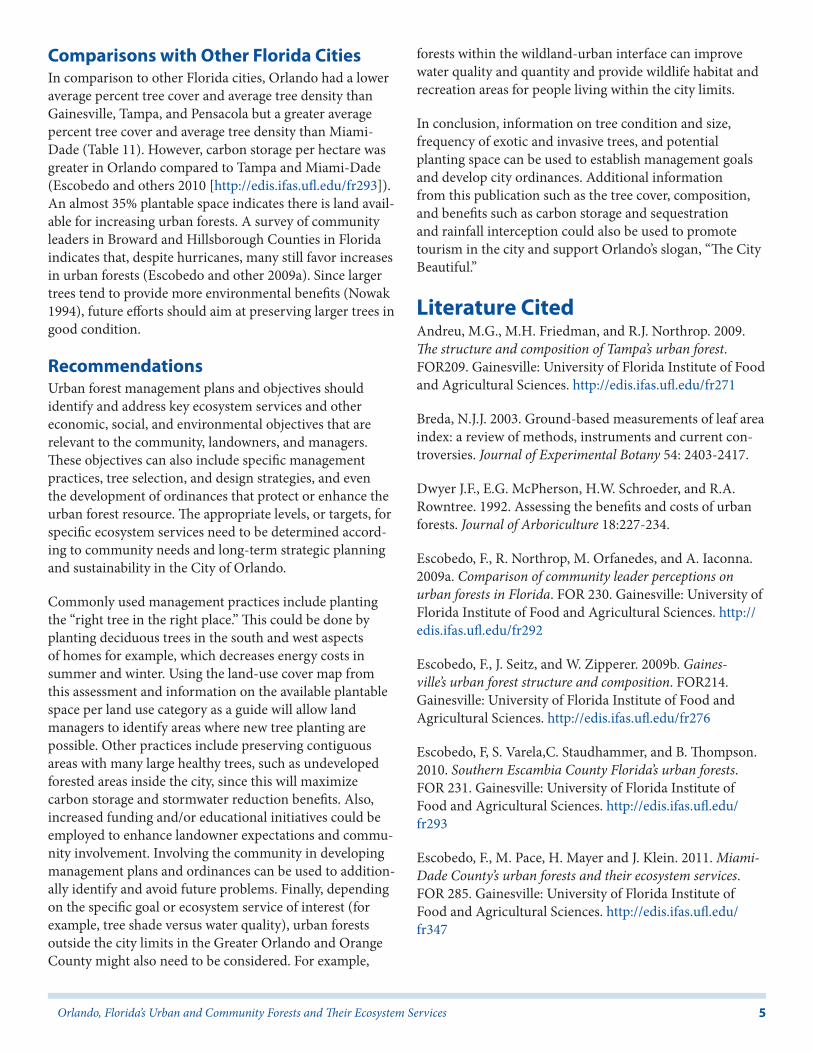
Tree Size Class DistributionMost trees in our assessment were small in diameter. This is typical of urban forests in Florida and elsewhere (Nowak 1994, Escobedo and other 2010) and is desirable to ensure sustainability of the resource. The most abundant tree size class was the smallest size (DBH from 2.5cm to 7.6cm) (Figure 4). Mid-size trees (DBH of 15.3cm to 30.5cm) were more abundant than small-size (DBH of 7.7cm to 15.2cm) trees. The number of mid-size trees suggests a high potential for replacing larger trees in the near future. The generally high proportion of small-size trees in the
city of Orlando was due to the large number of saplings in agricultural lands, forests, and transportation areas.
The highest proportion of large trees was in commercial and institutional areas, followed by residential areas (Table 4). Apart from wetlands, these land-use types recorded the lowest proportion of small sized trees. These estimates in commercial and institutional areas as well as residential housing areas may pose a potential problem in the future for sustaining large trees in Orlando. These future chal-lenges could be addressed with education programs that encourage and assist homeowners to plant more desirable tree species.
Tree ConditionThe condition of a tree is an estimate of its structural in-tegrity, as well as its health. The model rated tree condition based on four tree crown condition classes are Excellent, Good, Fair, and Poor. “Excellent” trees did not have any visible problems in the canopy such as dieback and missing foliage. Trees rated “Good” had no apparent detrimental issues but may, for example, have had a slightly incomplete crown. Trees rated “Fair” had incomplete crowns or minor die-back. Trees that were rated “Poor” had more than 50% missing crown or die-back. Generally, most of the trees in each of the land use types were “Excellent” and “Good” (Table 5). The few trees in the wetlands were all in “Excel-lent” condition. No trees in commercial and institutional land uses were classified as being in poor condition, a result that could be due to good arboricultural practices or to the effects of the 2004 hurricanes which downed trees and limbs in poor condition.
Urban Forest CompositionA total of 50 tree species were recorded and only a few dominated. The 11 most frequent species made up about 86% of all trees (Table 6), and the most frequent tree species was bald cypress (Taxodium distichum). About 77% of the trees were evergreen trees that retain their leaves all year round. The three most frequent trees were also conifers, and they made up 53.5% of all trees (Table 6).The most frequent broadleaf species was Chinese tallow (Sapium sebiferum),
Figure 3. Estimated percentages of each land use type covered by shrubs and trees in Orlando, Florida.
Figure 4. Number of trees in selected size class ranges in Orlando, Florida.

4Orlando, Florida’s Urban and Community Forests and Their Ecosystem Services
an invasive exotic species and the most common palm was cabbage palm (Sabal palmetto).
A total of 36 tree species were recorded in developed land uses such as transportation, commercial and institutional, and residential areas. In undeveloped areas such as parks, agricultural areas, forests, and wetlands, a total of 26 tree species were recorded. The five most frequent tree species in the developed land-use areas were queen palm (Syagrus romanzoffianum), live oak (Quercus virginiana), cabbage palm (Sabal palmetto), slash pine (Pinus elliottii), and laurel oak (Quercus laurifolia). In undeveloped land use areas, the five most frequent tree species were bald cypress (Taxodium distichum), pond cypress (Taxodium ascendens), Chinese tallow (Sapium sebiferum), slash pine (Pinus elliottii), and swamp tupelo (Nyssa sylvatica var. biflora).
The importance value of any urban tree species is deter-mined by its relative contribution to the overall ecosystem. This “Importance Value” was estimated as a function of the tree’s percent population and its percent leaf area. The two most important tree species varied among land-use cat-egories, but live oak (Quercus virginiana) and bald cypress (Taxodium distichum) were the most important species across all land use types (Table 7).
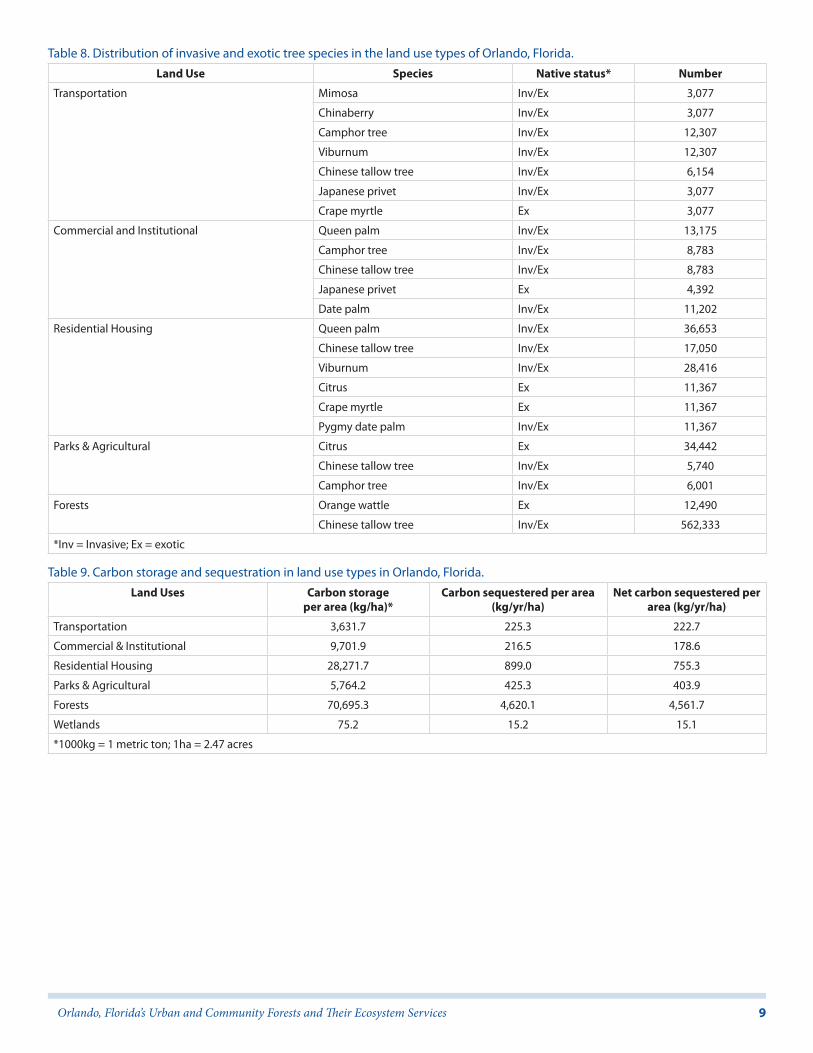
Invasive and Exotic Tree SpeciesAn exotic plant is a species that is not native to Florida, and an invasive plant is a species that has naturalized and is harming native Florida plant communities (Florida Exotic Plant Pest Council 2011). A few exotic species in our assess-ment, however, were not invasive. A total of 15 exotic tree species were recorded. No exotic or invasive tree species were recorded in wetlands. The location and number of tree species that are exotic and those that are invasive and exotic are presented in Table 8.
Carbon Storage and SequestrationThe total carbon storage in the city’s urban trees was estimated at 705,527 tons, and total carbon sequestered was estimated at 35,535 tons per year. The model estimated that the highest carbon storage by trees per area of land cover was in forests followed by residential areas (Table 9). The land-use type with the least tree carbon storage was wetlands. Tree carbon sequestration followed the same pattern as carbon storage (Table 9).
Energy EffectsTotal amount of carbon avoided annually by reduced building energy use due to tree shading and climate cooling effects in one- and two-story residential buildings in the
city was estimated to be 1,600 tons. Using the social costs of carbon, the monetary value of carbon avoided was $34,240.00. This was based on the social cost estimates of $21.40/ton of carbon in 2010 at 3% discount rate (Inter-agency Working Group on Social Cost of Carbon 2010). City-wide, the total energy savings was 11,278 MWH, which amounted to savings of $1,288,718. The dollar estimates of energy savings were determined by averaging the residential electricity rates of three local electricity providers: Progress Energy, Orlando Utility, and Florida Power and Light.
Removal of Air PollutantsUrban trees in Orlando removed an estimated 860 metric tons of air pollutants in one year including carbon monoxide (2% of total removal), nitrogen dioxide (8% of total removal), ozone (60% of total removal), particulate matter less than 10 microns (27% of total removal), and sulfur dioxide (3% of total removal). This is approximately 11.9 grams of air pollution per square meter of tree cover removed per year (Table 10). The main factor that can be managed in this removal ability is the leaf area (Nowak 1994), which can be improved by increasing the number and the size of evergreen trees, especially their canopies.
Rainfall InterceptionUrban tree canopies, understory shrubs and litter can intercept precipitation, and pervious soils can increase infiltration thereby positively affecting urban hydrology by reducing stormwater runoff (Xiao and McPherson 2002). Using a ratio of the contributions by the different tree types to canopy interception (Xiao and Mcpherson 2002) and as-suming a uniform distribution of precipitation over the city, we estimated tree-level interception of rainfall by broadleaf evergreen trees (3%), conifers (2.5%), broadleaf deciduous trees (0.2%), and palms 0.1%). Although tree-level intercep-tion of rainfall was 6%, landscape-level interception by the urban tree canopy was about 1.5%, since trees in Orlando account for 22% of the city’s land area. The runoff avoided by this interception of rainwater reduces stormwater runoff and the load on the city’s drainage system. This reduces the cost of controlling floods and treating polluted runoff (Xiao and Mcpherson 2002) because the maintenance and the need for construction of the stormwater retention and detection structures necessary to capture and treat this runoff is reduced. Additional interception occurs in un-derstory shrubs and litter, and these interception rates will vary according to rainfall characteristics, but this was not accounted for in this study. Overall, increasing tree cover and pervious surfaces in appropriate areas could enhance rainfall interception and infiltration.
5Orlando, Florida’s Urban and Community Forests and Their Ecosystem Services
Comparisons with Other Florida CitiesIn comparison to other Florida cities, Orlando had a lower average percent tree cover and average tree density than Gainesville, Tampa, and Pensacola but a greater average percent tree cover and average tree density than Miami-Dade (Table 11). However, carbon storage per hectare was greater in Orlando compared to Tampa and Miami-Dade (Escobedo and others 2010 [http://edis.ifas.ufl.edu/fr293]). An almost 35% plantable space indicates there is land avail-able for increasing urban forests. A survey of community leaders in Broward and Hillsborough Counties in Florida indicates that, despite hurricanes, many still favor increases in urban forests (Escobedo and other 2009a). Since larger trees tend to provide more environmental benefits (Nowak 1994), future efforts should aim at preserving larger trees in good condition.
RecommendationsUrban forest management plans and objectives should identify and address key ecosystem services and other economic, social, and environmental objectives that are relevant to the community, landowners, and managers. These objectives can also include specific management practices, tree selection, and design strategies, and even the development of ordinances that protect or enhance the urban forest resource. The appropriate levels, or targets, for specific ecosystem services need to be determined accord-ing to community needs and long-term strategic planning and sustainability in the City of Orlando.
Commonly used management practices include planting the “right tree in the right place.” This could be done by planting deciduous trees in the south and west aspects of homes for example, which decreases energy costs in summer and winter. Using the land-use cover map from this assessment and information on the available plantable space per land use category as a guide will allow land managers to identify areas where new tree planting are possible. Other practices include preserving contiguous areas with many large healthy trees, such as undeveloped forested areas inside the city, since this will maximize carbon storage and stormwater reduction benefits. Also, increased funding and/or educational initiatives could be employed to enhance landowner expectations and commu-nity involvement. Involving the community in developing management plans and ordinances can be used to addition-ally identify and avoid future problems. Finally, depending on the specific goal or ecosystem service of interest (for example, tree shade versus water quality), urban forests outside the city limits in the Greater Orlando and Orange County might also need to be considered. For example,
forests within the wildland-urban interface can improve water quality and quantity and provide wildlife habitat and recreation areas for people living within the city limits.
In conclusion, information on tree condition and size, frequency of exotic and invasive trees, and potential planting space can be used to establish management goals and develop city ordinances. Additional information from this publication such as the tree cover, composition, and benefits such as carbon storage and sequestration and rainfall interception could also be used to promote tourism in the city and support Orlando’s slogan, “The City Beautiful.”
Literature CitedAndreu, M.G., M.H. Friedman, and R.J. Northrop. 2009. The structure and composition of Tampa’s urban forest. FOR209. Gainesville: University of Florida Institute of Food and Agricultural Sciences. http://edis.ifas.ufl.edu/fr271
Breda, N.J.J. 2003. Ground-based measurements of leaf area index: a review of methods, instruments and current con-troversies. Journal of Experimental Botany 54: 2403-2417.
Dwyer J.F., E.G. McPherson, H.W. Schroeder, and R.A. Rowntree. 1992. Assessing the benefits and costs of urban forests. Journal of Arboriculture 18:227-234.
Escobedo, F., R. Northrop, M. Orfanedes, and A. Iaconna. 2009a. Comparison of community leader perceptions on urban forests in Florida. FOR 230. Gainesville: University of Florida Institute of Food and Agricultural Sciences. http://edis.ifas.ufl.edu/fr292
Escobedo, F., J. Seitz, and W. Zipperer. 2009b. Gaines-ville’s urban forest structure and composition. FOR214. Gainesville: University of Florida Institute of Food and Agricultural Sciences. http://edis.ifas.ufl.edu/fr276
Escobedo, F, S. Varela,C. Staudhammer, and B. Thompson. 2010. Southern Escambia County Florida’s urban forests. FOR 231. Gainesville: University of Florida Institute of Food and Agricultural Sciences. http://edis.ifas.ufl.edu/fr293
Escobedo, F., M. Pace, H. Mayer and J. Klein. 2011. Miami-Dade County’s urban forests and their ecosystem services. FOR 285. Gainesville: University of Florida Institute of Food and Agricultural Sciences. http://edis.ifas.ufl.edu/fr347

6Orlando, Florida’s Urban and Community Forests and Their Ecosystem Services
Florida Department of Environmental Protection. State-wide Land Use Land Cover. http://geodata.dep.state.fl.us/datasets/statewide-land-use-land-cover (Accessed May 8, 2018).
Florida Exotic Plant Pest Council. 2011. Florida Exotic Pest Plant Council ‘s 2011 List of Florida’s Invasive Plant Species. Florida Exotic Pest Plant Council. http://www.fleppc.org/list/11list.html (Accessed December 20, 2011).
Interagency Working Group on Social Cost of Carbon. 2010. Technical Support Document: Social Cost of Carbon for Regulatory Impact Analysis Under Executive Order 12866. United States Government. https://www.epa.gov/sites/production/files/2016-12/documents/sc_co2_tsd_au-gust_2016.pdf (Accessed May 8, 2018).
Nowak, D.J. 1994. Understanding the structure of urban forests. Journal of Forestry 92(10): 42–46.
Nowak, D.J., D.E. Crane, J.C. Stevens, R.E. Hoehn, J.T. Walton, and J. Bond. 2008. A ground-based method of assessing urban forest structure and ecosystem services. Arboriculture and Urban Forestry 34:347-358.
Riekerk, H., H.L. Gholz, D.G. Neary, L.V. Korhnak, and S.G. Liu. 1995. Evapotranspiration of pine-cypress flatwoods in Florida. Final Report to USDA Forest Service Southern Forest Experiment Station.
Seitz, J. and F. Escobedo. 2008. Urban forests in Florida: Trees control stormwater runoff and improve water quality. FR239. Gainesville: University of Florida Institute of Food and Agricultural Sciences. http://edis.ifas.ufl.edu/document_fr239
Xiao, Q. and E.G. Mcpherson. 2002. Rainfall interception by Santa Monica’s municipal urban forest. Urban Ecosystems 6:291-302.
Xiao, Q., E.G. Mcpherson, J.R. Simpson, and S.L. Ustin. 1998. Rainfall interception by Sacaramento’s urban forest. Journal of Arboriculture 24:235-244.

7Orlando, Florida’s Urban and Community Forests and Their Ecosystem Services
Table 1. Land cover by area in city, percent of city area, and number of plots measured.Land use Area (ha*) % of the area Number of plots
Transportation 3,860 12 28
Commercial and Institutional 5,490 17 29
Residential Housing 7,210 23 24
Parks and Agricultural 5,780 19 25
Forests 5,670 18 24
Wetlands 3,280 11 20
Total 31,290 100 150
*1 ha = 2.47 acres
Table 2. Selected ground cover in land use types in Orlando, Florida.Land use Area (ha*) % plantable space % impervious cover
Transportation 3,860 42.5 50.2
Commercial & Institutional 5,490 20.5 62.7
Residential Housing 7,210 33.7 50.6
Parks & Agricultural 5,780 77.9 3.4
Forests 5,670 20.6 0.0
Wetlands 3,280 4.5 0.4
*1 ha = 2.47 acres
Table 3. Urban forest density and cover in the different land uses in Orlando, Florida.Land use Number of trees Tree density (No./ha*) % tree cover Leaf area density (m2/ha)
Transportation 150,764 39 6.9 2,291
Commercial & Institutional 204,445 37 11.5 4,488
Residential Housing 450,957 63 29.2 10,099
Parks & Agricultural 474,228 82 7.5 3,389
Forests 6,179,686 1,090 60.5 44,281
Wetlands 11,861 4 1.1 66
No. = Number*1 ha = 2.47 acres
Table 4. Tree size class distribution per land use type in Orlando, Florida.Land use Number of trees Percent of trees per DBH* class(cm)
2.5-7.6 7.7-15.2 15.3-30.5 ≥30.6
Transportation 150,764 42.9 20.4 28.6 8.0
Commercial & Institutional 204,445 1.1 6.5 44.4 48.2
Residential Housing 450,957 12.6 25.2 33.8 28.1
Parks & Agricultural 474,228 52.1 30.3 14.6 3.2
Forests 6,179,686 38.0 22.8 26.5 12.8
Wetlands 11,861 - 100.0 - -
* DBH means Diameter at Breast Height.

8Orlando, Florida’s Urban and Community Forests and Their Ecosystem Services
Table 5. Distribution of tree condition classes in land use types of Orlando, Florida.Land Uses Tree condition class
% Excellent % Good % Fair % Poor
Transportation 93.9 2.0 2.0 2.0
Commercial & Institutional 88.2 7.5 4.3 -
Residential 78.6 10.1 3.7 7.6
Parks & Agricultural 81.1 10.4 4.9 3.7
Forests 75.7 10.9 5.4 7.8
Wetlands 100.0 - - -
Table 6. The 11 most frequent tree species in Orlando, Florida.Species common name Native status Percent Estimated Number
Bald cypress Nat* 25.9 1,936,757
Pond cypress Nat 19.3 1,440,730
Slash pine Nat 8.3 616,543
Chinese tallow Inv/Ex* 8.0 600,060
Swamp tupelo Nat 4.8 360,587
Redbay Nat 4.0 296,229
Longleaf pine Nat 3.9 290,388
Southern bayberry Nat 3.8 283,834
Red maple Nat 3.1 233,270
Sweetbay Nat 2.7 198,146
Live oak Nat 2.2 167,539
Total 86.0 6,424,083
* Nat = native; Inv/Ex = invasive exotic.
Table 7. The two most important species in each land use category.Land Use Species common
nameNative status % tree population
(a)*% leaf area (b)* Importance value
(a + b)
Transportation Live oak Native 8.16 34.98 43.14
Slash pine Native 34.69 7.47 42.16
Commercial and Institutional Bald cypress Native 21.92 40.98 62.90
Cabbage palm Native 41.47 12.80 54.27
Residential Housing Live oak Native 27.60 53.60 81.20
Laurel oak Native 7.56 12.50 20.06
Parks and Agricultural Bald cypress Native 53.26 26.64 79.90
Citrus Exotic 7.26 17.45 24.72
Forests Bald cypress Native 26.43 32.28 58.71
Pond cypress Native 23.31 17.64 40.96
Wetlands Live oak** Native 100.00 100.00 200.00
* These were estimates from the UFORE model. ** There are other trees in wetlands but live oak was the only tree species sampled in wetlands that had no standing water.
9Orlando, Florida’s Urban and Community Forests and Their Ecosystem Services
Table 8. Distribution of invasive and exotic tree species in the land use types of Orlando, Florida.Land Use Species Native status* Number
Transportation Mimosa Inv/Ex 3,077
Chinaberry Inv/Ex 3,077
Camphor tree Inv/Ex 12,307
Viburnum Inv/Ex 12,307
Chinese tallow tree Inv/Ex 6,154
Japanese privet Inv/Ex 3,077
Crape myrtle Ex 3,077
Commercial and Institutional Queen palm Inv/Ex 13,175
Camphor tree Inv/Ex 8,783
Chinese tallow tree Inv/Ex 8,783
Japanese privet Ex 4,392
Date palm Inv/Ex 11,202
Residential Housing Queen palm Inv/Ex 36,653
Chinese tallow tree Inv/Ex 17,050
Viburnum Inv/Ex 28,416
Citrus Ex 11,367
Crape myrtle Ex 11,367
Pygmy date palm Inv/Ex 11,367
Parks & Agricultural Citrus Ex 34,442
Chinese tallow tree Inv/Ex 5,740
Camphor tree Inv/Ex 6,001
Forests Orange wattle Ex 12,490
Chinese tallow tree Inv/Ex 562,333
*Inv = Invasive; Ex = exotic
Table 9. Carbon storage and sequestration in land use types in Orlando, Florida.Land Uses Carbon storage
per area (kg/ha)*Carbon sequestered per area
(kg/yr/ha)Net carbon sequestered per
area (kg/yr/ha)
Transportation 3,631.7 225.3 222.7
Commercial & Institutional 9,701.9 216.5 178.6
Residential Housing 28,271.7 899.0 755.3
Parks & Agricultural 5,764.2 425.3 403.9
Forests 70,695.3 4,620.1 4,561.7
Wetlands 75.2 15.2 15.1
*1000kg = 1 metric ton; 1ha = 2.47 acres

10Orlando, Florida’s Urban and Community Forests and Their Ecosystem Services
Table 11. Selected urban forest parameters in Orlando and other selected cities in Florida.Parameter City
Orlando Gainesville Tampa Pensacola area Miami-Dade
% Tree Cover 23.1 51 35 13 12
Average Tree Density (trees/ha) 203 242 257 315 83
Average Carbon Storage (tons/ha) 22.5 30.8 15.3 27.4 9.3
Table 10. Pollutant removal by urban forests in Orlando, Florida.Pollutant Pollution removal (g/m2 tree cover) Total pollution removal (metric tons)
Mean Min Max Mean Min Max % of total
CO 0.21 - - 15.37 - - 2%
NO2 0.97 0.39 1.44 69.94 27.99 104.09 8%
O3 7.10 1.65 9.35 514.14 119.44 676.31 60%
PM10 3.24 1.26 5.05 234.12 91.45 365.81 27%
SO2 0.41 0.16 0.67 29.60 11.50 48.70 3%
Total 11.93 863.17
Min = minimum Max = maximum