orwarn 2011 brown and caldwell common damage to ballantyne orwarn final.pdf · orwarn 2011 brown...
TRANSCRIPT

Seismic Service PresentationBrown and CaldwellORWARN 2011
September 28
Common Damage to Treatment Plants and
Systems; Analysis Examples
Don Ballantyne PEPrincipal, Degenkolb Engineers

Overview• Earthquake terminology and hazards
– Shaking– Liquefaction
• Common earthquake damage – Treatment plants and pump stations– Tanks– Pipelines
• Pipeline Design• System Risk Analysis Examples
– Portland– Seattle– Santa Clara Valley WD– Joint Water Commission WTP

• Magnitude – Richter or Moment Magnitude– Measure of energy release– 32 times more energy for increase of 1
• Peak ground acceleration (PGA) % of gravity
• Permanent ground deformation (PGD)
Earthquake Terminology

Pacific Northwest Earthquake Source Zones
1) Crustal Earthquakes (<15 miles deep) occur within the North American Plate on faults such as Seattle, Tacoma, and South Whidbey Island.
2) Deep Earthquakes (>40 miles deep) occur within the subducting Juan de Fuca Plate. Five M6 events in the last century. Nisqually Earthquake.
3) Cascadia Subduction Earthquakes occur about every 500 years at the boundary between the Juan de Fuca and North American plates. An M9 event occurred on January 26, 1700.

Liquefaction
San Fernando Earthquake,
1971
Philippines, 1990
Costa Rica, 1991
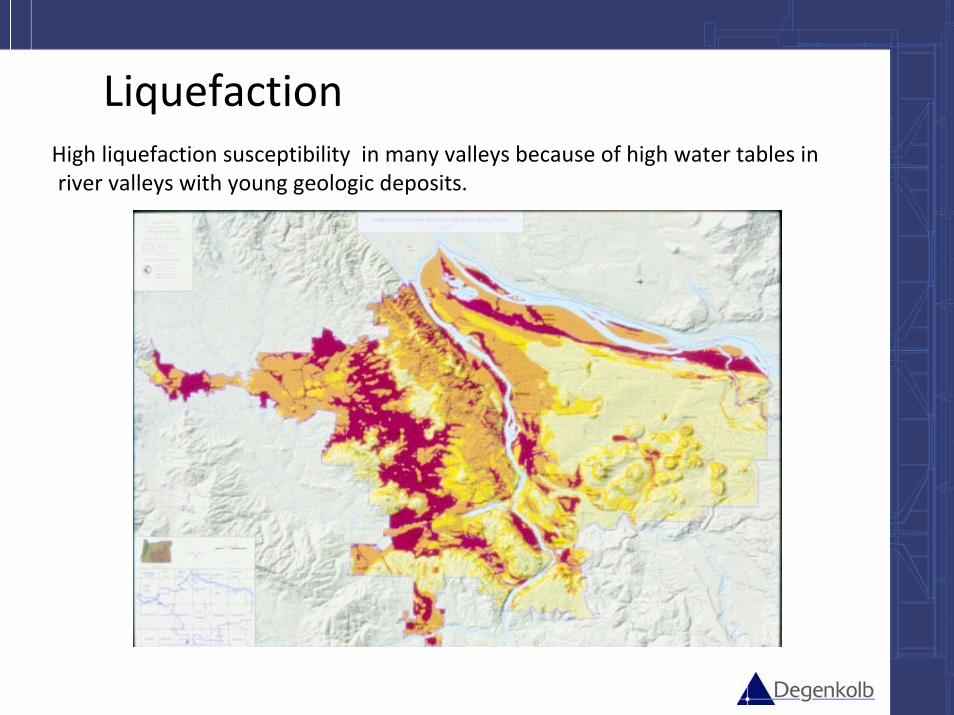
LiquefactionHigh liquefaction susceptibility in many valleys because of high water tables in river valleys with young geologic deposits.

Liquefaction/ Duration Effects
M8.1 Peru, August 2007170 second duration

Japan – 4/11/11. Liquefaction‐induced differential settlement around tanks – WTP in Kashima City. Water supply suspended to 2.23 million households requiring 2 months for restoration. Liquefaction caused damage at 4 WTPs and 1 WWTP. 18 WWTPs damaged mainly from tsunamis
Treatment Plants and Pump Stations

Kobe City Hall
Annex

10
Rinconada Treatment Plant

Kobe Japan 1995 –Higashinada WWTP Liquefaction
2 meters lateral and 1 meter vertical movement

Higashinada WWTP Liquefaction

Higashinada WWTP Liquefaction
Pile failure under end of aeration basin

ESSBIO WWTP Conception Chile, 2010 Soil Failure

Tank Damage –Elephant’ Foot Buckling

Tank Moves and Breaks Pipe
Landers 1992
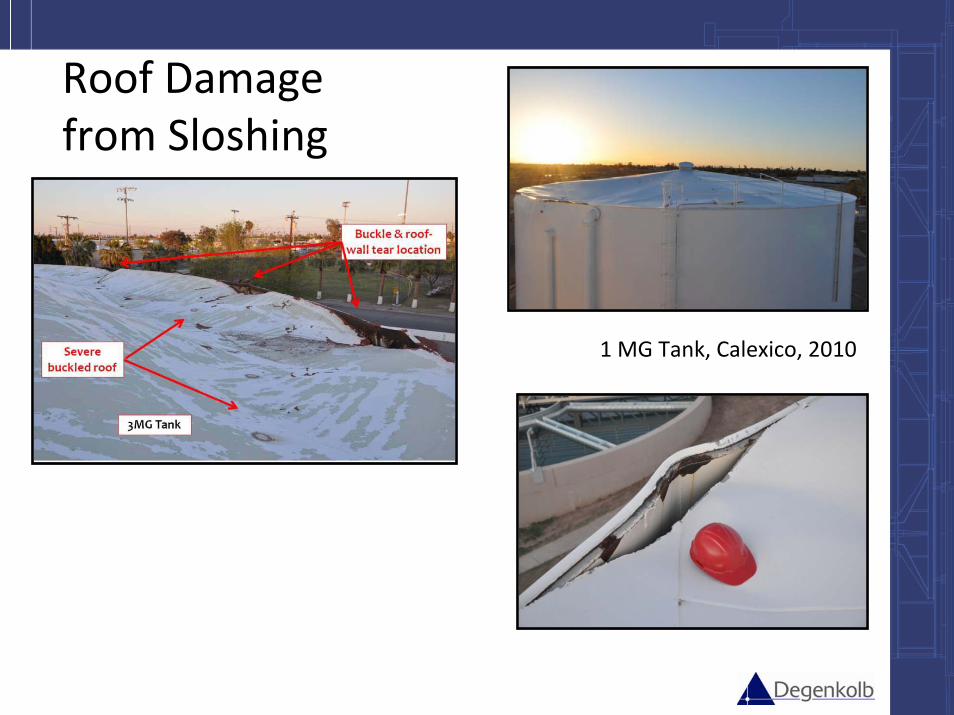
Roof Damage from Sloshing
1 MG Tank, Calexico, 2010

Elevated Tanks Collapse

Wire Wrapped Concrete Tanks

Pipe Failure Jensen WTP 81”
Raw Line
21
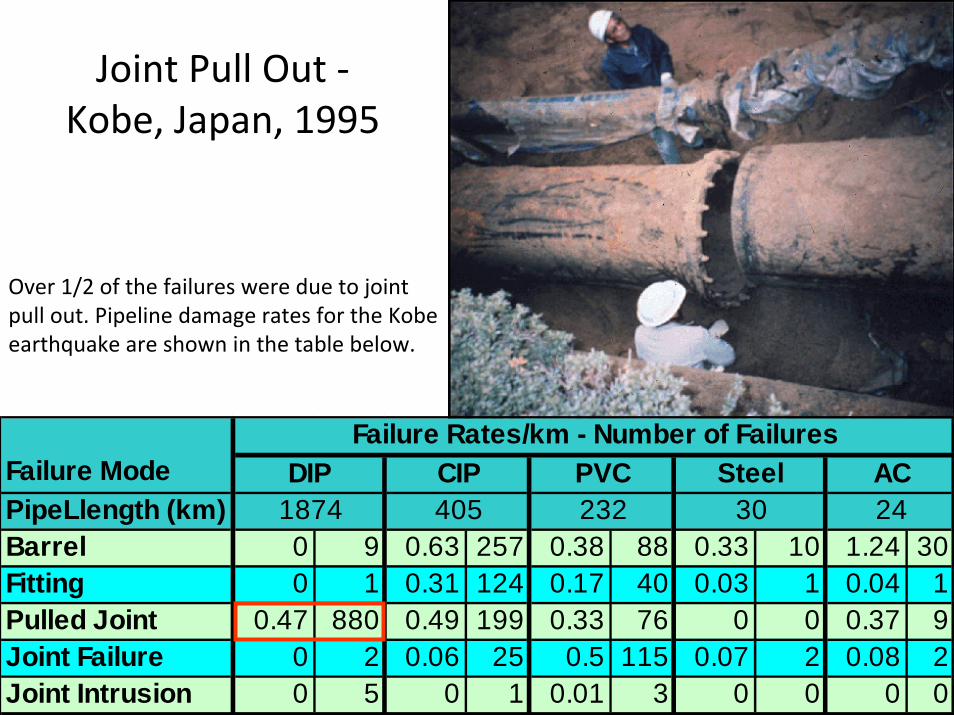
Joint Pull Out ‐Kobe, Japan, 1995
Over 1/2 of the failures were due to joint pull out. Pipeline damage rates for the Kobe earthquake are shown in the table below.
Failure Rates/km - Number of FailuresDIP CIP PVC Steel AC
PipeLlength (km) 1874 405 232 30 24Barrel 0 9 0.63 257 0.38 88 0.33 10 1.24 30Fitting 0 1 0.31 124 0.17 40 0.03 1 0.04 1Pulled Joint 0.47 880 0.49 199 0.33 76 0 0 0.37 9Joint Failure 0 2 0.06 25 0.5 115 0.07 2 0.08 2Joint Intrusion 0 5 0 1 0.01 3 0 0 0 0
Failure Mode
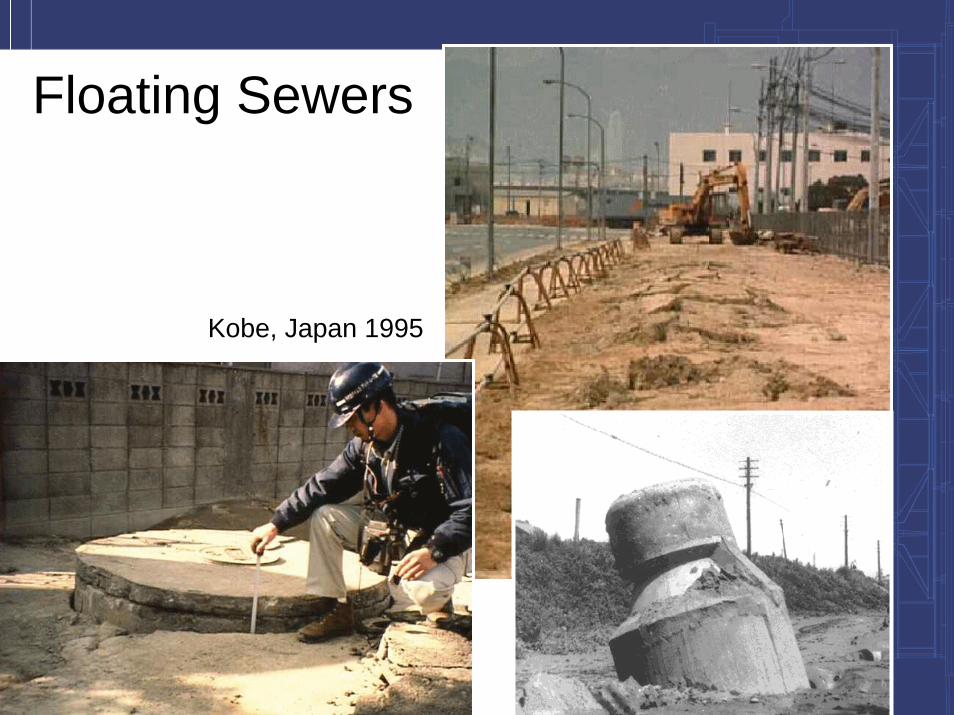
Floating Sewers
Kobe, Japan 1995

Floating Sewers
Japan 2011
Courtesy SEAW
Courtesy SEAW

Source: Tokyo University Report on Damage to the h b h
6 feet 4 inches (1.9m) of uplift

Pipe Characteristics Affecting Seismic Performance
• Ruggedness – material strength or ductility to resist shear and compression failures.
• Bending – beam strength or material ductility to resist barrel bending failures.
• Joint flexibility – joint and gasket design to allow elongation, compression, and rotation.
• Joint restraint – a system that keeps to joints from separating.

Relative Earthquake Vulnerability of Water Pipe
B&S - bell & spigot; RG - rubber gasket; R - restrained; UR - unrestrained
Material Type/Diameter
AWWA Standard Joint Type Ru
gged
-ne
ss
Bend
ing
Join
t Fl
exib
ility
Join
t Re
stra
int
Tota
l
(out
of 2
0)
Ductile Iron C1xx Series B&S, RG, R 5 5 4 4 18Polyethylene C906 Fused 4 5 5 5 19Steel C2xx Series Arc Welded 5 5 4 5 19Steel None Riveted 5 5 4 4 18Steel C2xx Series B&S, RG, R 5 5 4 4 18
Concrete Cylinder C300, C303 B&S, R 3 4 4 3 14Ductile Iron C1XX Series B&S, RG, UR 5 5 4 1 15PVC C900, C905 B&S, R 3 3 4 3 13Steel C2xx B&S, RG, UR 5 5 4 1 15
AC > 8" D C4xx Series Coupled 2 4 5 1 12Cast Iron > 8" D None B&S, RG 2 4 4 1 11PVC C900, C905 B&S, UR 3 3 4 1 11Concrete Cylinder C300, C303 B&S, UR 3 4 4 1 12
AC <=8" D C4xx Series Coupled 2 1 5 1 9Cast Iron <= 8" D None B&S, RG 2 1 4 1 8Steel None Gas Welded 3 3 1 2 9
Cast Iron None B&S, Rigid 2 2 1 1 6High Vulnerability
Low Vulnerability
Low/Moderate Vulnerability
Moderate Vulnerability
Moderate/High Vulnerability
BAD
GOOD

JWWA Standard/Seismic Joint
240 km of Japanese “S” joint had no failures
installed in the worst geotechnical conditions in
the Kobe earthquake.
JWWA standard requires pipe to be able to accommodate 1% strain in liquefiable soil areas.
Stops
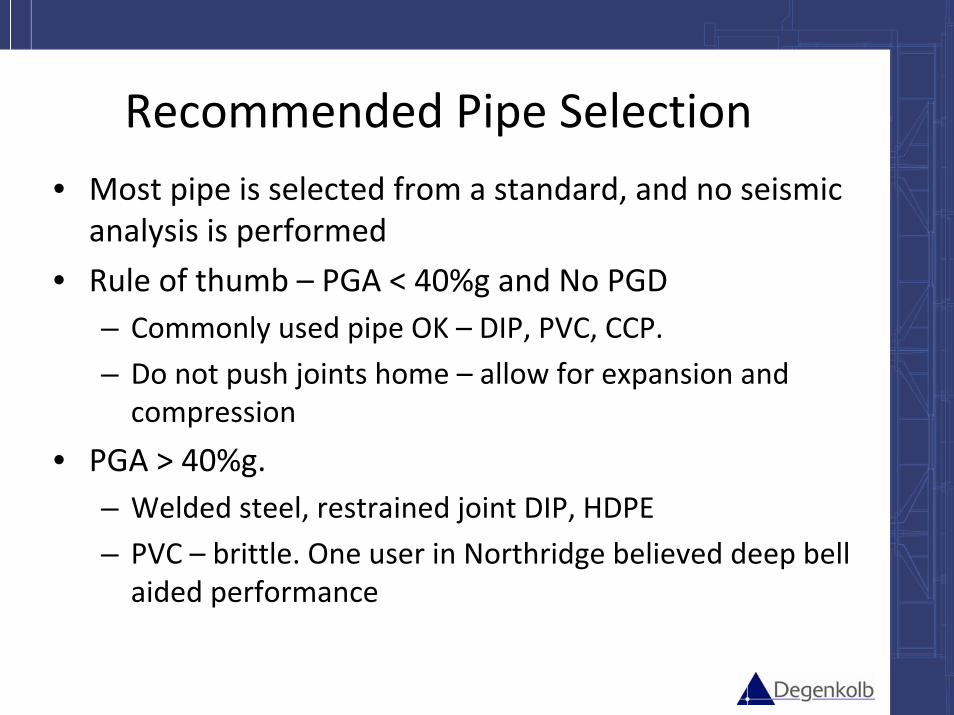
Recommended Pipe Selection• Most pipe is selected from a standard, and no seismic
analysis is performed
• Rule of thumb – PGA < 40%g and No PGD– Commonly used pipe OK – DIP, PVC, CCP.
– Do not push joints home – allow for expansion and compression
• PGA > 40%g. – Welded steel, restrained joint DIP, HDPE
– PVC – brittle. One user in Northridge believed deep bell aided performance

Recommended Pipe Selection ‐ continuedFor pipe subjected to PGD
• Continuous pipe– Steel with welded joints
• Avoid mortar lined as it can spall off when the pipe displaces
• Avoid concrete coating as it forces strain to the joints
– HDPE with fused joints
• Segmented pipe with restrained joints– Ductile iron
– Provide capability to extend/compress to relieve strain • Expansion couplings
• Position spigot in bell to accommodate expected extension or compression.

Design for PGD• Relocate the pipe to different corridor• Install below liquefiable layer
– Directional drilling or micro tunneling– Useful for river crossings
• Improve the soils to reduce liquefaction/lateral spread– Gravel columns– Soil mixing
• Support the pipe on piles (designed for lateral spread loads)
• Gravity sewers – hold‐downs to keep from floating using augers (such as used in the gas industry)

Design for PGD ‐ continued• Design the pipe to move, e.g., pulling it through the soil• Applicable to continuous & restrained joint pipe• Design layout to put pipe in tension• Minimize anchors to allow the pipe to slide through the
ground to distribute the strain– Bends and tees, valves, and valve boxes– Service connections – provide special flexible designs– Location next to hard points, such as other infrastructure
• Provide flexibility at connections to structures• Use shallow “V” trench and light backfill to allow
movement
• Wrap pipe in polyethylene – reduce soil/pipe friction
• Perform non‐linear analysis

Existing System Mitigation
• Replace existing pipe with low vulnerability pipe– Japanese are aggressively replacing CIP in poor soils.
– In U.S. wholesale replacement seems to be difficult to justify. A recent study was not able to demonstrate a benefit‐cost ratio > 1. Focus on critical lines.
• Slip line pipe with ductile material such as HDPE
• Provide a hardened backbone supplemented by a system of pumps– San Francisco and Vancouver have seismic resistant dedicated fire protection systems

• Provide redundancy from multiple sources and/or feeds to critical locations
• Install/maintain isolation valves aroundvulnerable areas
• Provide emergency response capabilities(pumps and hoses)
• Improve capability for quick restoration– Material and equipment availability
– Mutual aid
Existing System Mitigation ‐ continued
Pipeline Summary• Pipeline damage is the primary cause of water system
failure in earthquakes
• Earthquake shaking and PGD cause pipelines to fail
• Liquefaction, the most common form of PGD, typically occurs along water bodies and in alluvial deltas
• Cast iron pipe with brittle leaded joints is the most vulnerable pipe
• For new pipelines, ductile pipe systems provide the best reliability for PGD
• Existing system vulnerability can be mitigated by providing redundancy and enhancing the capability to provide emergency response

• Functionality (Level of Service)– Capacity/Probability of
achieving• Planning & Response
– Emergency planning– Emergency response – Near‐
Real‐Time Assessment– Restoration planning
• Financial– Direct losses– Insurance coverage
assessment– Post‐event financial planning– Reliability assessment for bond
sales
• Social Impacts/Indirect Losses– Outage time– Capacity during recovery– Business interruption – end
users– Resilient community goals
• Asset Management/Capital Improvements– Identification of deficiencies– Prioritization of capital
improvements– Benefit/cost analysis– Input to asset management
plan (annualized loses)
System Risk Analysis

Hazard Quantification
•Scenario based•Groundmotion
• PGA, PGV, Spectral
• Spectrum
•Liquefaction probability•Lateral spread PGD
Component Fragilities
•Published•Empirical•Test data•Analytical
Component Impacts
•% replacement cost•Functionality/ reduced capacity•Outage time
System Analysis•Direct losses•Capacity/ probability•Outage time•Capacity during restoration
Business Interruption/ Societal Losses
•Daily outage per capita $•% GRP•Business specific losses
System Risk Analysis Methodology

City Center
Mt. Hood
Bull Run WatershedColumbia
River
Powell Butte Reservoir
Groundwater System
Willamette River
Sandy RiverLandslide Area
l Bull Run Watershed - some components built in early 1900’s
l Transmission 3 – 40 km conduitsl Columbia Well Field – built in 1980’sl Treatment - chloramination, pH
adjustmentl Distribution – primarily cast iron
Portland Water Supply System

Portland Distribution System Assessment

Portland GIS/HAZUS- Analysis Input
0%
10%
20%
30%
40%
50%
60%
70%
80%
90%
100%
1% 10%
20%
30%
40%
50%
60%
70%
80%
90%
100%
Peak Ground Acceleration
Prob
abili
ty o
f Fai
lure
Pipe Material/Facility Information
Damage/Fragility FunctionsLiquefaction Susceptibility
Ground Motion Scenario -Subduction Earthquake

Pipe Material Joint Type K2Cast iron Cement 1Cast iron Rubber gasket 0.8Cast iron Mechanical restrained 0.7Welded steel Arc welded (large
diameter, non corrosive)0.15
Welded steel Rubber gasket 0.7Asbestos cement Rubber gasket 0.8Asbestos cement Cement 1Concrete w/Stl Cyl Welded 0.6Concrete w/Stl Cyl Cement 1Concrete w/Stl Cyl Rubber gasket 0.7PVC Rubber gasket 0.8Ductile iron Rubber gasket 0.5
Repair Rate/1000 feet = K2* (1.06) * PGD0.319
Repairs taken as 80% breaks and 20% leaks for PGD
ALA Repair Rate - PGD
0.000.501.001.502.002.503.003.504.00
0 10 20 30 40 50
PGD (inches)
Rap
air R
ate
(1,0
00 ft
) CIP
DIP
Steel
ALA Damage Relationships ‐ PGD

Importance Factors

Recommended mitigation of pipelines in liquefiable soils across/ along Willamette
River.

Supply System Reliability, 500‐Year Return Earthquake
0.00.10.20.30.40.50.60.70.80.91.0
50 100 150 200 250 300 350Flow (mgd)
Prob
abili
ty o
f sup
plyi
ng a
t le
ast "
x" m
gd
No Intertie
Intertie
Portland Earthquake Reliability
Supply System Reliability, 100‐Year Return Earthquake
0.500.550.600.650.700.750.800.850.900.951.00
50 100 150 200 250 300 350Flow (mgd)
Prob
abili
ty o
f sup
plyi
ng a
t le
ast "
x" m
gd
No Intertie
Intertie
Meets 100‐year return reliability of 145 mgd
Requires mitigation to meet 500‐year return reliability of 95 mgd
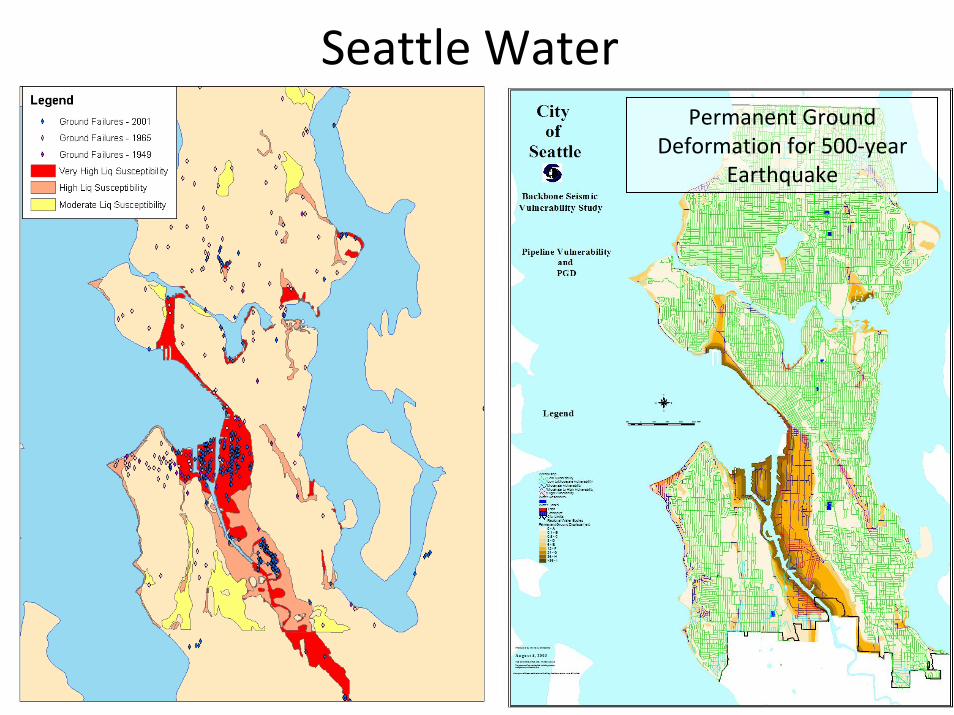
Permanent Ground Deformation for 500‐year
Earthquake
Seattle Water


Santa Teresa WTP
Santa Teresa WTP
VasonaPump Station
Rinconada WTP
Rinconada WTP
Penitencia WTP
Penitencia WTP
PachecoPump Station
Santa Clara Conduit
Cross Valley Pipeline
Calero Pipeline
Almaden Valley PL
VasonaValve Yard
CoyotePump Station
SFPUC IntertiePump Station
East Pipeline
West Pipeline
Snell Pipeline
Parallel E Pipeline
Milpitas Pipeline
CentralPipeline
PiedmontValve Yard
San LuisRes. Intake
Anderson/Coyote
South Bay Aqueduct
Bay DivisionPipeline 3&4
Calero Dam & Reservoir
Treated Water System
Raw Water System
WaterSources
Santa Clara Valley WD System Hydraulic & Reliability Models
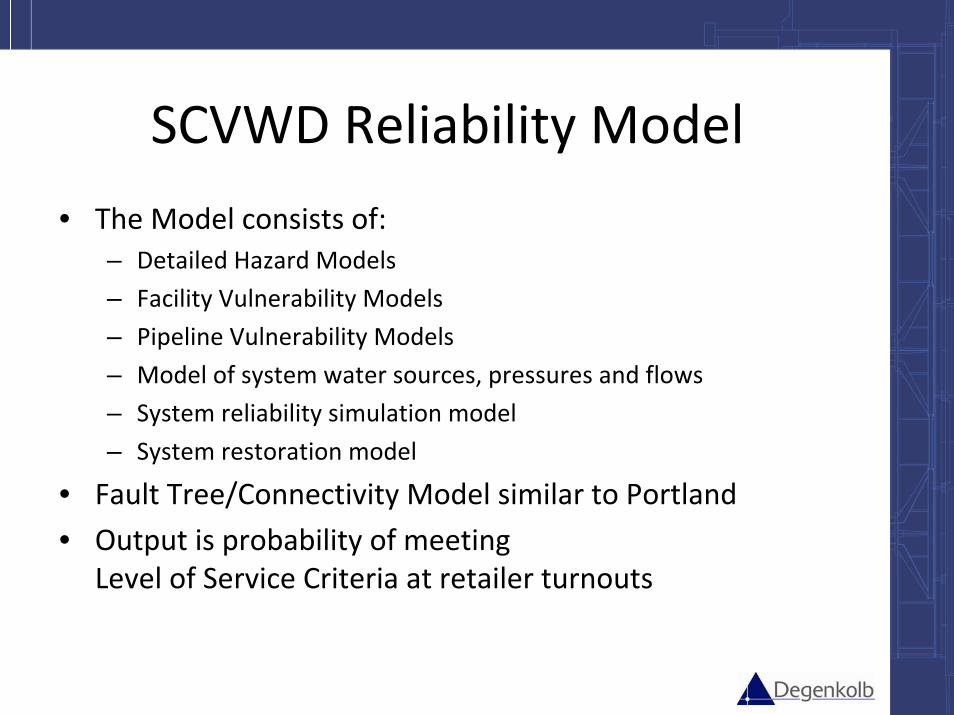
SCVWD Reliability Model
• The Model consists of:– Detailed Hazard Models
– Facility Vulnerability Models
– Pipeline Vulnerability Models
– Model of system water sources, pressures and flows
– System reliability simulation model
– System restoration model
• Fault Tree/Connectivity Model similar to Portland
• Output is probability of meeting Level of Service Criteria at retailer turnouts
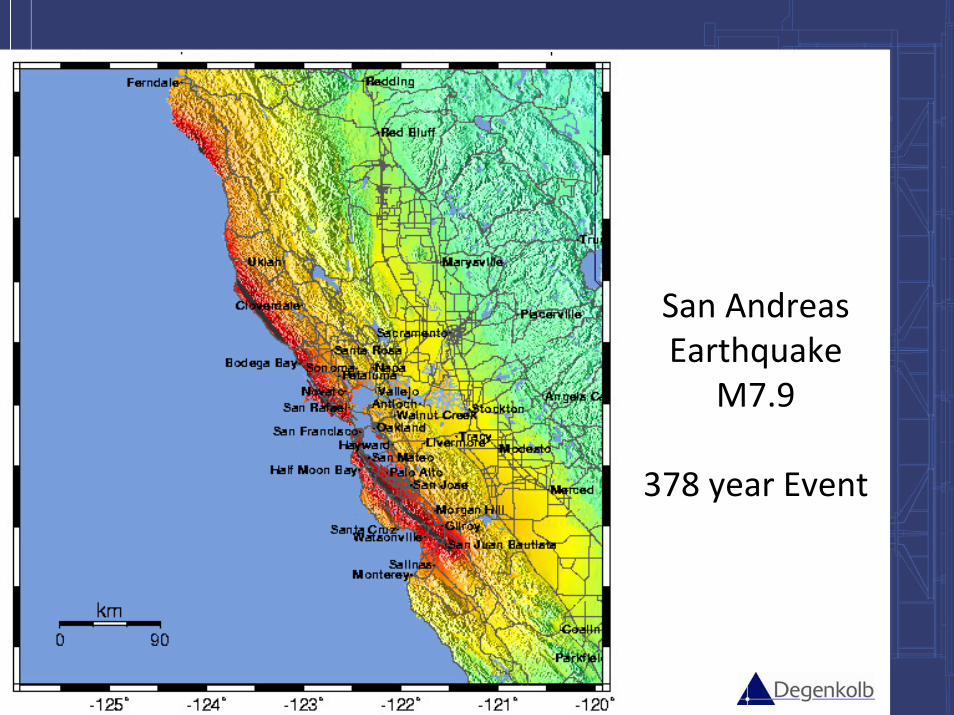
San AndreasEarthquake
M7.9
378 year Event

Controlled by Fault Rupture
Controlled by Liquefaction
Pipeline ModelsSan Andreas Earthquake

System Critical Facilities Status –San Andreas Earthquake ‐ Baseline Analysis

Recommendations Prioritized
Highest Benefit/Cost RatioNear proposed service level goalsReduces outage period for other eventsBalances cost and reliability
Portfolio 2 Recommended
Table 4.2 from SCVWD Water Infrastructure Reliability Project Report

JWC Water Treatment Plant
72 MGD plant
Built in 4 stages, 1974 through1998
Plant founded on liquefiable soils

Level of Service GoalsLOS Parameter
72-Year Event 475-Year Event 2,475-Year Event
Capacity
Peak Season Average Daily
Demand (ADD) (42 MGD)
Winter Average Daily Demand (WADD) (28
MGD)
Restoration Time
Immediately following event
Within 24 hrs
½ WADD for 3 days;WADD
for 7-14 days;Average
Annual DD for 60-90 days

Damage State Descriptions, Functionality and % Replacement
Description Function-ality
Restoration Cost (% of replacement
cost)
Light Minor cracking; minimal structural strength degradation; equipment secure;
Remains functional
5%
Moderate
gravity load bearing elements functional; some residual strength; no
out-of plane wall failures; many architectural systems damaged;
Not functional
30%
Severe
little residual structural strength; some structural failures but load bearing
members remain functional but near collapse; extensive equipment damage;
Not functional
100%
Evaluate baseline performance and 4 upgrade packages against 3 events –72, 475, and 2,475 events (ASCE 31‐03)

Design Upgrade Packages to Meet Levels of Service• Evaluated baseline performance for 3 earthquake levels (72, 475, 2,475 yr return)
• Identified WTP components required to meet level of service goals ‐ capacity
• Selected upgrades to meet performance criteria – continuous operation, restoration time
• Evaluate performance for smaller and larger earthquakes

Upgrade Packages to Meet Performance Objectives
Capital Cost ($ millions)Package Goal
Increment Total
1 Life Safety $2.86 $2.86
2A 72-yr $0.19 $3.05
2B On-site Power Generation
$3.00 $6.05
3 475-yr $17.75 $23.80
4 2,475-yr $0.10 $23.90

Economic AssessmentBenefits are the Avoided Losses
Direct damage
Equipment rental to emergency operation
Loss of revenue
Cost to provide emergency water until temporary operation is restored
Business interruption suffered by end‐use customers (secondary loss)
Avoided losses - the “Benefit” in the Benefit/Cost Ratio

Benefit‐Cost Summary (w/o BI)
BL LS 72A 72B 475 2,475

• Functionality (Level of Service)– Capacity/Probability of
achieving• Planning & Response
– Emergency planning– Emergency response – Near‐
Real‐Time Assessment– Restoration planning
• Financial– Direct losses– Insurance coverage
assessment– Post‐event financial planning– Reliability assessment for bond
sales
• Social Impacts/Indirect Losses– Outage time– Capacity during recovery– Business interruption – end
users– Resilient community goals
• Asset Management/Capital Improvements– Identification of deficiencies– Prioritization of capital
improvements– Benefit/cost analysis– Input to asset management
plan (annualized loses)
System Risk Analysis/Questions?