osmosis and the blistering of liquid applied … · osmosis and the blistering of liquid applied...
TRANSCRIPT

Osmosis and the Blistering of Liquid Applied Polyurethane Roof Membranes
Brian Hubbs, P.EngGraham Finch, MASc EITRob Bombino, PE
RDH Building Engineering Ltd. Vancouver, BC
BEST2 Portland April 2010

Page 2
Background
Cold-applied asphalt-modified polyurethane waterproofing membranes
Commonly used in inverted roofing and waterproofing assemblies Very common in the Pacific Northwest and Western CanadaHistorical performance problems often attributed to poor details and/or inadequate thickness.
- Concrete Pavers or Ballast
- Pedestals (Optional)
- Filter Fabric
- Extruded Polystyrene Insulation (2-4")
- Molded Polyethylene Drainage Matt (Optional)
- Cold-Applied Polyurethane Roof Membrane
- Concrete Slab (6-8")

Page 3
Background
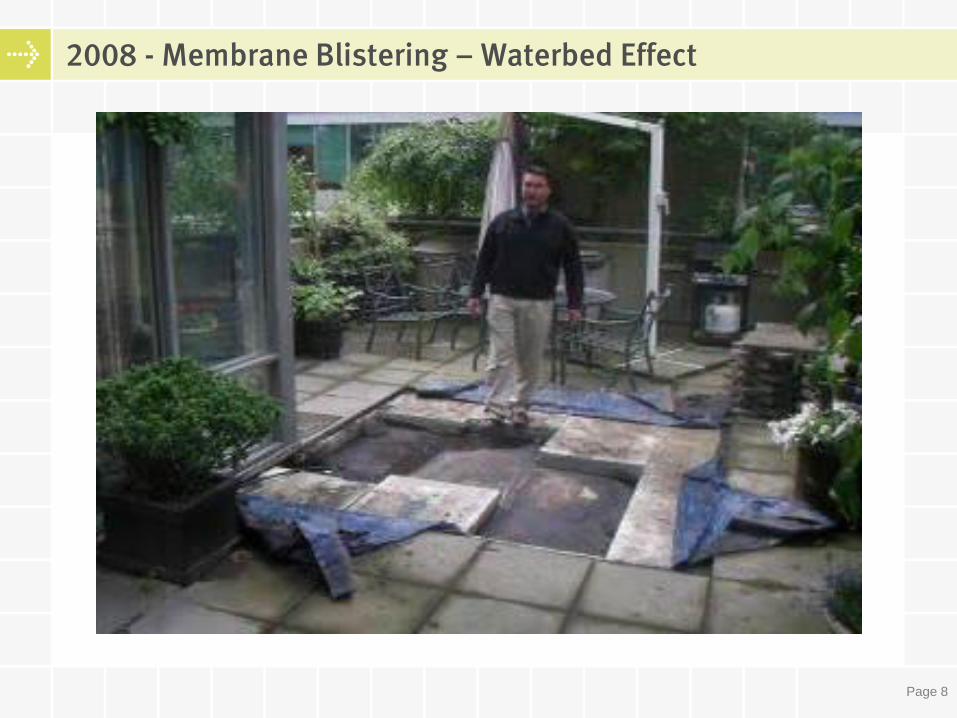
Maintenance Manuals and Condition AssessmentsWater Filled Blisters:• Low thickness• Filled with water under pressure• Blisters vary in size from small (12mm) to entire roof or deck areas• No obvious detail or discontinuity • Pavers and ballast floating in some locations• Blistering observed over both conditioned (interior) and
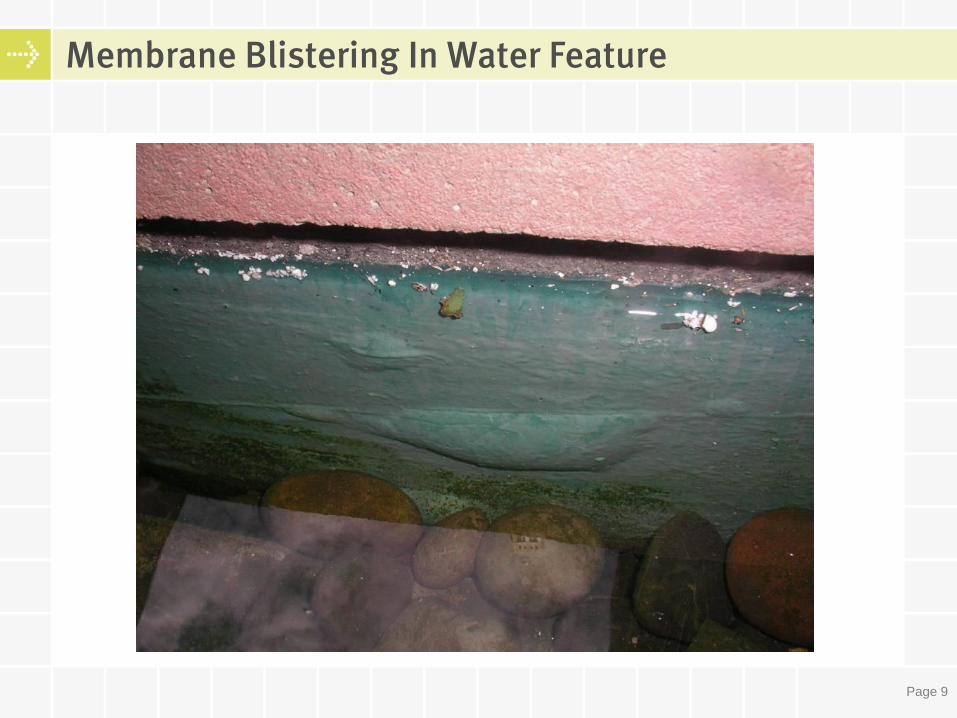
unconditioned space (Parkade)• Blisters also observed on vertical planter walls and in water features• Top of membrane almost always wet when insulation removed
Two Different membrane manufacturersBuilding age varied between 3 to 12 years

Page 4
2004 - Review of Roofs For Maintenance Manuals
Moderate Blistering

Page 5
Typical Blister

Page 6
Summary of Cut Tests
Minimum Thickness - CCMC Listing (1.5mm)
2004
10
12
12
2008
10
11

Page 7
2008 - Large Blister Lifting Pavers
Page 8
2008 - Membrane Blistering – Waterbed Effect
Page 9
Membrane Blistering In Water Feature

Page 10
Membrane Pore Structure – Membrane #1, 30 mil agedMembrane #1, 120 mil - NEW
Membrane #1, 30 mil - AGED
Page 11
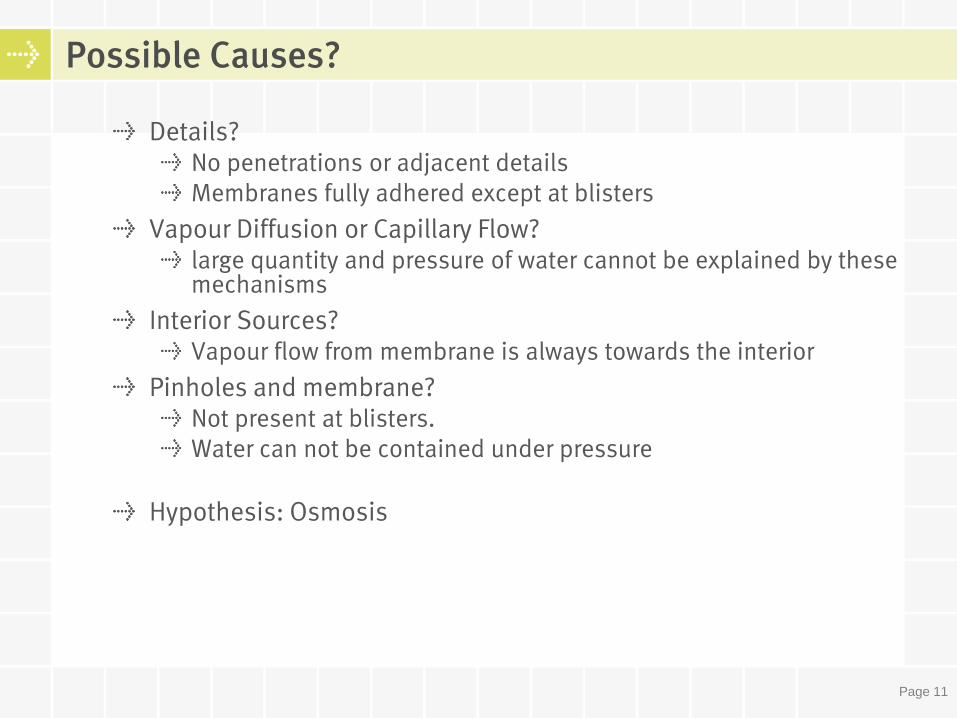
Possible Causes?
Details?No penetrations or adjacent detailsMembranes fully adhered except at blisters
Vapour Diffusion or Capillary Flow?large quantity and pressure of water cannot be explained by these mechanisms
Interior Sources?Vapour flow from membrane is always towards the interior
Pinholes and membrane?Not present at blisters.Water can not be contained under pressure
Hypothesis: Osmosis

Page 12
What is Osmosis ?
The flow of water across a semi-permeable membrane from low to high salt concentrationRequires 2 things:
Difference in salt concentrationmembrane permeable to water molecules

Page 13
Other Osmosis Research
Not well Documented by Building Industry Either rare or unreported
Other Industries:Fiberglass boat hulls• Uncured resins create a chemical osmotic cell leading to destructive
fiberglass hull-blistering
Epoxy Floor Coatings• Moisture from slabs on grade creates blisters beneath certain
membranes
Bridge decks• De-icing salts cause blistering of coatings

Page 14
Could it be Osmosis ? - Is the Blister Water Salty ?
Blister water extracted and tested Contains high concentrations of dissolved metals:
Sodium: naturally occurring within cement and aggregatesPotassium: Potash commonly used concrete additiveSilicon: naturally occurring within cement and aggregates
Calculated osmotic suction pressures 300-400 kPa
Water extracted from membrane blisters was under pressure As blisters grow the membrane delaminates
Rainwater from the top surface of the membrane contained no relevant concentration of minerals

Page 15
Vapour Permeance TestingAged 30-60 mil reinforced membranes removed from buildings
4 to 7 US perms (230 to 400 ng/Pa s m2) New membranes 90-150 mil membranes
0.3 to 2.0 US permsImportance of Inverted Wet Cup ASTM E96 Method
0
50
100
150
200
250
300
350
400
450
Dry Cup Wet Cup Inverted Wet
Cup
Vap
ou
r P
erm
ean
ce
ng
/Pa s
m2
Membrane #1 - 30 mils (Aged)
Membrane #2 - 60 mils (Aged)
Membrane #3 - 150 mils (New)
Impermeable Roof Membranes
(SBS, TPO, EPDM)0.00
0.10
0.20
0.30
0.40
0.50
0.60
Dry Cup Wet Cup Inverted
Wet Cup
Vap
or
Perm
eab
ilit
y
ng
/Pa s
m
Membrane #1 (Aged)
Membrane #2 (Aged)
Membrane #3 (New)
Impermeable Roof Membranes
(SBS, TPO, EPDM)6” Concrete
50% RH
Dry Wet Water
IWC
Looks like
an
inverted
roof ?
#1

Page 16
Impact of Membrane Permeance
Use WUFI to simulate initial saturation or wetting of Concrete surface
Polyurethane – top 10 mm of concrete
Polyurethane – entire slab
SBS mod-bit – entire slab
SBS mod-bit – top 10mm of concrete

Page 17
Laboratory Apparatus - Trial 5

Page 18
Proof of Concept – Commercial Reverse Osmosis Membrane
Initial flow rates of up to 15 L/m2/day
Per manuf. specs

Page 19
Measured Osmotic Flow – Control SamplesMembrane #1 - Controlled Salt Solutions - Osmotic Flow through Membrane
0
500
1000
1500
2000
25000
20
40
60
80
10
0
12
0
14
0
16
0
18
0
20
0
22
0
Days from start of test
Osm
oti
c F
low
th
rou
gh
Mem
bra
ne - g
/m2
Distilled Water - Control - No Osmotic Pressure
0.1 Molar Salt - 460 kPa Osmotic pressure
1.0 Molar Salt - 55,000 kPa Osmotic Pressure

Page 20
Osmotic Flow – Blistered Membranes & Blister Water
Polyurethane Membranes #1 & #2 - Average Osmotic Flow through Membrane
0
500
1000
1500
2000
0
10
20
30
40
50
60
70
80
90
10
0
11
0
12
0
13
0
14
0
15
0
# of Days
Osm
oti
c F
low
th
rou
gh
Me
mb
ran
e -
g/m
2
Membrane Sample #1 - 30 mil
Membrane Sample #2 - 60 mil#2
#1
Page 21
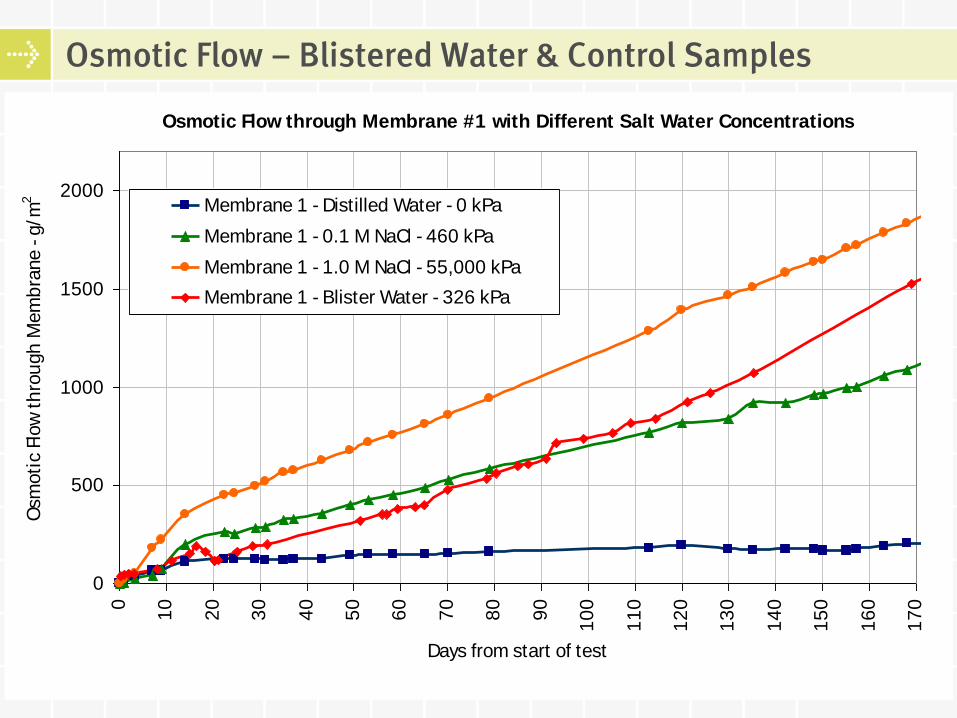
Osmotic Flow – Blistered Water & Control Samples
Osmotic Flow through Membrane #1 with Different Salt Water Concentrations
0
500
1000
1500
2000
0
10
20
30
40
50
60
70
80
90
10
0
11
0
12
0
13
0
14
0
15
0
16
0
17
0
Days from start of test
Osm
oti
c F
low
th
rou
gh
Mem
bra
ne - g
/m2 Membrane 1 - Distilled Water - 0 kPa
Membrane 1 - 0.1 M NaCl - 460 kPa
Membrane 1 - 1.0 M NaCl - 55,000 kPa
Membrane 1 - Blister Water - 326 kPa

Page 22
Concrete Primer & Membrane Testing – New Membrane (150 mils)
Effect of Membrane Primer Type - Polyurethane vs Epoxy
0
50
100
150
200
250
300
350
400
0 20 40 60 80 100 120 140 160 180 200
Time (days)
Osm
oti
c F
low
th
rou
gh
mem
bra
ne - g
/m2
Epoxy Primer on membrane - 0.5 Perms
Polyurethane Primer on membrane - 0.9 Perms
Membrane Cured during first 50
days of testing. Permeance initially
2x5 times higher. Osmotic Rate
affected
0.4 to 1.0 g/ m2/ day

0
100
200
300
400
500
0 20 40 60 80 100 120 140 160 180 200
Osm
oti
c Fl
ow
-g/m
2
# days from start of test
M1-1 - 30 mil blistered
M1-2 - 30 mil blistered
M2-1 - 60 mil blistered
M2-2 - 70 mil blistered
M3-1 - 120 mil new primed
M2-3 - 60 mil new
M3-2 - 100 mil new field applied
M4 - 100 mil new
Page 23
Osmotic Flow Rate – All Samples
Aged Samples
New Samples

Page 24
Results – Vapour Permeance and Osmotic Flow
0.0
1.0
2.0
3.0
4.0
5.0
6.0
7.0
M1
, B
1 (
Bli
ste
red
)
M2
, B
2 (
Bli
ste
red
)
M2
, B
3 (
Bli
ste
red
)
New
M1,
Un
pri
me
d
New
M1,
Ure
tha
ne
Pri
me
r
New
M1,
Ep
oxy
Pri
me
r
New
M2,
un
pri
me
d
New
M2,
wit
h A
lum
Pa
int
Co
ntr
ol
Me
mb
ran
es
0
1
2
3
4
5
6
7
8
9
10
11
12
M1
, B
1 (
Bli
ste
re
d)
M2
, B
2 (
Bli
ste
re
d)
M2
, B
3 (
Bli
ste
re
d)
Ne
w M
1,
Un
prim
ed
Ne
w M
1,
Ure
tha
ne
Prim
er
Ne
w M
1,
Ep
ox
y
Prim
er
Ne
w M
2,
un
prim
ed
Ne
w M
2,
wit
h A
lum
Pa
int
Co
ntr
ol
Me
mb
ra
ne
s
Permeance (US Perms) Osmotic Flow – (g/m2/day)
Pe
rme
an
ce (
US
Pe
rms
–H
igh
lo
w a
ve
rag
e)
Os
mo
tic
Flo
w –
(g/m
2/d
ay –
Hig
h L
ow
Ave
rag
e)
Blistered New
Blistered New
Is This Good Enough
to Eliminate Blistering ?
0.0
0.2
0.4
0.6
0.8
1.0
1.2
1.4
1.6
1.8
2.0
Ne
w M
3, U
np
rim
ed
Ne
w M
3, U
reth
an
e P
rim
er
Ne
w M
3, E
po
xy
Pri
me
r
Ne
w M
2, u
np
rim
ed
Ne
w M
2, w
ith
Alu
m P
ain
t
Ne
w M
3 -
Fie
ld A
pp
lie
d
Ne
w M
4 n
o p
rim
er
Ne
w M
4, p
rim
er
1
Ne
w M
4, p
rim
er
2
Co
ntr
ol M
em
bra
ne
s
6" C
on
cre
te S
lab
Page 25
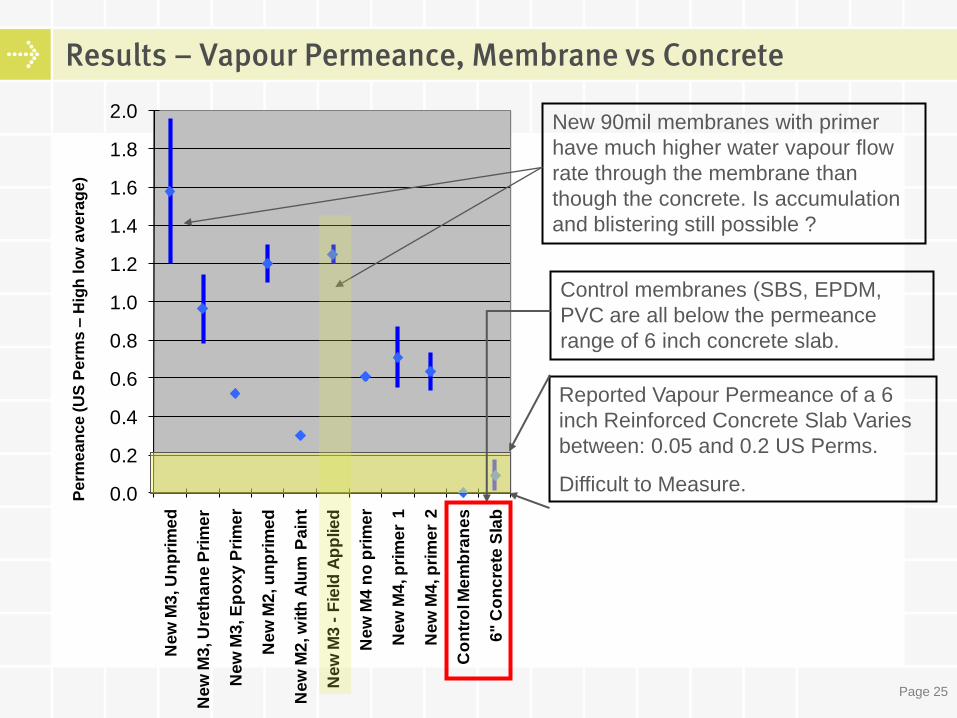
Results – Vapour Permeance, Membrane vs ConcreteP
erm
ean
ce (
US
Pe
rms
–H
igh
lo
w a
ve
rag
e)
Reported Vapour Permeance of a 6
inch Reinforced Concrete Slab Varies
between: 0.05 and 0.2 US Perms.
Difficult to Measure.
Control membranes (SBS, EPDM,
PVC are all below the permeance
range of 6 inch concrete slab.
New 90mil membranes with primer
have much higher water vapour flow
rate through the membrane than
though the concrete. Is accumulation
and blistering still possible ?
0.0
0.2
0.4
0.6
0.8
1.0
1.2
1.4
1.6
1.8
2.0
Ne
w M
3, U
np
rim
ed
Ne
w M
3, U
reth
an
e P
rim
er
Ne
w M
3, E
po
xy
Pri
me
r
Ne
w M
2, u
np
rim
ed
Ne
w M
2, w
ith
Alu
m P
ain
t
Ne
w M
3 -
Fie
ld A
pp
lie
d
Ne
w M
4 n
o p
rim
er
Ne
w M
4, p
rim
er
1
Ne
w M
4, p
rim
er
2
6" C
on
cre
te S
lab
…
Page 26
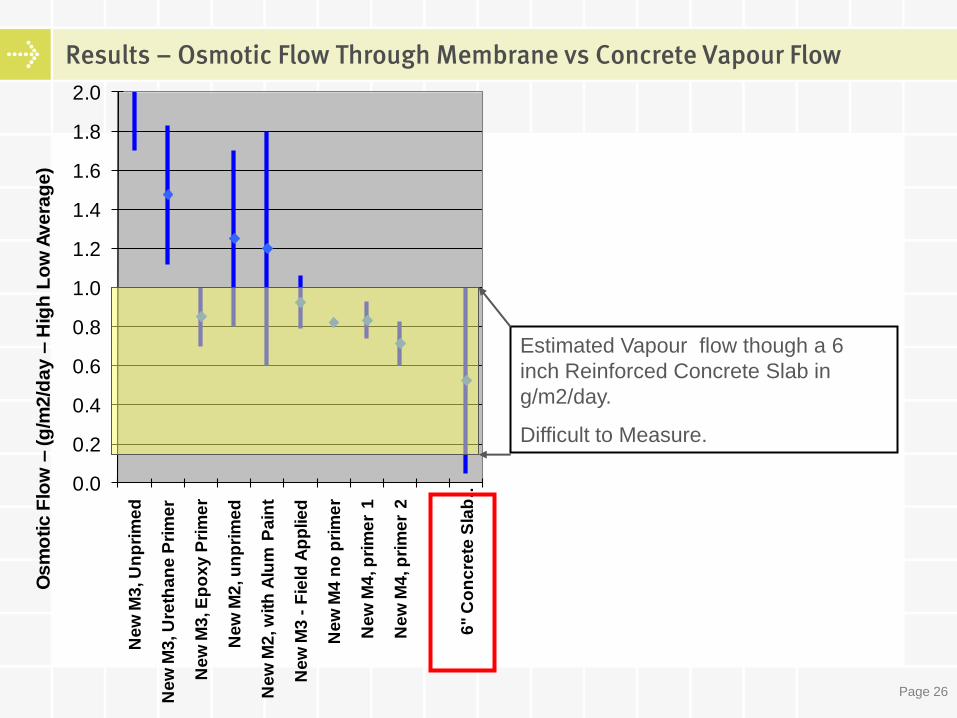
Results – Osmotic Flow Through Membrane vs Concrete Vapour Flow
Estimated Vapour flow though a 6
inch Reinforced Concrete Slab in
g/m2/day.
Difficult to Measure.
Osm
otic F
low
–(g
/m2/d
ay –
Hig
h L
ow
Avera
ge)
Page 27
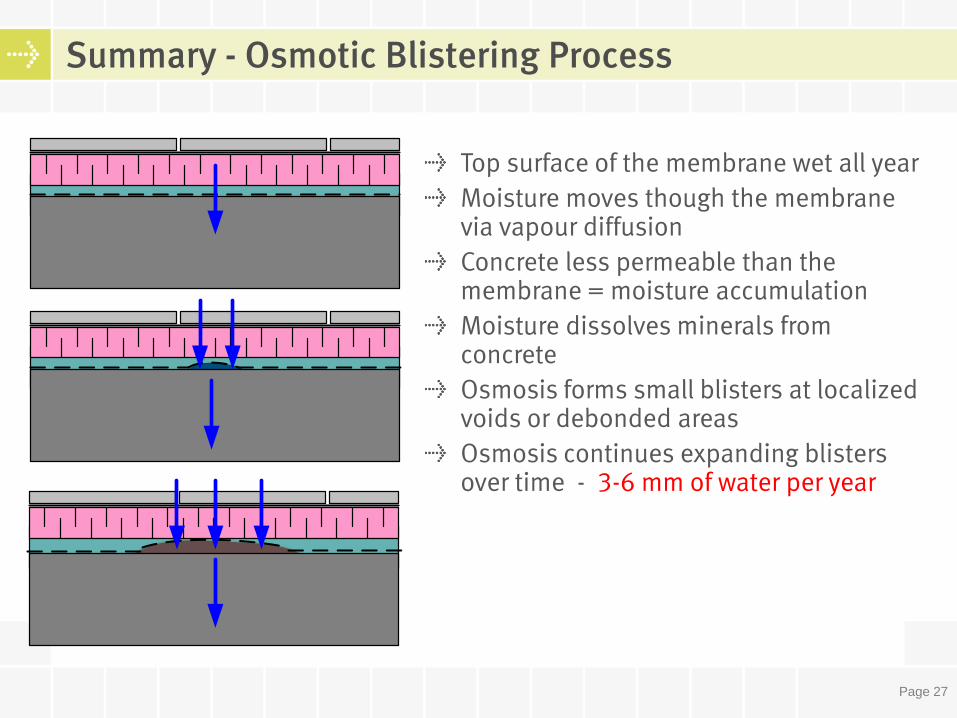
Summary - Osmotic Blistering Process
Water on top of membrane almost year round in inverted roof
assembly (poor slope = more water)
Concrete is initially at or close to saturation. Vapour diffusion
moves additional moisture though membrane to concrete
interface.
Concrete is less permeable than membrane and water begins to
saturate the concrete and accumulate at the membrane
interface.
Mineral ions dissolve out of concrete increasing the salt
concentration of the water beneath the membrane. Osmosis
begins and small blisters are formed.
Vapour diffusion to interior through concrete is relatively
slow compared to the rate transported by Osmosis.
Blisters grow and expand due to osmotic flow.
Top surface of the membrane wet all yearMoisture moves though the membrane via vapour diffusion Concrete less permeable than the membrane = moisture accumulation Moisture dissolves minerals from concreteOsmosis forms small blisters at localized voids or debonded areas Osmosis continues expanding blisters over time - 3-6 mm of water per year

Page 28
Is Osmotic Blistering a Regional Issue ?
• RDH Observations• West Coast of Canada• Pacific Northwest
• Discussions at NBEC 2009• Florida• Hawaii
• Discussions at RCI San Diego 2009
• Florida
• Appears to be more prevalent in temperate, humid climates

Page 29
Next Steps
Determine maximum safe permeance threshold for inverted roofing and waterproofing membranesDevelop Osmotic flow test method and determine acceptable maximum flow rates.Revise Applicable Standards (ASTM C836-00 and CAN/CGSB–37.58-M86) to specify:
Maximum allowable inverted wet cup permeance (0.1 ?)Maximum allowable osmotic flow rate (1 g/m2/day ??)
Further testing of membranes currently on marketNeed solutions or further research to confirm performance:

Page 30
Questions