osteopontin negatively regulates parathyroid hormone ... jbc 2008 m800005200v1.pdf · osteopontin...
TRANSCRIPT
1
OSTEOPONTIN NEGATIVELY REGULATES PARATHYROID HORMONE RECEPTOR SIGNALING IN OSTEOBLASTS
Noriaki Ono1,2,3, Kazuhisa Nakashima1,2, Susan R. Rittling4, Ernestina Schipani5, Tadayoshi Hayata1, Yoichi Ezura1, Kunimichi Soma3, David T. Denhardt6, Henry M.
Kronenberg5 and Masaki Noda1,2,7,8 From the 1. Department of Molecular Pharmacology, Medical Research Institute, 2. 21st Century Center of Excellence Program for the Frontier Research on Molecular Destruction and Reconstruction of Tooth and Bone, 2-3-10 Kanda-surugadai, Chiyoda-ku, 101-0062, Tokyo, Japan, 3. Orthodontic Science, Graduate School, Tokyo Medical and Dental University, 1-5-45 Yushima, Bunkyo-ku, 113-8510, Tokyo, Japan, 4. The Forsyth Institute, Boston, MA, USA, 5. Endocrine Unit, Massachusetts General Hospital and Harvard Medical School, Boston, Massachusetts, USA, 6. Department of Cell Biology and Neuroscience, Rutgers University, Piscataway, New Jersey, USA, 7. ABJS Integrated Action Initiative in JSPS Core to Core Program, 2. Hard Tissue Genome Research Center, Tokyo Medical and Dental University, Tokyo, Japan
Running title: Osteopontin Negatively Regulates PTHR signaling in Osteoblasts Address correspondence to: Masaki Noda, Yoichi Ezura and Kazuhisa Nakashima, Department of Molecular Pharmacology, Medical Research Institute, Tokyo Medical and Dental University, 2-3-10 Kanda-Surugadai, Chiyoda-ku, 101-0062, Tokyo, Japan, Tel: +81-3-5280-8066, Fax: +81-3-5280-8066, E-mail: [email protected]
Systemic hormonal control exerts its effect through the regulation of local target tissues, which in turn regulate upstream signals in a feedback loop. The parathyroid hormone (PTH) axis is a well-defined hormonal signaling system that regulates calcium levels and bone metabolism. To understand the interplay between systemic and local signaling in bone, we examined the effects of deficiency of the bone matrix protein osteopontin (OPN) on the systemic effects of PTH specifically within osteoblastic cell lineages. Parathyroid hormone receptor (PPR) transgenic mice expressing a constitutively active form of the receptor (caPPR) specifically in cells of the osteoblast lineage have a high bone mass phenotype. In these mice, OPN-deficiency further increased bone mass. This increase was associated with conversion of the major intertrabecular cell population from hematopoietic cells to stromal/osteoblastic cells and parallel elevations in histomorphometric and biochemical parameters of bone formation and resorption. Treatment with siRNA for osteopontin enhanced H223R mutant caPPR-induced cAMP-response element (CRE) activity levels by about ten-fold. Thus,
in addition to the well-known calcemic feedback system for PTH, local feedback regulation by the bone matrix protein OPN also plays a significant role in the regulation of PTH actions. Body homeostasis is maintained under a precise coordination of systemic hormones and local cytokines, and an imbalance in this regulation leads to pathological situations and disorders. Hormones affect multiple organs, and tight feedback systems exist between upstream and downstream organs. In addition, target organs by themselves are horizontally linked with each other, making the whole system versatile but complex. This makes it difficult to identify points of malfunction of the system in pathological situations. It is therefore necessary to identify a well-delineated system to unravel new layers of regulation in the hormonal control of homeostasis. The parathyroid hormone (PTH) axis is a well-defined hormonal system that maintains the calcium level in body fluid. Proper calcium levels are critical for numerous cellular activities. Parathyroid hormone is secreted from the parathyroid gland which senses small reductions in blood calcium levels
http://www.jbc.org/cgi/doi/10.1074/jbc.M800005200The latest version is at JBC Papers in Press. Published on April 16, 2008 as Manuscript M800005200
Copyright 2008 by The American Society for Biochemistry and Molecular Biology, Inc.
at Tokyo Ikashika D
aigaku on May 18, 2008
ww
w.jbc.org
Dow
nloaded from

2
(1). PTH acts systemically on targets such as kidney and bone to correct calcium levels in the blood. These target organs of PTH are themselves horizontally linked. For instance, PTH acts on the kidney to produce an active form of vitamin D, which in turn affects cellular activities in bone and increases calcium absorption from intestine (2-4). These direct and indirect (horizontal) actions of PTH eventually result in an increase in the blood calcium, which in turn reduces the release of PTH from the parathyroid gland to complete the cycle of these calcemic events. Furthermore, antagonists such as calcitonin counteract pro-calcemic actions of PTH and maintain the homeostasis of blood calcium levels (5).
In addition to this systemic role in maintenance of calcium levels in body fluids, PTH also modulates local events such as vasodilation (6) and accumulation of bone mass (7). In fact, PTH increases bone formation and is approved as a drug for severe osteoporosis, where there is solid evidence for its ability to reduce fracture risk (8-11). Understanding the mechanism of these anabolic actions of PTH in bone is valuable in the light of two major aspects. First, administration of PTH to patients is restricted to only two years, in part resulting from concern for development of osteosarcoma ,as found in pre-clinical studies (12). Currently, no rational counter-modalities are available for osteosarcoma. Secondly, fractures in patients treated with PTH still occurs, though the rate is significantly reduced (13). This fact indicates that PTH alone is not enough to fully prevent fractures associated with osteoporosis (14,15).
While antagonists of the systemic calcemic actions of PTH are relatively well studied, local antagonists of PTH action in bone are poorly understood. We have recently observed that the anabolic action of PTH at an optimal dosage was enhanced in mice deficient in osteopontin (OPN) (16), suggesting that OPN plays a role as a local antagonist. OPN is a major non-collagenous protein expressed by osteoblasts, and is primarily localized on bone surfaces and in the cement lines in bone. OPN accumulates in mineralized bone matrix,
supports attachment of bone cells to matrix surfaces, and inhibits hydroxyapatite crystal formation and growth. Furthermore, OPN functions as a cytokine acting on intracellular signaling pathways through its interaction with receptors. OPN is involved in a variety of cellular events such as proliferation, apoptosis and chemotaxis (17,18).
OPN-deficient mice are fertile: their litter size is normal and they develop normally. Bones and teeth of OPN-null mice are morphologically normal. Furthermore, osteoblasts and osteoclasts in vivo do not show major abnormalities in OPN-null mice (19). OPN-null mice exhibit impaired type 1 immunity to viral and bacterial infection (20), and are resistant to ovariectomy-induced (21) or unloading-induced bone loss (22).
Col1a1-caPPR transgenic (PPR-tg) express a constitutively active form of the PTH receptor specifically in osteoblasts under the control of the collagen alpha 1 promoter. These mice have increased trabecular bone volume and a decrease in cortical bone thickness (23). The transgenic mice show an increased number of osteoblast precursors and mature osteoblasts, as well as osteoclasts. Histological examination revealed an intense staining for OPN in trabecular bone, in these mice, suggesting a role for OPN in this system (24), but the nature of this role is not known. Since injection of PTH has systemic effects, and OPN is expressed by diverse cell types in the body, it is not clear at what level OPN may modulate PTH signaling. To address specifically the interaction of PTH and OPN in osteoblasts, we overexpressed the constitutively active PTH/PTHrP receptor mutant (H223R, caPPR) specifically in cells of the osteoblastic lineage in vivo in the absence of OPN.
Experimental Procedures
Generation of OPN-deficient Col1a1-caPPR transgenic mice - OPN-/- mice in an 129/(S1,S7) mixed background (19) and Col1a1-caPPR transgenic (PPR-tg) mice in FVB/N background were previously described (23). For
at Tokyo Ikashika D
aigaku on May 18, 2008
ww
w.jbc.org
Dow
nloaded from

3
Col1a1-caPPR transgenic mice, a 2.3kb fragment of the mouse Col1a1 promoter was ligated upstream to the entire coding region of human mutated Jansen type PTH/PTHrP receptor (HKrk-H223R), along with the cloning vector pcDNAI sequence that contains poly(A) signal. Generation of OPN-deficient Col1a1-caPPR transgenic mice was performed by crossing male hemizygous PPR-tg OPN+/- mice with female OPN+/- mice. Ten week old male littermates of four genotypes (PPR-wt/OPN-WT, PPR-wt/OPN-KO, PPR-tg/OPN-WT, PPR-tg/OPN-KO) were analyzed. All experiments were performed according to institutionally approved guidelines for animal welfare. Three-dimensional Micro-CT Analysis of Bone - Imaging of distal metaphyses of the femora was performed using a micro-CT apparatus (Scan Xmate-E090, Comscan Techno Co., Japan). 3D-microCT images were analyzed and quantified using an automated image analyzer (TRI/3D-BON, Ratoc System Engineering Co., Japan). Trabecular bone mass was examined in an area with its closest and furthest edges at 0.25 and 2.00 mm respectively from the growth plate in the distal ends of the femora. Histomorphometric Analysis of Bone - Calcein (1.6 mg/kg body weight) was injected intraperitoneally nine days and two days before sacrifice. Femora were embedded in methyl methacrylate (MMA) and 3-μm-thick sagittal sections of distal metaphyses and horizontal sections of midshaft regions were prepared. Calcein labeling was visualized using a confocal laser microscope (LSM510, Carl Zeiss, Germany) with an excitation wavelength of 488nm and a 550nm band-pass filter. Dynamic histomorphometry was conducted in the secondary spongiosa (1.0mm x 1.0mm); the cortical bone compartment was excluded from the analysis. von Kossa staining and Masson-Goldner staining were conducted as described elsewhere. Tibiae were decalcified in 10% EDTA, embedded in paraffin and 7-μm-thick saggital serial sections of proximal metaphyses were prepared. Tartrate-resistant acid phosphatase (TRAP) staining was used to quantify osteoclast number and osteoclast
surface. Serum Osteocalcin - Blood samples were collected at the time of sacrifice and serum was separated. Serum osteocalcin levels were determined by using IRMA kit (Immutopics, US). Urinary Deoxypyridinoline - Urine samples were individually collected in metabolic cages (Natsume, Japan) during the last 24 hours before sacrifice. Urinary deoxypyridinoline levels were measured by ELISA (DPD EIA kit, Metra Biosystems, US). Transfection and Luciferase assay - MC3T3-E1 osteoblastic cells were plated on 24-well plates at a density of 104 cells per well. Transfection of small interfering RNA (siRNA) and plasmid DNA was performed on Day 1 using Lipofectamine 2000 (Invitrogen, US). siRNA for OPN was manufactured by Ambion (Silencer Pre-designed siRNA, ID#150969 for mouse Spp1). Silencer Negative Control #1 siRNA was used as a control. Plasmid DNA containing human mutated PTH/PTHrP receptor (H223R) was previously described (25). pcDNA3.1 (Invitrogen, US) was used as a control. For reporter plasmids, pCRE-luc (PathDetect, Stratagene, US) reporter plasmid was used to measure cAMP-response element activity. Renilla luciferase reporter vector pGL4 (Promega, US) was used as an internal control. For transfection, each well received 0.2μg H223R plasmid DNA or control, 20pmol siRNA for OPN or control, 0.2μg pCRE-luc and 40ng Renilla luciferase plasmid combined with 1.0μl Lipofectamine 2000. The luciferase assay was performed using the Dual-luciferase Reporter Assay System (Promega) 48 hrs after transfection (Day3). Luciferase activity was measured using a luminometer (Lumat LB 9507, Berthold technologies). Quantitative Real-time PCR Analysis - Transfected cells were lysed three days after transfection in TRIzol reagent (Invitrogen, US). One micro gram of total RNA was treated with DNase I (Invitrogen, US) prior to reverse-transcription. First-strand cDNA was synthesized using SuperScript II transcriptase and oligo(dT)12-18 primers (Invitrogen). Quantitative real-time PCR analysis was carried
at Tokyo Ikashika D
aigaku on May 18, 2008
ww
w.jbc.org
Dow
nloaded from

4
out using an iCycler (Bio-rad, US) and iQ5 data analyzing software. The reaction was performed in a 25μl reaction mixture containing 2μl cDNA samples, 1μl sense and anti-sense primer mix (5μM) and 12.5μl iQ SYBR Green Supermix. The primer sequences were designed based on Beacon Designer (Bio-rad) program. PCR conditions were 95℃ for 15 seconds, 55℃ for 30 seconds and 72℃ for 30 seconds for 40-50 cycles. Statistical Analysis - Results are expressed as mean values ± S.D. Statistical evaluation was conducted based on ANOVA followed by Fisher’s protected least significant difference (PLSD) test after the Bartlett test. A p value of <0.05 was considered significant.
RESULTS Osteopontin-deficiency enhances the increase in trabecular bone mass induced by osteoblast-specific transgenic expression of caPPR
Osteopontin-deficiency by itself did not appreciably increase fractional trabecular bone volume (BV/TV), although there was a slight extension of the spongiosa into the diaphyseal area as reported previously (19) (Fig. 1a, PPR-wt/OPN-KO, sharp, #). Transgenic mice harboring the constitutively active mutant type of PTH/PTHrP receptor in osteoblastic cells (PPR-tg/OPN-WT) showed an increase in the trabecular bone in the adult mice, consistent with previous results (23). This increase was seen on 3D microCT images as the presence of dense trabeculation in the epiphyseal regions of the distal end of the femur (Fig.1a, PPR-tg/OPN-WT). 3D microCT images also revealed that transgenic expression of caPPR resulted in an extension of the trabecular bone towards the diaphyseal regions, where the : meshwork pattern of the trabecular bone was maintained (Fig. 1a; PPR-tg/OPN-WT, asterisk, *). These observations were comparable to those in mice treated with intermittent administration of PTH (23).
It has been reported that PPR-tg mice exhibit intense staining for osteopontin in trabecular bones, suggesting a role of OPN in
this system (24). As shown in Figure 1a (PPR-tg/OPN-KO), OPN-deficiency increased trabecular bone dramatically and resulted in a denser and finer meshwork patterning of the trabecular bone than that in PPR-tg mice (PPR-tg/OPN-WT). Dense trabecular bone patterning was observed not only in the epiphyseal region but also far into the diaphyseal region (Fig.1a, PPR-tg/OPN-KO, §). The increase in fractional bone volume (3D-BV/TV) due to caPPR expression in osteoblasts was significantly enhanced by osteopontin-deficiency (Fig. 1b). It was also observed that the increase in trabecular number (3D-Tb.N) induced by caPPR was further enhanced by OPN-deficiency (Fig. 1c). Changes in trabecular thickness (Fig. 1d) and trabecular separation in PPR-tg/OPN-WT mice (Fig. 1e) were not significantly altered by the absence of OPN.
We also observed a slight trabeculation of the cortical bone in PPR-tg mice (Fig.1a, open arrowhead). This trabeculation of the cortical bone was increased and extended in the absence of OPN (Fig.1a, thin arrows). In addition, the tapering of the metaphyseal region of the femur was reduced by the absence of OPN in transgenic mice expressing caPPR (Fig. 1a, open arrow).
These observations were consistently obtained in eight independent sets of littermates. These observations suggest that OPN prevents excessive trabecular bone formation caused by caPPR overexpression in cells of the osteoblastic lineage.
The BMD of PPR-tg/OPN-KO femora was significantly higher than that of PPR-wt/OPN-WT and PPR-wt/OPN-KO mice (Fig. 1f), and entire medullary cavity of the PPR-tg/OPN-KO femora was filled with cancellous bone as shown by two-dimensional micro-CT cross-sectional images made at the middle of the femur (Fig. 1i). Furthermore, the effects of PPR-tg/OPN-KO genotype were not exclusive to the appendicular skeleton. Craniofacial flat bones (calvariae) and axial bones (lumbar vertebrae) exhibited phenotypic characteristics consistent with those apparent in the appendicular skeleton (femur) as shown by
at Tokyo Ikashika D
aigaku on May 18, 2008
ww
w.jbc.org
Dow
nloaded from

5
three-dimensional micro-CT images of the 4th lumbar vertebrae and the calvariae (Fig. 1k,l).
Other phenotypic differences between the four mouse groups such as mobility, gait pattern, pain sensation, or any other noticeable manifestations were not obvious except for the slightly reduced body weight and smaller size in PPR-tg/OPN-KO mice (Fig. 1g and data not shown). Accordingly, the bones tended to be slightly shorter in the double mutant mice (Fig.1 h,j). Osteopontin-deficiency changes the cellular content of the bone marrow space in the presence of osteoblast-specific transgenic expression of caPPR
Hematoxylin & eosin staining of the tibiae from wild-type and osteopontin-deficient mice expressing caPPR transgene indicated that osteopontin-deficiency induced an alteration in the cellular composition in bone marrow. An increase in the number of mesenchymal cells was observed in the bone marrow spaces of PPR-tg mice and this change was strongly enhanced by the absence of OPN (Fig. 2b). Hematopoietic cells, which are recognized by their high nuclear-cytoplasmic ratio (Fig. 2b), were reduced in number in the bones of PPR-tg/OPN-KO mice (Fig. 2b, right panel), indicating that OPN-deficiency changed the cellular content of the bone marrow space in these animals. It appeared that the bone marrow space in PPR-tg/OPN-KO mice was occupied by predominantly mesenchymal cells. Higher magnification images of the cells adjacent to the trabecular bones showed thick lining cells on the trabecular bone surface in the PPR-tg/OPN-WT mice (Fig. 2b, open arrowhead) compared to thin lining cells in PPR-wt/OPN-WT or PPR-wt/OPN-KO mice (Fig. 2b, closed arrowheads). This alteration was further enhanced by the absence of OPN in the transgenic mice. To examine the nature of these stromal cells, we stained the sections for alkaline phosphatase activity. Compared to PPR-wt/OPN-WT or PPR-wt/OPN-KO, overexpression of caPPR under the control of Col1a1 promoter (PPR-tg/OPN-WT) resulted in strong staining for alkaline phosphatase activity
in cells on the trabecular bone surface (Fig.2c, red arrowheads). In these sections, most of the alkaline phosphatase-positive cells were closely attached to the trabecular bone (Fig. 2c, PPR-tg/OPN-WT). In contrast to PPR transgenic mice, osteopontin-deficiency in the presence of caPPR (PPR-tg/OPN-KO) resulted in numerous alkaline phosphatase-positive cells within the intertrabecular space in the bone marrow (Fig. 2c, asterisks). Some of these cells were attached to the trabecular bone surface, while others were found inside the intertrabecular space. These data indicated that osteopontin-deficiency in the presence of osteoblast-specific caPPR expression increased the number of alkaline-phosphatase positive osteoblastic cells to a level that almost fully occupied the intertrabecular space. The trabecular bone filling the bone marrow space of PPR-tg/OPN-KO mice was well-mineralized, at least based on analysis using von Kossa staining (Fig. 2d). Osteoid, stained red in Masson-Goldner staining, was only marginally increased in PPR-tg/OPN-KO mice (Fig. 2e). Therefore, though osteopontin-deficiency increased bone mass in the trabecular bone in the transgenic mice, the calcification state of the bone was similar to that of PPR-tg/OPN-WT mice. Despite the reduced marrow cavity, hematopoiesis was sustained in PPR-tg/OPN-KO mice. Red blood cell (RBC) counts, hemoglobin and hematocrit in peripheral blood (?) were equivalent between PPR-tg/OPN-WT and PPR-tg/OPN-KO mice, while white blood cell (WBC) counts and platelet counts for PPR-tg/OPN-KO mice were higher than those of PPR-tg/OPN-WT mice (Fig. 2f). Osteopontin-deficiency further enhances bone formation activity induced by osteoblast-specific transgenic expression of caPPR To address whether the absence of osteopontin affects bone formation in vivo in caPPR transgenic mice, we carried out histomorphometric analysis of the distal femora. Calcein injections yielded a consistent dual labeling in trabecular bone in PPR-wt/OPN-WT
at Tokyo Ikashika D
aigaku on May 18, 2008
ww
w.jbc.org
Dow
nloaded from
6
and PPR-wt/OPN-KO mice: this dual labeling was also observed in trabecular bone of PPR-tg/OPN-WT mice. However, in PPR-tg/OPN-KO mice, the calcein labeling was uneven, possible reflecting the crowded nature of the trabecular bone in these mice (Fig. 3a). Such an uneven pattern of calcein labeling is a characteristic feature of rapid cancellous bone formation. In wild-type bone, osteoblasts are laterally connected by several molecules including connexin and many osteoblasts work in concert to form bone in a planar fashion, resulting in the even pattern of calcein labeling seen in histological sections. Possibly, this lateral connectivity is impaired in the event of enhanced bone formation. This uneven pattern of labeling is also observed in the case of rapid cancellous bone formation after fracture.
As noted previously, PPR-tg mice exhibited an increase in mineral apposition rate (MAR) (Fig. 3a,b). Osteopontin-deficiency in the presence of caPPR did not further enhance the MAR (Fig.3b). Analyses of mineralizing surface per area (MS) showed an increase in PPR-tg mice and osteopontin-deficiency in the presence of caPPR further enhanced mineralizing surface per area (Fig. 3c). Bone surface per unit area (BS) was significantly increased in PPR-tg mice, and OPN-deficiency in these mice further increased the bone surface per area by about 80% (Fig.3d). Since bone surface (BS) was significantly higher in the double mutant mice (PPR-tg/OPN-KO), calculated values (MS normalized against BS) for MS/BS indicated a decrease in these animals (Fig. 3e). Similarly, bone formation rate normalized against the bone surface (BS) was somewhat reduced due to the large increase of the bone surface (BS) in the double mutant mice (PPR-tg/OPN-KO) (Fig. 3f). Total bone formation activities per unit area (1mm2) of the bone were higher in the double mutant mice than in PPR-tg mice (Fig.3g).
We further tested whether such elevated bone formation activities observed in histomorphometry (Fig. 3g) were reflected in biochemical parameters. Serum alkaline phosphatase activities were barely altered in PPR-tg mice. However, osteopontin-deficiency
in the presence of caPPR significantly (about three-fold) increased serum alkaline phosphatase levels compared to PPR-tg mice, reflecting the presence of high numbers of osteoblastic cells expressing alkaline phosphatase in the skeleton of these animals (Fig. 3h). Osteocalcin (OCN) levels were increased in PPR-tg mice. Similarly, osteopontin-deficiency in the presence of caPPR significantly enhanced serum osteocalcin levels (Fig. 3i). These observations indicated that osteopontin-deficiency further increased the number of cells producing these markers in caPPR transgenic mice, in which the levels of these markers were already higher than those of wild-type mice. Together, these results suggest that PTH signaling in bone forming cells is under negative control by the bone matrix protein, osteopontin.
Additionally, mineralized nodule formation of bone marrow cells and MTT assays of osteoblastic cells obtained from calvarial outgrowth cultures were performed (Fig. 3j,k). The results of these in vitro assays suggest that the contribution of cell-autonomous effects to the phenotype of the PPR-tg/OPN-KO mice is relatively minor. Osteopontin-deficiency further enhances bone resorption activity induced by osteoblast-specific transgenic expression of caPPR It was shown previously that PPR-tg mice exhibited an elevation in bone formation as well as bone resorption, with the balance favoring bone formation. This results in the net increase in bone mass (23). We further asked whether the absence of osteopontin in the local milieu alters osteoclastic activity in the transgenic mice.
The number of osteoclasts per area (N.Oc) based on histomorphometric analysis was increased in PPR-tg mice as noted before (Fig. 4a,b) (23). Because of the increase in bone surface per area, osteoclast number normalized against bone surface (N.Oc/BS) of PPR-tg mice was not altered compared to wild-type mice (Fig. 4c). The number of osteoclasts per area (N.Oc) was further enhanced by osteopontin-deficiency
at Tokyo Ikashika D
aigaku on May 18, 2008
ww
w.jbc.org
Dow
nloaded from

7
in the transgenic mice (Fig. 4a,b). Despite a further increase in the bone surface per area in PPR-tg/OPN-KO mice, osteoclast number normalized against bone surface (N.Oc/BS) was significantly increased in the double mutant mice (Fig. 4c), indicating that osteopontin-deficiency enhanced osteoclast number per unit surface in the transgenic mice (Fig. 4c). Osteoclast surface per bone surface (OcS/BS) was not significantly increased in PPR-tg mice (Fig. 4d). Osteopontin-deficiency tended to increase the levels of OcS/BS in the transgenic mice, though the difference was not statistically significant (Fig. 4d, p=0.056).
Despite the presence of elevated bone resorption activity, high bone mass was observed in PPR-tg/OPN-KO mice. This is possibly due to an even higher bone formation activity in these mice (Fig. 3). In terms of PPR-tg single mutant mice, high bone mass in spite of enhanced osteoclastic activity has been attributed to even more enhanced osteoblastic activity (23).
To examine whether these morphological observation could be reflected in biochemical aspects, we measured urinary excretion levels of deoxypyridinoline. Transgenic mice expressing caPPR under Col1a1 promoter had increased levels of deoxypyridinoline excretion in the urine,as compared to control mice (Fig.4e). Osteopontin-deficiency in the presence of caPPR further increased urinary deoxypyridinoline excretion (Fig.4e). These observations indicated that the presence of osteopontin suppressed the elevation of osteoclastic resorption activities caused by osteoblast-specific overexpression of constitutively active PTH/PTHrP receptor.
Additionally, bone marrow cells of the four genotypes were cultured and TRAP-positive multinucleated cells were developed ex vivo to investigate osteoclast differentiation. TRAP-positive cell development was similar among the four genotypes (Fig. 4f), suggesting that the ability of osteoclast precursors to differentiate is similar in cells from both genotypes. While we did not measure the actual resorptive activity levels of
these osteoclast-like cell cultures, the presence of TRAP strongly suggests that these cells are osteoclasts. Molecular convergence of OPN signaling and PPR signaling on cAMP-response element (CRE) activities in osteoblastic cells In order to address whether caPPR signaling inside the osteoblastic cell compartment is downregulated by osteopontin, we utilized MC3T3-E1 osteoblastic cells which expresshigh levels of OPN.. OPN mRNA levels were significantly reduced in MC3T3-E1 cells treated with OPN siRNA, compared to the cells treated with control siRNA (Fig. 5a). This suppression was observed regardless of the presence of caPPR (H223R) or control plasmid (Fig. 5a). In cotransfection experiments with a CRE-luciferase reporter, OPN siRNA did not affect luciferase activity significantly, while the forced expression of the H223R mutant form of PPR (caPPR) elevated luciferase activity about 30-fold. Suppression of OPN by siRNA further enhanced the luciferase activity up to 300-fold compared to control: i.e. 10-fold compared to the group where H223R plasmid and control siRNA were transfected (Fig. 5b). These observations indicated that at least one of the actions of OPN is to suppress the intracellular events triggered by the presence of constitutively active (H223R) PPR in osteoblastic cells.
DISCUSSION
Our discovery of OPN as a suppressor of the PTH signaling-induced increase in bone mass reveals more functional significance of this molecule. OPN shares some features with cytokines and has additional roles as an inhibitor of mineralization (19). In addition, OPN regulates signaling within osteoblastic cells, as caPPR-induced CRE-activities were enhanced by the reduction of OPN. Our data indicate that the effects of OPN-deficiency are, at least in part, due to the modulation of transcriptional events regulated by signaling downstream of PTH/PTHrP receptor.
It is intriguing that PTH has been
at Tokyo Ikashika D
aigaku on May 18, 2008
ww
w.jbc.org
Dow
nloaded from

8
shown to increase the niche activity for hematopoietic stem cells (HSC) (26,27), and that osteopontin has been reported as a suppressive component of HSC niche (24,28). However, the mechanism of OPN action on HSC and their niche has not been fully elucidated. Since osteoblastic cells are important components of the niche within the bone microenvironment, any reduction of osteoblastic function suppresses niche function (29). For instance, recent reports indicated that the sympathetic nervous system suppresses osteoblastic cells (30,31), and this suppression of osteoblasts results in the downregulation of the niche function for hematopoietic stem cells in the bone marrow microenvironment, releasing HSCs into the blood stream (29). The suppressive effects of OPN on bone formation discovered in our experiments could also be a part of the OPN functions that negatively regulate the hematopoietic stem cell niche. As noted before, the hematopoietic and bone systems share many components. OPN may be one of them, not only as a regulator of osteoblastic activities but also as a merging center for the signals from PTH and the HSC niche in the microenvironment.
For hematopoietic cells, OPN can either induce apoptosis or suppress proliferation (24,28). The absence of OPN may increase HSC numbers in response to stimulation by the presence of PPR-tg/OPN-KO osteoblasts. For instance, administration of PTH to OPN-null mice induced an increase in HSCs as compared to wild-type mice (24). However, The PPR-tg/OPN-KO double mutant mice did not develop anemia. They rather showed a significant increase of white blood cells (WBCs) and platelets compared to PPR-tg/OPN-WT mice (Fig. 2f). Therefore, although the marrow cavity was reduced due to an increase in trabecular bone mass, hematopoiesis is sustained at least under our experimental conditions. Although not appreciable in the histological sections, certain levels of HSCs may still exist in the marrow environment of the double mutant mice. In fact, we observed that the number of osteoclasts was increased in PPR-tg/OPN-KO mice (Fig. 4a,b,c), suggesting
that HSCs were not deficient in these mice. We showed previously that signals
generated by mechanical stress require the presence of OPN for their effects on bone formation (22). Since bone formation is affected by mechanical stress, and mechanical stress promotes proper bone formation and coupling of bone remodeling, OPN may link the PTH axis and mechanical signaling in bone.
OPN is produced by several tissue sources in both insoluble (ECM-associated) and soluble forms. These forms of OPN are part of the microenvironment in bone. OPN binds to several types of receptors including integrins and variant forms of CD44 (32) and therefore, the absence of OPN may alter more than one signaling pathway. CD44 is a cell surface glycoprotein that serves as an adhesion molecule, and its isoforms exert diverse functions. OPN-CD44 signal facilitates cell motility (33) and survival (34). Additionally, OPN increases CD44 expression in RAW264.7 leukemia cells (35), and the absence of OPN decreases surface expression of CD44 (18). Reduced CD44 signaling may impair migration and survival of hematopoietic cells, and this may contribute in part to the bone phenotype in the double mutant mice.
OPN was also shown to suppress proliferation and differentiation in a certain type of osteoblastic cells (36). We observed that stromal cells occupied the narrowed bone marrow space in PPR-tg/OPN-KO double mutant mice (Fig. 2b). Therefore, it would be possible that the in vivo environment could allow an increase in stromal cells and/or osteogenic precursors in the absence of OPN in the transgenic mice. In fact, in vitro assays for nodule formation, MTT and PCR analysis suggested that contribution of cell-autonomous effects in the cells taken from PPR-tg/OPN-KO mice were relatively minor (Fig. 3j,k and data not shown). Additionally, when bone marrow cells of the four genotypes were cultured and TRAP-positive multinucleated cells were developed ex vivo, TRAP-positive cell development was similar among the four genotypes (Fig. 4f). .These in vitro results suggest that the changes seen in osteoblasts
at Tokyo Ikashika D
aigaku on May 18, 2008
ww
w.jbc.org
Dow
nloaded from

9
and osteoclasts in PPR-tg/OPN-KO bone might not be due to cell-autonomous mechanisms, and in vivo environmental cues may play a role in causing the phenomena observed in our experiments.
The appearance of the high levels of cancellous bone in the diaphysis of PPR-tg/OPN-KO mice is similar to the early osteogenic phase observed following marrow ablation. This similarity is only at the early phase: in the marrow ablation model, the high turnover state in osteoblastic and osteoclastic remodeling phase in cancellous bone is transient, while that in the PPR-tg/OPN-KO mice is sustained, and is not followed by the osteoclastic remodeling phase of the injury model.
Abundant TRAP-positive osteoclasts in the double mutant mice resulted in an increase in remodeling in two distinct compartments. Osteoclastic resorption in the cortical bone leads to a trabeculation of cortex, while osteoclastic resorption in the cancellous bone leads to an increase in eroded surfaces on trabecular bone (Fig. 4a), suggesting that the osteoclasts are not ineffective at resorbing bone. In fact, osteoclasts are effective in both cancellous and cortical bone. The net increase in bone mass of PPR-tg/OPN-KO mice is not a reflection of osteoclast dysfunction, but is due to the fact that high turnover state of the bone metabolism in PPR-tg/OPN-KO mice is sustained and the balance between osteoblasts and osteoclasts is in favor of the former. The increase in the urinary deoxypyridinoline levels gives biochemical support for the notion mentioned above (osteoclasts are effective), and coincides with the morphological observations of increased eroded surface. The increase in serum levels of alkaline phosphatase and osteocalcin also supports the idea that high turnover state (with high levels of osteoblastic activities) is the predominant feature of bone in PPR-tg/OPN-KO mice.
It was previously reported that Col1a1-caPPR delays the transition from bone to bone marrow during postnatal growth and the formation of marrow cavities (37). Considering that OPN knockdown enhanced transcriptional events downstream to PTH/PTHrP receptor (Fig. 5) in osteoblastic cells, it is possible that OPN-deficiency further delayed the transition of bone to bone marrow in PPR-tg/OPN-KO mice.
Trabeculation of cortical bone was observed in microCT images in PPR-tg/OPN-KO mice. Patients exhibiting primary hyperparathyroidism show similar structural characteristics. Therefore this observation is significant and relevant along with the enormous increase in cancellous bone. However, the PPR-tg/OPN-KO mice did not develop spontaneous stress fractures in their long bones. High levels of bone mass and/or BMD may compensate for the reduction in the strength of the bone in these mice.
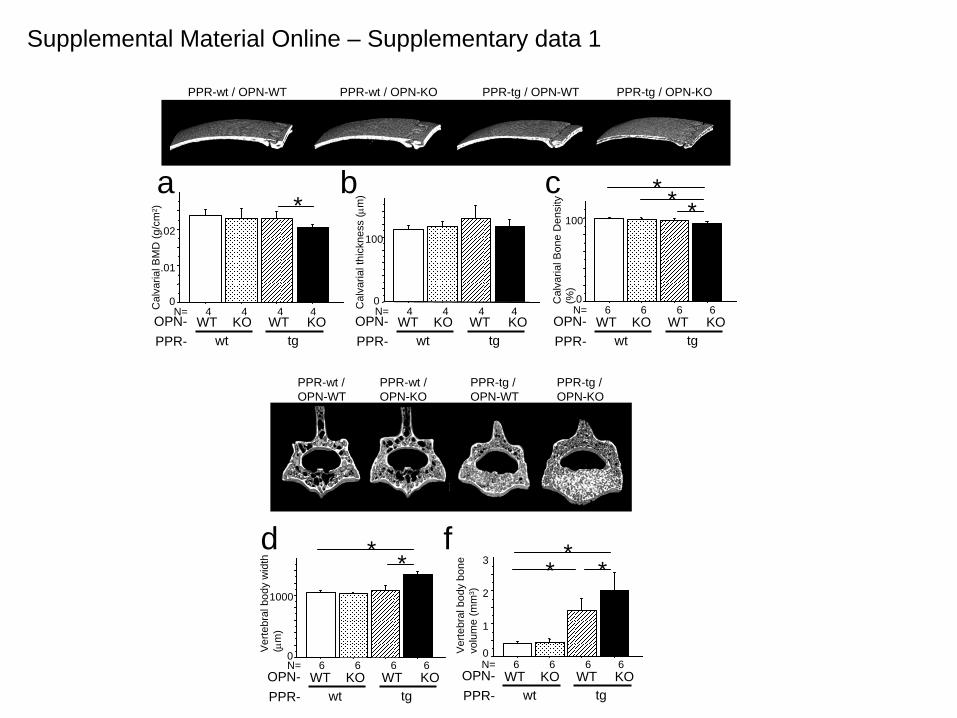
Calvarial bones and the lumbar vertebrae were also analyzed based on 3D-microCT images and DEXA (Fig.1 k,l and Supplemental Material online, Sup. Fig. 1). Calvarial bones recapitulated the cortical bone phenotype of PPR-tg/OPN-KO mice in that they showed a higher porosity, while vertebral bones recapitulated the cancellous bone phenotypes of PPR-tg/OPN-KO mice, showing a higher bone volume (Supplemental Material online, Sup. Fig. 1). These observations suggest that appendicular, axial and craniofacial bones were all affected in the double mutant mice. Overall, we have shown that the action of the systemic hormone PTH is regulated by feedback systems locally in bone where the bone matrix protein osteopontin plays an important suppressive role. Our observation will give rise to a widened concept with respect to multiple layers of feedback regulation in the PTH axis. Such multiple layers of regulation would render the body system to be versatile to adapt various environmental conditions.
REFERENCES
1. Marx, S. J. (2000) N Engl J Med 343(25), 1863-1875 2. Bell, N. H. (1985) J Clin Invest 76(1), 1-6
at Tokyo Ikashika D
aigaku on May 18, 2008
ww
w.jbc.org
Dow
nloaded from

10
3. DeLuca, H. F. (1973) N Engl J Med 289(7), 359-365 4. Avioli, L. V., and Haddad, J. G. (1984) N Engl J Med 311(1), 47-49 5. Rosenblatt, M. (1986) N Engl J Med 315(16), 1004-1013 6. Schluter, K. D., and Piper, H. M. (1998) Cardiovasc Res 37(1), 34-41 7. Dempster, D. W., Cosman, F., Parisien, M., Shen, V., and Lindsay, R. (1993) Endocr Rev
14(6), 690-709 8. Hodsman, A. B., Bauer, D. C., Dempster, D. W., Dian, L., Hanley, D. A., Harris, S. T.,
Kendler, D. L., McClung, M. R., Miller, P. D., Olszynski, W. P., Orwoll, E., and Yuen, C. K. (2005) Endocr Rev 26(5), 688-703
9. Jiang, Y., Zhao, J. J., Mitlak, B. H., Wang, O., Genant, H. K., and Eriksen, E. F. (2003) J Bone Miner Res 18(11), 1932-1941
10. Neer, R. M., Arnaud, C. D., Zanchetta, J. R., Prince, R., Gaich, G. A., Reginster, J. Y., Hodsman, A. B., Eriksen, E. F., Ish-Shalom, S., Genant, H. K., Wang, O., and Mitlak, B. H. (2001) N Engl J Med 344(19), 1434-1441
11. Rosen, C. J. (2004) Trends Endocrinol Metab 15(5), 229-233 12. Cinamon, U., and Turcotte, R. E. (2006) Bone 39(2), 420-423 13. Rosen, C. J., and Bilezikian, J. P. (2001) J Clin Endocrinol Metab 86(3), 957-964 14. Black, D. M., Greenspan, S. L., Ensrud, K. E., Palermo, L., McGowan, J. A., Lang, T. F.,
Garnero, P., Bouxsein, M. L., Bilezikian, J. P., and Rosen, C. J. (2003) N Engl J Med 349(13), 1207-1215
15. Vestergaard, P., Jorgensen, N. R., Mosekilde, L., and Schwarz, P. (2007) Osteoporos Int 18(1), 45-57
16. Kitahara, K., Ishijima, M., Rittling, S. R., Tsuji, K., Kurosawa, H., Nifuji, A., Denhardt, D. T., and Noda, M. (2003) Endocrinology 144(5), 2132-2140
17. Denhardt, D. T., and Noda, M. (1998) J Cell Biochem Suppl 30-31, 92-102 18. Denhardt, D. T., Noda, M., O'Regan, A. W., Pavlin, D., and Berman, J. S. (2001) J Clin
Invest 107(9), 1055-1061 19. Rittling, S. R., Matsumoto, H. N., McKee, M. D., Nanci, A., An, X. R., Novick, K. E.,
Kowalski, A. J., Noda, M., and Denhardt, D. T. (1998) J Bone Miner Res 13(7), 1101-1111 20. Ashkar, S., Weber, G. F., Panoutsakopoulou, V., Sanchirico, M. E., Jansson, M., Zawaideh,
S., Rittling, S. R., Denhardt, D. T., Glimcher, M. J., and Cantor, H. (2000) Science 287(5454), 860-864
21. Yoshitake, H., Rittling, S. R., Denhardt, D. T., and Noda, M. (1999) Proc Natl Acad Sci U S A 96(14), 8156-8160
22. Ishijima, M., Rittling, S. R., Yamashita, T., Tsuji, K., Kurosawa, H., Nifuji, A., Denhardt, D. T., and Noda, M. (2001) J Exp Med 193(3), 399-404
23. Calvi, L. M., Sims, N. A., Hunzelman, J. L., Knight, M. C., Giovannetti, A., Saxton, J. M., Kronenberg, H. M., Baron, R., and Schipani, E. (2001) J Clin Invest 107(3), 277-286
24. Stier, S., Ko, Y., Forkert, R., Lutz, C., Neuhaus, T., Grunewald, E., Cheng, T., Dombkowski, D., Calvi, L. M., Rittling, S. R., and Scadden, D. T. (2005) J Exp Med 201(11), 1781-1791
25. Schipani, E., Langman, C. B., Parfitt, A. M., Jensen, G. S., Kikuchi, S., Kooh, S. W., Cole, W. G., and Juppner, H. (1996) N Engl J Med 335(10), 708-714
26. Calvi, L. M., Adams, G. B., Weibrecht, K. W., Weber, J. M., Olson, D. P., Knight, M. C., Martin, R. P., Schipani, E., Divieti, P., Bringhurst, F. R., Milner, L. A., Kronenberg, H. M., and Scadden, D. T. (2003) Nature 425(6960), 841-846
27. Adams, G. B., Martin, R. P., Alley, I. R., Chabner, K. T., Cohen, K. S., Calvi, L. M., Kronenberg, H. M., and Scadden, D. T. (2007) Nat Biotechnol 25(2), 238-243
28. Nilsson, S. K., Johnston, H. M., Whitty, G. A., Williams, B., Webb, R. J., Denhardt, D. T., Bertoncello, I., Bendall, L. J., Simmons, P. J., and Haylock, D. N. (2005) Blood 106(4),
at Tokyo Ikashika D
aigaku on May 18, 2008
ww
w.jbc.org
Dow
nloaded from

11
1232-1239 29. Katayama, Y., Battista, M., Kao, W. M., Hidalgo, A., Peired, A. J., Thomas, S. A., and
Frenette, P. S. (2006) Cell 124(2), 407-421 30. Kondo, H., Nifuji, A., Takeda, S., Ezura, Y., Rittling, S. R., Denhardt, D. T., Nakashima, K.,
Karsenty, G., and Noda, M. (2005) J Biol Chem 280(34), 30192-30200 31. Elefteriou, F., Ahn, J. D., Takeda, S., Starbuck, M., Yang, X., Liu, X., Kondo, H., Richards,
W. G., Bannon, T. W., Noda, M., Clement, K., Vaisse, C., and Karsenty, G. (2005) Nature 434(7032), 514-520
32. Katagiri, Y. U., Sleeman, J., Fujii, H., Herrlich, P., Hotta, H., Tanaka, K., Chikuma, S., Yagita, H., Okumura, K., Murakami, M., Saiki, I., Chambers, A. F., and Uede, T. (1999) Cancer Res 59(1), 219-226
33. Zohar, R., Suzuki, N., Suzuki, K., Arora, P., Glogauer, M., McCulloch, C. A., and Sodek, J. (2000) J Cell Physiol 184(1), 118-130
34. Lin, Y. H., and Yang-Yen, H. F. (2001) J Biol Chem 276(49), 46024-46030 35. Marroquin, C. E., Downey, L., Guo, H., and Kuo, P. C. (2004) Immunol Lett 95(1), 109-112 36. Huang, W., Carlsen, B., Rudkin, G., Berry, M., Ishida, K., Yamaguchi, D. T., and Miller, T.
A. (2004) Bone 34(5), 799-808 37. Kuznetsov, S. A., Riminucci, M., Ziran, N., Tsutsui, T. W., Corsi, A., Calvi, L., Kronenberg,
H. M., Schipani, E., Robey, P. G., and Bianco, P. (2004) J Cell Biol 167(6), 1113-1122
FOOTNOTES
PTH, parathyroid hormone; PTHrP, parathyroid hormone related peptide; PPR, PTH/PTHrP receptor; caPPR, constitutively active PPR; OPN, osteopontin; CRE, cyclicAMP-response element; ALP, alkaline phosphatase; OCN, osteocalcin
FIGURE LEGENDS Figure.1 OPN-deficiency enhanced skeletal phenotypes of Col1a1-caPPR transgenic mice. Three-dimensional micro-CT images of the distal metaphyses of the femora (a) and bone volume / tissue volume (BV/TV, %) (b), trabecular number (#/mm) (c), trabecular thickness (μm) (d) and trabecular separation (e) in the secondary trabeculae. OPN-deficiency enhanced trabecular BV/TV and trabecular number of Col1a1-caPPR transgenic mice. (*, p<0.05, **, p<0.01, n=8 per group) (a: #, *, §, extension of trabecular bone regions in each mutant mice; open and thin arrow, tapering of the metaphyses in each mutant mice) BMD of the whole femora determined by DEXA (f), body weight (g) and the length of the femora (h) (n=6 per group). BMD of PPR-tg/OPN-KO femora were significantly higher than PPR-wt/OPN-WT and PPR-wt/OPN-KO mice because the entire diaphyseal medullary cavity was filled with cancellous bone. Body weights and femur lengths of PPR-tg/OPN-KO mice were significantly lower than all other mouse genotypes. Two-dimensional micro-CT cross-sectional images of the diaphysis at the middle of the femora (i), X-ray radiographs of the femora (j), Three-dimensional micro-CT images of the 4th lumbar vertebrae (k) and the calvariae (l). Effects of PPR-tg/OPN-KO genotype were not exclusive to the appendicular skeleton. Craniofacial flat bones (calvariae) and axial bones (lumbar vertebrae) exhibit phenotypic characteristics consistent with those apparent in the appendicular skeleton (femur). Figure.2 Histology of the metaphyses of the tibiae of the mutant mice. Hematoxylin & Eosin x20 (a) and x400 (b), alkaline-phosphatase (ALP) x400 (c), von Kossa (d) and Masson-Goldner (e) staining of wild-type (PPR-wt/OPN-WT), OPN-deficient (PPR-wt/OPN-KO), Col1a1-caPPR Tg (PPR-tg/OPN-WT) and OPN-deficient Col1a1-caPPR Tg (PPR-tg/OPN-KO) mice. PPR-tg/OPN-KO
at Tokyo Ikashika D
aigaku on May 18, 2008
ww
w.jbc.org
Dow
nloaded from

12
bone marrow was occupied with ALP-positive stromal cells, and their mineralization and osteoid volume were normal (b: open and closed arrowhead, lining cells on the bone surface; closed asterisk, cells in hematopoietic lineage; open asterisk, stromal/osteoblastic cells; c: red arrowhead, alkaline phosphatase positive cells on the bone surface; asterisks, alkaline phosphatase-positive cells within the intertrabecular space in the bone marrow). Complete blood cell count of the mutant mice (f) (RBC: red blood cell, WBC: white blood cell, Plt: platelet, MCV: mean corpuscular volume, MCH: mean corpuscular hemoglobin, MCHC: mean corpuscular hemoglobin concentration). Red blood cell (RBC) counts, hemoglobin and hematocrit were equivalent between PPR-tg/OPN-WT and PPR-tg/OPN-KO mice. White blood cell (WBC) counts for PPR-tg/OPN-KO mice were ~30%higher than PPR-tg/OPN-WT mice, and platelet counts for PPR-tg/OPN-KO mice were three-fold higher than PPR-tg/OPN-WT mice. Figure.3 Osteopontin-deficiency enhanced bone formation activities of Col1a1-caPPR transgenic mice. Dynamic histomorphometry of the trabecular bone in the distal metaphyses of the femora. Calcein was injected at 7-days interval, and undecalcified sections were scanned with confocal laser microscopy. PPR-tg/OPN-KO trabeculae exhibited an uneven pattern of calcein labeling (a). Mineral apposition rate (MAR) (b), mineralized surface per area (MS) (c), bone surface per area (BS) (d), mineralized surface per bone surface (MS/BS) (e), bone formation rate per bone surface (BFR) (f) and bone formation activity per area (BF activity per area) (g) (n=4 per group). Serum alkaline phosphatase (ALP) (h) (n=6 per group) and osteocalcin (OCN) level (i) (n=3 per group). OPN-deficiency enhanced systemic bone formation parameters of Col1a1-caPPR transgenic mice (*, p<0.05, **, p<0.01). Mineralized nodule formation of bone marrow cells (j). Bone marrow cell cultures were set up from marrow tissues from all four mouse genotypes, cultured under osteogenic conditions and assayed for nodule area per standard area well (n=3 for PPR-wt/OPN-WT, PPR-wt/OPN-KO, n=2 for PPR-tg/OPN-WT, n=1 for PPR-tg/OPN-KO mice). All marrow sources yielded roughly similar nodule areas though there was a progressive negative trend in the data (not statistically significant). MTT assays of osteoblastic cells (k) (n=3 per group). Osteoblastic cells were obtained from calvarial outgrowth cultures for all four mouse genotypes. These cells were cultured for 1 or 3 days and assayed for metabolic activity via MTT, and these values were used as a surrogate measure for cell number. Calvarial outgrowth-derived osteoblastic cell cultures from all mouse genotypes exhibited similar MTT conversion ratios (Day3 over Day1), indicating that similar numbers of cells proliferated during the culture. Figure.4 Osteopontin-deficiency enhanced bone resorption activities of Col1a1-caPPR transgenic mice. TRAP staining of decalcified sections of the mesial metaphyses of the tibiae (a). Osteoclast number per area (N.Oc, #/mm2) (b), osteoclast number per bone surface (N.Oc/BS, #/mm) (c) and osteoclast surface per bone surface (d) (*, p<0.05, **, p<0.01, n=4 per group). Urinary deoxypyridinoline (Dpyd) excretion level (n=6 per group) (e). OPN-deficiency enhanced not only the number but also the activity of osteoclasts of Col1a1-caPPR transgenic mice. TRAP-positive multinucleated cell development of bone marrow cells (f). Osteoclastic cell cultures were set up from bone marrow tissues derived from all four mouse genotypes (n=3 per group). Similar numbers of TRAP-positive multinucleated cells were generated in these cultures with no differences noted between genotypes. Figure.5 Osteopontin mRNA knockdown and constitutively active PTH/PTHrP receptor (H223R) synergistically enhanced cAMP-response element activity in MC3T3-E1 osteoblastic cells. MC3T3-E1 osteoblastic cells were plated on 24-well plates at a density of 104 cells per well and small interference RNA for OPN and H223R were cotransfected the following day. cAMP-response element (CRE) activity was evaluated by the luciferase assay and OPN mRNA expression was measured by
at Tokyo Ikashika D
aigaku on May 18, 2008
ww
w.jbc.org
Dow
nloaded from

13
quantitative real-time PCR after 48hrs. OPN mRNA expression was efficiently knocked down by siRNA in this experiment (a). As reference, control siRNA were used. cAMP-response element activity after cotransfection of OPN siRNA and H223R (b). H223R increased CRE activity by 32.4-fold. Cotransfection of OPN siRNA and H223R synergistically enhanced CRE activity by over 350-fold (*, p<0.05, **, p<0.01). Data represent three independent experiments.
at Tokyo Ikashika D
aigaku on May 18, 2008
ww
w.jbc.org
Dow
nloaded from

Figure 1
a****
BV /
TV (%
)
**
Tb.N
(#/m
m)
******
PPR-wt / OPN-WT
PPR-wt / OPN-KO
PPR-tg / OPN-WT
PPR-tg / OPN-KO b
cWT KO WT KOOPN-
wt tgPPR-
WT KO WT KOOPN-wt tgPPR-
0
20
40
60
0
10
0
25
50
***
WT KO WT KOOPN-wt tgPPR-
Tb.T
h(μ
m)
****
0
100
200
Tb.S
p(μ
m)
WT KO WT KOOPN-wt tgPPR-
d e
p=0.20
N= 8 8 8 8
N= 8 8 8 8 N= 8 8 8 8 N= 8 8 8 8
*#
§Fe
mor
al B
MD
(g/c
m2 )
0
.05
**
WT KO WT KOOPN-wt tgPPR-
N= 6 6 6 6
* *
0
10
20
30
Body
wei
ght (
g)
*
WT KO WT KOOPN-wt tgPPR-
N= 6 6 6 6
Fem
ur L
engt
h (m
m)
0
10
***
WT KO WT KOOPN-wt tgPPR-
PPR-wt / OPN-WT
PPR-wt / OPN-KO
PPR-tg / OPN-WT
PPR-tg / OPN-KO
PPR-wt / OPN-WT
PPR-wt / OPN-KO
PPR-tg / OPN-WT
PPR-tg / OPN-KO
f g h
N= 6 6 6 6
i j
PPR-wt / OPN-WT PPR-wt / OPN-KO PPR-tg / OPN-WT PPR-tg / OPN-KOl
PPR-wt / OPN-WT
PPR-wt / OPN-KO
PPR-tg / OPN-WT
PPR-tg / OPN-KOk
a****
BV /
TV (%
)
**
Tb.N
(#/m
m)
******
PPR-wt / OPN-WT
PPR-wt / OPN-KO
PPR-tg / OPN-WT
PPR-tg / OPN-KO b
cWT KO WT KOOPN-
wt tgPPR-WT KO WT KOOPN-
wt tgPPR-
WT KO WT KOOPN-wt tgPPR-
WT KO WT KOOPN-wt tgPPR-
0
20
40
60
0
20
40
60
0
10
0
10
0
25
50
***
WT KO WT KOOPN-wt tgPPR-
WT KO WT KOOPN-wt tgPPR-
Tb.T
h(μ
m)
****
0
100
200
Tb.S
p(μ
m)
WT KO WT KOOPN-wt tgPPR-
WT KO WT KOOPN-wt tgPPR-
d e
p=0.20
N= 8 8 8 8
N= 8 8 8 8 N= 8 8 8 8 N= 8 8 8 8
*#
§Fe
mor
al B
MD
(g/c
m2 )
0
.05
**
WT KO WT KOOPN-wt tgPPR-
WT KO WT KOOPN-wt tgPPR-
N= 6 6 6 6
* *
0
10
20
30
Body
wei
ght (
g)
*
WT KO WT KOOPN-wt tgPPR-
WT KO WT KOOPN-wt tgPPR-
N= 6 6 6 6
Fem
ur L
engt
h (m
m)
0
10
***
WT KO WT KOOPN-wt tgPPR-
WT KO WT KOOPN-wt tgPPR-
PPR-wt / OPN-WT
PPR-wt / OPN-KO
PPR-tg / OPN-WT
PPR-tg / OPN-KO
PPR-wt / OPN-WT
PPR-wt / OPN-KO
PPR-tg / OPN-WT
PPR-tg / OPN-KO
f g h
N= 6 6 6 6
i j
PPR-wt / OPN-WT PPR-wt / OPN-KO PPR-tg / OPN-WT PPR-tg / OPN-KOl
PPR-wt / OPN-WT
PPR-wt / OPN-KO
PPR-tg / OPN-WT
PPR-tg / OPN-KOk
at Tokyo Ikashika D
aigaku on May 18, 2008
ww
w.jbc.org
Dow
nloaded from

Figure 2
a
b
PPR-wt / OPN-WT
PPR-wt / OPN-KO
PPR-tg / OPN-WT
PPR-tg / OPN-KO
c
d
e
1mm
50μm
*
50μm *
**
*
*
fWBC RBC HemoglobinHematocrit Plt MCV MCH MCHC
PPR-tg/OPN-WT (1) 2900 856 13.2 47 33.5 55 15.4 28.1
PPR-tg/OPN-WT (2) 2900 936 13.8 52.5 27.2 56 14.7 26.3
PPR-tg/OPN-KO 4100 947 14.7 52 95.4 55 15.5 28.3
Complete blood count (CBC) at Tokyo Ikashika D
aigaku on May 18, 2008
ww
w.jbc.org
Dow
nloaded from
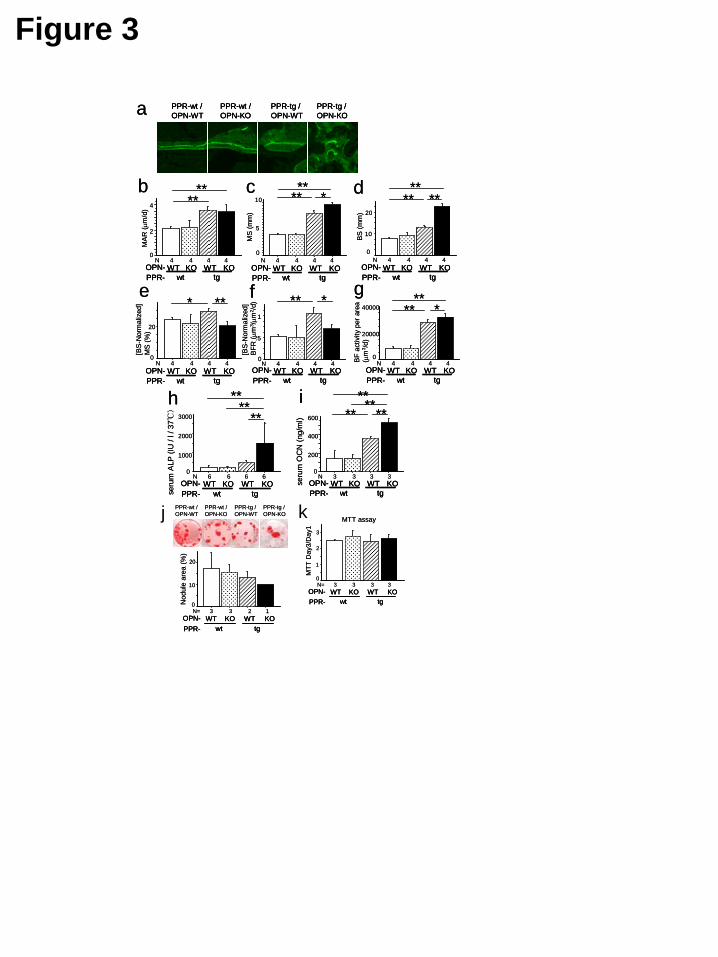
Figure 3
a
ih **
0
200
400
600
seru
m O
CN
(ng/
ml)
******
WT KO WT KOOPN-wt tgPPR-
0
1000
2000
3000
seru
m A
LP (I
U /
l / 3
7℃) **
****
WT KO WT KOOPN-wt tgPPR-
MAR
(μm
/d)
0
2
4
WT KO WT KOOPN-wt tgPPR-
****
PPR-wt / OPN-WT
PPR-wt / OPN-KO
PPR-tg / OPN-WT
PPR-tg / OPN-KO
0
.5
1
[BS-
Nor
mal
ized
] BF
R (μ
m3 /μ
m2 /d
) **
WT KO WT KOOPN-wt tgPPR-
*
0
5
10 ***
WT KO WT KOOPN-wt tgPPR-
MS
(mm
)
0
20
***
WT KO WT KOOPN-wt tgPPR-
[BS-
Nor
mal
ized
] M
S (%
)
b c
e f
0
10
20
BS (m
m)
******
WT KO WT KOOPN-wt tgPPR-
d
0
20000
40000
BF a
ctiv
ity p
er a
rea
(μ
m3 /d
)
**** *
WT KO WT KOOPN-wt tgPPR-
g
N 4 4 4 4 N 4 4 4 4 N 4 4 4 4
N 4 4 4 4 N 4 4 4 4 N 4 4 4 4
N 6 6 6 6 N 3 3 3 3
**
a
ih **
0
200
400
600
seru
m O
CN
(ng/
ml)
******
WT KO WT KOOPN-wt tgPPR-
WT KO WT KOOPN-wt tgPPR-
0
1000
2000
3000
seru
m A
LP (I
U /
l / 3
7℃) **
****
WT KO WT KOOPN-wt tgPPR-
WT KO WT KOOPN-wt tgPPR-
MAR
(μm
/d)
0
2
4
WT KO WT KOOPN-wt tgPPR-
WT KO WT KOOPN-wt tgPPR-
****
PPR-wt / OPN-WT
PPR-wt / OPN-KO
PPR-tg / OPN-WT
PPR-tg / OPN-KO
PPR-wt / OPN-WT
PPR-wt / OPN-KO
PPR-tg / OPN-WT
PPR-tg / OPN-KO
0
.5
1
[BS-
Nor
mal
ized
] BF
R (μ
m3 /μ
m2 /d
) **
WT KO WT KOOPN-wt tgPPR-
WT KO WT KOOPN-wt tgPPR-
*
0
5
10 ***
WT KO WT KOOPN-wt tgPPR-
WT KO WT KOOPN-wt tgPPR-
MS
(mm
)
0
20
***
WT KO WT KOOPN-wt tgPPR-
WT KO WT KOOPN-wt tgPPR-
[BS-
Nor
mal
ized
] M
S (%
)
b c
e f
0
10
20
BS (m
m)
******
WT KO WT KOOPN-wt tgPPR-
WT KO WT KOOPN-wt tgPPR-
d
0
20000
40000
BF a
ctiv
ity p
er a
rea
(μ
m3 /d
)
**** *
WT KO WT KOOPN-wt tgPPR-
WT KO WT KOOPN-wt tgPPR-
g
N 4 4 4 4 N 4 4 4 4 N 4 4 4 4
N 4 4 4 4 N 4 4 4 4 N 4 4 4 4
N 6 6 6 6 N 3 3 3 3
**
j
0
1
2
3
MTT
Day
3/D
ay1
MTT assay
N= 3 3 3 3WT KO WT KOOPN-
wt tgPPR-
0
1
2
3
MTT
Day
3/D
ay1
MTT assay
N= 3 3 3 3WT KO WT KOOPN-
wt tgPPR-WT KO WT KOOPN-
wt tgPPR-
PPR-wt / OPN-WT
PPR-wt / OPN-KO
PPR-tg / OPN-WT
PPR-tg / OPN-KO
0
10
20
Nod
ule
area
(%)
N= 3 3 2 1WT KO WT KOOPN-
wt tgPPR-
PPR-wt / OPN-WT
PPR-wt / OPN-KO
PPR-tg / OPN-WT
PPR-tg / OPN-KO
0
10
20
Nod
ule
area
(%)
N= 3 3 2 1WT KO WT KOOPN-
wt tgPPR-WT KO WT KOOPN-
wt tgPPR-
k
at Tokyo Ikashika D
aigaku on May 18, 2008
ww
w.jbc.org
Dow
nloaded from

Figure 4
a
e
0
50
N.O
c(#
/mm
2 )
******
0
5
N.O
c/BS
(#/m
m) **
**b c
WT KO WT KOOPN-wt tgPPR-
WT KO WT KOOPN-wt tgPPR-
0
100
Dpy
d(n
M/m
M.C
r)
****
** **
WT KO WT KOOPN-wt tgPPR-
PPR-wt / OPN-WT
PPR-wt / OPN-KO
PPR-tg / OPN-WT
PPR-tg / OPN-KO
0
10
20
OcS
/BS
(%)
p=0.056
WT KO WT KOOPN-wt tgPPR-
d **
N 4 4 4 4 N 4 4 4 4
N 4 4 4 4 N 6 6 6 6
a
e
0
50
N.O
c(#
/mm
2 )
******
0
5
N.O
c/BS
(#/m
m) **
**b c
WT KO WT KOOPN-wt tgPPR-
WT KO WT KOOPN-wt tgPPR-
WT KO WT KOOPN-wt tgPPR-
WT KO WT KOOPN-wt tgPPR-
0
100
Dpy
d(n
M/m
M.C
r)
****
** **
WT KO WT KOOPN-wt tgPPR-
WT KO WT KOOPN-wt tgPPR-
PPR-wt / OPN-WT
PPR-wt / OPN-KO
PPR-tg / OPN-WT
PPR-tg / OPN-KO
0
10
20
OcS
/BS
(%)
p=0.056
WT KO WT KOOPN-wt tgPPR-
WT KO WT KOOPN-wt tgPPR-
d **
N 4 4 4 4 N 4 4 4 4
N 4 4 4 4 N 6 6 6 6
f
TRA
P-po
sitiv
e ce
ll nu
mbe
r / w
ell
0
100
N= 3 3 3 3WT KO WT KOOPN-
wt tgPPR-
PPR-wt / OPN-WT
PPR-wt / OPN-KO
PPR-tg / OPN-WT
PPR-tg / OPN-KO
TRA
P-po
sitiv
e ce
ll nu
mbe
r / w
ell
0
100
N= 3 3 3 3WT KO WT KOOPN-
wt tgPPR-
PPR-wt / OPN-WT
PPR-wt / OPN-KO
PPR-tg / OPN-WT
PPR-tg / OPN-KO
at Tokyo Ikashika D
aigaku on May 18, 2008
ww
w.jbc.org
Dow
nloaded from
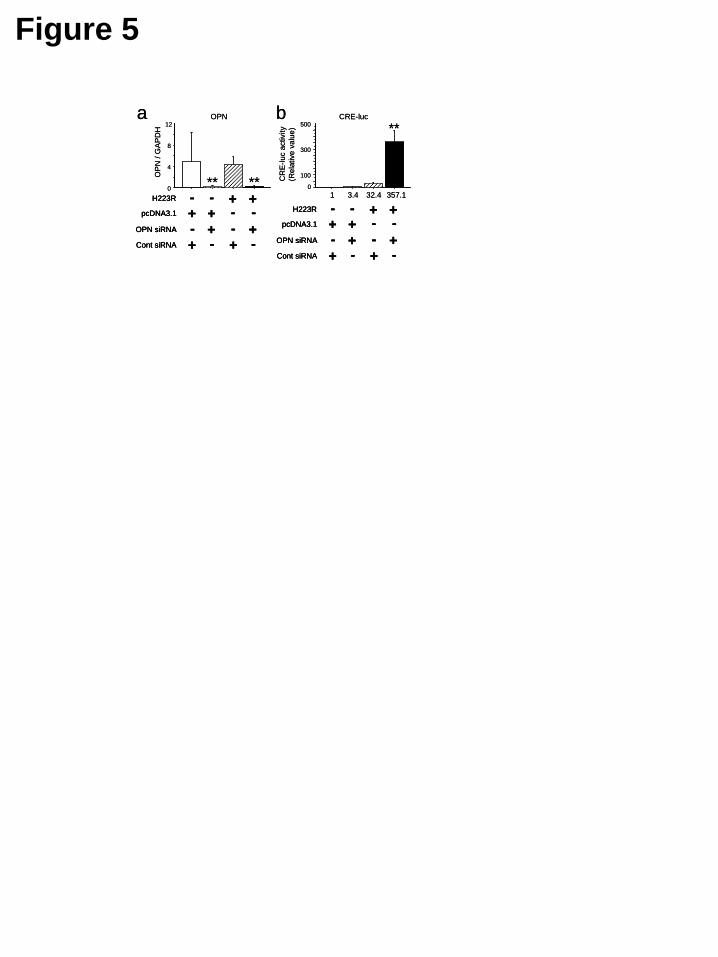
Figure 5
0
4
8
12
OPN
/ G
APD
H
** **
OPNa b
CR
E-lu
cac
tivity
(Rel
ativ
e va
lue)
CRE-luc
0
100
300
500 **
1 3.4 32.4 357.1
--H223R
OPN siRNA +
+
-
+
+-pcDNA3.1
Cont siRNA
--++
+-+ -
--H223R
OPN siRNA +
+
-
+
+-pcDNA3.1
Cont siRNA
--++
+-+ -
0
4
8
12
OPN
/ G
APD
H
** **
OPNa b
CR
E-lu
cac
tivity
(Rel
ativ
e va
lue)
CRE-luc
0
100
300
500 **
1 3.4 32.4 357.1
--H223R
OPN siRNA +
+
-
+
+-pcDNA3.1
Cont siRNA
--++
+-+ -
--H223R
OPN siRNA +
+
-
+
+-pcDNA3.1
Cont siRNA
--++
+-+ -
--H223R
OPN siRNA +
+
-
+
+-pcDNA3.1
Cont siRNA
--++
+-+ -
--H223R
OPN siRNA +
+
-
+
+-pcDNA3.1
Cont siRNA
--++
+-+ -
at Tokyo Ikashika D
aigaku on May 18, 2008
ww
w.jbc.org
Dow
nloaded from
0
.01
.02
Cal
varia
l BM
D (g
/cm
2 ) *
0
100
Cal
varia
l thi
ckne
ss (μ
m)
0
100
Cal
varia
l Bon
e D
ensi
ty
(%)
***
PPR-wt / OPN-WT PPR-wt / OPN-KO PPR-tg / OPN-WT PPR-tg / OPN-KO
WT KO WT KOOPN-wt tgPPR-
N= 4 4 4 4WT KO WT KOOPN-
wt tgPPR-
N= 4 4 4 4WT KO WT KOOPN-
wt tgPPR-
N= 6 6 6 6
PPR-wt / OPN-WT
PPR-wt / OPN-KO
PPR-tg / OPN-WT
PPR-tg / OPN-KO
0
1000
Ver
tebr
al b
ody
wid
th
(μm
)
**
0
1
2
3 ***
Ver
tebr
al b
ody
bone
vo
lum
e (m
m3 )
WT KO WT KOOPN-wt tgPPR-
N= 6 6 6 6WT KO WT KOOPN-
wt tgPPR-
N= 6 6 6 6
b c
d f
a
Supplemental Material Online – Supplementary data 1
at Tokyo Ikashika Daigaku on May 18, 2008 www.jbc.org Downloaded from

OP
N/G
AP
DH
0
1
OPN mRNA (real-time PCR)
wt tg
Calvaria-derived osteoblastic cell (P1)
Bone marrow-derived mesenchymal cell (P3)
0
1
2
wt tgO
PN
/GA
PD
H
Supplemental Material Online – Supplementary data 2
at Tokyo Ikashika Daigaku on May 18, 2008 www.jbc.org Downloaded from