our life is critically dependent upon the continuous … · the decline of the oxygen tension is...
TRANSCRIPT

1

2
After having worked out this lecture, you will be able to describe the oxygen cascade and to calculate the inspiratory and the alveolar partial pressure of oxygen. You will have understood the process of oxygen diffusion and the importance of intra- and extrapulmonary shunts. Moreover, you will have come acquainted with the principles and concepts of oxygen transport. Furthermore, you will be able to calculate oxygen content, delivery and consumption. After all, this will have led to a profound understanding of the available strategies that are commonly used to treat disturbances in the oxygen cascade.

Our life is critically dependent upon the continuous availability of substantial amounts of oxygen as: 1) Under normal conditions, a normal adult consumes 3-4 ml oxygen / kg / min
(i.e., 300 ml/min for a body weight of 75kg). 2) Our body does not possess relevant stores for oxygen. When breathing air,
approximately only 1550 ml of oxygen reserves are available. After having saturated a patient with 100% oxygen, the oxygen reserves are three times higher, but are still not sufficient to allow the tolerance of longer periods of oxygen shortage.
3

1) Most of the vital organs are not able to tolerate hypoxia for longer time periods.
4
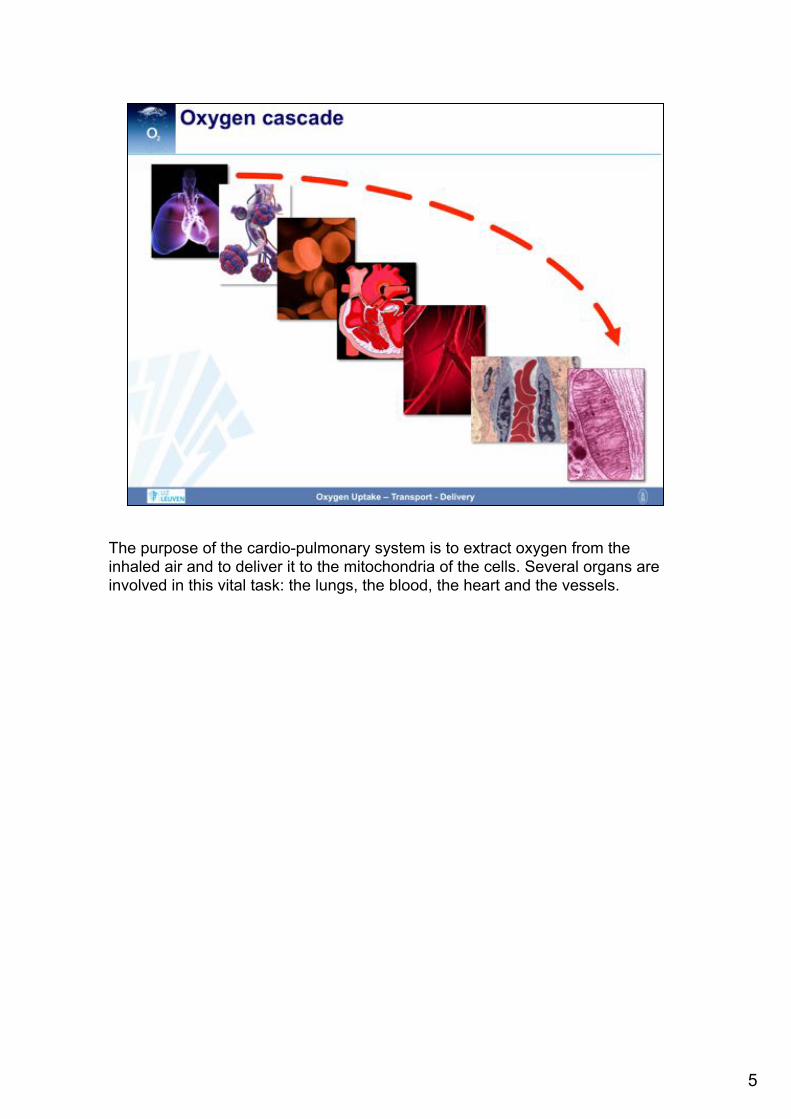
The purpose of the cardio-pulmonary system is to extract oxygen from the inhaled air and to deliver it to the mitochondria of the cells. Several organs are involved in this vital task: the lungs, the blood, the heart and the vessels.
5
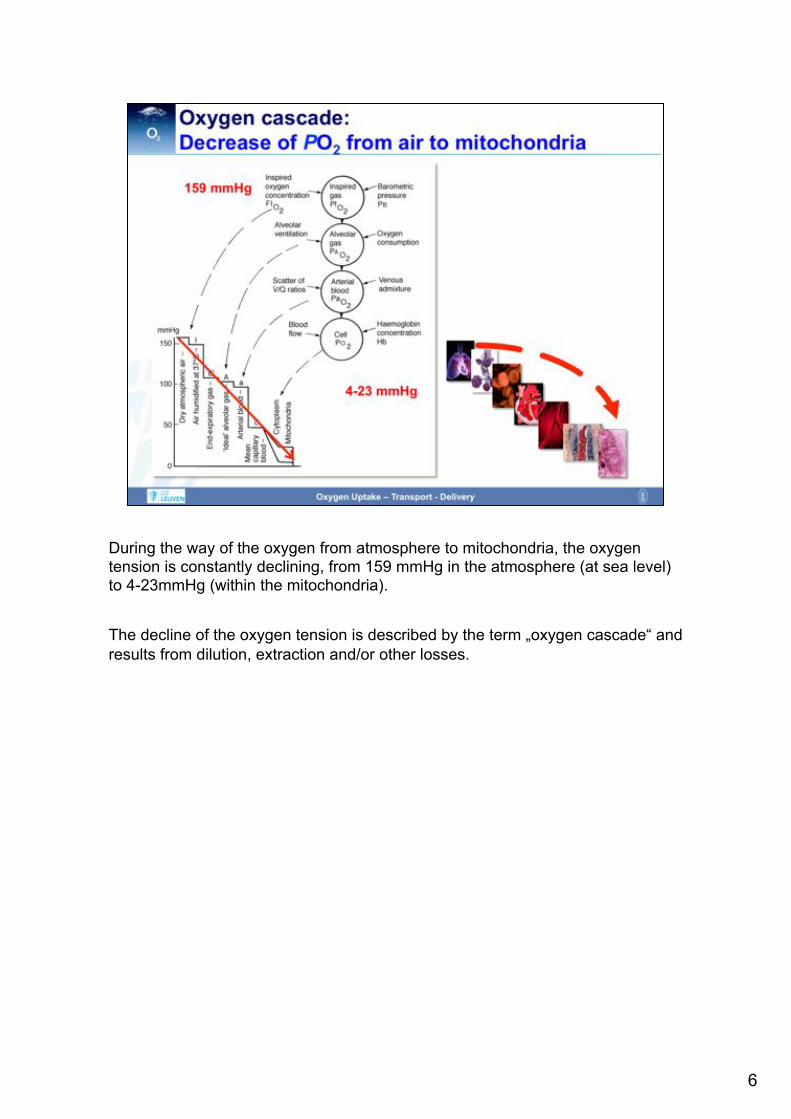
During the way of the oxygen from atmosphere to mitochondria, the oxygen tension is constantly declining, from 159 mmHg in the atmosphere (at sea level) to 4-23mmHg (within the mitochondria). The decline of the oxygen tension is described by the term „oxygen cascade“ and results from dilution, extraction and/or other losses.
6

The first determinant of oxygen uptake into the lungs is the inspiratory partial pressure of oxygen, PiO2.
7

Inhaled oxygen is a gas that exerts a partial pressure (PiO2), which is – according to Dalton‘s law - determined by the fraction of inspired oxygen (Figas, or FiO2) and the prevailing environmental/atmospheric/barometric pressure (i.e., the pressure that is exerted by all gases being present in a gas mixture (Ptotal, or PB). At sea level, the atmospheric pressure is 760mmHg, and the concentration of oxygen in inhaled air is 21% (20.94% to be exact). This results in a PiO2 of 760 x 0.21 = 159 mmHg. In contrast, if pure oxygen is inhaled, this results in a PiO2 of 760 x 1.0 = 760 mmHg. Of note, these calculations are made for dry oxygen at 0°C (STPD = standard temperature pressure dry conditions).
8

The first decline in oxygen tension occurs due to the dilution of inspired by water vapor. Within the upper airways, the inspired air is humified with water vapor. Hence, the barometric or total pressure of the inhaled gas mixture is now exerted by all inhaled gases present in this mixture PLUS water vapor). Hence, the gases now exert a total pressure that is equal to the barometric pressure reduced by the partial pressure of saturated water vapour (Pb-PH2O). The PiO2 can therefore be re-calculated as: (760 - 47) x 0.2094 = 149mmHg. These calculation is made for water-saturated oxygen at 37°C (BTPD = body temperature pressure dry conditions).
9
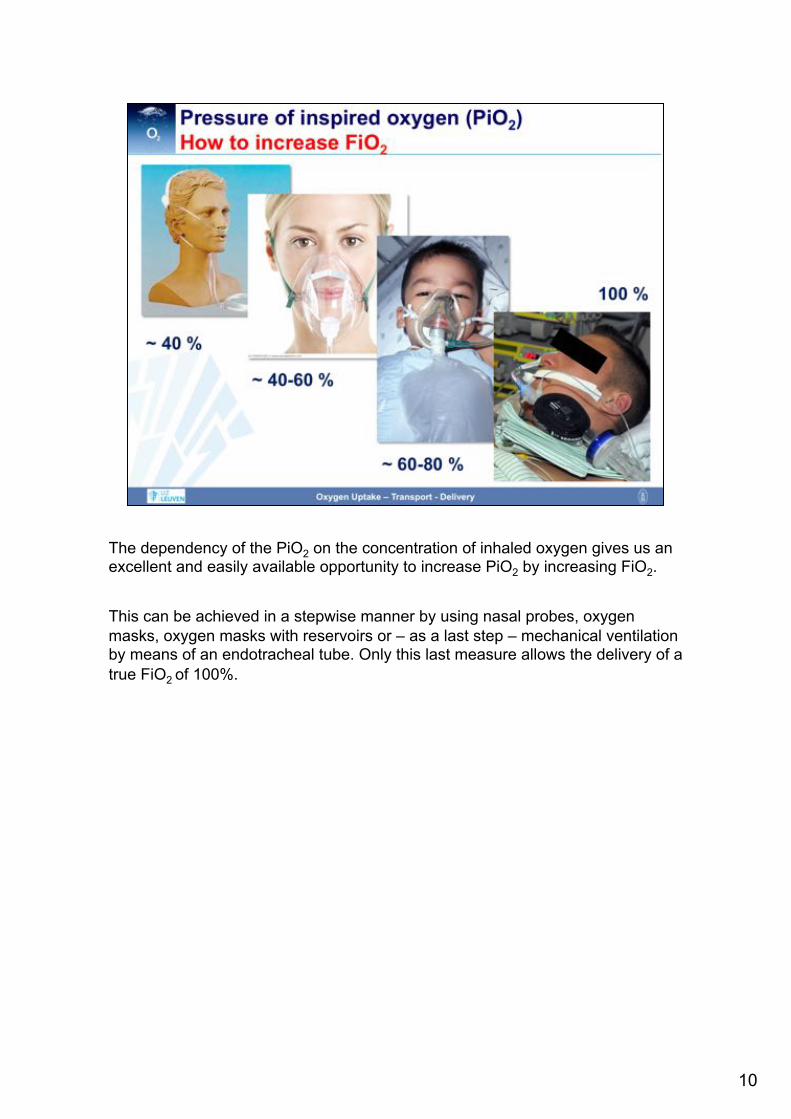
The dependency of the PiO2 on the concentration of inhaled oxygen gives us an excellent and easily available opportunity to increase PiO2 by increasing FiO2. This can be achieved in a stepwise manner by using nasal probes, oxygen masks, oxygen masks with reservoirs or – as a last step – mechanical ventilation by means of an endotracheal tube. Only this last measure allows the delivery of a true FiO2 of 100%.
10

As already described, the PiO2 is not only dependent upon the FiO2, but also on the barometric pressure (PB). Of note, the barometric pressure steadily decreases with increasing altitude, whereas the concentration of oxygen (i.e., FiO2) is always constant.
11
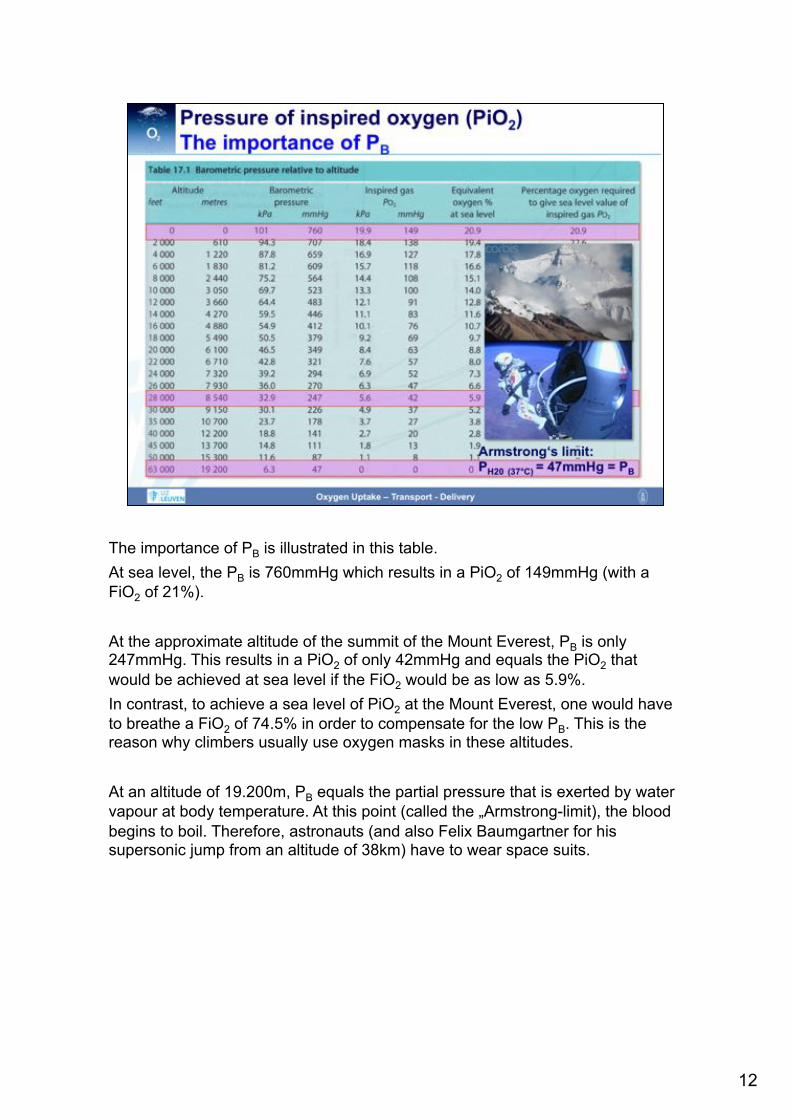
The importance of PB is illustrated in this table. At sea level, the PB is 760mmHg which results in a PiO2 of 149mmHg (with a FiO2 of 21%). At the approximate altitude of the summit of the Mount Everest, PB is only 247mmHg. This results in a PiO2 of only 42mmHg and equals the PiO2 that would be achieved at sea level if the FiO2 would be as low as 5.9%. In contrast, to achieve a sea level of PiO2 at the Mount Everest, one would have to breathe a FiO2 of 74.5% in order to compensate for the low PB. This is the reason why climbers usually use oxygen masks in these altitudes. At an altitude of 19.200m, PB equals the partial pressure that is exerted by water vapour at body temperature. At this point (called the „Armstrong-limit), the blood begins to boil. Therefore, astronauts (and also Felix Baumgartner for his supersonic jump from an altitude of 38km) have to wear space suits.
12

The above-described theoretical considerations are strikingly illustrated by this investigation in Mount Everest climbers. Their blood gas values(documented at an altitude of 8400m) are depicted in this table.
14

The uptake of oxygen into the alveoli represents the next step in the oxygen cascade.
15
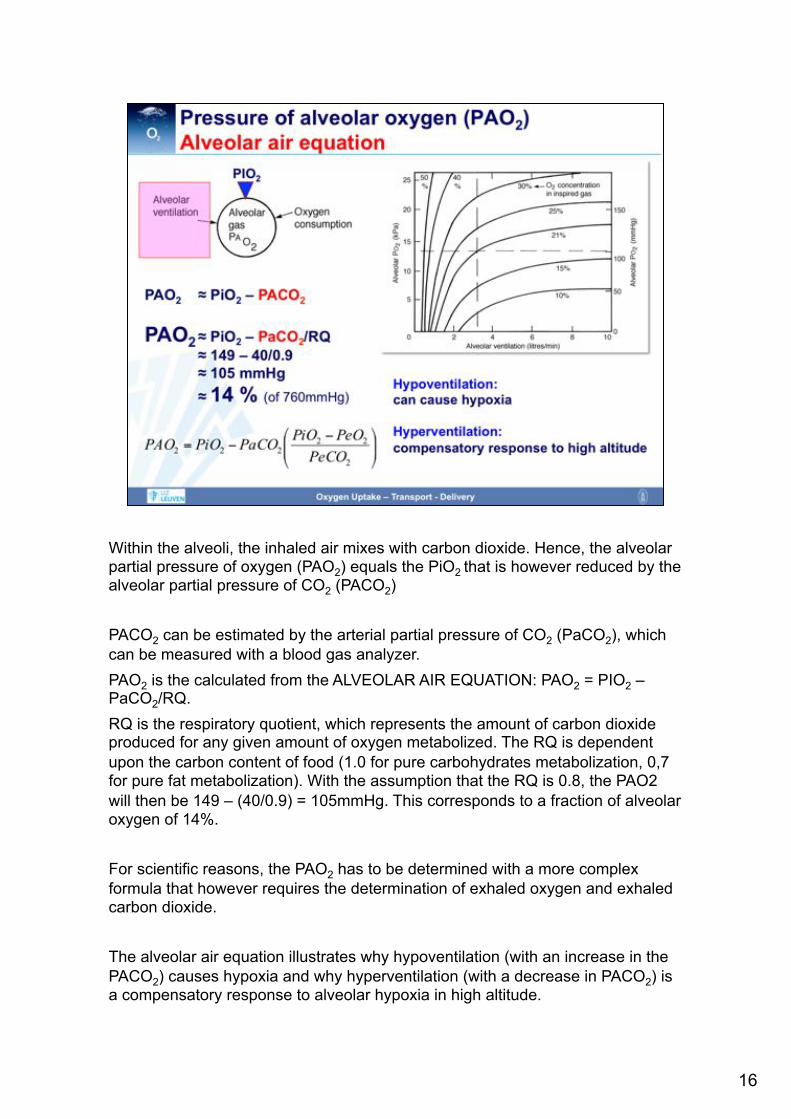
Within the alveoli, the inhaled air mixes with carbon dioxide. Hence, the alveolar partial pressure of oxygen (PAO2) equals the PiO2 that is however reduced by the alveolar partial pressure of CO2 (PACO2) PACO2 can be estimated by the arterial partial pressure of CO2 (PaCO2), which can be measured with a blood gas analyzer. PAO2 is the calculated from the ALVEOLAR AIR EQUATION: PAO2 = PIO2 – PaCO2/RQ. RQ is the respiratory quotient, which represents the amount of carbon dioxide produced for any given amount of oxygen metabolized. The RQ is dependent upon the carbon content of food (1.0 for pure carbohydrates metabolization, 0,7 for pure fat metabolization). With the assumption that the RQ is 0.8, the PAO2 will then be 149 – (40/0.9) = 105mmHg. This corresponds to a fraction of alveolar oxygen of 14%. For scientific reasons, the PAO2 has to be determined with a more complex formula that however requires the determination of exhaled oxygen and exhaled carbon dioxide. The alveolar air equation illustrates why hypoventilation (with an increase in the PACO2) causes hypoxia and why hyperventilation (with a decrease in PACO2) is a compensatory response to alveolar hypoxia in high altitude.
16

PAO2 is also dependent upon oxygen consumption (VO2). With a high oxygen consumption, it is difficult to build up a high PAO2 (as the oxygen is immediately utilized). That means that the alveolar ventilation has to increase when the PAO2 is to be maintained in the presence of a high VO2. If the alveolar ventilation is not compensatorily increased, then any increase in VO2 will lead to a decrease in PAO2.
17
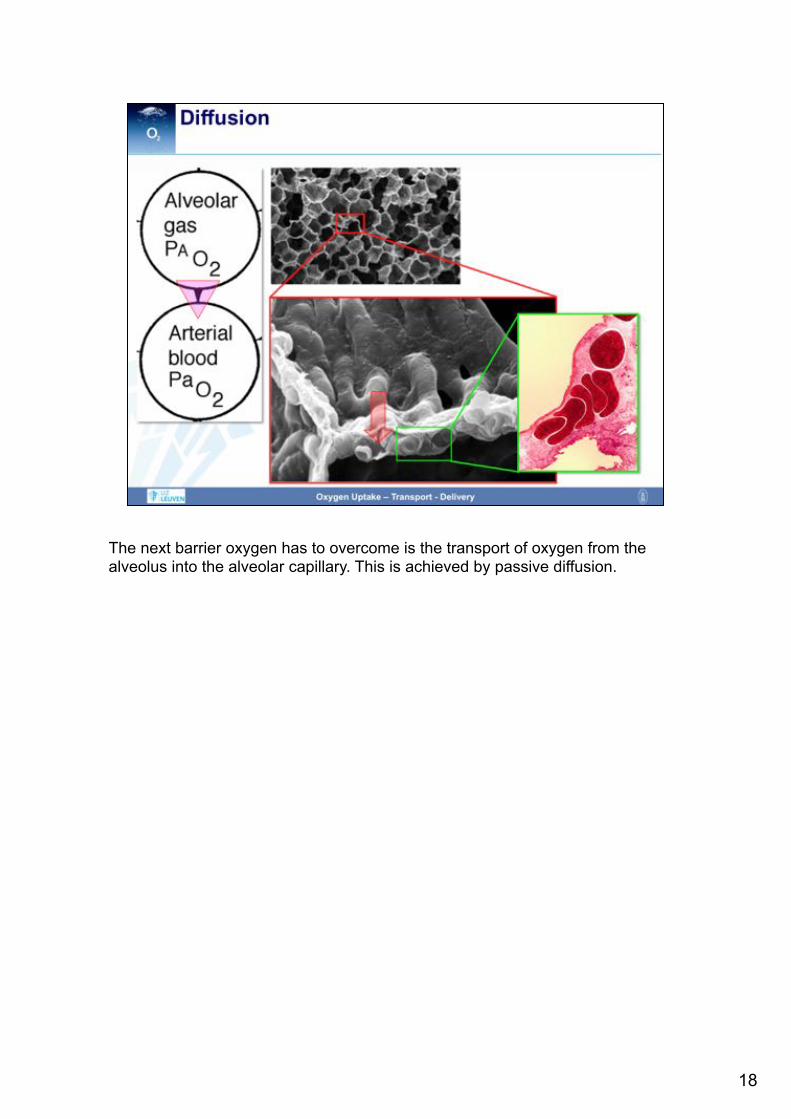
The next barrier oxygen has to overcome is the transport of oxygen from the alveolus into the alveolar capillary. This is achieved by passive diffusion.
18

The diffusion of oxygen is affected by several barriers. First, in order to get into contact with the alveolar capillaries, oxygen has to reach the borders of the gas space within the alveolus. However, as all gases are distributed uniformly within the alveolus, this theoretical concern does not significantly impair oxygen diffusion. The next barrier oxygen has to pass is the alveolar lining fluid which is very thin in healthy conditions in order not to impair gas exchange. Also the subsequent tissue barrier is very thin, consisting of the alveolar epithelium, the interstitial space and the capillary endothelium. Then, oxygen has to pass the plasma layer to finally diffuse into the erythrocytes where oxygen will be taken up by hemoglobin.
19
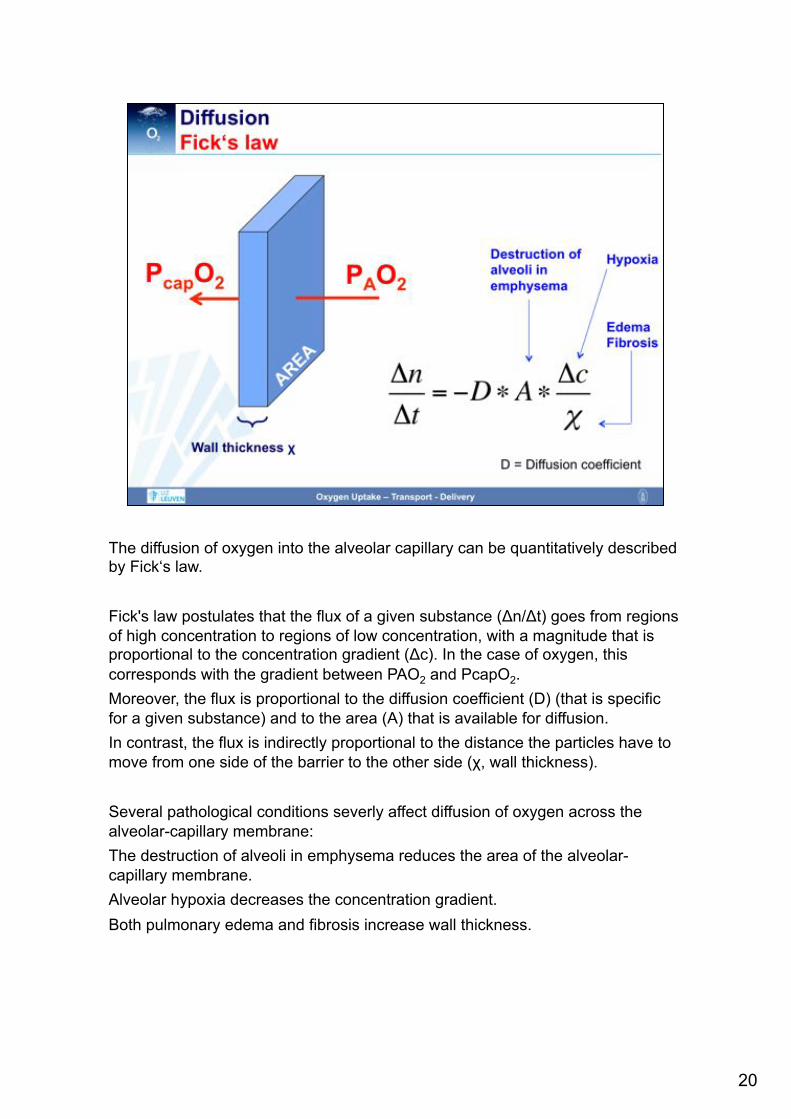
The diffusion of oxygen into the alveolar capillary can be quantitatively described by Fick‘s law. Fick's law postulates that the flux of a given substance (Δn/Δt) goes from regions of high concentration to regions of low concentration, with a magnitude that is proportional to the concentration gradient (Δc). In the case of oxygen, this corresponds with the gradient between PAO2 and PcapO2. Moreover, the flux is proportional to the diffusion coefficient (D) (that is specific for a given substance) and to the area (A) that is available for diffusion. In contrast, the flux is indirectly proportional to the distance the particles have to move from one side of the barrier to the other side (χ, wall thickness). Several pathological conditions severly affect diffusion of oxygen across the alveolar-capillary membrane: The destruction of alveoli in emphysema reduces the area of the alveolar-capillary membrane. Alveolar hypoxia decreases the concentration gradient. Both pulmonary edema and fibrosis increase wall thickness.
20
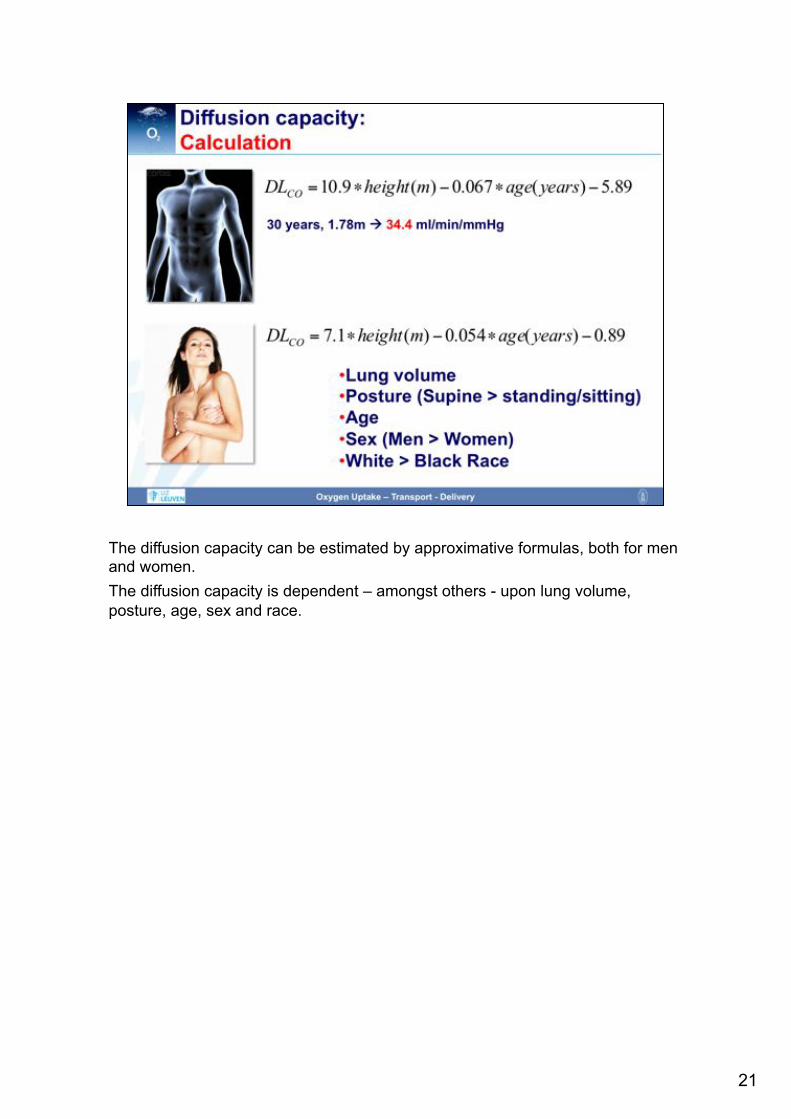
The diffusion capacity can be estimated by approximative formulas, both for men and women. The diffusion capacity is dependent – amongst others - upon lung volume, posture, age, sex and race.
21
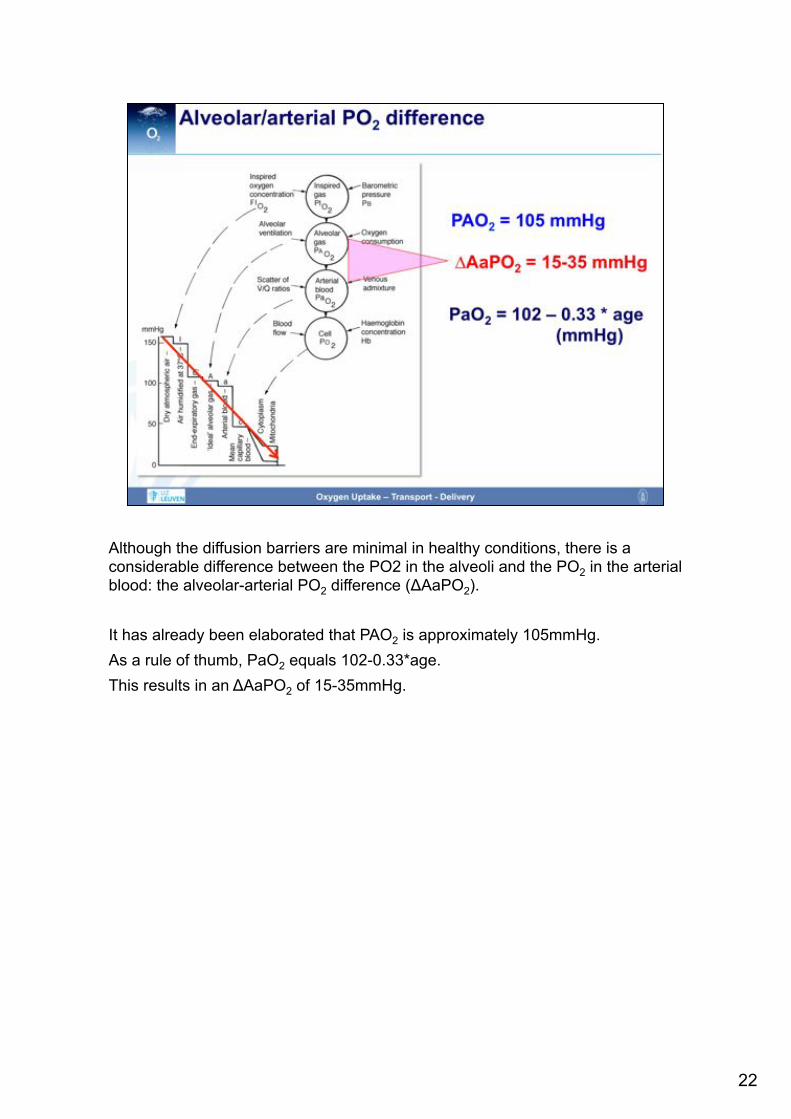
Although the diffusion barriers are minimal in healthy conditions, there is a considerable difference between the PO2 in the alveoli and the PO2 in the arterial blood: the alveolar-arterial PO2 difference (ΔAaPO2). It has already been elaborated that PAO2 is approximately 105mmHg. As a rule of thumb, PaO2 equals 102-0.33*age. This results in an ΔAaPO2 of 15-35mmHg.
22

Part of the ΔAaPO2 can be explained with small ventilation perfusion abnormalities.
23

Admixture of venous blood to arterial blood is another contributor to the ΔAaPO2. Venous admixture can be caused by anatomical/extrapulmonary shunts, e.g. Thebesian veins, bronchial veins or shunts owing to congenital heart disease. Venous admixture can also be caused by intrapulmonary shunts, e.g. due to atelectasis, pneumonia or ARDS. In these cases, parts of the lungs are still perfused, but not ventilated anymore. The V/Q quotient is < 1.
24

The shunt fraction (Qs/Qt) represents the fraction of the shunt flow (Qs) with respect to the total blood flow (Qt). The shunt fraction can be calculated with the formula that is elaborated on this slide. For the calculation of the shunt fraction, one has to determine the oxygen content of the arterial blood (CaO2), that of the mixed venous blood (CvO2) and that of the pulmonary capillary blood (CcO2). CaO2 is calculated from a blood gas analysis of arterial blood. CvO2 is calculated from a blood gas analysis of mixed venous, i.e. pulmonary arterial, blood (obtained from a pulmonary arterial catheter). CcO2 is calculated from a blood gas analysis of pulmonary capillary blood (obtained from a pulmonary arterial catheter in wedge position and with inflated wedge balloon). For the calculation of oxygen content, see below.
25

The venous admixture has a significant impact on oxygenation. Of note, the relationship between arterial oxygen content and PaO2 follows a sigmoidal shape. This means that already minor changes in arterial oxygen content result in significant changes in PaO2. In contrast, the relationship between arterial carbon dioxide content and PaCO2 is nearly linear and much steeper. That means that even major changes in CaCO2 are associated with only minimal effects on PaCO2. In summary, venous admixture immediately results in arterial hypoxia whereas PaCO2 is virtually not affected. Venous admixture reduces the arterial O2 content and increases the arterial CO2 content. Because PaO2 is usually on the flat part of the haemoglobin dissociation curve, => small reduction in O2 content leads to large drop in PaO2 => increased A-a gradient Because CO2 dissociation curve is usually steep and more linear,
26

The dependency of PaO2 upon CaO2 also explains that with increasing shunt fractions, it becomes impossible to treat hypoxia with added inspired oxygen. This is demontrated by the iso-shunt diagram that illustrates the dependency of PaO2 on FiO2 for different shunt fractions.
27
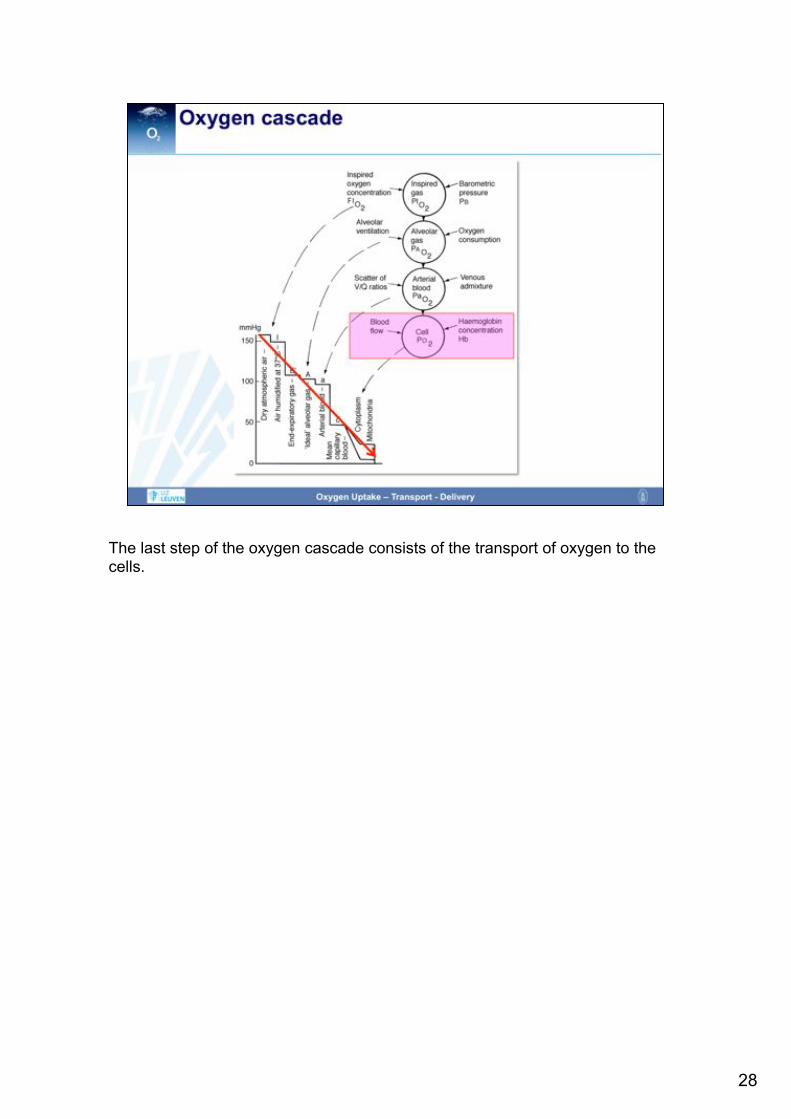
The last step of the oxygen cascade consists of the transport of oxygen to the cells.
28

Within the blood, oxygen is transported in two ways: 1) Dissolved in plasma (as phsyical solution) 2) Chemically bound to hemoglobin within the erythrocytes. The amount of oxygen that is dissolved in plasma can be quantified with the law of Henry. This law states: "At a constant temperature, the amount of a given gas that dissolves in a given type and volume of liquid is directly proportional to the partial pressure of that gas in equilibrium with that liquid." Hence, the concentration of a dissolved gas equals the product of the partial pressure exerted by this gas and the solulibility coefficient of this specific gas. For oxygen, this co-efficient is as low as 0.000031 ml / ml blood / mmHg. With a PO2 of 100 mmHg, only 0.3 ml oxygen are dissolved per 100ml blood. Even with a FiO2 of 1, only 1.9ml oxygen are dissolved under normobaric conditions. Hence, transport of oxygen by solution is negligible. The law of Henry also explains why the relationship between oxygen content and
29

Most of the oxygen is transported within the erythrocytes by chemical binding to hemoglobin. Hemoglobin is a complex molecule consisting of two α- and two β-subunits. The three-dimensional structure of hemoglobin is best described as a pair of identical αβ dimers (α1β1 and α2β2) that associate to form the hemoglobin tetramer. Each of the subunits contains a heme group that consists of a porphyrin ring with an iron atom in the center.
30
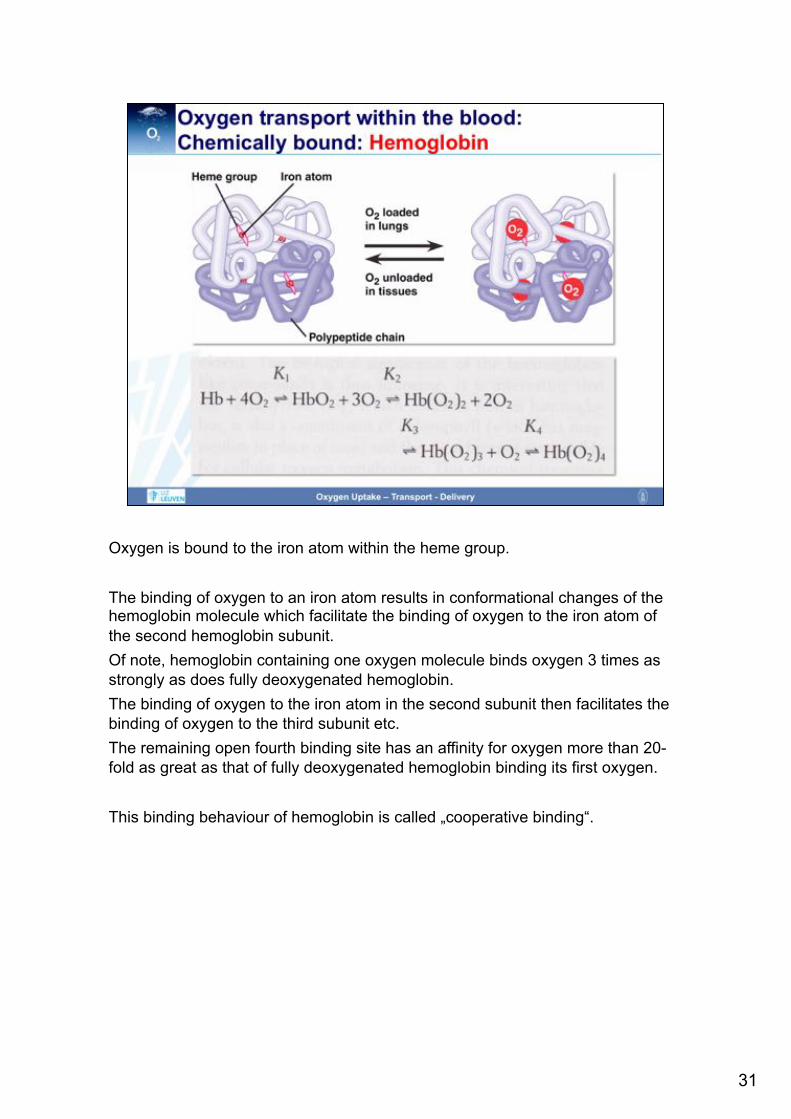
Oxygen is bound to the iron atom within the heme group. The binding of oxygen to an iron atom results in conformational changes of the hemoglobin molecule which facilitate the binding of oxygen to the iron atom of the second hemoglobin subunit. Of note, hemoglobin containing one oxygen molecule binds oxygen 3 times as strongly as does fully deoxygenated hemoglobin. The binding of oxygen to the iron atom in the second subunit then facilitates the binding of oxygen to the third subunit etc. The remaining open fourth binding site has an affinity for oxygen more than 20-fold as great as that of fully deoxygenated hemoglobin binding its first oxygen. This binding behaviour of hemoglobin is called „cooperative binding“.
31
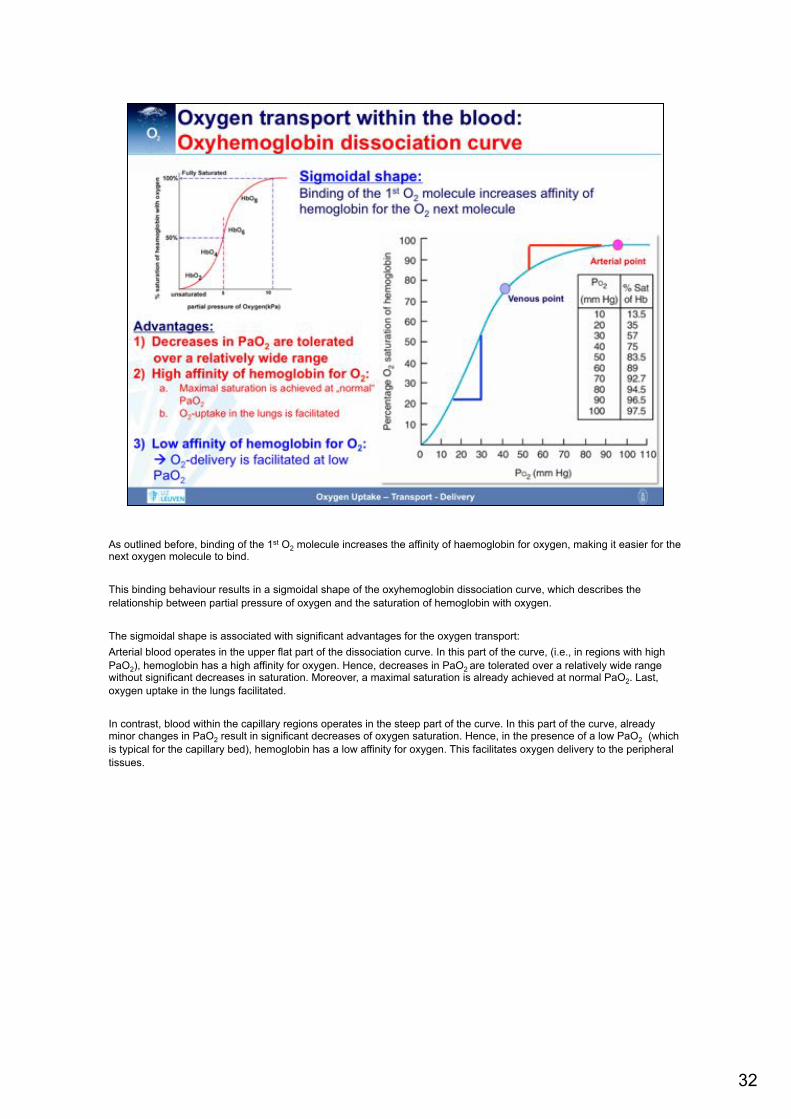
As outlined before, binding of the 1st O2 molecule increases the affinity of haemoglobin for oxygen, making it easier for the next oxygen molecule to bind. This binding behaviour results in a sigmoidal shape of the oxyhemoglobin dissociation curve, which describes the relationship between partial pressure of oxygen and the saturation of hemoglobin with oxygen. The sigmoidal shape is associated with significant advantages for the oxygen transport: Arterial blood operates in the upper flat part of the dissociation curve. In this part of the curve, (i.e., in regions with high PaO2), hemoglobin has a high affinity for oxygen. Hence, decreases in PaO2 are tolerated over a relatively wide range without significant decreases in saturation. Moreover, a maximal saturation is already achieved at normal PaO2. Last, oxygen uptake in the lungs facilitated. In contrast, blood within the capillary regions operates in the steep part of the curve. In this part of the curve, already minor changes in PaO2 result in significant decreases of oxygen saturation. Hence, in the presence of a low PaO2 (which is typical for the capillary bed), hemoglobin has a low affinity for oxygen. This facilitates oxygen delivery to the peripheral tissues.
32

Interestingly, the position of the hemoglobin dissociation curve can be shifted either to the right or the left. The position of the hemoglobin dissociation curve can be quantified with the P50-value. The P50 is the PaO2 with which a 50%-saturation of hemoglobin can be achieved. Under normal conditions, the P50 is 27mmHg. A right shift of the hemoglobin dissociation curve means that the P50 is higher than 27mmHg. In other words, a higher PaO2 is needed to achieve a 50% saturation. This is the consequence of a lower affinity of hemoglobin for oxygen which means that the release of oxygen from the hemoglobin molecule is facilitated. In contrast, a left shift of the hemoglobin dissociation curve means that the P50 is lower than 27mmHg. In other words, a a 50% saturation is already achieved with a lower PaO2. This is the consequence of a higher affinity of hemoglobin for oxygen which means that on the one hand, the release of oxygen from the hemoglobin molecule is impaired. On the other hand, the binding of oxygen to hemoglobin within the lungs is facilitated.
33
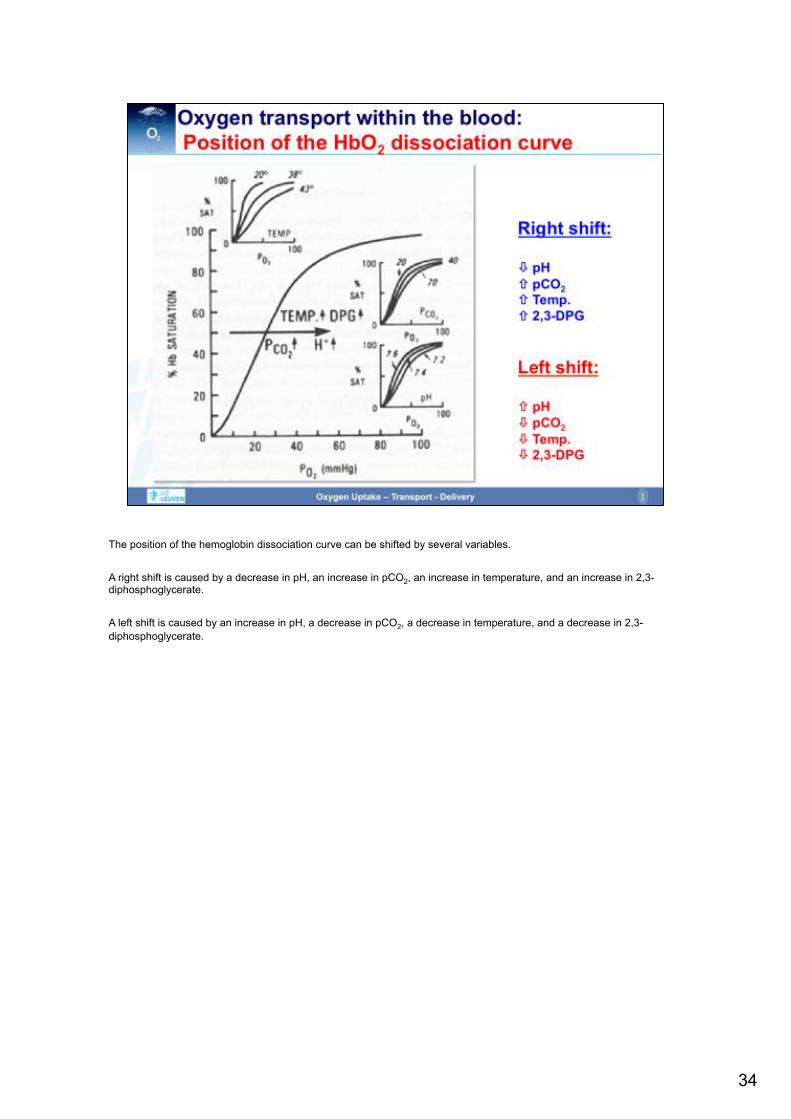
The position of the hemoglobin dissociation curve can be shifted by several variables. A right shift is caused by a decrease in pH, an increase in pCO2, an increase in temperature, and an increase in 2,3-diphosphoglycerate. A left shift is caused by an increase in pH, a decrease in pCO2, a decrease in temperature, and a decrease in 2,3-diphosphoglycerate.
34
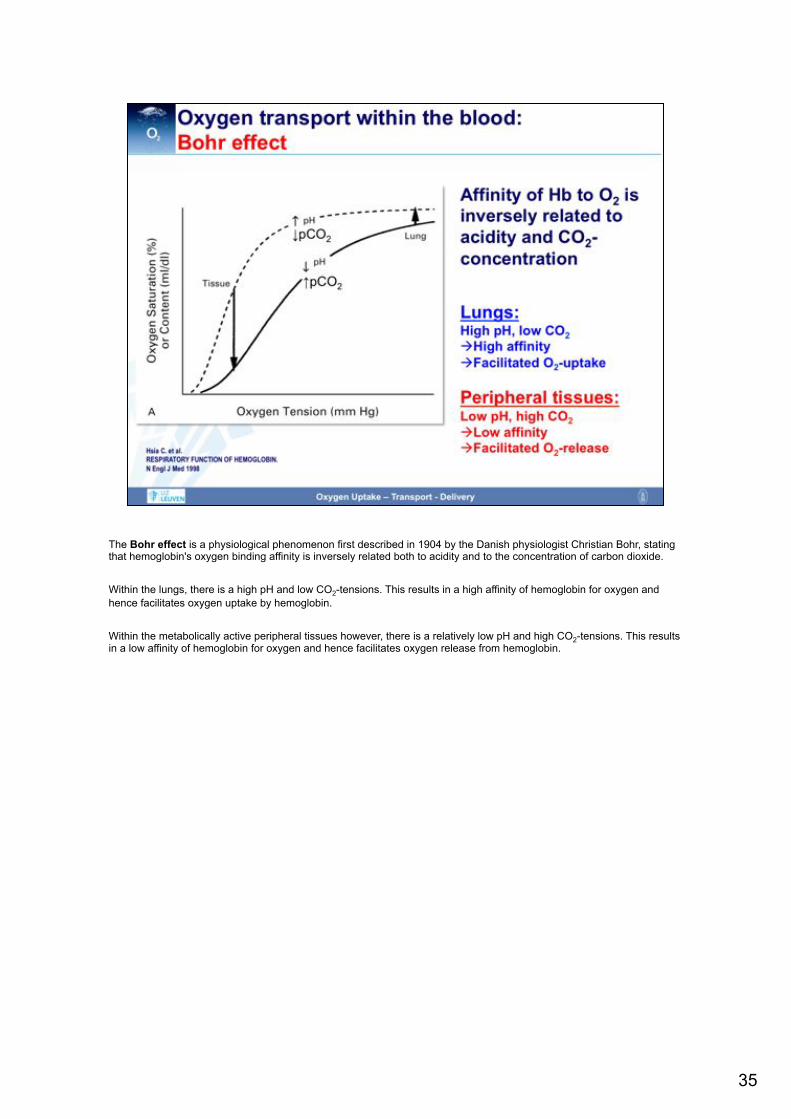
The Bohr effect is a physiological phenomenon first described in 1904 by the Danish physiologist Christian Bohr, stating that hemoglobin's oxygen binding affinity is inversely related both to acidity and to the concentration of carbon dioxide. Within the lungs, there is a high pH and low CO2-tensions. This results in a high affinity of hemoglobin for oxygen and hence facilitates oxygen uptake by hemoglobin. Within the metabolically active peripheral tissues however, there is a relatively low pH and high CO2-tensions. This results in a low affinity of hemoglobin for oxygen and hence facilitates oxygen release from hemoglobin.
35
36

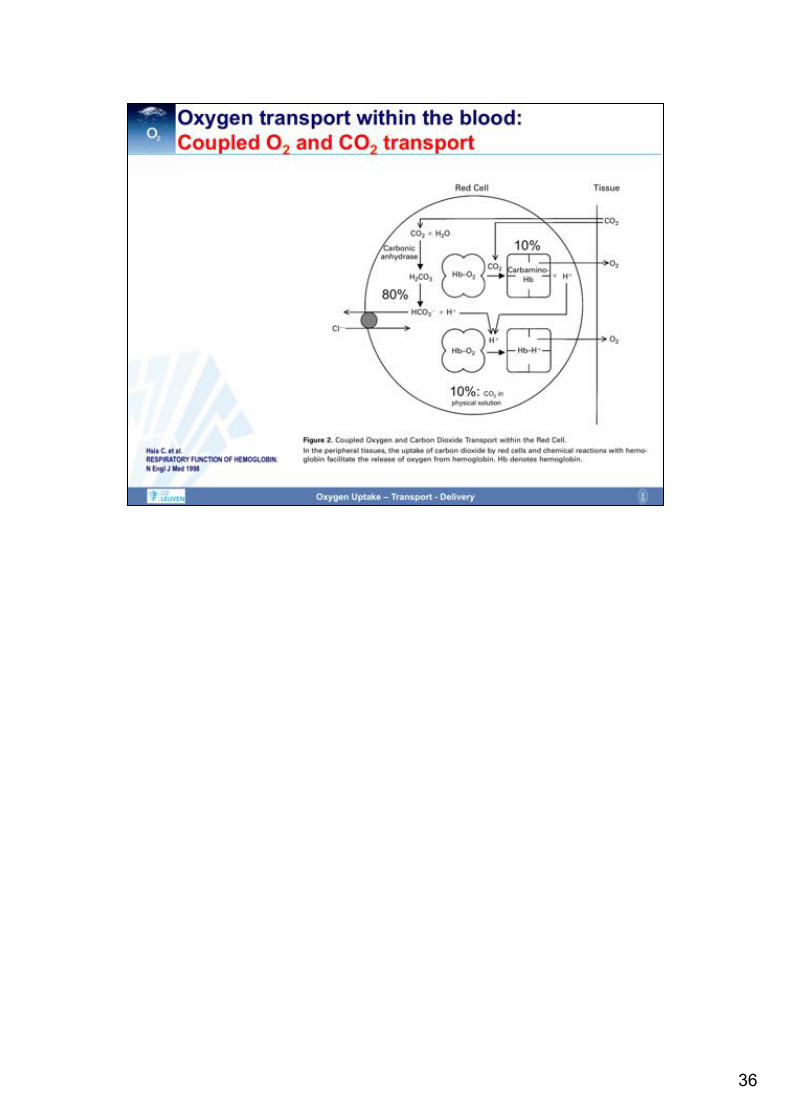
Of note, hemoglobin does not only transport oxygen, but also carbon dioxide. The Haldane effect is a property of hemoglobin first described by John Scott Haldane, stating that the affinity of hemoglobin for carbon dioxide is inversely related to the oxygen concentration. In other words, deoxygenation of the hemoglobin increases its ability to carry carbon dioxide. In contrast, oxygenated blood has a reduced capacity for carbon dioxide. Within the oxygen-rich capillaries of the lung, the Haldane effect facilitates the release of carbon dioxide from hemoglobin to plasma. Within oxygen-poor capillaries of the peripheral tissues however, the Haldane effect results in a high affinity of hemoglobin for carbon dioxide and thus promotes the uptake of carbon dioxide by hemoglobin and the removal of carbon dioxide from the peripheral tissues.
37
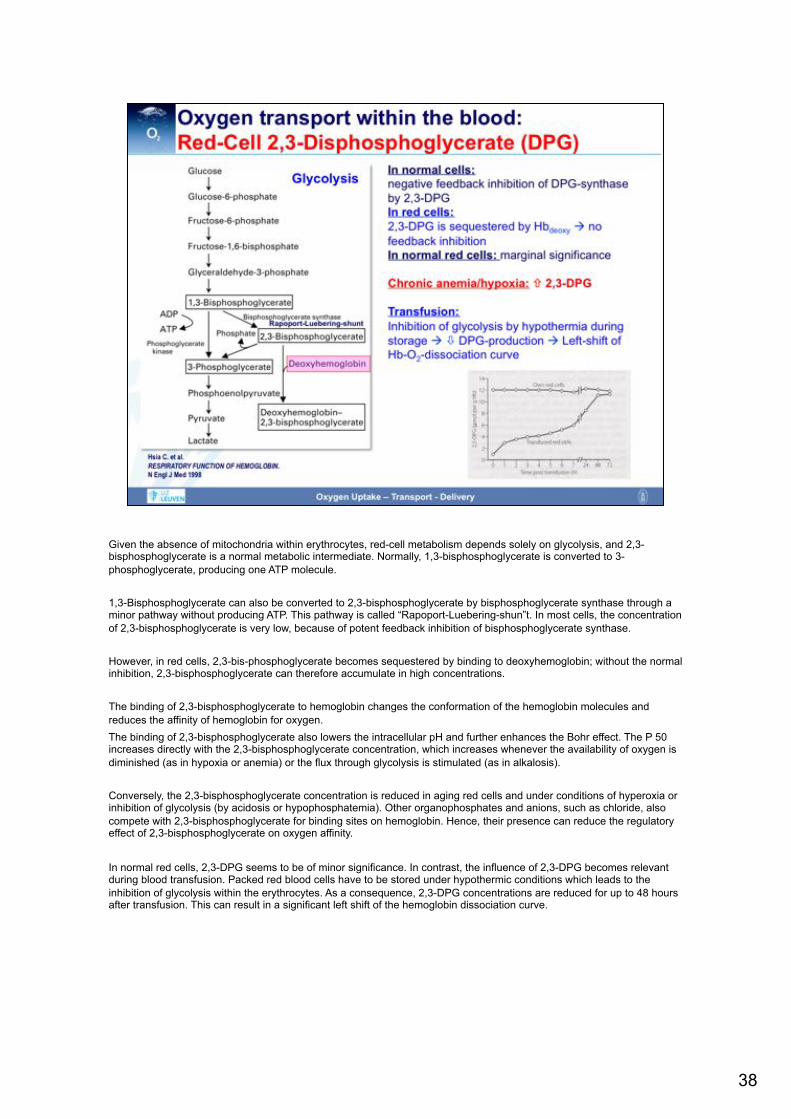
Given the absence of mitochondria within erythrocytes, red-cell metabolism depends solely on glycolysis, and 2,3-bisphosphoglycerate is a normal metabolic intermediate. Normally, 1,3-bisphosphoglycerate is converted to 3-phosphoglycerate, producing one ATP molecule. 1,3-Bisphosphoglycerate can also be converted to 2,3-bisphosphoglycerate by bisphosphoglycerate synthase through a minor pathway without producing ATP. This pathway is called “Rapoport-Luebering-shun”t. In most cells, the concentration of 2,3-bisphosphoglycerate is very low, because of potent feedback inhibition of bisphosphoglycerate synthase. However, in red cells, 2,3-bis-phosphoglycerate becomes sequestered by binding to deoxyhemoglobin; without the normal inhibition, 2,3-bisphosphoglycerate can therefore accumulate in high concentrations. The binding of 2,3-bisphosphoglycerate to hemoglobin changes the conformation of the hemoglobin molecules and reduces the affinity of hemoglobin for oxygen. The binding of 2,3-bisphosphoglycerate also lowers the intracellular pH and further enhances the Bohr effect. The P 50 increases directly with the 2,3-bisphosphoglycerate concentration, which increases whenever the availability of oxygen is diminished (as in hypoxia or anemia) or the flux through glycolysis is stimulated (as in alkalosis). Conversely, the 2,3-bisphosphoglycerate concentration is reduced in aging red cells and under conditions of hyperoxia or inhibition of glycolysis (by acidosis or hypophosphatemia). Other organophosphates and anions, such as chloride, also compete with 2,3-bisphosphoglycerate for binding sites on hemoglobin. Hence, their presence can reduce the regulatory effect of 2,3-bisphosphoglycerate on oxygen affinity. In normal red cells, 2,3-DPG seems to be of minor significance. In contrast, the influence of 2,3-DPG becomes relevant during blood transfusion. Packed red blood cells have to be stored under hypothermic conditions which leads to the inhibition of glycolysis within the erythrocytes. As a consequence, 2,3-DPG concentrations are reduced for up to 48 hours after transfusion. This can result in a significant left shift of the hemoglobin dissociation curve.
38

Of note, different hemoglobin molecules are characterized by different dissociation curves. In comparison to adult hemoglobin, fetal hemoglobin shows a characteristic leftward shift that facilitates oxygen uptake within the placenta where oxygen tensions are low. Also myoglobin shows a significant left shift. This guarantees that oxygen within the muscles is only released during exercise, when muscle oxygen tension drops. Carboxyhemoglobin has the steepest and most left-shifted dissociation curve. This results in an extremely high affinity of hemoglobin for carbon monoxide and explains why oxygen is easily displaced from hemoglobin in the presence of carbon monoxide.
39
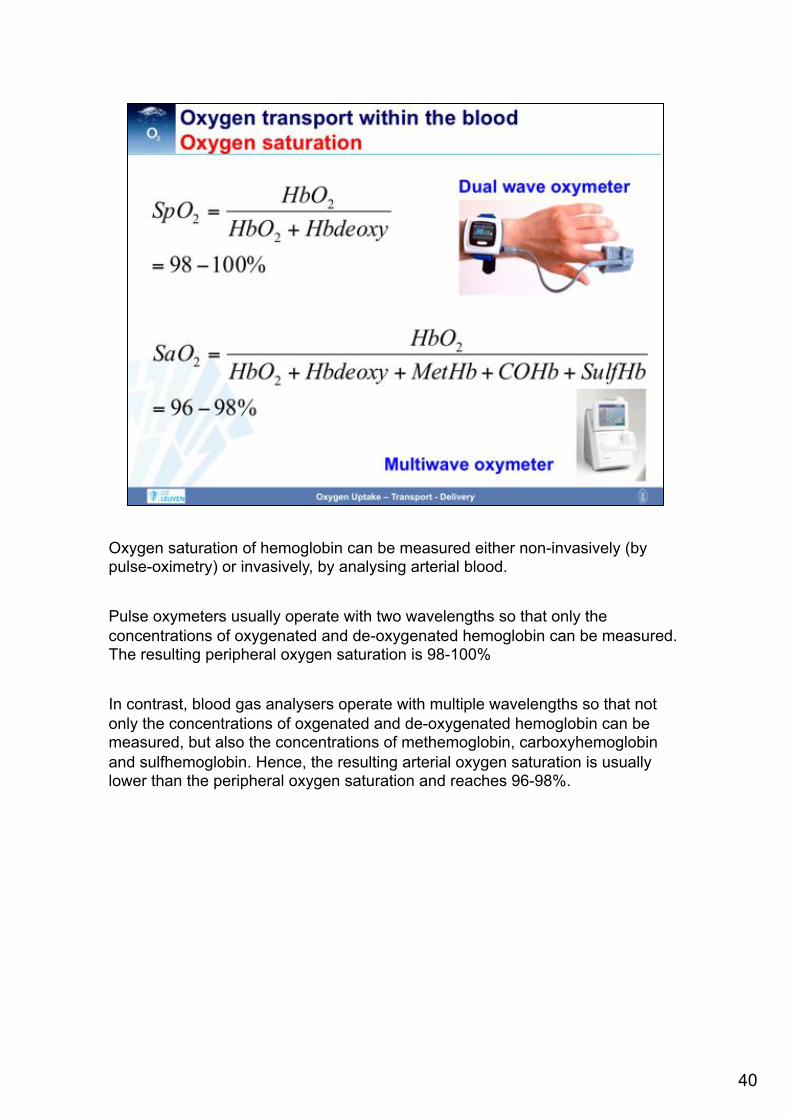
Oxygen saturation of hemoglobin can be measured either non-invasively (by pulse-oximetry) or invasively, by analysing arterial blood. Pulse oxymeters usually operate with two wavelengths so that only the concentrations of oxygenated and de-oxygenated hemoglobin can be measured. The resulting peripheral oxygen saturation is 98-100% In contrast, blood gas analysers operate with multiple wavelengths so that not only the concentrations of oxgenated and de-oxygenated hemoglobin can be measured, but also the concentrations of methemoglobin, carboxyhemoglobin and sulfhemoglobin. Hence, the resulting arterial oxygen saturation is usually lower than the peripheral oxygen saturation and reaches 96-98%.
40
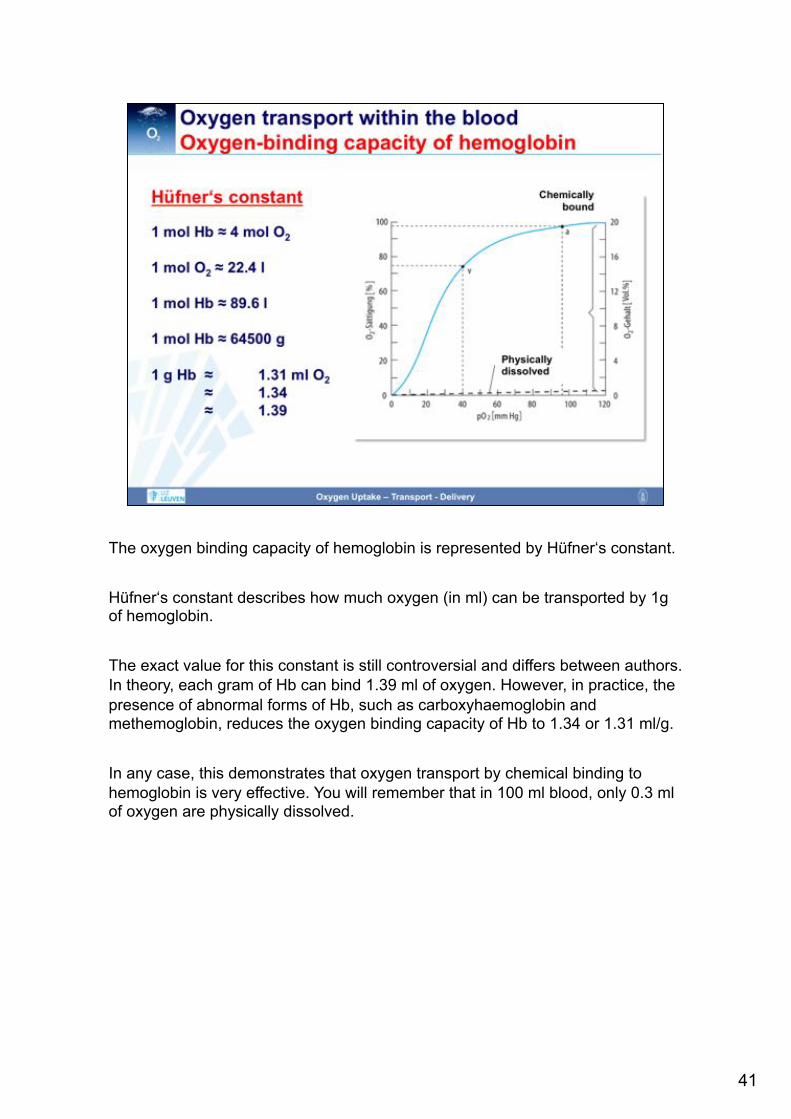
The oxygen binding capacity of hemoglobin is represented by Hüfner‘s constant. Hüfner‘s constant describes how much oxygen (in ml) can be transported by 1g of hemoglobin. The exact value for this constant is still controversial and differs between authors. In theory, each gram of Hb can bind 1.39 ml of oxygen. However, in practice, the presence of abnormal forms of Hb, such as carboxyhaemoglobin and methemoglobin, reduces the oxygen binding capacity of Hb to 1.34 or 1.31 ml/g. In any case, this demonstrates that oxygen transport by chemical binding to hemoglobin is very effective. You will remember that in 100 ml blood, only 0.3 ml of oxygen are physically dissolved.
41

With all the above information, one can now easily calculate oxygen content of the blood. The oxygen content is the sum of dissolved and chemically bound oxygen. Within the arterial blood, the calculation with the given variables results in an arterial oxygen content of 20 ml/dl. Within mixed venous blood, oxygen content is 15 ml/dl. This results in an arteriovenous oxygen difference of 5 ml/dl and in an oxygen extraction rate of 25%.
42

As you can easily see from the formulas for the calculation of oxygen content, the hemoglobin concentration has a huge impact on oxygen content. As depicted on the left figure, the arterial oxygen content decreases dramatically in anemia. This is further illustrated by the table at the left bottom. The critical dependency of oxygen content upon the hemoglobin concentration is also the reason why endurance athletes regularly perform trainings at high altitude (to increase endogenous erythropoeitin levels) and why doping with erythropoeitin is so effective.
43

Given the influences of various factors on oxygen status, it is of utmost importance to distinguish between different pathologic conditions. Hypoxia describes a condition in which PaO2 is too low. Hypoxygenation describes the condition of inadequate saturation of hemoglobin with oxygen. Hypoxemia is a condition of inadequately low arterial oxygen content. Ischemia depicts a situation in which there is no oxygen supply due to an interruption of blood flow. Of note, hypoxemia can be either hypoxic of origin (i.e., due to a low PaO2 or a low SaO2), anemic (due to a low hemoglobin concentration) or toxic (due to the presence of abnormal hemoglobins). It is of clinical relevance that the tolerance for the different hypoxemias differ. In fact, an anemic hypoxemia is tolerated best as in anemia, 2,3-DPG concentrations rise and the hemoglobin dissociation curve is shifted to the right.
44
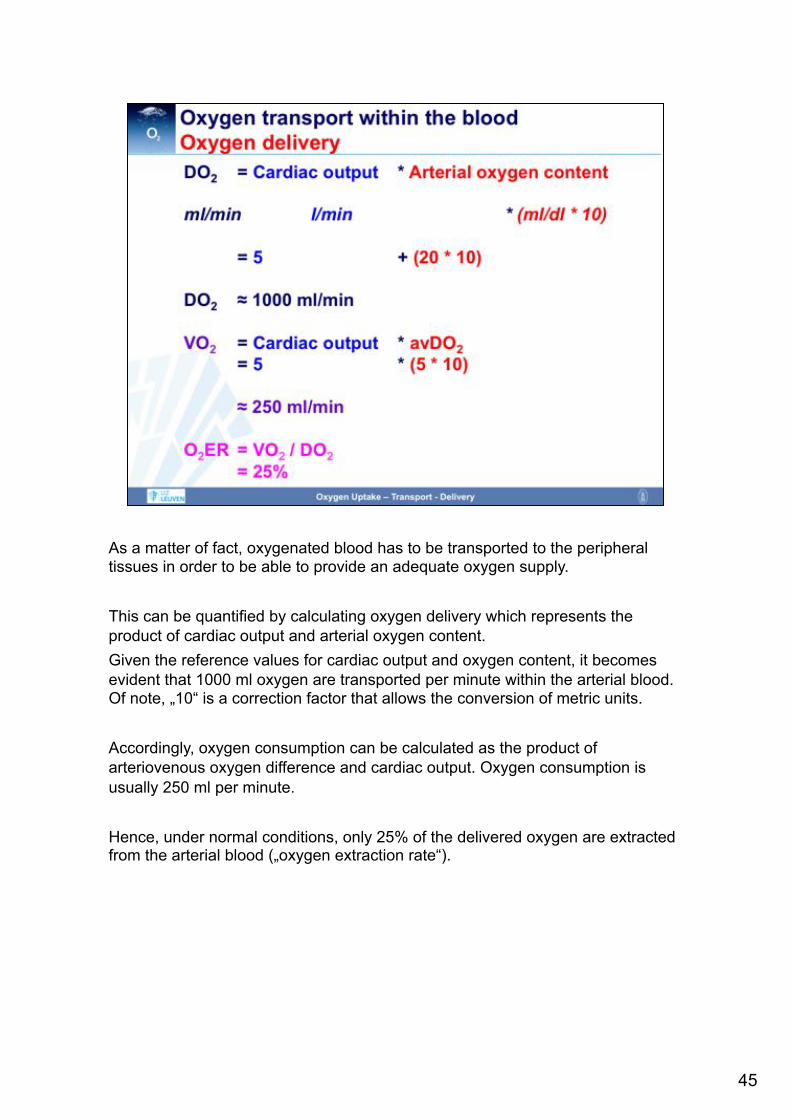
As a matter of fact, oxygenated blood has to be transported to the peripheral tissues in order to be able to provide an adequate oxygen supply. This can be quantified by calculating oxygen delivery which represents the product of cardiac output and arterial oxygen content. Given the reference values for cardiac output and oxygen content, it becomes evident that 1000 ml oxygen are transported per minute within the arterial blood. Of note, „10“ is a correction factor that allows the conversion of metric units. Accordingly, oxygen consumption can be calculated as the product of arteriovenous oxygen difference and cardiac output. Oxygen consumption is usually 250 ml per minute. Hence, under normal conditions, only 25% of the delivered oxygen are extracted from the arterial blood („oxygen extraction rate“).
45

As outlined above, oxygen extraction rate under normal conditions is very low. Hence, there is a considerable reserve for increasing the extraction rate. In fact, in conditions of an inadequately low oxygen delivery, the tissues respond with an increase in oxygen extraction. This is the only way to ensure oxygenation as oxygen consumption - at least initially – remains constant. The increase in oxygen extraction is reflected by a decrease in the oxygen content of the blood returning to the heart. This underlines the importance of central venous or mixed venous oxygen saturation in the estimation of the adequacy of oxygen delivery.
46

The very last step of the oxygen cascade is represented by the diffusion of oxygen from the capillaries to the cells. Also this process obeys to Fick‘s law (see above) and can be affected by several factors that are depicted on the slide. In particular, the diffusion distance is of major relevance. This explains why critically ill patients with a capillary leak and resulting interstitial edema are particularly prone to tissue hypoxia.
47

In summary, this figure comprehensively illustrates the oxygen cascade.
48

Understanding the major steps of the oxygen cascade helps us to target our therapeutic strategies that aim to prevent tissue hypoxia. In any case, a sufficient oxygen saturation has to be maintained, e.g. by administering oxygen, providing airway maintenance and ventilating the patient. In order to maximise oxygen delivery, cardiac output and hemoglobin concentration have to be optimized. Unfortunately, no therapeutic strategies are available at the moment that could specifically help to optimize oxygen delivery within the microcirculation or the oxygen uptake by the mitochondria. Of note, oxygen release from hemoglobin in the peripheral tissues is affected by the position of the hemoglobin dissociation curve which should receive more attention in our management strategies.
49

50

http://www.ld99.com/reference/old/text2878909-194.html
51

52