our vision - airports fiji limited & nadi international ...proof... · our vision to be the...
TRANSCRIPT


Our VisionTo be the world’s leading small
international airport and air traffic
management service provider whilst
protecting our heritage.
Our MissionTo ensure world-class airports and
air traffic management facilities and
services in the Fiji Islands that are
managed in a safe, secure and efficient
manner that meets ICAO standards,
exceeds customer expectations, and
provide a fair return on Shareholder’s
funds.
Our ValuesThese core values are equally important
in the pursuit of our corporate goals:
• Our People
• Stakeholders
• Teamwork
• Innovation
• Accountability
Our Vision,Mission andValues
ContentsLetter to the Minister 1
About Airports Fiji Limited 2
Year in Review
Year at a Glance 4
Executive Chairman’s Report 5
Operations Review 8
Corporate Governance
Board of Directors 14
Management Team 15
Corporate Governance Practices 16
Key Performance Indicators 19
2014 Financial Statement 21
2013 Financial Statement 56
2012 Financial Statement 64
Cover:The art gallery-like presentation of these artist’s impressions offer a tantalizing preview of the upgrade at Nadi International Airport before it fully opens to the traveller in mid 2016.
1
A i r p o r t s f i j i l i m i t e d A n n u A l r e p o r t s 2 0 1 2 - 2 0 1 4
Letter to the Minister
Airports Fiji Limited, AFL Compound, Namaka, NadiAirports Fiji Limited, Private Mail Bag, Nadi Airport, Fiji Islands
Ph: (679) 672 5777, (679) 672 5161Email: [email protected]
Website: www.airportsfiji.com
August 13, 2015
The Honourable Aiyaz Sayed-Khaiyum
Attorney-General and Minister for Finance, Public Enterprises, Public Service & CommunicationsLevel 7, Suvavou HouseVictoria ParadeSuva
Dear Honourable Minister
Airports Fiji Limited Annual Reports for 2012 - 2014
On behalf of the Directors of Airports Fiji Limited, I am pleased to present the Company’s Annual Report as required under Section 103 of the Public Enterprise Act, 1996.
The Report incorporates the Company’s operational achievements and audited accounts for the year ending December 2014. The audited accounts for the years 2012 and 2013 were presented at the AGM held on 20th December 2014. At this AGM, dividends for 2012 and 2013 were declared in the record sum of $5m for each year. However, key financial indicators for 2012 and 2013 are also incorporated .
Airports Fiji Limited recorded a net profit before tax of $14,129,206 for 2012, $16,023,913 for 2013 and $18,016,486 for 2014.
Airports Fiji Limited is undertaking significant capacity building to carry out major capital works to make our airports world class. Airports Fiji Ltd is also working hard to declare dividends to Government reasonable to Government’s investment levels.
On behalf of the Board of Directors and Management, I take this opportunity to thank you and the Government for its on-going support, and look forward to this continuing in 2015 and beyond.
Yours sincerely,
Faiz KhanExecutive Chairman

2
A i r p o r t s f i j i l i m i t e d A n n u A l r e p o r t s 2 0 1 2 - 2 0 1 4
Our Customersand PartnersOur customers and partners include our employees, passengers, the airlines, aviation regulators, the aviation industry as a whole, general public, tenants, service suppliers, transport operators, tourism operators and government agencies.
We cooperate with the Government on two fronts: Commercial returns and in terms of aviation policy, border control and safety regulations under the Civil Aviation Authority of Fiji (CAAF).
About Airports Fiji Limited
Who We AreAirports Fiji Limited (AFL) is a fully owned Government Commercial Company (GCC) that was established on 12 April 1999 under the Public Enterprises Act, 1996. It was formed following the reorganisation of the Civil Aviation Authority of Fiji (CAAF).
The Company reports to the Attorney General and Minister for Finance, Public Enterprises, Civil Aviation, Public Service & Communications for its commercial performance and Civil Aviation policy matters.
AFL owns and operates Nadi International Airport and manages Nausori Airport and 13 other domestic outer island airports on behalf of the Government.
AFL also provides Air Traffic Management (ATM) services in the Nadi Flight Information Region (Nadi FIR). This includes the air spaces of Fiji, Tuvalu, New Caledonia, Kiribati and Vanuatu, covering a 6.0 million square kilometres area.
Our BusinessAirports Fiji Limited’s core responsibilities are to:• Efficiently and in a regulatory compliant manner
carry out international, domestic and outer island airport operations.
• Efficiently and in a regulatory compliant manner carry out Air Traffic Management in the Nadi Flight Information Region and Fiji’s airspace.
• Provide world class duty free shopping experiences to our passengers.
• Provide reasonable returns to our shareholder in line with its level of investment.
• Continually invest and develop our ATM facilities, terminal and airfield pavement infrastructure to world class standards.
Nadi International Airport is the main international airport and Fiji’s gateway to the world. It handles 97% of international visitors to Fiji annually, 85% of which are tourists. The airport handles up to 31 international and 60 domestic flights a day equating to around 72,461 aircraft movements annually with 36,289 over-flights per year. Nadi International Airport generates 94% of AFL’s total revenue and 100% of its profits.
The total international passenger movements in 2014 were 1,758,939 whilst total domestic passengers were 225,959.
Nausori Airport is the second international airport and the domestic hub in Fiji. It handled 56,945 international passengers and 191,221 domestic passengers in 2014.
The 13 outer island airports are operated on a non–commercial basis supported by an annual capital grant provided by Government, pursuant to the provisions of the Public Enterprise Act of 1996. Total passenger movements at these airports in 2014 were 165,769 whilst aircraft movements were approximately 6,448.
AFL serves 26 regional and international airlines and connects Fiji to 23 cities in the region and internationally.

3
A i r p o r t s f i j i l i m i t e d A n n u A l r e p o r t s 2 0 1 2 - 2 0 1 4
Years 2012-2014 in ReviewAt a GlanceExecutive Chairman’s ReportOperations Review

4
A i r p o r t s f i j i l i m i t e d A n n u A l r e p o r t s 2 0 1 2 - 2 0 1 4
At a Glance:Key Financial Numbers
Movements from 2011 to 2014
Total international passenger movements
129,666 8%
Total aircraft traffic in the Nadi FIR and terminal navigation
19,975 20%
Revenue
4.142 million 6.9%
Expenditure
(1.632) million -3.0%
Net Profit before Tax
5.77 million 47%
Shareholder’s fund
29.956 million 20%
Return on Shareholder’s fund before social obligation
10.71% (2014) 10.28% (2013)10.05% (2012) 11.37% (2011)
(Income tax benefit in 2011).

5
A i r p o r t s f i j i l i m i t e d A n n u A l r e p o r t s 2 0 1 2 - 2 0 1 4
Executive Chairman’s Report
I am delighted to present the 2012, 2013 and 2014 Annual Report of Airports Fiji Ltd. In each of these three years AFL has achieved record profitability results, surpassing the results of each year preceding it. In other words, each year we delivered record profits.
The Government of Fiji, as the 100% shareholder in AFL, has been presented the audited financial returns every year on time. Dividends for 2012 and 2013 were declared at the AGM held with the shareholders. However, the Annual Reports were not furnished and are now compiled together for the three years between 2012 and 2014. Comparisons between the year ending 2011 and 2014 will be used for expediency in reporting the financials.
Three years of profits
In 2014 AFL recorded profit before tax of $18.02m compared to $12.24m in 2011, an increase of $5.77m or 47%. Due to changes in Fiji’s company tax regime where the tax rate was reduced from 28% to 20%, the year 2011 received tax credits from earlier years. The total tax paid in 2011 was $236,431 compared to $3,332,247 in 2014, thus making after tax basis comparisons distorted. For this reason, profit before tax is taken to give like-to-like comparisons.
Total revenue in 2014 was $64.37m compared to $60.22m in 2011, an increase of $4.15m or 6.9%. The 2014 results are particularly good when we consider that despite losing about 75% of commercial duty free space in international departures for construction, our revenues went up due to the commercial restructure we carried out even for the construction period.
A decrease in expenditure
Quite often an increase in revenue correlates with increases in expenditure. However, notably, operating expenditure significantly went down in this period. Despite giving a number of pay rises to our valuable staff the operating expenses (excluding depreciation) reduced by $2.32m between 2011 to 2014, a reduction of 6.4%.
These results show that our staff is getting more productive and achieving greater cost efficiencies. It also shows a greater sense of financial discipline in incurring operational expenditure. During this period of 2012 to 2014 we have discarded a number
of old mindsets. AFL had a ‘budget mentality’ in incurring expenditure – ‘if it was budgeted we had to spend it’. Now expenditure is incurred based on need and value propositions.
Cash flow positive
One of the greatest achievements in this period between 2012 and 2014 is AFL’s cash flow positiveness. Despite spending $18m in first up equity for the major Nadi Terminal upgrade and paying record $10m dividends to Government for years 2012 and 2013, AFL’s cash and cash equivalent position at the end of 2014 stood at a staggering $38.22m when compared to $20.74m in 2011. Again this result was achieved largely through a change in mindset where we now say ‘that we have unlimited money to spend on capital improvements for safety and commercial reasons; provided there is clarity of scope, deliverables and value for money to be spent’. The staff of AFL at all levels has to be applauded for this achievement.
In 2014, AFL also contributed $3.85m to its social obligations in operating and maintaining Nausori and its 13 other outer island airports.
The total shareholder’s equity grew to $173.06m in 2014 compared to $143.02m in 2011, an increase of $29.96m. The return on shareholder’s equity before social obligation stood at 10.71%.
Unprecedented financial position
AFL is in an unprecedented financial position of strength. In 2014 our interest cover ratio stood at 1,356. This means that for every dollar of interest we had 1,356 times profit. Our gearing ratio stood at a meagre 3.58%. This is the percentage of capital employed that is financed by debt and long term financing. It shows that AFL has a great appetite to borrow more and expand.
The record breaking results every year during the reporting period 2012-2014 show that AFL is continually improving and growing. However, to develop our airports to international world class standards for better customer satisfaction and greater boost to our tourism industry, we recognised that we needed to uplift ourselves out of average performances. Only then would we be able to truly develop to world-class standards, achieve our potential, grow capacities in our workforce, provide reasonable returns to our shareholder and become sustainable.

6
A i r p o r t s f i j i l i m i t e d A n n u A l r e p o r t s 2 0 1 2 - 2 0 1 4
IndicatorsYear 2010 2011 2012 2013 2014Revenue ($m) 55.611 60.223 62.952 63.834 64.366
EBIT ($m) 12.807 13.086 14.594 16.094 18.030
Total Assets ($m) 194.979 192.600 196.393 197.396 206.809
Return on Assets (%) 4.5 6.5 5.7 6.5 7.1
Shareholders Equity ($m) 130.112 143.102 154.527 167.632 173.058
Return on Shareholders Equity (%) 6.7 8.7 7.3 7.7 8.5
Dividends ($m) 1.0 1.0 5.0 5.0
Achieving market rentals
The $105 million major Nadi Airport Terminal Modernisation Project (NATMP) was born in this period of reporting in 2012 to 2014. Backed by the Government through the Airport (Development and Modernisation) Decree 2012, we were allowed to re-tender all of our concessions and tenancies to achieve market rentals that in turn would allow us to expand and develop our infrastructure to world class standards. Most tenancies at Nadi Airport were let out at rates even lower than rentals in nearby Namaka. Significant corrections were required.
Due to the risk of collusion with limited players in each area of airport tenancy operations, we adopted an approach of setting minimum commercial tenancy rates based on rentals in Namaka; the additional facilities provided at the airport for the tenants’ convenience; the number of passengers processed by the tenant, etc. During each of the tender processes we received bids in excess of the minimum AFL had provided. This justified the intent of the Government and AFL in re-tendering all spaces to achieve market rentals. In some tenancies we received bids from the market at a staggering 15 times of what the same tenant was previously paying.
Restructure increases revenue
The restructure of our aeronautical and non-aeronautical revenue was largely completed in 2014 but spilled over to around March 2015. Whilst I will leave details to future reports,
it is only fair that I report that the restructure was highly successful and will result in AFL’s total revenue increasing from around $60m to at least $120m by 2017, rapidly increasing in 2015 and 2016 with much improved profitability. The EBITDA is forecasted to increase to at least $80m by 2017.
Airport terminal upgrade
Undertaking the $105m NATMP, whilst keeping Nadi operational is no mean feat. The challenge was even greater considering that Nadi International Terminal is made up of three buildings constructed at different times over the last 70 years, with many more small upgrades since it was initially built. AFL did not have complete building documents of all past constructions and upgrades. This added considerable design risks.
Whilst we had many doubters, we have progressed well taking considerable risks. We could have chosen to do nothing and be content with the average results, but through Government’s guidance we chose to take calculated risks and develop. By any standards this requires courage, will, discipline and hard work. Each and every staff member of AFL is thanked for their contributions and support.
The upgraded terminal will feature an elegant high-ceilinged brand new departure check-in terminal, world class duty free brands by our core duty free operators in Tappoo and Prouds, food and beverages (Burger King, Gloria Jeans and local Lulu Café), spacious lounges, kids play area, VIP airline lounges by Fiji Airways and Air New Zealand, a prayer room and splendid views to the Nadi Bay. The design aims to achieve as much natural light as possible noting the constraints
of upgrading an existing infrastructure. Nadi will also aim at monitoring end-to-end passenger movements to reduce security waiting times, improve commercial revenues and enhance passenger experiences.

7
A i r p o r t s f i j i l i m i t e d A n n u A l r e p o r t s 2 0 1 2 - 2 0 1 4
Financial engine for growth
Nadi International Airport is the financial engine for growth of our 14 other airports. It processed in excess of 1.7 million international passengers in arrivals and departures in 2014. With the growth forecasts of Fiji Airways, Air New Zealand, Virgin, Jet Star, Korean Air and all of our customers; combined with the hotel developments in Fiji; we will need an international Terminal 2 in about 10 years’ time. In the meantime, over the next two years the pavement strengths in some apron areas will be improved and the temporary domestic terminal will be upgraded to allow more international, regional and domestic aircraft parking. There are also a number of other ATM navigation and safety upgrades, runway resealing, private jet parking, a transit hotel, the Nausori terminal and runway upgrade, airport city development at AFL compound and other possibilities in the pipeline. These are challenging yet exciting times.
With huge capital projects planned in years to come, made possible through the revenue restructure done in this period of reporting, AFL needs to plan its investments and deliver value for money investments. An in-house project management capacity building drive with the help of some experts is already underway.
Increase in dividends
As mentioned earlier AFL declared $5m dividends to Government in 2012 and another $5m in 2013 at the AGM held with the shareholders. These dividend payouts are unprecedented when compared to the meagre $1m a year dividends declared in years gone by. The dividend payouts are likely to grow significantly further for the financial year 2014, and beyond. This reflects a change in culture and mindset where as a State Owned Enterprise we will start declaring dividends that are reasonable to the level of investments that Government has put into AFL over the last century.
Safety and security
AFL continues to comply with international and national regulatory standards of safety and security. Safety is the number one priority at all of our airports. Air traffic controllers, security officers, fire fighters, airside officers and safety
officers must meet ICAO standards and be issued with relevant licenses by CAAF. We want to be the leaders in the Pacific in technological advancements in aviation safety, airfield maintenance and upgrades. The AFL Aviation Academy has been given a busy programme for the next two years in not just training more controllers for AFL but in training students from Tonga, Samoa, Solomon Islands, Vanuatu, Tuvalu, Wallace and Futuna, New Caledonia, Nauru, Cook Islands, etc as required. AFL aims to build strong and lasting relationships with all of our South Pacific Island neighbours.
With gratitude
I would like to thank former Chairman Adrian Sofield who left us in September 2012 to focus on his private business; former CEO Tony Gollin who returned to New Zealand in November 2012 for personal reasons; former fellow directors Greg Lawlor and Samuela Tamani whose terms expired at the end of 2012 and in April, 2014 respectively, for their invaluable contributions.
I would also like to thank my fellow new directors Geoffrey Shaw, Xavier Riyaz Khan and Ratu Wiliame Katonivere who have spent considerable time and energy in re-defining the vision for AFL. I would like to thank them for their hard work and immense contributions. An integral part of our vision is capacity building and training of our staff.
I could not announce such phenomenal results for the period 2012-2014 and the forecasts for future years through the revenue restructures achieved in this period, without the buy-in, exceptional contribution and support of staff at all levels of Airports Fiji Ltd. Each and every one of you deserves a pat on your back. You have created the foundation for AFL to reach unimaginable heights in years to come. The rise will be meteoric.
Well done, a big VinakaVakalevu and God Bless!
Faiz KhanExecutive Chairman

8
A i r p o r t s f i j i l i m i t e d A n n u A l r e p o r t s 2 0 1 2 - 2 0 1 4
Operations Review
Our People
Our people are our greatest strength. This belief is based on our philosophy and change in mindset that SOP’s and Manuals do not run an organisation; people do. People take risks to deliver large projects; people communicate and coordinate with key stakeholders; people make routine and complex decisions and every staff member of AFL plays different roles to contribute to our results.
In 2013 AFL implemented the Hay Group Job Evaluation recommendations for increase in pay of AFL staff. Thereafter, the Board of AFL has carried out a number of reviews of departmental structures, pay, working conditions and benefits. This was done with a view to improving productivity, charting career progression paths for individuals, having succession planning and promoting overall health and enthusiasm of the human beings that drive AFL. Executives spend a considerable amount of energy in identifying young talents in each department and work with them to allow growth. This is one of the KPI’s of all executives.
The Board of AFL has also increased the drive for more and more training of our staff. In many instances staff that attend training go abroad for the first time. The experience they gain in training and seeing different ways of life and culture immensely assists them in broadening their horizons.
One of the keys to AFL’s success and growth in future will be its ability to continually upgrade its capital infrastructure in the air navigation, terminal experience, airfield pavement etc. To be able to effectively carry out these developments AFL is working hard to build its human capital capacity to manage projects. In the past many upgrades have been unsuccessful due to AFL’s lack of internal capability to assess and monitor projects.
We hope in the near future we have leaders everywhere in the organisation, no matter how high or low within the hierarchy they sit.
Between the years 2012 to 2014 AFL had the following staffing levels:
Commercial Activities
2014 saw a hive of commercial activities at AFL due to the tendering processes for almost all concessions arising out of the major Nadi Airport Terminal Modernisation Project. Competition was high as the tendering process provided an opportunity to many businesses to bid. At the end of the tender process we saw many incumbents succeeding, whilst some lost out. Building new relationships with the incoming tenants is sometimes a lot easier than maintaining relationships with incumbents who fail. The latter has been quite a challenge for AFL but we believe we have maintained old and established new relationships with all bidders.
During the tender process we had made it clear to the market that we wanted the image of food and beverages outlet and duty free shopping to change after the upgrade. The market did not disappoint us. Burger King, Gloria Jeans, Lulu Café, Viva Pizzeria and Cuppabula were major winners in the bidding process for F&B outlets. Tappoo and Prouds will remain as the core duty free operators and will provide a larger variety of high to medium end duty free shopping products.
In foreign exchange Westpac comes in place of ANZ, City Forex and Fexco will join Westpac, Digicel will join Vodafone at the airport arrivals, 7 car rental booths will provide structured service to passengers and a number of new inbound tour operators come in.
The market also did not disappoint us in bidding rates that were multi-fold higher than what was paid in the past. A couple of successful bids were around 15 times what the same tenant paid in the past. This was mainly a result of the rentals at Nadi International Airport being historically low, even lower by far than the neighbouring Namaka commercial spaces in many instances. The bidding process provided this correction from the market.
After completion of Nadi Airport Terminal Upgrade, our focus will shift to many other areas such as a transit hotel, AFL housing estate restructure and Wailoaloa beachfront land development for example.
Compliance
AFL has matured its Safety Management System to ensure that it complies, if not exceeds, international and national
Number of Staff 2012 2013 2014
520 520 485

9
A i r p o r t s f i j i l i m i t e d A n n u A l r e p o r t s 2 0 1 2 - 2 0 1 4
regulatory standards of safety and security, and has established safety action groups within each of the 17 certificated areas of operation. This maturity has seen the establishment of information databases and with that, the target levels of safety required by ICAO in a number of key safety areas, including wildlife management, maintenance performance, rescue fire standards and in the compliance with air traffic control standards. With General Managers’ Key Performance Indicators including closure of compliance issues, there is increased participation in meeting these goals.
All AFL Aviation Security Officers must meet ICAO standards, and are qualified in the Screeners Test Programme and the International Security Training Programme STP123.
Air Navigation Services (ANS) Facilities & Aerodrome and Ground Aids (AGA)
There were no system replacements on the ANS facilities, security systems and passenger screening facilities. However there were continuous Air Traffic Management (ATM) AURORA adaptation upgrades and most recently, Software Release 2 (SR2) upgrade on the COMSOFT Aeronautical Telecommunication Network (ATN) system, allowing for AFL’s efficient management of the Nadi Flight Information Region (FIR).
An AFL project team is currently working on the replacement of the VHF and Voice Switch System, Automated Weather Observing System (AWOS) and the Instrument Landing System (ILS).
The 11 ADS-B ground stations are being monitored for their reliability and integrity with Air Situation Displays (ASD) placed
in the Nadi and Nausori Towers to allow Air Traffic Controllers to sight traffic operating in the domestic airspace.
Two major projects were undertaken by AFL’s Electrical and Mechanical section. The first was the restoration project on the Low Intensity Approach Lights for RWY09, a system that extends for 420m into the Nadi Bay. This simple approach lighting system is a visual aid system to assist approaching aircraft during night operations and low visibility to align with the centre line of RWY09. Seventeen new poles were installed to prop up the new light fittings and aerial power cables as a result of damage inflicted by Cyclone Evan.
The second and significant project was the installation of the Approach Lighting System (ALS) to RWY10 at Nausori Airport. This lighting system consists of a series of red omni-directional lights that extend 420m from the threshold end of the runway. This lighting system, which provides additional cues to assist pilots to judge distance and alignment to the runway for landing, has in turn opened opportunities for Fiji Airways to conduct B737 night operations into Nausori Airport.
In light of ICAO’s strategic objective for Safety, Air Navigation Capacity and efficiency and environmental protection AFL is developing its ANS/AGA Plan aligned to the Global Air Navigation Plan (GANP) and Global Air safety Plan (GASP) to incorporate ICAO initiatives. AFL has submitted and is updating its Performance Based Navigation (PBN) plan, Aeronautical Information Services (AIS) to Aeronautical Information Management (AIM) plan and Search & Rescue (SAR) plan to the ICAO regional office to ensure that Fiji synchronises with regional deployment timelines.

10
A i r p o r t s f i j i l i m i t e d A n n u A l r e p o r t s 2 0 1 2 - 2 0 1 4
Environmental Impacts
Critical to the future success and development of airports is the need to understand how their operations impact the environment and identifying solutions to mitigate these impacts. To address this, the first ever Environmental Management System for AFL has been created and is being implemented with environmental audit non-compliances and hazards addressed through SMS.
Climate change and carbon emission management are at the top of the agenda in the aviation industry with ICAO advocating quantification of carbon emissions. CAAF, in collaboration with AFL, has created the “Fiji State Action Plan for the Reduction of Aviation Greenhouse Gas Emissions” focusing on establishing baseline carbon emissions for 2010. The Environment Officer
is carrying out a thesis research on 2014 emissions at Nadi
International Airport with the goal of establishing its Carbon
Footprint as well as creating a Carbon Inventory that would
enable the Airport to get certification under the Airport Carbon
Accreditation Scheme.
Wildlife management continues to be a dynamic field of
research and performance indicators for birdstrikes have now
been established for all airports. The move from controlling
wildlife on airports through conventional measures to creating a
greater understanding of species behaviour has been addressed
through the much-awaited Avisure Wildlife Management
Training in 2015. There are plans to run this course in-house for
pilots, air traffic controllers and wildlife personnel at the AFL
Academy.

11
A i r p o r t s f i j i l i m i t e d A n n u A l r e p o r t s 2 0 1 2 - 2 0 1 4
Safety
Safety audits were completed for the two International and 13 domestic airports managed by AFL resulting in the granting of certificates by the regulator. Compliance items from these audits have been addressed in a timely manner to ensure that risks are mitigated.
The Civil Aviation Authority of Fiji under Regulation 145 certified AFL as a provider for Air Traffic Services, Aviation Training, Aeronautical Information Services, Search and Rescue Services and also as an Aviation Maintenance Organisation. This aligns AFL to best practises established by the International Civil Aviation Organisation and regulated by CAAF. AFL Officers providing services under these disciplines are licenced under the requirement of ICAO’s Annex 1 and the CAAF Standards Documents.
AFL Officers, including Rescue Fire Officers who access the manoeuvring area are, now licenced under the Aeronautical Station Operators Licence requirements that standardises operations and ensures safety in this operational area, which is an area of concern for ICAO, that is, aerodrome safety.
As an Aeronautical Information Service Provider, AFL has the capability to produce maps and charts for aviation, a function that was previously outsourced. In line with the AIS to AIM transition, the AFL team is establishing the data
that will ensure that all charts and maps produced will establish procedures that have integrity and accepted as safe by aviation stakeholders including CAAF.
AFL Aviation Academy
AFL Aviation Academy was established in 2011 and certified as an Aviation Training Institute (ATI) in mid-2012 by the Civil Aviation Authority of Fiji (CAAF). The Academy includes training in Safety Management Systems (SMS), aviation security, aviation rescue fire fighting and Air Traffic Services (Air Traffic Control Service and Flight Information Service).
Since its inception to date, it has conducted a total of 139 courses in various aviation related disciplines under its banner. Apart from training Air Traffic Controllers for AFL, the Academy has extended training to assist regional students from the Solomon Islands, Vanuatu, Tuvalu, Wallis and Futuna, New Caledonia, Tonga and Samoa. In 2013 and 2014 respectively, two Tuvaluan women students were granted licences by CAAF to operate as Aerodrome Flight Information Services Officers at Labasa Airport. This mode of training from the Academy to Operations in one of AFL’s operational theatres provides regional students with the required exposure before their return.
The Academy has a very busy programme for the next two years to ensure that staffing numbers are increased to adequately maintain the overall safety of AFL operations and to allow greater opportunities for capacity building training of all staff.

12
A i r p o r t s f i j i l i m i t e d A n n u A l r e p o r t s 2 0 1 2 - 2 0 1 4
Key Statistics
50000
Num
ber o
f Lan
ding
s
35,8
57
35,3
91
32,2
38
32,0
18
36,5
78
2010 2011 2012 2013 2014
40000
20000
30000
10000
0
Total Domestic Aircraft Movement
14000
Num
ber o
f Lan
ding
s
2010 2011 2012 2013 2014
12000
8000
10000
6000
4000
2000
0
International Aircraft Movement
10,0
72
10,6
96
10,9
99
11,3
52
12,5
22
100000
Num
ber o
f Lan
ding
s
2010 2011 2012 2013 2014
80000
40000
60000
20000
0
Total Aircraft Movement
81,5
22
71,9
94
78,4
09
78,3
80
91,6
91
250000
Num
ber o
f Pas
seng
ers
2010 2011 2012 2013 2014
200000
100000
150000
50000
0
Total Passenger Movements
1,993
,892
2,23
1,172
2,13
0,31
0
2,21
6,85
4
2,39
8,83
2
1,412
,499
1,686
,217
1,692
,052
1,723
,859
1,815
,883
250000
Num
ber o
f Pas
seng
ers
2010 2011 2012 2013 2014
200000
100000
150000
50000
0
Total International Passengers
600000
Num
ber o
f Pas
seng
ers
2010 2011 2012 2013 2014
400000
500000
200000
300000
100000
0
Total Domestic Passengers
581,3
93
544,
955
438,
258
492,
995
582,
949
Year 2010 2011 2012 2013 2014Passenger MovementsInternational Arrivals 680,638 812,433 813,044 829,285 880,611
International Departures 681,890 821,047 825,407 839,858 877,850
Transits & Transfers 49,971 52,737 53,601 54,716 57,422
Total Int’l Passengers 1,412,499 1,686,217 1,692,052 1,723,859 1,815,883
Domestic Arrivals 290,885 272,270 220,243 246,705 292,682
Domestic Departures 290,508 272,685 218,015 246,290 290,267
Total Domestic Passengers 581,393 544,955 438,258 492,995 582,949
Total Passenger Movements 1,993,892 2,231,172 2,130,310 2,216,854 2,398,832
Growth % on Total Pass 5.5% 11.9% -4.5% 4.1% 8.2%
Growth % on International Pax 14.5% 19.4% 0.3% 2% 5%
Aircraft MovementsInt’l aircraft Landing 10,072 10,696 10,999 11,352 12,522
Domestic aircraft Landing 35,857 35,391 32,238 32,018 36,578
Other 28,403 25,907 35,172 35,010 42,591
Total aircraft landings 81,522 71,994 78,409 78,380 91,691
Growth% -19.8% -11.7% 8.9% -0.0% 17.0%
MCTOW (Maximum certified take-off weight)International MCTOW 733,071 688,943 672,584 678,524 678,710
Domestic MCTOW (Nadi/Nausori) 169,960 147,790 136,544 148,027 152,736
Regional Airport MCTOW 47,104 42,381 37,321 45,126 43,097
Total MCTOW 950,135 879,114 846,449 871,677 874,543
Growth% 9.2% -7.5% -3.7% 3.0% 0.3%
Air Navigation Service UnitsAir Navigation Service Units 2,831,166 2,902,721 2,984,252 3,155,313 3,192,107
Growth% 12.4% 2.5% 2.8% 5.7% 1.2%
Passenger & Aircraft Statistics

13
A i r p o r t s f i j i l i m i t e d A n n u A l r e p o r t s 2 0 1 2 - 2 0 1 4
Corporate GovernanceBoard of DirectorsManagement TeamCorporate Governance PracticesFinancial Review

14
A i r p o r t s f i j i l i m i t e d A n n u A l r e p o r t s 2 0 1 2 - 2 0 1 4
Faiz KhanExecutive Chairman
Geoffrey ShawDirector
Ratu Wiliame KatonivereDirector
Xavier Riyaz KhanDirector
Board of Directors

15
A i r p o r t s f i j i l i m i t e d A n n u A l r e p o r t s 2 0 1 2 - 2 0 1 4
Moagrava ElaisaManager Airport Security Services
Waqa TaukeiManager Electrical &Mechanical Services
Janaka KumaraGeneral Manager Engineering and Infrastructure
Faiz KhanExecutive Chairman
Ilimeleki NavulaActing Manager Air Traffic Management
Rohit PrasadSenior Management Accountant/Acting Board Secretary
Abdul ShaheedManager Aviation Rescue Fire Fighting Services
Apenisa NagatalevuManager Airside Operations
Sanjana MishraSenior Financial Accountant
Vula SeruOperations Manager Outerstation
Gayanand SinghManager Human Resources and Training
Mere Lutuciri WilliamsActing Manager Commercial
Isei TudreuGeneral Manager Air Traffic Management and Aviation Training
Dhanjay KumarManager Fleet Services
Molly MurphyManager Safety and Risk Management
Joe Saiasi Marquardt GrayManager Airport Landside Operations and Customer Services
Vincent Vinesh KumarAirport Manager Nausori
Management Team

16
A i r p o r t s f i j i l i m i t e d A n n u A l r e p o r t s 2 0 1 2 - 2 0 1 4
Corporate Governance Practices
Role of the Board
The Board is responsible for AFL’s strategic direction, setting objectives for infrastructure upgrades, developing a fair framework for human resources, setting clear goals and mechanisms to monitor performance.
Amongst its responsibilities, the Board also reviews the yearly business plan, corporate plan, operating and capital budgets and non-budgeted capital expenditure.
Many of the plans implemented over the last couple of years has seen a remarkable turnaround in profits, cash flows and capital project deliveries.
Composition of the Board
As at 31st December 2014 the Board is comprised of Executive Chairman Faiz Khan and three non-executive independent directors: Geoffrey Shaw, Xavier Riyaz Khan and Ratu Wiliame Katonivere. The Ministry of Public Enterprises appoints the directors. Under the articles of AFL the maximum number of directors are seven unless otherwise specified by the Ministry of Public Enterprises.
Directors Code of Conduct
The establishment of a Corporate Code of Conduct and Ethics
is designed to promote honest and ethical conduct, including
ethical handling of conflicts of interest; full, fair, accurate, timely
and understandable disclosure in the Company’s periodic
reports, and compliance with applicable Governmental rules
and regulations. The Board periodically reviews and assesses
the adequacy of the Code of Ethics and implements any
modification as necessary.
Duties of Directors
The role of the directors is defined in sections 32 and 57 of the
Public Enterprise Act. The key responsibility of the directors is
provided under section 43 that states:
• The principal objective of every Government Commercial
Company (GCC) is to operate as a successful business, and,
to this end, to be as profitable and efficient as comparable
businesses that are not owned by the state.
The principal objective of every GCC is to be achieved through
the application of the key principles of public enterprise reforms.
At work out of the Boardroom.

17
A i r p o r t s f i j i l i m i t e d A n n u A l r e p o r t s 2 0 1 2 - 2 0 1 4
The Board of Directors is also bound by section 6.13 of the Articles of the Company, and the individual terms of their respective contract letters.
Statutory Duties of the Board
In addition to the above, the Board of Directors of AFL, collectively and individually, has agreed on the fulfillment of the following duties towards the Company:• To exercise the care and diligence of a reasonable person;• To exercise their power and discharge their duties in good
faith and for a proper purpose;• To refrain from improper use of their position for personal
gain, and• To refrain from making use of inside information for personal
gain.
Fiduciary Duties of Directors
The directors of AFL also owe the following fiduciary duties to the Company. These fiduciary duties form the Code of Ethics of AFL.
A fiduciary relationship imposes an obligation of utmost good faith on the directors by putting the interests of the Company first, and the AFL directors have pledged to uphold this principle at all times.
The fiduciary duties of the directors have the following four dimensions:
• To act in good faith in the best interests of the company; • To exercise powers for a proper purpose; • To retain discretion;• To avoid conflict of interest.
Board Meetings
The Board held seven regular meetings during the financial year ended 31 December 2014 and one special meeting. The regular business of the Board during its meetings covers corporate governance, financial performance and risk management, business investments and strategic matters.
Directors’ Remuneration
As per section 5.6 of the Company’s Articles of Association, the Minister for Public Enterprise retains the ultimate authority to determine the remuneration and benefits given to the directors of the Company.
A total fee of $45,941 was paid to the directors for their services during the year in accordance with the remuneration and benefits determined by the Minister of Public Enterprise. A further sum of $25,881 was paid for other expenses, mainly for travel and accommodation that were incurred during the course of their duties. Directors were also covered under the Directors and Officers Insurance Policy.

18
A i r p o r t s f i j i l i m i t e d A n n u A l r e p o r t s 2 0 1 2 - 2 0 1 4
Fiji Airways - AFL’s major customer.

19
A i r p o r t s f i j i l i m i t e d A n n u A l r e p o r t s 2 0 1 2 - 2 0 1 4
Key Performance Indicators
Financial Trend Analysis to December 2014
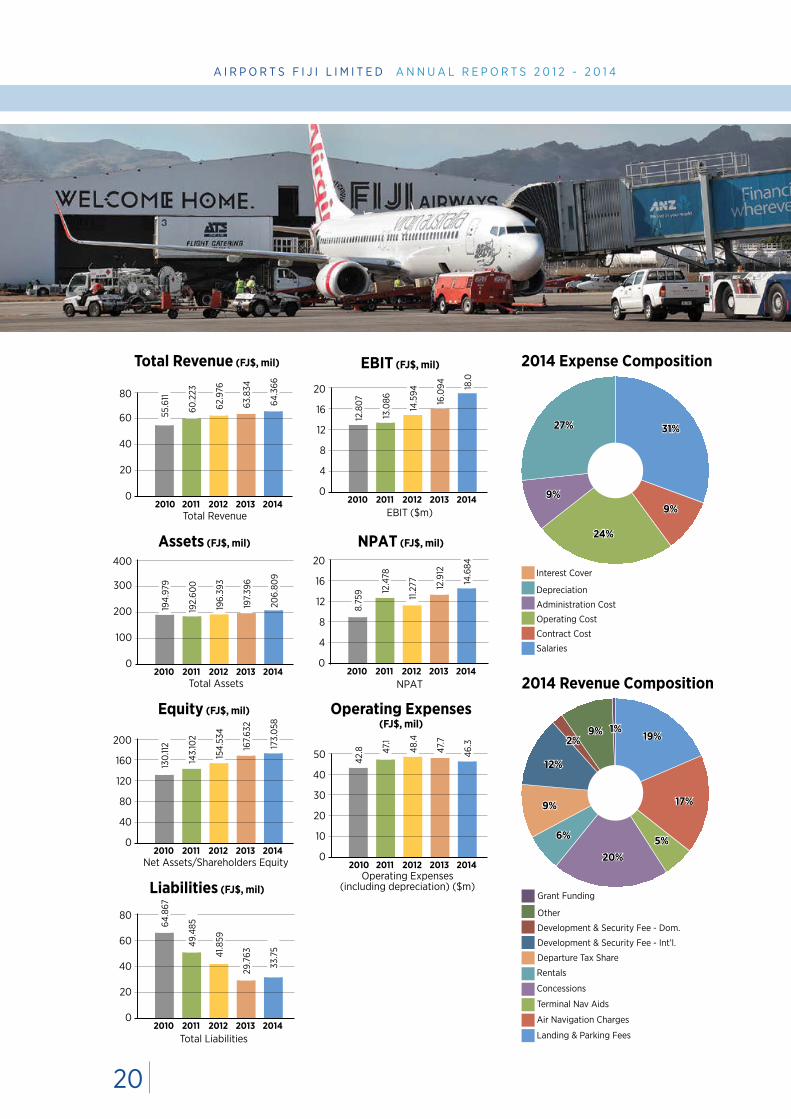
Year 2010 2011 2012 2013 2014Revenue ($m) 55.6 60.2 63.0 63.8 64.4
Operating Expenses(Including depreciation) ($m) 42.8 47.1 48.4 47.7 46.3
EBIT ($m) 12.8 13.1 14.6 16.1 18.0
Cash from Operations ($m) 21.5 9.7 19.4 20.0 26.7
Return on Assets (%) 4.5 6.5 5.7 6.5 7.1
Return on Equity (%) 6.7 8.7 7.3 7.7 8.5
Debt/Equity Ratio (%) 13.2 9.8 4.9 0.9 4.1
Current Ratio (Times) 1.6 1.9 2.3 5.3 3.9
Interest Cover (Times) 10.8 15.5 31.4 229.7 1356.1
Total Int’l Passengers (million) 1.41 1.69 1.69 1.7 1.8
Year 2010 2011 2012 2013 2014 $m $m $m $m $m
INCOME STATEMENT
Total Revenue 55.6 60.2 63.0 63.8 64.4
Total Expenses excludingDepreciation and Interest 30.9 35.4 36.1 35.0 33.9
Depreciation 11.9 11.7 12.2 12.7 12.4
EBIT 12.8 13.1 14.6 16.1 18.0
Interest Costs 1.18 0.84 0.46 0.07 0.01
Income Tax Expense 2.9 0.2 2.9 3.1 3.3
NPAT 8.8 12.5 11.3 12.9 14.7
Dividends Paid 1.0 1.0 5.0 5.0
BALANCE SHEET
Total Assets 195.0 192.6 196.4 197.4 206.8
Total Liabilities 64.9 49.5 41.9 29.8 33.8
Net Assets/Shareholder’s Equity 130.1 143.1 154.5 167.6 173.1
REVENUE COMPOSITION
Landing and Parking Fees 12.8 12.2 11.9 12.1 11.9
Air Navigation Charges 10.3 10.3 10.3 11.0 11.1
Terminal Nav Aids 3.0 3.4 3.3 3.3 3.3
Concessions 11.6 12.8 12.7 12.4 12.9
Rentals 2.7 3.6 4.3 4.0 4.0
Departure Tax Share 2.8 4.6 6.2 5.8 5.9
Development & Security Fee - Int’l 6.6 6.9 7.3 7.6 7.8
Development & Security Fee - Dom. 0.8 1.2 1.2
Other 4.8 5.6 5.8 6.1 5.9
Grant Funding 0.9 0.8 0.4 0.3 0.3
Total 55.6 60.2 63.0 63.8 64.4
EXPENSE COMPOSITION
Salaries 12.5 13.6 14.1 14.3 14.2
Contract Cost 2.7 3.2 3.3 4.1 4.3
Operating Cost 10.9 13.3 13.3 12.2 11.3
Administration cost 4.8 5.3 5.5 4.3 4.1
Depreciation 11.9 11.7 12.2 12.7 12.4
Interest 1.2 0.8 0.5 0.1 0.01
Total 44.0 48.0 48.8 47.8 46.3
20
A i r p o r t s f i j i l i m i t e d A n n u A l r e p o r t s 2 0 1 2 - 2 0 1 4
200
Net Assets/Shareholders Equity2010 2011 2012 2013 2014
160
80
120
40
0
Equity (FJ$, mil)
130.
112
143.
102
154.
534
167.
632
173.
058
400
Total Assets2010 2011 2012 2013 2014
300
200
100
0
Assets (FJ$, mil)
194.
979
192.
600
196.
393
197.
396
206.
809
20
EBIT ($m)2010 2011 2012 2013 2014
16
12
8
4
0
EBIT (FJ$, mil)12
.807
13.0
86
14.5
94
16.0
94 18.0
Total Revenue (FJ$, mil)
80
Total Revenue2010 2011 2012 2013 2014
60
40
20
0
55.6
11
60.2
23
62.9
76
63.8
34
64.3
66
Interest Cover
Grant Funding
Depreciation
Other
Administration Cost
Development & Security Fee - Dom.
Operating Cost
Development & Security Fee - Int’l.
Contract Cost
Departure Tax Share
Salaries
Rentals
Concessions
Terminal Nav Aids
Air Navigation Charges
Landing & Parking Fees
2014 Expense Composition
2014 Revenue Composition
50
Operating Expenses(including depreciation) ($m)
2010 2011 2012 2013 2014
40
30
10
20
0
42.8 47
.1
48.4
47.7
46.3
Operating Expenses(FJ$, mil)
20
NPAT2010 2011 2012 2013 2014
16
12
4
8
0
NPAT (FJ$, mil)
8.75
9 12.4
78
11.2
77 12.9
12
14.6
84
80
Total Liabilities2010 2011 2012 2013 2014
60
20
40
0
Liabilities (FJ$, mil)
64.8
67
49.4
85
41.8
59
29.7
63
33.7
5
31%
19%
17%
5%20%
6%
9%
12%
2%9% 1%
9%
24%
9%
27%

21
A i r p o r t s f i j i l i m i t e d A n n u A l r e p o r t s 2 0 1 2 - 2 0 1 4
Financial StatementsFor the Year Ended 31 December 2014
ContentsDirectors’ report 22
Auditor’s report 24
Statement of comprehensive income 26
Statement of changes in equity 27
Statements of financial positions 28
Statement of cash f lows 29
Notes to and forming part of the Financial Statements 30 - 53
Disclaimer on additional financial information 54
Detailed Financial Information 55

22
A i r p o r t s f i j i l i m i t e d A n n u A l r e p o r t s 2 0 1 2 - 2 0 1 4
Director’s ReportFOR THE YEAR ENDED 31 DECEMBER, 2014
The Board of Directors present their report together with the financial statements of Airports Fiji Limited for the year ended 31 December 2014 and the auditor’s report thereon.
DirectorsThe directors of the Company in office during the year and up to the date of this report are:Mr. Faiz Khan (Executive Chairman) Mr. Geoffrey N. Shaw (appointed on 29 May 2014)Mr. Samuela Tamani (resigned 13 April 2014) Mr. Wiliame Katunivere (appointed on 30 May 2014)Mr. Xavier Riyaz Khan
State of affairsIn the opinion of the directors, the accompanying statement of financial position gives a true and fair view of the state of affairs of the Company as at 31 December 2014 and the accompanying statement of comprehensive income, statement of changes in equity and statement of cash flows give a true and fair view of the results of the Company for the year then ended.
Principal activityThe principal activities of the Company during the financial year included provision of air navigation services, the operation and management of the Nadi International Airport and other airports throughout Fiji.
Trading resultsThe net profit of the Company for the year was $14,684,239 (2013: $12,911,816) after taking into account an income tax expense of $3,332,247 (2013: $3,112,097).
DividendDuring the year, the directors declared and paid dividends amounting to $10,000,000 (2013: $Nil).
ReservesThe directors recommend that no amounts be transferred to reserves within the meaning of the Seventh Schedule of the Fiji Companies Act, 1983.
Current assetsThe directors took reasonable steps before the Company’s financial statements were made out to ascertain that the current assets of the Company were shown in the accounting records at a value equal to or below the value that would be expected to be realised in the ordinary course of business.At the date of this report, the directors are not aware of any circumstances which would render the values attributable to the current assets in the financial statements to be misleading.
ReceivablesThe directors took reasonable steps before the financial statements were made out to ascertain that all known bad debts were written off and adequate allowance was made for impairment losses.At the date of this report, the directors are not aware of any circumstances which would render the above assessment inadequate to any substantial extent.
Related party transactionsAll related party transactions have been adequately recorded in the financial statements.
Other circumstancesAt the date of this report, the directors are not aware of any circumstances not otherwise dealt with in this report or the financial statements which would render any amounts stated in the accounts to be misleading.

23
A i r p o r t s f i j i l i m i t e d A n n u A l r e p o r t s 2 0 1 2 - 2 0 1 4
Director’s Report (cont’d)
FOR THE YEAR ENDED 31 DECEMBER, 2014
Unusual circumstancesThe results of the Company’s operations during the financial year have not, in the opinion of the Directors, been substantially affected by any item, transaction or event of a material and unusual nature other than those disclosed in the financial statements.
Events subsequent to balance dateThere has not arisen in the interval between the end of the financial year and the date of the report any item, transaction or event of a material and unusual nature likely, in the opinion of the directors, to affect significantly the operations of the Company, the results of those operations or the state of affairs of the Company in subsequent financial years.
Dated at _____________ this __________day of ______________ 2015.Signed in accordance with a resolution of the Board of Directors.
_____________________ _____________________Director Director

24
A i r p o r t s f i j i l i m i t e d A n n u A l r e p o r t s 2 0 1 2 - 2 0 1 4
File’ 1263
11 June2015
The Chairman of the BoardAirports Fiji LimitedPrivate Mail BagNadI AIRPORTDear Sir
AIRPORTS FIJI LIMITEDFINANCIAL STATEMENTS
FOR THE YEAR ENDED 31 DECEMBER 2014
Audited financial statements for the Airports Fiji Ltd for the year ended 31 December 2014 together with my audit report on them arc enclosed.
Particulars of the errors and omissions arising from the audit have been forwarded to the management of the company for their actions.
Yours sincerely
Atunaisa Nadakuitavukifor AUDITOR GENERALEncl.
Independent Audit ReportFOR THE YEAR ENDED 31 DECEMBER, 2014
8th Floor, Ratu Sukuna House,MacArthur Street,
P.O.Box 2214,Government Building
Suva, Fiji Islands
Telephone: (679) 330 9032Fax: (679) 330 3812
Email: [email protected]: http://www.oag.gov.fj
REPUBLIC OF FIJIOffice Of the AuditOr GenerAl
Excellence in Public Sector Auditing

25
A i r p o r t s f i j i l i m i t e d A n n u A l r e p o r t s 2 0 1 2 - 2 0 1 4
Statement by DirectorsFOR THE YEAR ENDED 31 DECEMBER, 2014
In the opinion of the directors of Airports Fiji Limited:
(a) the accompanying statement of comprehensive income of the Company is drawn up so as to give a true and fair view of the results of the Company for the year ended 31 December 2014;
(b) the accompanying statement of changes in equity of the Company is drawn up so as to give a true and fair view of the changes in equity of the Company for the year ended 31 December 2014;
(c) the accompanying statement of financial position of the Company is drawn up so as to give a true and fair view of the state of affairs of the Company as at 31 December 2014;
(d) the accompanying statement of cash flows of the Company is drawn up so as to give a true and fair view of the cash flows of the Company for the year ended 31 December 2014;
(e) all related party transactions have been adequately recorded in the books of the Company; and
(f) at the date of this statement, there are reasonable grounds to believe the Company will be able to pay its debts as and when they fall due.
Dated at _____________ this __________day of ______________ 2015.Signed in accordance with a resolution of the Board of Directors.
____________________________________ ____________________________________Director Director
26
A i r p o r t s f i j i l i m i t e d A n n u A l r e p o r t s 2 0 1 2 - 2 0 1 4
The accompanying notes form an integral part of this Statement of Comprehensive Income.
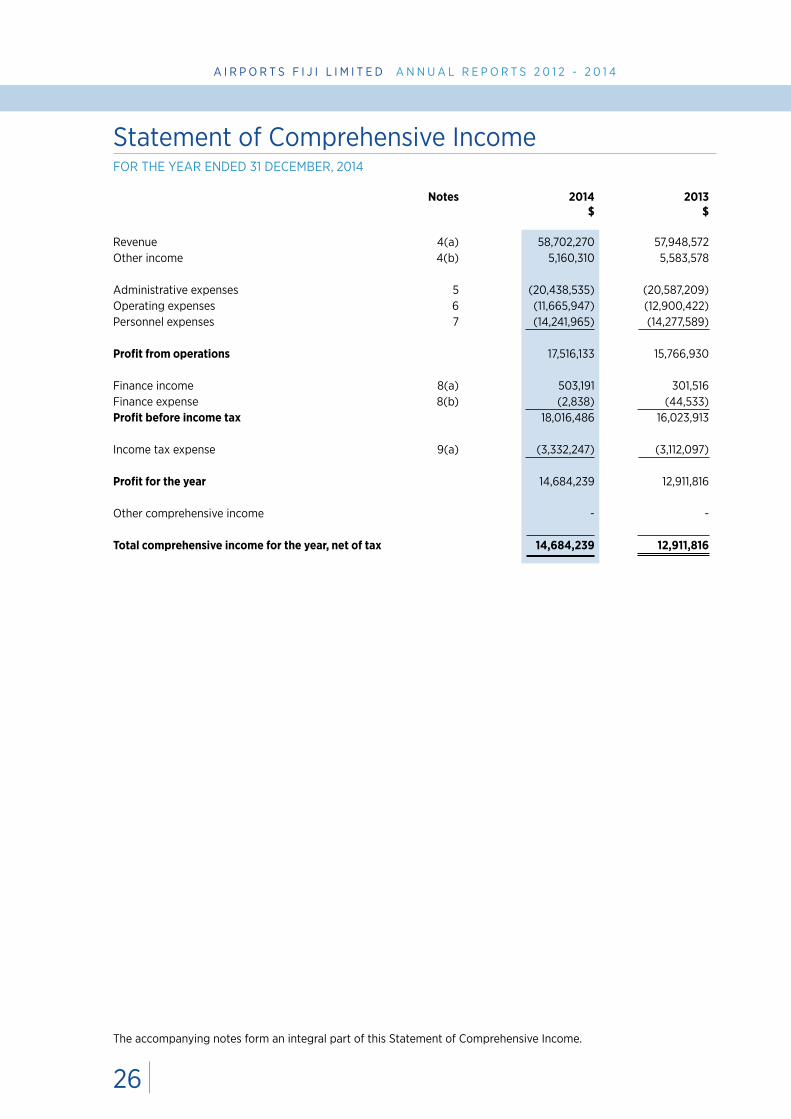
Statement of Comprehensive IncomeFOR THE YEAR ENDED 31 DECEMBER, 2014
Notes 2014 2013 $ $
Revenue 4(a) 58,702,270 57,948,572Other income 4(b) 5,160,310 5,583,578
Administrative expenses 5 (20,438,535) (20,587,209)Operating expenses 6 (11,665,947) (12,900,422)Personnel expenses 7 (14,241,965) (14,277,589)
Profit from operations 17,516,133 15,766,930
Finance income 8(a) 503,191 301,516Finance expense 8(b) (2,838) (44,533)Profit before income tax 18,016,486 16,023,913
Income tax expense 9(a) (3,332,247) (3,112,097)
Profit for the year 14,684,239 12,911,816
Other comprehensive income - -
Total comprehensive income for the year, net of tax 14,684,239 12,911,816

27
A i r p o r t s f i j i l i m i t e d A n n u A l r e p o r t s 2 0 1 2 - 2 0 1 4
The notes on pages 11 to 34 are an integral part of these financial statements.
Statement of Changes in EquityFOR THE YEAR ENDED 31 DECEMBER, 2014
Capital Retained Share capital contribution earnings Total $ $ $ $
Balance at 1 January 2013 92,300,180 4,006,159 58,220,876 154,527,215
Total comprehensive income for the yearNet profit for the year - - 12,911,816 12,911,816Other comprehensive income, net of tax - - - -Total comprehensive income for the year - - 12,911,816 12,911,816
Transactions with owners of the CompanyCapital contribution (refer Note 21) - 193,462 - 193,462Total transactions with owners recogniseddirectly in equity - 193,462 - 193,462
Balance at 31 December 2013 92,300,180 4,199,621 71,132,692 167,632,493
Balance at 1 January 2014 92,300,180 4,199,621 71,132,692 167,632,493
Total comprehensive income for the yearNet profit for the year - - 14,684,239 14,684,239Other comprehensive income, net of tax - - - -Total comprehensive income for the year - - 14,684,239 14,684,239
Transactions with owners of the CompanyDividends declared and paid - - (10,000,000) (10,000,000)Capital contribution (refer Note 21) - 741,740 - 741,740Total transactions with owners recogniseddirectly in equity - 741,740 (10,000,000) (9,258,260)
Balance at 31 December 2014 92,300,180 4,941,361 75,816,931 173,058,472

28
A i r p o r t s f i j i l i m i t e d A n n u A l r e p o r t s 2 0 1 2 - 2 0 1 4
Statement of financial PositionFOR THE YEAR ENDED 31 DECEMBER, 2014
Notes 2014 2013 $ $Current assets Cash and cash equivalents 10 16,840,528 27,208,062 Trade receivables 11 8,298,044 10,257,220 Inventories 12 580,852 543,631 Current tax asset 9(d) - 214,610 Prepayments and other assets 13 2,415,827 2,039,600 Term deposits 14 21,361,610 7,000,000 Total current assets 49,496,861 47,263,123
Non-current assets Property, plant and equipment 15 148,083,737 140,649,494 Investment property 16 9,227,942 9,483,082 Total non-current assets 157,311,679 150,132,576
Total assets 206,808,540 197,395,699
Current liabilities Bank overdraft 10 3,450,322 - Trade and other payables 17 6,761,902 6,075,348 Loans and borrowings 18 658,404 687,581 Employee benefits 19 702,538 1,162,439 Deferred revenue 20 669,422 629,634 Government grants 21 244,444 290,556 Current tax liability 9(d) 300,792 - Total current liabilities 12,787,824 8,845,558
Non-current liabilities Loans and borrowings 18 2,963,128 827,329 Employee benefits 19 - 42,405 Deferred revenue 20 12,551,216 13,260,426 Government grants 21 133,333 377,777 Deferred tax liability 9(c) 5,314,567 6,409,711 Total non-current liabilities 20,962,244 20,917,648
Total Liabilities 33,750,068 29,763,206
Net assets 173,058,472 167,632,493
Shareholder’s equity Share capital 22 92,300,180 92,300,180 Retained earnings 75,816,931 71,132,692 Capital contribution 2(a) 4,941,361 4,199,621 Total shareholder’s equity 173,058,472 167,632,493
Signed for and on behalf of the Board of Directors.
____________________________________ ____________________________________Director Director
The notes on pages 11 to 34 are an integral part of these financial statements.

29
A i r p o r t s f i j i l i m i t e d A n n u A l r e p o r t s 2 0 1 2 - 2 0 1 4
Statement of Cash FlowFOR THE YEAR ENDED 31 DECEMBER, 2014
The notes on pages 11 to 34 are an integral part of these financial statements.
Notes 2014 2013 $ $Cash flows from operating activitiesProfit after income tax 14,684,239 12,911,816
Adjustments for non-cash itemsDepreciation 15, 16 12,400,222 12,743,962Deferred income 20, 21 (959,978) (1,015,533)Net exchange gain (105,107) (69,370)Loss / (gain) on sale of property, plant and equipment - 86,878Income tax expense 3,332,247 3,112,097 29,351,623 27,769,850
Decrease in trade receivables 1,959,176 2,629,069(Increase) in prepayments and other assets (376,227) (479,328)(Increase) in inventories (37,220) (126,076)Increase / (decrease) in trade and other payables 686,554 (4,184,178)(Decrease) in employee benefits (502,306) (389,154)
Finance income classified as investing activities (398,084) (232,146)Income tax paid 9(d) (3,911,989) (4,939,397)Net cash from operating activities 26,771,527 20,048,640
Cash flow from investing activitiesProceeds from sale of property, plant and equipment - 83,719Net transfer to term deposits (14,361,610) -Acquisition of plant and equipment (15,662,806) (4,904,743)Interest received 398,084 232,146Net cash used in investing activities (29,626,332) (4,588,878)
Cash flow from financing activitiesRepayment of loans and borrowings (751,399) (6,056,436)Receipt of government grants 741,740 193,462Transaction costs related to loans and borrowings (953,392) -Dividends paid (10,000,000) -Net cash used in financing activities (10,963,051) (5,862,974)
Net (decrease) / increase in cash and cash equivalents (13,817,856) 9,596,788
Cash and cash advances at the beginning of the year 27,208,062 17,611,274
Cash and cash equivalents at end of year 10 13,390,206 27,208,062
Material non-cash investing activity 28

30
A i r p o r t s f i j i l i m i t e d A n n u A l r e p o r t s 2 0 1 2 - 2 0 1 4
Notes to the Financial StatementsFOR THE YEAR ENDED 31 DECEMBER, 2014
1. Reporting entity Airports Fiji Limited (the “Company”) is a private enterprise domiciled in the Republic of Fiji. The registered office
is located at AFL Compound, Nadi Airport, Republic of Fiji.
The principal activities of the Company during the financial year included provision of air navigation services, the operation and management of the Nadi International Airport and other airports throughout Fiji.
2. Basis of preparation
(a) Statement of compliance The financial statements have been prepared in accordance with International Financial Reporting Standards
(IFRS) as issued by the International Accounting Standards Board and the Companies Act 1983 except as stated below.
Accounting for Government Grants
During the year ended 31 December 2012 the Company changed its accounting policy for government grants, including restatement of prior periods, to comply with a circular that was issued by the Ministry of Public Enterprises & Tourism on 14 March 2013. This circular cited Cabinet decision No.357 of 2012 that requires all government grants or special funding to state owned enterprises received from 2010 to be treated as a capital contribution.
This accounting treatment is not in compliance with International Accounting Standard (IAS) 20 Accounting for Government Grants and Disclosure of Government Assistance which requires government grants provided for the purchase or construction of assets to be recognized initially as deferred income and then recognized in profit or loss as other income on a systematic basis over the useful life of the related asset. Government grants that compensate the Company for expenses incurred are required to be recognized in profit or loss as other income on a systematic basis in the same period that the expenses are recognized.
The non-compliance with IAS 20 relates to government grants received after 1 January 2010. The accounting for government grants received prior to 1 January 2010 continues materially to comply with IAS 20.
In May 2014, the Directors sought clarification from the Ministry of Public Enterprises & Tourism who reaffirmed that the Company should continue to follow the accounting prescribed in the Circular dated 14 March 2013. Had the Company complied with IAS 20 the impact would be as follows:
2014 2013 $ $ Increase / Increase /Statement of comprehensive income (decrease) (decrease)
Profit 256,002 198,888
Statement of financial positionCapital contribution (4,941,361) (4,199,621)Retained earnings 800,500 544,498Government grant 4,140,861 3,655,123

31
A i r p o r t s f i j i l i m i t e d A n n u A l r e p o r t s 2 0 1 2 - 2 0 1 4
Notes to the Financial StatementsFOR THE YEAR ENDED 31 DECEMBER, 2014
2. Basis of preparation (continued)
(a) Statement of compliance (continued) The financial statements were authorised for issue by the Board of Directors on 5th June 2015.
(b) Basis of measurement The financial statements have been prepared on a historical cost basis except where stated.
(c) Functional and presentation currency The financial statements are presented in Fiji dollars, which is the Company’s functional currency.
(d) Use of estimates and judgements In preparing these financial statements in conformity with IFRS, management has made judgments, estimates and
assumptions that affect the application of the Company’s accounting policies and the reported amount of assets, liabilities, income and expenses. Actual results may differ from these estimates.
Estimates and underlying assumptions are reviewed on an on-going basis. Revisions to estimates are recognised prospectively.
Information about judgements made in applying accounting policies that have the most significant effect on the amounts recognised in the financial statements is included in the following notes:
- Note 2(a) - accounting for government grant - Note 23 - lease classification - Note 11 - recoverability of trade receivables - Note 15 - impairment of property, plant and equipment
3. Significant accounting policies
(a) Foreign currency transactions Transactions in foreign currencies are translated to Fiji dollars at exchange rates at the date of the transactions.
Monetary assets and liabilities denominated in foreign currencies at the reporting date are retranslated to Fiji dollars at the reporting date and differences are recognised profit or loss.
Non-monetary items that are measured in terms of historical cost in a foreign currency are translated using the exchange rate as at the date of the initial transaction.
(b) Revenue recognition Revenue is recognised to the extent that it is probable that the economic benefits will flow to the Company and
the revenue can be reliably measured. Revenue is measured at the fair value of the consideration received or receivable, excluding discounts, rebates, and sales taxes or duty. The Company assesses its revenue arrangements against specific criteria in order to determine if it is acting as principal or agent. The Company has concluded that it is acting as a principal in all of its revenue arrangements.

32
A i r p o r t s f i j i l i m i t e d A n n u A l r e p o r t s 2 0 1 2 - 2 0 1 4
Notes to the Financial StatementsFOR THE YEAR ENDED 31 DECEMBER, 2014
3. Significant accounting policies (continued)
(b) Revenue recognition (continued) The following specific recognition criteria must also be met before revenue is recognised:
rendering of services
Landing and parking fees, air navigation charges and passenger service charges are recognised as revenue when the relevant service has been provided.
rental income and concessions
Rental income is recognised on a straight line basis over the applicable lease terms. Concession income is recognised on an accrual basis based on the actual or estimated concession data.
(c) Income tax Income tax expense comprises current and deferred tax. Income tax expense is recognised in profit or loss except
to the extent that it relates to items recognised directly in equity or other comprehensive income.
Current tax is the expected tax payable on the taxable income for the year, using tax rates enacted or substantively enacted at the reporting date, and any adjustment to tax payable in respect of previous years.
Deferred tax is recognised in respect of temporary differences between the carrying amounts of assets and liabilities for financial reporting purposes and the amounts used for taxation purposes. Deferred tax is not recognised for temporary differences on the initial recognition of assets or liabilities in a transaction that is not a business combination and that affects neither accounting nor taxable profit or loss, and differences relating to investments in subsidiaries and jointly controlled entities to the extent that it is probable that they will not reverse in the foreseeable future. In addition, deferred tax is not recognised for taxable temporary differences arising on the initial recognition of goodwill.
Deferred tax is measured at the tax rates that are expected to be applied to temporary differences when they reverse, using tax rates enacted or substantively enacted by the reporting date.
Deferred tax assets and liabilities are offset if there is a legally enforceable right to offset current tax liabilities and assets, and they relate to income taxes levied by the same tax authority on the same taxable entity, or on different tax entities, but they intend to settle current tax liabilities and assets on a net basis or their tax assets and liabilities will be realised simultaneously.
A deferred tax asset is recognised for unused tax losses, tax credits and deductible temporary differences, to the extent that it is probable that future taxable profits will be available against which they can be used. Deferred tax assets are reviewed at each reporting date and are reduced to the extent that it is no longer probable that the related tax benefit will be realised; such reductions are reversed when the probability of future taxable profits improves.
(d) Dividends
Dividends are recorded in the Company’s financial statements in the period in which they are declared by the Board of Directors.

33
A i r p o r t s f i j i l i m i t e d A n n u A l r e p o r t s 2 0 1 2 - 2 0 1 4
Notes to the Financial StatementsFOR THE YEAR ENDED 31 DECEMBER, 2014
3. Significant accounting policies (continued)
(e) Finance income and finance costs
Finance income comprises interest income on funds invested. Interest income is recognised as it accrues in profit or loss, using the effective interest method.
Finance costs comprise interest expense on borrowings and bank overdraft and are recognised in profit or loss using the effective interest method.
(f) Investment property
Investment property is measured at cost less accumulated depreciation and impairment.
Depreciation is calculated on a straight-line basis over the estimated useful life of the asset as follows: • Land Term of lease • Buildings and improvements Shorter of 40 years and term of land lease
(g) Government grants and deferred income
Government grants in respect of assets that were received before 1 January 2010 are recognised initially as deferred income at fair value when there is reasonable assurance that they will be received and the Company will comply with the conditions associated with the grant, and are then recognised in profit or loss as other income on a systematic basis over the useful life of the related asset. Grants received prior to 1 January 2010 that compensate the Company for expenses incurred were recognised in profit or loss as other income on a systematic basis in the same period that the expenses are recognised.
For all government grants received subsequent to 1 January 2010 the recognition of government grants is based on the circular which was distributed by Ministry of Public Enterprises and Tourism on 14 March 2013. As per cabinet decision No. 357 of 2012 all government grants or special funding to state owned enterprises received after 2010 is required to be treated as a capital contribution rather than revenue.
All government grants received from 2010 have been recorded as a capital contribution in equity by the Company (Refer note 1(a)).
Deferred income represents the housing estate transferred from the Civil Aviation Authority of Fiji to AFL by order of the Government. This deferred income is recognised in profit or loss over the useful life of the housing estate.
(h) Value Added Tax
Revenues, expenses and assets are recognised net of the amount of Value Added Tax (VAT) except:
• Where the VAT incurred on a purchase of assets or services is not recoverable from the taxation authority, in which case the value added tax is recognised as part of the cost of acquisition of the asset or as part of the expense item as applicable; and
• Receivables and payables are stated with the amount of VAT included.
The net amount of VAT recoverable from, or payable to, the taxation authority is included as part of receivables or payables in the statement of financial position.

34
A i r p o r t s f i j i l i m i t e d A n n u A l r e p o r t s 2 0 1 2 - 2 0 1 4
Notes to the Financial StatementsFOR THE YEAR ENDED 31 DECEMBER, 2014
3. Significant accounting policies (continued)
(i) Financial instruments
(i) Non-derivative financial assets
The Company initially recognises loans and receivables on the date that they are originated. All other financial assets are recognised initially on the trade date, which is the date the Company becomes a party to the contractual provisions of the instrument.
The Company derecognises a financial asset when the contractual rights to the cash flows from the asset expire, or it transfers the rights to receive the contractual cash flows on the financial asset in a transaction in which substantially all the risks and rewards of ownership of the financial asset are transferred. Any interest in derecognised financial assets that is created or retained by the Company is recognised as a separate asset or liability.
Financial assets and liabilities are offset and the net amount presented in the statement of financial position when, and only when, the Company has a legal right to offset the amounts and intends either to settle on a net basis or to realise the asset and settle the liability simultaneously.
Loans and receivables
Loans and receivables are financial assets with fixed or determinable payments that are not quoted in an active market. Such assets are recognised initially at fair value plus any directly attributable transaction costs. Subsequent to initial recognition loans and receivables are measured at amortised cost using the effective interest method, less any impairment losses.
Loans and receivables comprise cash and cash equivalents and trade and other receivables.
Cash and cash equivalents
Cash and cash equivalents comprise cash balances and call deposits with original maturities of three months or less from the acquisition date. Bank overdrafts that are repayable on demand and form an integral part of the Company’s cash management are included as a component of cash and cash equivalent for the purpose of the statement of cash flows.
Held to maturity financial assets
If the Company has the positive intent and ability to hold term deposits to maturity then such financial assets are classified as held to maturity. These assets are initially recognised at fair value plus directly attributable transaction costs. Subsequent to initial recognition, they are measured at amortised cost using the effective interest method. Held to maturity investments comprise term deposits.
(ii) Non-derivative financial liabilities
The Company initially recognises debt securities issued on the date that they are originated. All other financial liabilities are recognised initially on the trade date, which is the date the Company becomes a party to the contractual provisions of the instrument.
The Company derecognises a financial liability when its contractual obligations are discharged or cancelled or expire.
The Company classifies non-derivative financial liabilities into the other financial liabilities category. Such financial liabilities are recognised initially at fair value plus any directly attributable transaction costs. Subsequent to initial recognition, these financial liabilities are measured at amortised cost using the effective interest method.
Other financial liabilities comprise borrowings and trade and other payables.

35
A i r p o r t s f i j i l i m i t e d A n n u A l r e p o r t s 2 0 1 2 - 2 0 1 4
Notes to the Financial StatementsFOR THE YEAR ENDED 31 DECEMBER, 2014
3. Significant accounting policies (continued)
(i) Financial instruments (continued)
(iii) Ordinary shares
Ordinary shares are classified as equity. Incremental costs directly attributable to the issue of ordinary shares are recognised as a deduction from equity, net of any tax effects.
(j) Impairment
Non-derivative financial assets
A financial asset not carried at fair value through profit or loss is assessed at each reporting date to determine whether there is objective evidence that it is impaired. A financial asset is impaired if there is objective evidence of impairment as a result of one or more events that occurred after the initial recognition of the asset, and the loss event had an impact on the estimated future cash flows of that asset that can be estimated reliably.
Objective evidence that financial assets are impaired can include default or delinquency by a debtor, restructuring of an amount due to the Company on terms that the Company would not consider otherwise and indications that a debtor will enter bankruptcy.
The Company considers evidence of impairment for receivables at both a specific asset and collective level.
All individually significant receivables are assessed for specific impairment. All individually significant receivables found not to be specifically impaired are then collectively assessed for any impairment that has been incurred but not yet identified. Receivables that are not individually significant are collectively assessed for impairment by grouping together receivables with similar risk characteristics.
In assessing collective impairment the Company uses historical information of the probability of default, timing of recoveries and the amount of loss incurred, adjusted for management’s judgement as to whether current economic and credit conditions are such that the actual losses are likely to be greater or less than suggested by historical trends.
An impairment loss with respect to a financial asset measured at amortised cost is calculated as the difference between its carrying amount and the present value of the estimated future cash flows discounted at the asset’s original effective interest rate. Losses are recognised in profit or loss and reflected in an allowance account against receivables. When a subsequent event causes the amount of impairment loss to decrease, the decrease in impairment loss is reversed through profit or loss.
Non-financial assets
The carrying amounts of the Company’s non-financial assets, other than inventories and deferred tax assets, are reviewed at each reporting date to determine whether there is any indication of impairment. If any such indication exists, then the asset’s recoverable amount is estimated.
The recoverable amount of an asset or cash-generating unit is the greater of its value in use and its fair value less costs to sell. In assessing value in use, the estimated future cash flows are discounted to their present value using a pre-tax discount rate that reflects current market assessments of the time value of money and the risks specific to the asset. For the purpose of impairment testing, assets that cannot be tested individually are grouped together into the smallest group of assets that generates cash inflows from continuing use that are largely independent of the cash inflows of other assets or groups of assets (the “cash-generating unit, or CGU”).

36
A i r p o r t s f i j i l i m i t e d A n n u A l r e p o r t s 2 0 1 2 - 2 0 1 4
Notes to the Financial StatementsFOR THE YEAR ENDED 31 DECEMBER, 2014
3. Significant accounting policies (continued)
(j) Impairment (continued)
Non-financial assets (continued)
An impairment loss is recognised if the carrying amount of an asset or its CGU exceeds its estimated recoverable amount. Impairment losses are recognised in profit or loss. Impairment losses recognised in respect of CGUs are allocated first to reduce the carrying amount of any goodwill allocated to the units, and then to reduce the carrying amounts of the other assets in the unit (group of units) on a pro rata basis.
An impairment loss is reversed only to the extent that the asset’s carrying amount cannot exceed the carrying amount that would have been determined, net of depreciation or amortisation, if no impairment loss has been recognised.
(k) Trade payables, provisions and other payables
Trade and other payables are stated at amortised cost. A provision is recognised in the statement of financial position when the Company has a legal or constructive obligation as a result of a past event, and it is probable that an outflow of economic benefits will be required to settle the obligation. If the effect is material, provisions are determined by discounting the expected future cash flows at a pre-tax rate that reflects current market assessments of the time value of money and, where appropriate, the risks specific to the liability.
(l) Borrowings
Interest-bearing borrowings are recognised initially at cost, less attributable transaction costs. Subsequent to initial recognition, interest-bearing borrowings are stated at amortised cost with any difference between cost and redemption value being recognised in profit or loss.
(m) Property, plant and equipment
Plant and equipment is stated at cost, net of accumulated depreciation and any accumulated impairment losses, if any. Such cost includes the cost of replacing part of the plant and equipment and borrowing costs for long term construction projects if the recognition criteria are met. When significant parts of property, plant and equipment are required to be replaced in intervals, the Company recognises such parts as individual assets with specific useful lives and depreciation, respectively. Likewise, when a major inspection is performed, its cost is recognised in the carrying amount of the plant and equipment as a replacement if the recognition criteria are satisfied. All other repair and maintenance costs are recognised in the statement of comprehensive income as incurred.
Subsequent expenditure is capitalised only if it is probable that the future economic benefits associated with the expenditure will flow to the Company.
Depreciation is calculated to write off the cost of items of property, plant and equipment less their estimated residual values using the straight-line method over the estimated useful life of the asset, and is recognised in profit or loss.

37
A i r p o r t s f i j i l i m i t e d A n n u A l r e p o r t s 2 0 1 2 - 2 0 1 4
Notes to the Financial StatementsFOR THE YEAR ENDED 31 DECEMBER, 2014
3. Significant accounting policies (continued)
(m) Property, plant and equipment
The estimated useful lives of the Company’s assets are as follows:• Leasehold Land Term of lease• Infrastructure 13 - 73 years• Buildings and improvements 40 years• Plant and equipment 4 - 34 years• Motor vehicles 6 years
An item of property, plant and equipment and any significant part initially recognised is derecognised upon disposal or when no future economic benefits are expected from its use or disposal. Any gain or loss arising on de-recognition of the asset (calculated as the difference between the net disposal proceeds and the carrying amount of the asset) is included in the statement of comprehensive income when the asset is derecognised.
The assets’ residual values, useful lives and methods of depreciation are reviewed at each financial year end, and adjusted prospectively, if appropriate.
(n) Leases
Leases in terms of which the Company assumes substantially all the risks and rewards of ownership are classified as finance leases. Upon initial recognition the leased asset is measured at an amount equal to the lower of its fair value and the present value of the minimum lease payments. Subsequent to initial recognition, the asset is accounted for in accordance with the accounting policy applicable to that asset.
Leases in which a significant portion of the risks and rewards of ownership are retained by the lessor are classified as operating leases. Payments made under operating leases (net of incentives received from the lessor) are charged to profit or loss on a straight line basis over the period of the lease.
(o) Inventories
Inventories are measured at the lower of cost and net realisable value.
The cost of inventories is based on the weighted average cost principle, and includes expenditure incurred in acquiring the inventories and other cost incurred in bringing them to their existing location and condition. A provision for inventory obsolescence is recorded based on a review of inventories. Inventories considered obsolete or not in usable condition are written off in the period in which they are identified.
(p) Employee benefits
Defined contribution plan Contributions are paid to the Fiji National Provident Fund or nominated superannuation funds on behalf of
employees to secure retirement benefits. Costs are included in profit or loss.
Wages and salaries and annual leave Liabilities for wages and salaries expected to be settled within 12 months of the reporting date are recognised
in other payables on the statement of financial position. Annual leave with respect to employees’ services up to the reporting date, measured at the amounts expected to be paid when the liabilities are settled, are accrued for under employee benefits.

38
A i r p o r t s f i j i l i m i t e d A n n u A l r e p o r t s 2 0 1 2 - 2 0 1 4
Notes to the Financial StatementsFOR THE YEAR ENDED 31 DECEMBER, 2014
3. Significant accounting policies (continued)
(q) Comparativefigures
Comparative figures have been amended where necessary, for changes in presentation in the current year.
(r) Standards issued but not yet effective
A number of new standards and amendments to standards are effective for the annual periods beginning after 1 January 2014, however, the Company has not applied the following new or amended standards in preparing these financial statements:
IFRS 9 amendments Financial Instruments (effective 1 January 2018) IFRS 15 Revenue from Contracts with Customers (effective 1 January 2017)
The Company does not plan to adopt this standard early and the extent of the impact has not been determined.
2014 2013 $ $4. Revenue and other income
(a) Revenue Air navigation charges 11,071,967 10,958,051 Airport security and development fee 7,790,213 7,559,891 Concessions 12,940,775 12,387,536 Domestic passenger service charge 1,219,149 1,178,711 Landing and parking fees - domestic 655,827 637,022 Landing and parking fees - international 11,268,490 11,491,345 Departure tax share 5,882,248 5,820,465 Rental - offices and warehouses 3,013,137 3,071,167 Rental - check-in-counter 965,932 947,951 Terminal navigation aid charges 3,327,474 3,334,403 Car park charges 567,058 562,030 58,702,270 57,948,572
(b) Other income Electricity recharge 2,518,780 2,687,213 Deferred income and government grants 959,978 1,015,533 Insurance proceeds - 734,010 Other income 1,681,552 1,146,822 5,160,310 5,583,578

39
A i r p o r t s f i j i l i m i t e d A n n u A l r e p o r t s 2 0 1 2 - 2 0 1 4
Notes to the Financial StatementsFOR THE YEAR ENDED 31 DECEMBER, 2014
2014 2013 $ $5. Administrative expenses Allowance for doubtful debts - trade receivables 73,792 69,445 Auditors’ remuneration 33,739 18,261 Board expenses 25,881 17,884 Contract costs 4,307,017 4,136,713 Depreciation 12,400,222 12,743,962 Directors’ remuneration 45,941 35,210 Doubtful debt recovered (85,125) - Insurance 2,209,519 2,037,382 Land rental 666,189 654,948 Loss on disposal of property, plant and equipment - 86,778 Sundry cost and supplies 497,005 492,294 Travel and accommodation 264,355 294,332 20,438,535 20,587,209
6. Operating expenses Meteorological costs 521,739 521,739 Post and telecommunications 1,412,254 1,327,157 Utilities 5,587,630 5,828,728 Other costs 4,144,324 5,222,798 11,665,947 12,900,422
7. Personnel expenses Wages and salaries 12,774,468 12,296,488 Key management compensation - wages and salaries 106,367 594,004 Key management compensation - FNPF 9,249 51,653 Contribution to Fiji National Provident Fund 1,029,387 1,000,623 FNU Levy 130,372 124,816 Other employee benefits 192,122 210,005 14,241,965 14,277,589
8. Finance income and expenses
(a) Finance income Interest income 398,084 232,146 Net foreign exchange gain 105,107 69,370 503,191 301,516
(b) Finance expenses Interest expense 2,838 44,533

40
A i r p o r t s f i j i l i m i t e d A n n u A l r e p o r t s 2 0 1 2 - 2 0 1 4
Notes to the Financial StatementsFOR THE YEAR ENDED 31 DECEMBER, 2014
2014 2013 $ $9. Income tax
(a) Recognised in profit or loss Current tax expense 4,486,518 4,165,080 Current tax expense - overprovision in prior year (59,127) (8,333) Deferred tax benefit (1,052,029) (1,044,650) Deferred tax – under-provision in prior year (43,115) - Income tax expense 3,332,247 3,112,097
(b) Reconciliation of effective tax Profit before income tax 18,016,486 16,023,913
Income tax at 20% (2013: 20%) 3,603,297 3,204,783 Permanent differences (168,808) (84,353) Overprovision in prior years (102,242) (8,333) 3,332,247 3,112,097
(c) Recognised deferred tax assets and (liabilities) Trade receivables 477,251 446,982 Inventories 2,175 2,175 Employee entitlements 140,508 180,980 Unrealised exchange gain (21,020) - Property, plant and equipment (5,913,481) (7,039,848) Net deferred tax liability (5,314,567) (6,409,711)
Movement in temporary differences during the year
1 January Recognised in 31 December 2014 profit or loss 2014 $ $ $
Trade receivables 446,982 30,269 477,251 Inventories 2,175 - 2,175 Employee entitlements 180,980 (40,472) 140,508 Unrealised exchange gain - (21,020) (21,020) Property, plant and equipment (7,039,848) 1,126,367 (5,913,481) (6,409,711) 1,095,144 (5,314,567)

41
A i r p o r t s f i j i l i m i t e d A n n u A l r e p o r t s 2 0 1 2 - 2 0 1 4
Notes to the Financial StatementsFOR THE YEAR ENDED 31 DECEMBER, 2014
9. Income tax (continued) Movement in temporary differences during the year
1 January Recognised in 31 December 2013 profit or loss 2013 $ $ $ Trade receivables 465,575 (18,593) 446,982 Inventories 20,000 (17,825) 2,175 Employee entitlements 183,483 (2,503) 180,980 Unrealised exchange gain (12,609) 12,609 - Property, plant and equipment (8,110,810) 1,070,962 (7,039,848) (7,454,361) 1,044,650 (6,409,711)
2014 2013 $ $(d) Current tax liability / (asset) Balance 1 January (214,610) 568,040 Current tax expense 4,486,518 4,148,414 Over provision prior year (59,127) 8,333 Net payments made during the year (3,911,989) (4,939,397) 300,792 (214,610)
10. Cash and cash equivalents Cash on hand 1,170 1,170 Cash at bank 16,839,358 20,958,695 Short-term deposits - 5,032,814 Deposits on call - 1,215,383 Cash and cash equivalents in the statement of financial position 16,840,528 27,208,062
Bank overdraft (3,450,322) - Cash and cash equivalents in the statement of cash flows 13,390,206 27,208,062

42
A i r p o r t s f i j i l i m i t e d A n n u A l r e p o r t s 2 0 1 2 - 2 0 1 4
Notes to the Financial StatementsFOR THE YEAR ENDED 31 DECEMBER, 2014
2014 2013 $ $11. Trade receivables
Trade receivables 10,521,619 12,492,128 Allowance for impairment (2,223,575) (2,234,908) 8,298,044 10,257,220
Allowance for impairment At 1 January 2,234,908 2,165,463 (Release) / charge for the year (11,333) 69,445 At 31 December 2,223,575 2,234,908
12. Inventories Fuel 5,234 7,783 Electrical 181,422 126,801 Telecom 405,069 419,920 Allowance for obsolescence (10,873) (10,873) Total inventories at the lower of cost and net realisable value 580,852 543,631
Movement in provision for impairment of inventories is as follows:
Opening balance 10,873 100,000 Write off during the year - (89,127) Closing balance 10,873 10,873
13. Prepayments and other assets
Prepayments 1,039,945 907,488 Staff advances - 18,404 Deposits 1,156,059 1,086,274 Other receivables 282,240 189,846 VAT receivable 99,995 - Allowance for impairment (other receivables) (162,412) (162,412) 2,415,827 2,039,600
14. Term deposits 21,361,610 7,000,000
The term deposits have an average maturity of 1 year (2013: 1 year) and an average interest rate of 2.79%(2013: 2.18%).

43
A i r p o r t s f i j i l i m i t e d A n n u A l r e p o r t s 2 0 1 2 - 2 0 1 4
Notes to the Financial StatementsFOR THE YEAR ENDED 31 DECEMBER, 2014
15.
Prop
erty
, pla
nt a
nd e
quip
men
t
Le
aseh
old
land
Pl
ant a
nd
M
otor
W
ork
in
an
d Bu
ildin
gs
equi
pmen
t In
fras
truc
ture
ve
hicl
es
prog
ress
To
tal
$ $
$ $
$ $
Co
st
At
1 Jan
uary
20
13
77,18
1,280
54
,742
,917
94
,130,
785
9,30
1,042
14
,40
1,40
8 24
9,75
7,43
2
Add
ition
s -
506,
041
-
642,
223
5,63
7,92
0
6,78
6,18
4
Dis
posa
ls
- (1
,398
,324
) -
(230
,418
) -
(1,6
28,7
42)
Tr
ansf
ers
to in
vest
men
t pr
oper
ty
(10,
441,7
35)
- -
- -
(10,
441,7
35)
Tr
ansf
ers
225,
621
4,35
1,054
1,7
40,5
36
3,56
8 (6
,320
,779
) -
A
t 31
Dec
embe
r 20
13
66,9
65,16
6 58
,20
1,688
95
,871
,321
9,
716,
415
13,7
18,5
49
244,
473,
139
A
dditi
ons
3,59
0
190,
833
- 12
1,90
0
19,2
59,4
78
19,5
75,8
01
D
ispo
sals
-
(2,3
47)
- -
- (2
,347
)
Tran
sfer
s 25
1,081
7,
332,
692
355,
767
- (7
,939
,540
) -
A
t 31
Dec
embe
r 20
14
67,2
19,8
37
65,7
22,8
66
96,2
27,0
88
9,83
8,31
5 25
,038
,487
26
4,0
46,5
93
D
epre
ciat
ion
and
impa
irmen
t:
At
1 Jan
uary
20
13
9,91
3,81
8 38
,088
,268
37
,431
,274
8,
063
,120
-
93,4
96,4
80
Dep
reci
atio
n ch
arge
for
the
year
1,9
43,8
57
4,51
3,68
3 5,
632,
431
653,
991
- 12
,743
,962
Tr
ansf
ers
to in
vest
men
t pr
oper
ty
(958
,653
) -
- -
- (9
58,6
53)
D
ispo
sals
-
(1,2
37,7
72)
- (2
20,3
72)
- (1
,458
,144)
A
t 31
Dec
embe
r 20
13
10,8
99,0
22
41,3
64,17
9 43
,063
,70
5 8,
496,
739
- 10
3,82
3,64
5
Dep
reci
atio
n ch
arge
for
the
year
1,6
86,6
81
4,24
7,58
8 5,
755,
284
452,
00
5 -
12,14
1,558
D
ispo
sals
-
(2,3
47)
- -
- (2
,347
)
At
31 D
ecem
ber
2014
12
,585
,70
3 45
,60
9,42
0
48,8
18,9
89
8,94
8,74
4 -
115,
962,
856
N
et b
ook
valu
e:
At
31 D
ecem
ber
2013
56
,066
,144
16,8
37,5
09
52,8
07,6
16
1,219
,676
13
,718
,549
14
0,64
9,49
4
At
31 D
ecem
ber
2014
54
,634
,134
20,11
3,44
6 47
,40
8,0
99
889,
571
25,0
38,4
87
148,
083
,737

44
A i r p o r t s f i j i l i m i t e d A n n u A l r e p o r t s 2 0 1 2 - 2 0 1 4
Notes to the Financial StatementsFOR THE YEAR ENDED 31 DECEMBER, 2014
2014 2013 $ $16. Investment property Cost Balance at 1 January 10,441,735 - Reclassification from property, plant and equipment - 10,441,735 Additions 3,524 Balance 31 December 10,445,259 10,441,735 Accumulated depreciation Balance at 1 January (958,653) - Reclassification from property, plant and equipment - (958,653) Depreciation expense (258,664) Balance 31 December (1,217,317) (958,653) Net book value 9,227,942 9,483,082
Investment property comprises of housing estate that is leased to third parties. At 31 December 2013 these assets was reclassified to investment property from property, plant and equipment as this was considered to be a more appropriate classification. There was no change in the measurement of these.
During 2014, investment property rentals of $739,962 (2013: $735,049) were included in “revenue” as part of “rental - offices and warehouses”. Maintenance expense, included in “operating expenses”, was
$68,296 (2013: $63,793).
17. Trade and other payables
Trade payables 1,182,204 1,302,390 Land rental 2,076,951 1,626,951 Advance deposits 1,551,931 1,470,376 Income received in advance 25,361 114,229 VAT payable - 112,070 Other payables 1,925,455 1,449,332 6,761,902 6,075,348
18. Loans and borrowings
Finance lease (i) 658,404 1,514,910 Bank loans (ii) 2,963,128 - 3,621,532 1,514,910
Classified as follows: Current 658,404 687,581 Non-current 2,963,128 827,329 3,621,532 1,514,910

45
A i r p o r t s f i j i l i m i t e d A n n u A l r e p o r t s 2 0 1 2 - 2 0 1 4
Notes to the Financial StatementsFOR THE YEAR ENDED 31 DECEMBER, 2014
18. Loans and borrowings (continued)
(i) Finance lease The finance lease is payable by monthly instalments of USD 30,987 and is for a period of 60 months commencing
1 May 2011. Future commitments in respect of the finance lease are as follows:
2014 2013 $ $ Within 6 months 395,042 343,791 Later than 6 months but less than 12 months 263,362 343,791 Later than on year but less than 5 years - 827,329 Minimum lease payments 658,404 1,514,910
(ii) Bank loans During the year, the Company obtained a $85m loan facility from Westpac Banking Corporation Limited for
the Nadi Airport Terminal Modernisation Project, out of which $3,916,520 was drawn as at year end. The loan is amortised over a notional term of 12 years, with interest-only repayments until 31 December 2015 and thereafter, monthly repayments, including principal and interest of $764,950 (provisional amount). A variable interest rate of 2.24% is charged from 1 January 2015 till 30 June 2015, and thereafter a fixed rate of 2.99% will apply till 30 June 2020. Upfront transaction costs of $956,230 have been offset against the carrying amount of the loan and are amortised to profit or loss over the term of the loan using the effective interest method.
The loan is secured by:
(i) Registered first fixed & floating charge by Airports Fiji Limited over all its assets and undertakings including called but unpaid capital;
(ii) Registered first mortgage by Airports Fiji Limited over Crown Lease No. 3469 [Lots 1,2,3 & 4 - ND 4444]; and
(iii) Negative pledge. 2014 2013 $ $19. Employee benefits
Balance at 1 January 1,204,844 1,593,997 Charge to profit or loss 192,122 7,466 Utilised during the year (694,428) (396,619) Balance at 31 December 702,538 1,204,844
Current 702,538 1,162,439 Non-current - 42,405 702,538 1,204,844

46
A i r p o r t s f i j i l i m i t e d A n n u A l r e p o r t s 2 0 1 2 - 2 0 1 4
Notes to the Financial StatementsFOR THE YEAR ENDED 31 DECEMBER, 2014
2014 2013 $ $20. Deferred revenue Housing Estate Balance at 1 January 13,890,060 14,559,482 Recognised in profit or loss (669,422) (669,422) Balance at 31 December 13,220,638 13,890,060
Current 669,422 629,634 Non-current 12,551,216 13,260,426 13,220,638 13,890,060
21. Government grants Balance at 1 January 668,333 1,014,444 Received during the year 741,740 193,462 Recognised in profit or loss (290,556) (346,111) 1,119,517 861,795 Transfer to capital contribution (741,740) (193,462) Balance at 31 December 377,777 668,333
Current 244,444 290,556 Non-current 133,333 377,777 377,777 668,333
22. Share capital
(a) Authorised Ordinary shares of $1.00 each 100,000,000 100,000,000
(b) Ordinary shares issued and fully paid 92,300,180 ordinary shares of $1.00 each 92,300,180 92,300,180
(c) Dividends The following dividend was declared and paid by the Company during the year ended 31 December:
2014 2013 $ $
$0.108342 per share (2013: $Nil) 10,000,000 -

47
A i r p o r t s f i j i l i m i t e d A n n u A l r e p o r t s 2 0 1 2 - 2 0 1 4
Notes to the Financial StatementsFOR THE YEAR ENDED 31 DECEMBER, 2014
23. Commitments
Operating lease commitments - company as lessee The Company has entered into various lease agreements with i-Taukei Land Trust Board for the lease of land for
its various airports and airstrips. The terms of the leases are from 75 to 99 years. Under these agreements, rentals are payable as follows:
2014 2013 $ $
Less than one year 666,189 482,802 Between 1 and 5 years 2,664,756 1,931,209 Over 5 years 26,846,921 22,025,022 30,177,866 24,439,033
Capital commitments Approved and committed 80,000,000 61,560,000 Approved and not committed - 16,470,000 80,000,000 78,030,000
Company as lessor The Company leases various commercial outlets at its airports under concession agreements. Rental income is
generally based on the higher of a percentage of gross sales of the concessionaire or a minimum guarantee. The Airports (Development and Modernisation) Decree 2010 converted all commercial tenancies and concession agreements into temporary licences.
24. Contingent liabilities
The Company is vigorously defending several claims received from suppliers of $1,137,000. The Directors do not consider that these claims have merit and no provision has been recognised in these financial statements as the Directors do not consider it probable that a loss will arise.
The Company holds a Letter of Credit with Westpac Banking Corporation Limited amounting to $15 million at 31 December 2014 (2013: $Nil). This Letter of Credit has been obtained to fund the Nadi Airport Terminal Modernisation Project (the “Project”) during instances when the Project costs are in excess of the Company’s cash commitments.
25. Related parties
(a) Directors The Directors who held office during the year were:
Mr. Faiz Khan (Executive Chairman) Mr. Samuela Tamani (resigned 13 April 2014) Mr. Xavier Riyaz Khan Mr. Geoffrey N. Shaw (appointed on 29 May 2014) Mr. Wiliame Katunivere (appointed on 30 May 2014)

48
A i r p o r t s f i j i l i m i t e d A n n u A l r e p o r t s 2 0 1 2 - 2 0 1 4
Notes to the Financial StatementsFOR THE YEAR ENDED 31 DECEMBER, 2014
2014 2013 $ $
25. Related parties (continued)
(a) Directors (continued) Directors’ remuneration: Fees 45,941 35,210 Other benefits 25,881 17,884 71,822 53,094
(b) Identity of related parties The Company is a private enterprise wholly owned and controlled by the Government of Fiji. Government includes
the government agencies and similar bodies whether local or national. Other related parties include government-related entities which are controlled, jointly controlled or significantly influenced by the Government of Fiji.
2014 2013 $ $(c) Amounts payable to related parties
iTaukei Land Trust Board (TLTB) 2,076,951 1,626,951 Fiji Meteorological Services 43,478 43,478
Amounts payable to related parties are unsecured, interest-free and repayable on demand.
(d) Transactions with related parties During the year, the Company entered into various transactions with related parties. The aggregate value of major
transactions with the related parties during the year is as follows:
2014 2013 $ $ Fiji Government iTaukei Land Trust Board (TLTB) - Land rental expense 666,189 654,948 Government grant received 741,740 193,462 Dividends paid 10,000,000 -
Fiji Meteorological Services Reimbursement of Meteorological office operating cost 521,739 521,739
Civil Aviation Authority of Fiji (CAAF) Airport License & Inspection Fee 370,908 286,464
Fiji National Provident Fund Post employment benefit plan - Superannuation 1,038,636 1,000,623

49
A i r p o r t s f i j i l i m i t e d A n n u A l r e p o r t s 2 0 1 2 - 2 0 1 4
Notes to the Financial StatementsFOR THE YEAR ENDED 31 DECEMBER, 2014
25. Related parties (continued)
(e) Transactions with key management personnel
In addition to the Directors, key management personnel during the year comprise of the Acting General Manager Air Traffic Management (2013: Acting Chief Executive Officer, General Manager Engineering Infrastructure, Acting General Manager Air Traffic Management and General Manager Airports).
In addition to their salaries, the Company also provides non-cash benefits to key management personnel.
Transactions with key management personnel are no more favorable than those available, or which might reasonably be expected to be available, on similar transactions to third parties at arm’s length.
Key management personnel compensation (excluding Directors’ remuneration as disclosed in Note 25 (a) above) is disclosed in Note 7.
26. Financial risk management
Overview
The Company has exposure to the following risks:
(i) Credit risk;(ii) Liquidity risk; and(iii) Market risk.
This note presents information about the Company’s exposure to each of the above risks, the Company’s objectives, policies and processes for measuring and managing risk.
Risk management framework
The management have overall responsibility for the establishment and oversight of the Company’s risk management framework. The Company’s risk management policies are established to identify and analyse the risks faced by the Company, to set appropriate risk limits and controls, and to monitor risks and adherence to limits. Risk management policies and systems are reviewed regularly to reflect changes in market conditions and the Company’s activities.
(i) Credit risk
Credit risk is the risk of financial loss to the Company if a customer or counter party to a financial instrument fails to meet its contractual obligations, and arises principally from the Company’s cash at bank, trade receivables and other receivables and receivables from related companies.
In respect of trade and other receivables, the Company has procedures in place to monitor the payment history as well as other information specific to the customers and the economic environment in which they operate in.
Cash balances and term deposits are placed with financial institutions with sound credit ratings to minimise credit exposure.

50
A i r p o r t s f i j i l i m i t e d A n n u A l r e p o r t s 2 0 1 2 - 2 0 1 4
Notes to the Financial StatementsFOR THE YEAR ENDED 31 DECEMBER, 2014
26. Financial risk management (continued)
(i) Credit risk (continued)
Exposure to credit risk The carrying amount of financial assets represents the maximum credit exposure. The maximum exposure to
credit risk at the reporting date was as follows: 2014 2013 $ $
Cash at bank 16,839,358 27,206,892 Trade receivables 8,298,044 10,257,220 Term deposits 21,361,610 7,000,000 Other receivables 1,375,882 1,132,112 47,874,894 45,596,224
The ageing of trade receivables at the reporting date that were not impaired was as follows:
Less than 30 days, due not impaired 4,436,645 7,545,369 Past due 31 - 60 days 3,168,624 1,612,609 Past due 61 - 90 days 563,978 907,740 Past due more than 90 days 128,798 191,502 8,298,045 10,257,220
(ii) Liquidity risk
Liquidity risk is the risk that the Company will encounter difficulty in meeting the obligations associated with its financial liabilities that are settled by delivering cash or another financial asset. The Company’s approach to managing liquidity is to ensure, as far as possible, that it will always have sufficient liquidity to meet its liabilities when due, under both normal and stressed conditions, without incurring unacceptable losses or risking damage to the Company’s reputation.
The Company has access to a loan facility of up to $85 million with Westpac Banking Corporation Limited to fund the Nadi Airport Terminal Modernisation Project. The Company also maintains a bank overdraft facility with Westpac Banking Corporation Limited at a fixed rate of 2.24% to meet its liquidity requirements in the short and longer term.

51
A i r p o r t s f i j i l i m i t e d A n n u A l r e p o r t s 2 0 1 2 - 2 0 1 4
Notes to the Financial StatementsFOR THE YEAR ENDED 31 DECEMBER, 2014
26. Financial risk management (continued)
(ii) Liquidity risk (continued)
The following are the contractual maturities of financial liabilities:
Carrying Contractual 6 months 6 - 12 More than 1 amount cash flows or less months year 31 December 2014 $ $ $ $
Bank overdraft 3,450,322 3,450,322 3,450,322 - Trade and other payables 6,761,902 6,761,902 6,761,902 - - Loans and borrowings 3,621,532 4,796,409 439,748 323,037 4,033,624 13,833,756 15,008,633 10,651,972 323,037 4,033,624
31 December 2013 Trade and other payables 6,075,348 6,075,348 6,075,348 - - Loans and borrowings 1,514,910 1,514,910 343,791 343,791 827,329 7,590,258 7,590,258 6,419,139 343,791 827,329
(iii) Market risk
Market risk is the risk that changes in market prices, such as foreign exchange rates and interest rates will affect the Company’s income or the value of its holdings of financial instruments. The objective of market risk management is to manage and control market risk exposures within acceptable parameters, while optimising the return.
Interest rate risk Interest rate risk refers to the possibility that the fair value of future cash flows of financial instrument will fluctuate
because of change in market interest rates. The Company adopts a policy of ensuring that its exposure to changes in interest rates on borrowings is on fixed-rate basis over a period of time, and reviewed periodically with the Bank, taking into account assets with exposure to changes in interest rates. The Company also invests excess cash in term deposits to manage the risk of changes in market interest rate exposed to the Company due to loans and borrowings.

52
A i r p o r t s f i j i l i m i t e d A n n u A l r e p o r t s 2 0 1 2 - 2 0 1 4
Notes to the Financial StatementsFOR THE YEAR ENDED 31 DECEMBER, 2014
26. Financial risk management (continued)
(iii) Market risk (continued)
Interest rate risk (continued)
At the reporting date, the interest rate profile of the Company’s interest-bearing financial instruments was:
2014 2013 $ $
Term deposits (i) 21,361,610 7,000,000 Loan from Westpac Banking Corporation (ii) 3,916,520 - Bank overdraft (ii) 3,450,322 -
(i) The Company invests in term deposits for an average of 365 days at a fixed interest rate. As a result the Company does not have a significant exposure to interest rate risk in respect of these assets.
(ii) The interest payable on the loan and bank overdraft from Westpac Banking Corporation is variable until 30 June 2015, and thereafter is fixed at 2.99% until 30 June 2020. As a result the Company does not have a significant exposure to interest rate risk on this loan.
Foreign currency risk
The Company is exposed to foreign currency risk as a result of transactions denominated in foreign currencies arising from normal trading activities. Where significant settlements are required to be done in currencies other than the Fiji dollar, the Company seeks quotations from recognised banks and uses the most favourable exchange rate for the purposes of the settlement.
At year end, liabilities denominated in foreign currencies included trade and other payables and finance leases.
Significant foreign exchange risk exposures are as follows: 2014 2013 $ $ Financial liabilities Trade and other payables 20,874 555,362 Finance lease 658,404 1,514,910 679,278 2,070,272
The Company does not have significant exposure to foreign currency risk.

53
A i r p o r t s f i j i l i m i t e d A n n u A l r e p o r t s 2 0 1 2 - 2 0 1 4
Notes to the Financial StatementsFOR THE YEAR ENDED 31 DECEMBER, 2014
27. Capital management
The Company’s capital includes share capital and retained earnings.
The Company’s policy is to maintain a strong capital base so as to maintain creditor confidence and to sustain future development of the business.
The Company is not subject to any externally imposed capital requirements. The Company’s policies with respect to capital management are reviewed regularly by the Board of Directors.
There have been no material changes in the Company’s management of capital during the year.
2014 2013 $ $28. Material non-cash investing activity
Acquisition of property, plant and equipment through loan facility 3,916,520 -
These amounts were paid directly to the suppliers by the Company’s bank and the amount added to the Company’s
loan account.
29. Subsequent events
There has not arisen in the interval between the end of the financial year and the date of this report any item, transaction or event of a material and unusual nature likely, in the opinion of the Directors, to affect significantly the operations of the Company, the results of those operations or the state of affairs of the Company in the subsequent financial year.

54
A i r p o r t s f i j i l i m i t e d A n n u A l r e p o r t s 2 0 1 2 - 2 0 1 4
Disclaimer on Additional Financial InformationFOR THE YEAR ENDED 31 DECEMBER, 2014
DisclaimerThe additional financial information presented on pages 36 to 37 is in accordance with the books and records of Airports Fiji Limited which have been subjected to the auditing procedures applied in our statutory audit of the Company for the year ended 31 December 2014. It will be appreciated that our statutory audit did not cover all details of the additional financial information. Accordingly, we do not express an opinion on such financial information and no warranty of accuracy or reliability is given.
In accordance with Office of the Auditor General (OAG) policy, we advise that neither the OAG nor any member or employee of the OAG undertakes responsibility arising in any way whatsoever to any person (other than the Company) in respect of such information, including any errors or omissions therein, arising through negligence or otherwise however caused.

55
A i r p o r t s f i j i l i m i t e d A n n u A l r e p o r t s 2 0 1 2 - 2 0 1 4
Detailed Profit and LossFOR THE YEAR ENDED 31 DECEMBER, 2014
2014 2013 $ $RevenueAir navigation charges 11,071,967 10,958,051Airport security and development fee 7,790,213 7,559,891Concessions 12,940,775 12,387,536Domestic passenger service charge 1,219,149 1,178,711Landing and parking fees - domestic 655,827 637,022Landing and parking fees - international 11,268,490 11,491,345Departure tax share 5,882,248 5,820,465Rental - offices and warehouses 3,013,137 3,071,167Rental - check-in-counter 965,932 947,951Terminal navigation aid charges 3,327,474 3,334,403Electricity recharge 2,518,780 2,687,213Government grant 290,556 346,111Deferred income 669,422 669,422Identification card charges 120,934 113,354Left luggage charges 91,380 -Interest on term deposit 398,084 232,146Sundry income 1,469,238 1,033,468Car park charges 567,058 562,030Unrealised exchange gain 105,107 69,377Insurance proceeds - 734,010Total income 64,365,771 63,833,673
ExpensesAllowance for uncollectible receivables 73,792 69,445Airport inspection and license fees 370,908 410,852Auditors’ remuneration 21,739 18,261Accounting fees 12,000 -Bank charges 10,457 25,520Board expenses 25,881 17,884Consultancy 178,777 242,010Contract costs 4,307,017 4,136,713Depreciation 12,400,222 12,743,962Directors’ remuneration 45,941 35,210Doubtful debt recovered (85,125) -Insurance 2,209,519 2,037,382Interest 2,838 44,533Land rental 666,189 654,948Loss on disposal of property, plant and equipment - 86,778Meteorological costs 521,739 521,739Other expenses 592,202 720,873Post and telecommunications 1,412,254 1,327,157Repairs and maintenance 1,550,062 2,098,286Share of Air Traffic Management income 494,208 463,472Sundry costs and supplies 497,005 492,294Training and conference 207,034 425,286Travel and accommodation 264,355 294,332Unrealised exchange loss - 7Utilities and services 5,587,630 5,828,728Vehicle and fuel costs 740,676 836,499Wages and salaries 14,241,965 14,277,589Total expenditure 46,349,285 47,809,760
Operating profit before tax 18,016,486 16,023,913
The detailed profit and loss is to be read in conjunction with the disclaimer set out on page 35.

56
A i r p o r t s f i j i l i m i t e d A n n u A l r e p o r t s 2 0 1 2 - 2 0 1 4
Financial StatementsFor the Year Ended 31 December 2013
Contents
The full financial statements for 2012 and 2013 can be viewed on the AFL website : www.airportsfiji.com
Directors’ report 57 - 58
Statement by Directors 59
Independent Audit report 60 - 61
Statement of Financial Position 62
Detailed Profit and Loss 63

57
A i r p o r t s f i j i l i m i t e d A n n u A l r e p o r t s 2 0 1 2 - 2 0 1 4
Director’s ReportFOR THE YEAR ENDED 31 DECEMBER, 2013
The Board of Directors present their report together with the financial statements of Airports Fiji Limited for the year ended 31 December 2013 and the auditors’ report thereon.
Directors The directors of the Company in office during the year and up to the date of this report are: Mr. Faiz Khan (Executive Chairman)Mr. Samuela Tamani (resigned 13 April 2014)Mr. Xavier Riyaz Khan (appointed 28 May 2013)
State of affairs In the opinion of the directors, the accompanying statement of financial position gives a true and fair view of the state of affairs of the Company as at 31 December 2013 and the accompanying statement of comprehensive income, statement of changes in equity and statement of cash flows give a true and fair view of the results of the Company for the year then ended.
Principal activity The principal activities of the Company during the financial year included provision of air navigation services, the operation and management of the Nadi International Airport and other airports throughout Fiji.
Trading results The net profit of the Company for the year was $12,911,816 (2012: $11,277,360) after taking into account an income tax expense of $3,112,097 (2012: $2,851,846).
Dividend There was no dividend declared and paid during the year (2012: $1,000,000).
Reserves The directors recommend that no amounts be transferred to reserves within the meaning of the Seventh Schedule of the Fiji Companies Act, 1983.
Current assets The Directors took reasonable steps before the Company’s financial statements were made out to ascertain that the current assets of the Company were shown in the accounting records at a value equal to or below the value that would be expected to be realised in the ordinary course of business.
At the date of this report, the Directors are not aware of any circumstances which would render the values attributable to the current assets in the financial statements to be misleading.
ReceivablesThe Directors took reasonable steps before the financial statements were made out to ascertain that all known bad debts were written off and adequate allowance was made for impainnent losses.
At the date of this report, the Directors are not aware of any circumstances which would render the above assessment inadequate to any substantial extent.
Related party transactionsAll related party transactions have been adequately recorded in the financial statements.

58
A i r p o r t s f i j i l i m i t e d A n n u A l r e p o r t s 2 0 1 2 - 2 0 1 4
Director’s Report (cont’d)
FOR THE YEAR ENDED 31 DECEMBER, 2013
Other circumstancesAt the date of this report, the Directors are not aware of any circumstances not otherwise dealt with in this report or the financial statements which would render any amounts stated in the accounts to be misleading.
Unusual circumstancesThe results of the Company’s operations during the financial year have not, in the op inion of the Directors, been substantially affected by any item, transaction or event of a material and unusual nature other than those disclosed in the financial statements.
Events subsequent to balance dateThere has not arisen in the interval between the end of the financial year and the date of the report any item, transaction or event of a material and unusual nature likely, in the opinion of the Directors, to affect significantly the operations of the Company, the results of those operations or the state of affairs of the Company in subsequent financial years.
Dated at Nadi this day of 2014.
Signed in accordance with a resolution of the Board of Directors.
_____________________ _____________________Director Director

59
A i r p o r t s f i j i l i m i t e d A n n u A l r e p o r t s 2 0 1 2 - 2 0 1 4
In the opinion of the Directors of Airports Fiji Limited:
(a) the accompanying statement of comprehensive income of the Company is drawn up so as to give a true and fair view of the results of the Company for the year ended 31 December 2013;
(b) the accompanying statement of changes in equity of the Company is drawn up so as to give a true and fair view of the changes in equity of the Company for the year ended 31 December 2013 ;
(c) the accompanying statement of financial position of the Company is drawn up so as to give a true and fair view of the state of affairs of the Company as at 31 December 2013;
(d) the accompanying statement of cash flows of the Company is drawn up so as to give a true and fair view of the cash flows of the Company for the year ended 31 December 2013:
(e) all related party transactions have been adequately recorded in the books of the Company; and
(f) at the date of this statement, there are reasonable grounds 10 believe the Company will be able 10 pay its debts as and when they fall due.
Dated at Nadi this day of 2014.
Signed in accordance with a resolution of the Board of Directors.
_____________________ _____________________Director Director
Statement by DirectorsFOR THE YEAR ENDED 31 DECEMBER, 2013

60
A i r p o r t s f i j i l i m i t e d A n n u A l r e p o r t s 2 0 1 2 - 2 0 1 4
To the members of Airports Fiji Limited
Report on the Financial Statements
I have audited the accompanying financial statements of Airports Fiji Limited, which comprises the statement of financial position as at 31 December 2013, and the statement of comprehensive income, the statement of changes in equity, the statement of cash flows for the year then ended and a summary of significant accounting policies and other explanatory information as set out on pages 7 to 34.
Director’s and Management’s responsibility for the Financial Statements
The directors and management are responsible for the preparation and fair presentation of these financial statements in accordance with International Financial Reporting Standards, Fiji Companies Act 1983 and the Public Enterprise Act 1996. This responsibility includes: designing, implementing and maintaining internal controls relevant to the preparation and fair presentation of financial statements that are free from material misstatement, whether due to fraud or error; selecting and applying appropriate accounting policies; and making estimates that are reasonable in the circumstances.
Auditor’s responsibility
My responsibility is to express an opinion on these financial statements based on the audit. I have conducted the audit in accordance with International Standards on Auditing. Those standards require that I comply with ethical requirements and plan and perform the audit to obtain reasonable assurance about whether the financial statements are free from material misstatement.
An audit involves performing procedures to obtain audit evidence about the amounts and disclosures in the financial statements. The procedures selected depend on the auditor’s judgement, including the assessment of the risks of material misstatement of the financial statements, whether due to fraud or error. In making those risk assessments, the auditor considers internal control relevant to the company’s preparation and fair presentation of the financial statements in order to design audit procedures that are appropriate in the circumstances, but not for the purpose of expressing an opinion on the effectiveness of the entity’s internal control. An audit also includes evaluating the appropriateness of accounting policies used and the reasonableness of accounting estimates made by the management, as well as evaluating the overall presentation of the financial statements.
I believe that the audit evidence [ have obtained is sufficient and appropriate to provide a basis for my audit opinion.
Basis for Qualified Opinion
As explained in Note 2(a) to the financial statements, the Company accounts for all government grants received after I January 20 I 0 as a capital contribution. This is a departure from the International Financial Reporting Standard lAS 20 “Accounting for Government Grants and Disclosure of Government Assistance” which requires government grants provided for the purchase or construction of assets to be recognized initially as deferred income and then recognized in profit or loss as other income on a systematic basis over the useful life of the related asset. Government grants that compensate the Company for expenses incurred are required to be recognized in profit or loss as other income on a systematic basis in the same period that the expenses are recognized.
The Company’s records indicate that had the Company complied with lAS 20, the impact would be to increase other income and retained earnings by $198,888 and $544,498 respectively, increase both government grants and total liabilities by $3,655, 123 and reduce capital contribution by $4,199,62I.
Independent Audit ReportFOR THE YEAR ENDED 31 DECEMBER, 2013
8th Floor, Ratu Sukuna House,MacArthur Street,
P.O.Box 2214,Government Building
Suva, Fiji Islands
Telephone: (679) 330 9032Fax: (679) 330 3812
Email: [email protected]: http://www.oag.gov.fj
REPUBLIC OF FIJIOffice Of the AuditOr GenerAl
Excellence in Public Sector Auditing
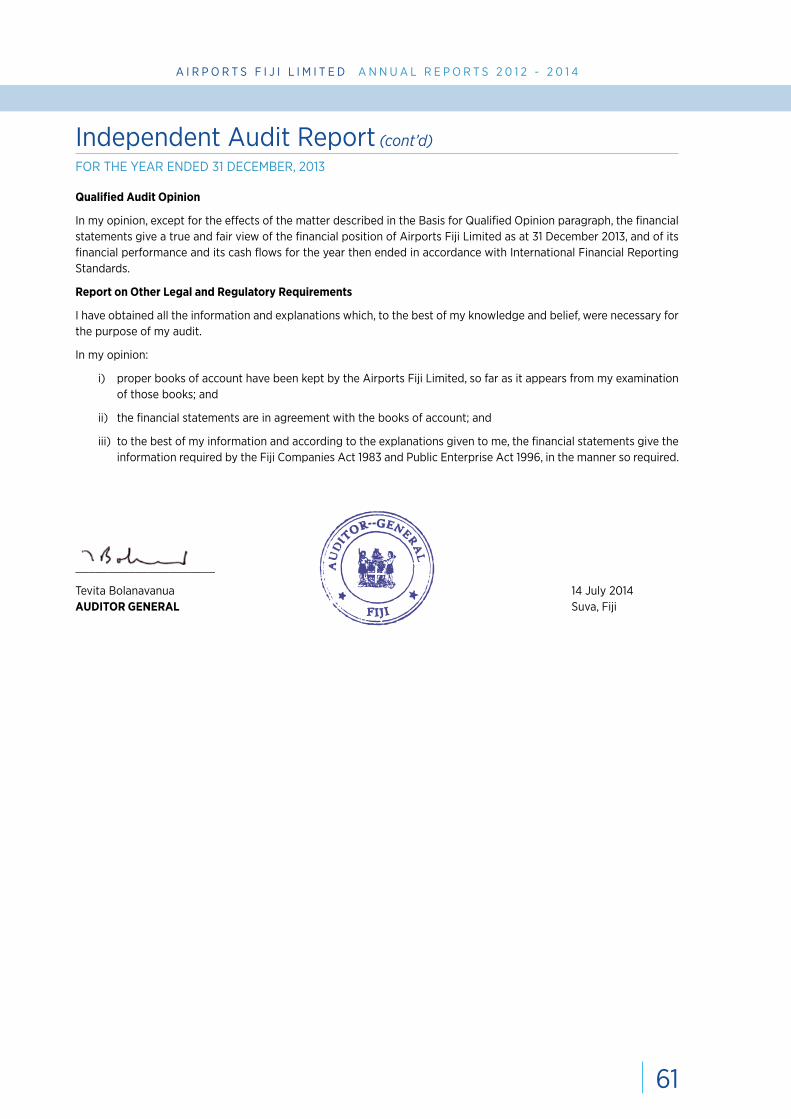
61
A i r p o r t s f i j i l i m i t e d A n n u A l r e p o r t s 2 0 1 2 - 2 0 1 4
Qualified Audit Opinion
In my opinion, except for the effects of the matter described in the Basis for Qualified Opinion paragraph, the financial statements give a true and fair view of the financial position of Airports Fiji Limited as at 31 December 2013, and of its financial performance and its cash flows for the year then ended in accordance with International Financial Reporting Standards.
Report on Other Legal and Regulatory Requirements
I have obtained all the information and explanations which, to the best of my knowledge and belief, were necessary for the purpose of my audit.
In my opinion:
i) proper books of account have been kept by the Airports Fiji Limited, so far as it appears from my examination of those books; and
ii) the financial statements are in agreement with the books of account; and
iii) to the best of my information and according to the explanations given to me, the financial statements give the information required by the Fiji Companies Act 1983 and Public Enterprise Act 1996, in the manner so required.
_____________________
Tevita Bolanavanua 14 July 2014AUDITOR GENERAL Suva, Fiji
Independent Audit Report (cont’d)
FOR THE YEAR ENDED 31 DECEMBER, 2013

62
A i r p o r t s f i j i l i m i t e d A n n u A l r e p o r t s 2 0 1 2 - 2 0 1 4
Notes 2013 2012 $ $Current assets Cash and cash equivalents 10 27,208,062 17,611 ,274Trade receivables 11 10,257,220 12,886,289Inventories 12 543,631 417,555Current tax asset 9(d) 214,610 -Prepayments and other assets 13 2,039,600 1,560,272Term deposits 14 7,000,000 7,000,000Total current assets 47,263,123 39,475,390
Non-current assetsProperty, plant and equipment 15 140,649,494 156,260,952Investment property 16 9,483,082 -Total non-current assets 150,132,576 156,260,952
Total assets 197,395,699 195,736,342
Current liabilitiesTrade and other payables 17 6,075,348 8,447,457Loans and borrowings 18 687,581 5,996,689Employee benefits 19 1,162,439 1,549,237Deferred revenue 20 629,634 407,850Government grants 21 290,556 346,111Current tax liability 9(d) - 568,040Total current liabilities 8,845,558 17,315,384
Non-current liabilitiesLoans and borrowings 18 827,329 1,574,657Employee benefits 19 42,405 44,760Deferred revenue 20 13,260,426 14,151,632Government grants 21 377,777 668,333Deferred tax liability 9(c) 6,409,711 7,454,361Total non-current liabilities 20,917,648 23,893,743
Total Liabilities 29,763,206 41,209,127
Net assets 167,632,493 154,527,215
Shareholder’s equityShare capital 22 92,300,180 92,300,180Retained earnings 71,132,692 58,220,876Capital contribution 4,199,621 4,006,159Total shareholder’s equity 167,632,493 154,527,215
Signed for and on behalf of the Board of Directors.
_____________________ _____________________Director Director
Statement of Financial PositionFOR THE YEAR ENDED 31 DECEMBER, 2013

63
A i r p o r t s f i j i l i m i t e d A n n u A l r e p o r t s 2 0 1 2 - 2 0 1 4
Detailed Profit and LossFOR THE YEAR ENDED 31 DECEMBER, 2013
2013 2012 $ $RevenueAir navigation charges 10,958,051 10,274,880Airport security and development fee 7,559,891 7,322,203Concessions 12,387,536 12,698,810Domestic passenger service charge 1,178,711 845,093Landing and parking fees - domestic 637,022 613,474Landing and parking fees - international 11,491,345 11,249,043Departure tax share 5,820,465 6,196,238Rental - offices and warehouses 3,071,167 3,254,999Rental - check-in-counter 947,951 998,126Terminal navigation aid charges 3,334,403 3,258,557Electricity recharge 2,687,213 2,974,282Gain on disposal of property, plant and equipment - 14,126Government grant 346,111 440,555Deferred income 669,422 629,634Identification card charges 113,354 106,020Interest on term deposit 232,146 267,473Sundry income 1,033,468 1,196,677Car park charges 562,030 546,716Unrealised exchange gain 69,377 65,425Insurance proceeds 734,010 -Total income 63,833,673 62,952,331
ExpensesAllowance for uncollectible receivables 69,445 779,191Airport inspection and license fees 410,852 366,106Auditors’ remuneration 18,261 13,000Bad debts - 247,533Bank charges 25,520 19,245Board expenses 17,884 12,098Consultancy 242,010 636,071Contract costs 4,136,713 3,281,275Depreciation 12,743,962 12,221,399Director’s remuneration 35,210 47,666Insurance 2,037,382 1,913,414Interest 44,533 445,038Land rental 654,948 667,950Loss on disposal of property, plant and equipment 86,778 -Meteorological costs 521,739 521,739Other expenses 720,873 1,075,379Post and telecommunications 1,327,157 1,222,431Repairs and maintenance 2,098,286 2,384,682Share of Air Traffic Management income 463,472 465,199Sundry costs and supplies 492,294 722,700Training and conference 425,286 295,607Travel and accommodation 294,332 393,080Unrealised exchange loss 7 2,391Utilities and services 5,828,728 6,172,898Vehicle and fuel costs 836,499 835,032Wages and salaries 14,277,589 14,082,001Total expenditure 47,809,760 48,823,125
Operating profit before tax 16,023,913 14,129,206

64
A i r p o r t s f i j i l i m i t e d A n n u A l r e p o r t s 2 0 1 2 - 2 0 1 4
Financial StatementsFor the Year Ended 31 December 2012
Contents
The full financial statements for 2012 and 2013 can be viewed on the AFL website : www.airportsfiji.com
Directors’ Report 65
Independent Audit Report 66
Statement of Financial Position 67
Detailed Income Statement 68

65
A i r p o r t s f i j i l i m i t e d A n n u A l r e p o r t s 2 0 1 2 - 2 0 1 4
Director’s ReportFOR THE YEAR ENDED 31 DECEMBER, 2012
The Board of Directors present their report together with the Financial Statements of Airports Fiji Limited for the year ended 31 December 2012 and the auditors’ report thereon.
Directors
The directors of the company in office at the date of this report are:Mr. Faiz KhanMr. Samuela Tamani
State of affairs
In the opinion of the directors, the accompanying statement of financial position give a true and fair view of the state of affairs of the company as at 31 December 2012 and that the accompanying statement of comprehensive income, statement of changes in equity and statement of cash flows give a true and fair view of the results and cash flows for the company for the year then ended.
Principal Activity
The principal activities of the company during the financial year included provision of air navigation services, the operation and management of the Nadi International Airport and other airports throughout Fiji.
Results
The net profit for the company for the year was $11,277,360 (2011: $12,478,126) after taking into account an income tax expense of$2,851,846 (2011 income tax benefit: $236,431).
Dividend
During the year, the directors declared and paid a dividend of $1,000,000 (2011: $1,000,000).
Reserves
The directors recommend that no amounts be transferred to reserves within the meaning of the Seventh Schedule of the FijiCompanies Act, 1983.
Events Subsequent to Balance Date
No matters or circumstances have arisen since the end of the financial year which significantly affected or may significantly affect the operations of the company, the results of those operations, or the state of affairs of the company in future financial years.
Dated at Nadi this day of 2013.
Signed in accordance with a resolution of the Board of Directors
_____________________ _____________________Director Director

66
A i r p o r t s f i j i l i m i t e d A n n u A l r e p o r t s 2 0 1 2 - 2 0 1 4
Independent Audit ReportFOR THE YEAR ENDED 31 DECEMBER, 2012
8th Floor, Ratu Sukuna House,MacArthur Street,
P.O.Box 2214,Government Building
Suva, Fiji Islands
Telephone: (679) 330 9032Fax: (679) 330 3812
Email: [email protected]: http://www.oag.gov.fj
REPUBLIC OF FIJIOffice Of the AuditOr GenerAl
Excellence in Public Sector Auditing
I have audited the accompanying Financial Statements of Airports Fiji Limited, which comprises the statement of financial position as at 31 December 2012, the statement of comprehensive income, the statement of changes in equity, the statement of cash flows for the year then ended and a summary of significant accounting policies and other explanatory notes.
Directors’ and Management’s responsibility for the Financial StatementsThe Directors and Management are responsible for the preparation and fair presentation of these Financial Statements in accordance with International Financial Reporting Standards, the requirements of the Fiji Companies Act 1983 and the Public Enterprise Act 1996. This responsibility includes: designing, implementing and maintaining internal controls relevant to the preparation and fair presentation of Financial Statements that are free from material misstatement, whether due to fraud or error; selecting and applying appropriate accounting policies; and making estimates that are reasonable in the circumstances.
Auditor’s responsibilityMy responsibility is to express an opinion on these Financial Statements based on the audit. I conducted the audit in accordance with International Standards on Auditing. Those standards require that I comply with ethical requirements and plan and perform the audit to obtain reasonable assurance about whether the Financial Statements are free from material misstatement.
An audit involves performing procedures to obtain audit evidence about the amounts and disclosures in the Financial Statements. The procedures selected depend on the auditor’s judgement, including the assessment of the risks of material misstatement of the Financial Statements, whether due to fraud or error. In making those risk assessments, the auditor considers internal control relevant to the Company’s preparation and fair presentation of the Financial Statements in order to design audit procedures that are appropriate in the circumstances, but not for the purpose of expressing an opinion on the effectiveness of the Company’s internal control. An audit also includes evaluating the appropriateness of accounting policies used and the reasonableness of accounting estimates made by the management, as well as evaluating the overall presentation of the Financial Statements.
I believe that the audit evidence I have obtained is sufficient and appropriate to provide a basis for my audit opinion.
Audit opinionIn my opinion
(a) proper books of account have been kept by the Company, so far as it appears from my examination of those books, and
(b) and the accompanying Financial Statements which have been prepared in accordance with International Financial Reporting Standards;
(i) are in agreement with the books of account; (ii) to the best of my information and according to the explanations given to me:
(a) give a true fair view of the state of affairs of the Company as at 31 December 2012 and of its financial performance, changes in equity and its cash flows of the year ended on that date; and
(b) give the information required by the Fiji Companies Act., 1983 in the manner so required.
I have obtained all the information and explanations, which to the best of my knowledge and belief, were necessary for the purposes of the audit.
Tevita Bolanavanua 12 June 2013AUDITOR GENERAL Suva, Fiji

67
A i r p o r t s f i j i l i m i t e d A n n u A l r e p o r t s 2 0 1 2 - 2 0 1 4
Notes 2012 2011 Restated* $ $ASSETSCurrent assetsCash and cash equivalents 6 17,611,274 13,715,916Trade receivables 7 12,886,289 11,465,158Inventories 8 417,555 312,577Prepayments and other assets 9 1,560,272 2,014,876Other financial assets 10 7,000,000 7,000,000 39,475,390 34,508,527Non-current assets Property, plant and equipment 11 156,260,952 157,513,476Deferred tax asset 3c 656,451 564,732 156,917,403 158,078,208TOTAL ASSETS 196,392,793 192,586,735
EQUITY AND LIABILITIES Shareholders’ equity Share capital 12 92,300,180 92,300,180Retained earnings 58,220,876 47,943,516Capital contribution 4,006,159 2,858,139Total equity 154,527,215 143,101,835
Current liabilities Trade and other payables 13 8,447,457 5,714,710Interest-bearing loans and borrowings 14 5,996,689 6,879,457Provisions 15 1,549,237 1,537,322Deferred revenue 16 407,850 407,850Government grants 17 346,111 440,555Income tax payable 568,040 2,843,253 17,315,384 17,823,147
Non-current liabilities Interest-bearing loans and borrowings 14 1,574,657 7,085,558Provisions 15 44,760 44,720Deferred revenue 16 14,151,632 14,781,266Government grants 17 668,333 1,014,444Deferred tax liability 3c 8,110,812 8,735,765 24,550,194 31,661,753
TOTAL LIABILITIES 41,865,578 49,484,900
TOTAL EQUITY AND LIABILITIES 196,392,793 192,586,735
* Certain amounts shown here do not correspond to the 2011 financial statements and reflect adjustments made as detailed in Note 1.3 and Note 23.
Signed for and on behalf of the Board of Directors
_____________________ _____________________Director Director
Statement of Financial PositionFOR THE YEAR ENDED 31 DECEMBER, 2012
The accompanying notes form an integral part of the Statement of Financial Position.

68
A i r p o r t s f i j i l i m i t e d A n n u A l r e p o r t s 2 0 1 2 - 2 0 1 4
Detailed Income StatementFOR THE YEAR ENDED 31 DECEMBER, 2012
2012 2011 $ $RevenueAir navigation charges 10,274,880 10,314,820Airport security and development fee 7,322,203 6,936,256Concessions 12,698,810 12,832,005Domestic passenger service charge 845,093 -Landing and parking fees - domestic 613,474 672,809Landing and parking fees - international 11,249,043 11,504,894Departure tax share 6,196,238 4,563,412Rental - offices and warehouses 3,254,999 3,169,400Rental - check-in-counter 998,126 545,961Terminal navigation aid charges 3,258,557 3,352,641Electricity recharge 2,974,282 2,963,221Gain on disposal of property, plant and equipment 14,126 37,655Government grant 440,555 804,516Deferred income 629,634 703,032Identification card charges 106,020 71,318Interest on term deposit 267,473 449,728Sundry income 1,196,677 786,978Car park charges 546,716 513,918Unrealised exchange gain 65,425 589Total income 62,952,331 60,223,153
Expenses Allowance for uncollectible receivables 779,191 683,431Airport inspection and license fees 366,106 277,061Auditors’ remuneration 13,000 13,000Bad debts 247,533 -Board expenses 12,098 42,173Consultancy 636,071 800,610Contract costs 3,281,275 3,237,358Depreciation 12,221,399 11,712,656Director’s remuneration 47,666 43,532Insurance 1,913,414 1,728,522Interest and bank charges 464,283 843,823Land rental 667,950 633,882Meteorological costs 521,739 521,739Other expenses 1,075,379 779,513Post and telecommunications 1,222,431 1,006,221Repairs and maintenance 2,384,682 3,232,503Share of ATM income 465,199 465,369Sundry costs and supplies 722,700 589,970Training and conference 295,607 262,082Travel and accommodation 393,080 523,281Unrealised exchange loss 2,391 141,722Utilities and services 6,172,898 5,927,208Vehicle and fuel costs 835,032 907,225Wages and salaries 14,082,001 13,608,577Total expenditure 48,823,125 47,981,458
Operating profit before tax 14,129,206 12,241,695

Registered OfficeAirports Fiji Limited
AFL CompoundNamaka
Nadi
Postal AddressAirports Fiji Limited
Private Mail BagNadi AirportFiji Islands
Telephone:(679) 672 5777
Fax:(679) 672 5161
Email:[email protected]
Website:www.airportsfiji.com
Bankers:Westpac Banking Corporation
Auditor:Office of the Auditor General
