outcome of diabetic pregnancy comparison of north east england with norway december 2000 gillian...
TRANSCRIPT

Outcome of diabetic Outcome of diabetic pregnancypregnancy
Comparison of North East England Comparison of North East England with Norwaywith Norway
December 2000December 2000
Gillian HawthorneGillian Hawthorne

Dr HawthorneDr Hawthorne
Consultant Diabetologist based at Consultant Diabetologist based at Newcastle Diabetes Centre, Newcastle Diabetes Centre, Newcastle-upon-TyneNewcastle-upon-Tyne
Interested in diabetic pregnancy since Interested in diabetic pregnancy since 19901990
Studied with David Hadden, Belfast Studied with David Hadden, Belfast and Lois Jovanovic, New Yorkand Lois Jovanovic, New York

St Vincent’s declarationSt Vincent’s declaration
Achieve pregnancy outcome in the Achieve pregnancy outcome in the diabetic woman that approximates that diabetic woman that approximates that of the non diabetic womanof the non diabetic woman

England and England and the North Eastthe North East

Norway Norway
BergenBergenMedical birth registryMedical birth registry

Northern Diabetic Pregnancy SurveyNorthern Diabetic Pregnancy Survey
Prospective population based surveyProspective population based survey Perinatal mortality for diabetic Perinatal mortality for diabetic
pregnancy 48/1000 compared to pregnancy 48/1000 compared to background of 8.9/1000background of 8.9/1000
Congenital malformation rate for Congenital malformation rate for diabetic pregnancy 83/1000 diabetic pregnancy 83/1000 compared to 21.3/1000 compared to 21.3/1000

Diabetic Pregnancy outcome for the UKDiabetic Pregnancy outcome for the UK
per 1000 per 1000 DiabetesDiabetes
BackgroundBackground DiabetesDiabetes BackgroundBackground
Merseyside Merseyside 1990-94 1990-94Northern Northern IrelandIreland
36.136.1
3737
7.67.6N/AN/A
9.7%9.7%
5%5%
Perinatal MortalityPerinatal Mortality Birth DefectBirth Defect

Perinatal Deaths in Norway 1987-1996Perinatal Deaths in Norway 1987-1996
Perinatal deaths in diabetic pregnancyPerinatal deaths in diabetic pregnancy
»11.8 per 100011.8 per 1000 Perinatal deaths in non-diabetic pregnancyPerinatal deaths in non-diabetic pregnancy
»6.7 per 10006.7 per 1000 Perinatal deaths = stillbirth at 28 Perinatal deaths = stillbirth at 28
completed weeks or neonatal death completed weeks or neonatal death <7th day of life<7th day of life

Aim of studyAim of study
To determine if the difference in To determine if the difference in diabetic pregnancy outcome between diabetic pregnancy outcome between Norway and North East England can Norway and North East England can be explained by procedural differences:be explained by procedural differences:
Are there differences in recording data?Are there differences in recording data? Are the differences in recorded Are the differences in recorded
outcome real?outcome real?

MethodsMethods
All data collected prospectively between 1st All data collected prospectively between 1st July 1994 and 30th June 1997July 1994 and 30th June 1997
In Norway compulsory notification of all In Norway compulsory notification of all pregnancies with gestational age of 16 pregnancies with gestational age of 16 completed weeks or more completed weeks or more
In north East England notification of all In north East England notification of all diabetic pregnancy to Northern Diabetic diabetic pregnancy to Northern Diabetic pregnancy Survey pregnancy Survey

Standardisation of definitionsStandardisation of definitions
Stillbirths defined as all fetal deaths more Stillbirths defined as all fetal deaths more than 24 completed weeksthan 24 completed weeks
Perinatal mortality all stillbirths >24 Perinatal mortality all stillbirths >24 completed weeks and all live birthscompleted weeks and all live births
Congenital anomalies coded using ICD 8Congenital anomalies coded using ICD 8

Terminations for birth defects included Terminations for birth defects included in both numerators and denominatorsin both numerators and denominators
Relative risks approximated by odds Relative risks approximated by odds ratioratio

Perinatal Mortality in North East EnglandPerinatal Mortality in North East England
Total Total NumberNumber
Perinatal Perinatal DeathsDeaths
Perinatal Perinatal mortality mortality
/1000/1000
With diabetesWith diabetes 304304 1313 42.842.8
Without diabetesWithout diabetes 101516101516 10141014 10.010.0
Relative Relative riskrisk
4.44.4[2.5-7.7][2.5-7.7]
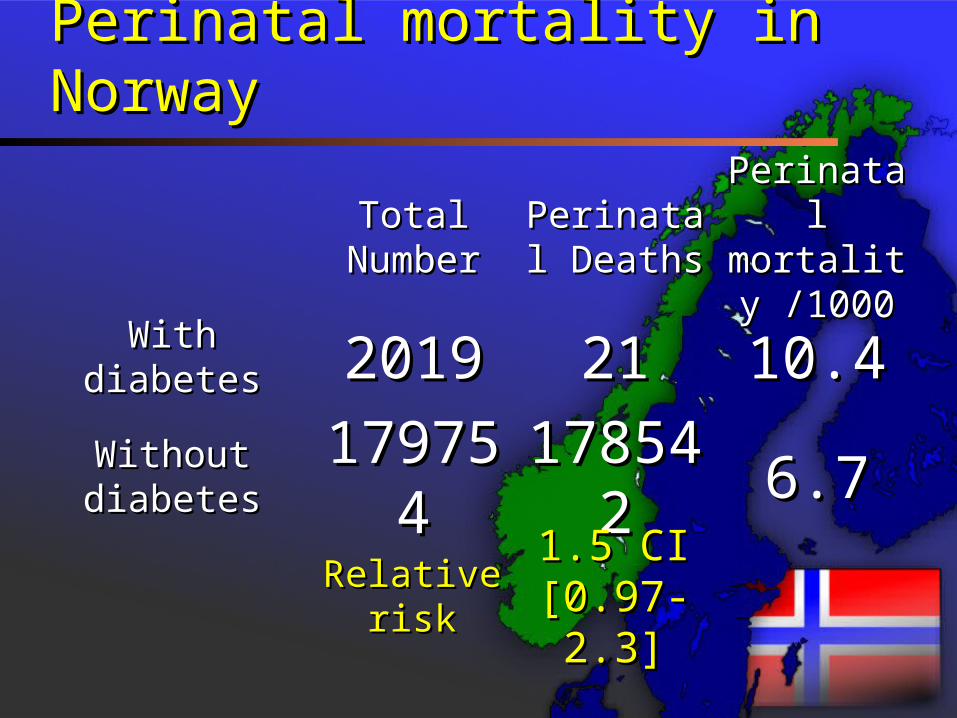
Perinatal mortality in NorwayPerinatal mortality in Norway
Total Total NumberNumber
Perinatal Perinatal DeathsDeaths
Perinatal Perinatal mortality mortality
/1000/1000
With diabetesWith diabetes 20192019 2121 10.410.4
Without diabetesWithout diabetes 179754179754 178542178542 6.76.7
Relative Relative riskrisk
1.5 CI1.5 CI[0.97-2.3][0.97-2.3]

Birth Defects in North East EnglandBirth Defects in North East England
Total Total NumberNumber
Birth Birth DefectsDefects
Birth Birth Defects Defects /1000/1000
Babies of:Babies of:Mothers with Mothers with
diabetesdiabetes309309 1717 55.055.0
Mothers without Mothers without diabetesdiabetes 101755101755 24722472 24.324.3
Relative Relative riskrisk
2.5 CI2.5 CI[1.5-4.0][1.5-4.0]

Birth defects in NorwayBirth defects in Norway
Total Total NumberNumber
Birth Birth DefectsDefects
Birth Birth Defects Defects /1000/1000
Babies of:Babies of:Mothers with Mothers with
diabetesdiabetes20192019 5858 28.728.7
Mothers without Mothers without diabetesdiabetes 179754179754 54655465 30.430.4
Relative Relative riskrisk
0.95 CI0.95 CI[0.73-1.2][0.73-1.2]

SummarySummary
In North East England -In North East England -
– The perinatal mortality for offspring of The perinatal mortality for offspring of mothers with diabetes was 42.8/1000 - mothers with diabetes was 42.8/1000 - a 4 fold increase in risk compared to a 4 fold increase in risk compared to offspring of mothers without diabetesoffspring of mothers without diabetes
– The risk of birth defects was 2.5 fold The risk of birth defects was 2.5 fold increasedincreased

SummarySummary In NorwayIn Norway
– Perinatal mortality was 10.4/1000 for Perinatal mortality was 10.4/1000 for offspring of mothers with diabetes- offspring of mothers with diabetes- 1.5 fold increase compared to 1.5 fold increase compared to offspring of mothers without diabetesoffspring of mothers without diabetes
– Risk of birth defects for offspring of Risk of birth defects for offspring of mothers with diabetes was 0.95mothers with diabetes was 0.95

Relative risks between North East Relative risks between North East England and NorwayEngland and Norway
The differences were significant The differences were significant [p=0.0002] for the relative risk of [p=0.0002] for the relative risk of perinatal mortality adjusted for perinatal mortality adjusted for maternal agematernal age
The differences were significant The differences were significant [p=0.0008] for relative risks for birth [p=0.0008] for relative risks for birth defect adjusted for maternal agedefect adjusted for maternal age

ConclusionConclusion
In Norway the outcome of diabetic In Norway the outcome of diabetic pregnancy is similar to that of the pregnancy is similar to that of the background populationbackground population
Diabetic pregnancy remains high risk in Diabetic pregnancy remains high risk in North East England North East England
Further research is required to understand Further research is required to understand what is the cause of this difference what is the cause of this difference