outlook for agriculture and fertilizer demand in the ... · fodder maize 8% other feed crops 2%...
TRANSCRIPT

Dmitry Magazanik
EuroChem
Outlook for agriculture and fertilizer
demand in the Russian Federation

2
Area and climate
Outlook for agriculture
Total area of Russia is
17.1 million km2
• largest country in the world;
• covers more than 1/8
of the Earth’s inhabited land area;
• multiple climate zones;
• over 2 million rivers;
• most freshwater resources
are contained in the permafrost.
3
Agricultural area; planted area dynamics
Outlook for agriculture
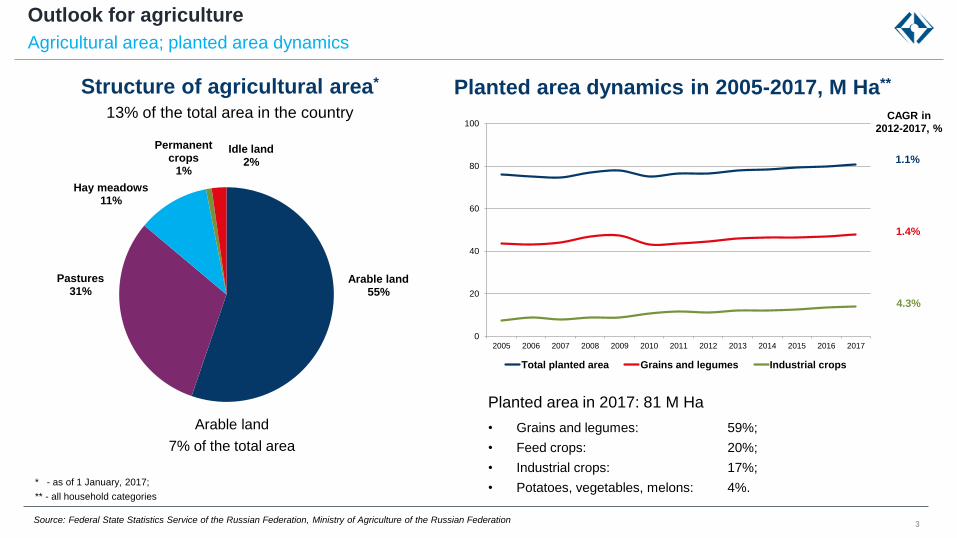
Structure of agricultural area*
13% of the total area in the country
Arable land
7% of the total area
* - as of 1 January, 2017;
** - all household categories
Planted area dynamics in 2005-2017, M Ha**
CAGR in
2012-2017, %
1.1%
1.4%
4.3%
Planted area in 2017: 81 M Ha
• Grains and legumes: 59%;
• Feed crops: 20%;
• Industrial crops: 17%;
• Potatoes, vegetables, melons: 4%.
Source: Federal State Statistics Service of the Russian Federation, Ministry of Agriculture of the Russian Federation
Arable land55%
Pastures31%
Hay meadows11%
Permanent crops
1%
Idle land2%
0
20
40
60
80
100
2005 2006 2007 2008 2009 2010 2011 2012 2013 2014 2015 2016 2017
Total planted area Grains and legumes Industrial crops

4
Structure of planted area in Russia
Outlook for agriculture
Grains and legumes
Source: Federal State Statistics Service of the Russian Federation
Industrial crops
Feed crops
Perennial grass65%
Annual grass25%
Fodder maize8%
Other feed crops
2%
Winter wheat31%
Spring wheat27%
Spring barley16%
Grain maize6%
Oat6%
Buckwheat4%
Winter rye3%
Other grains and legumes
7%
Sunflower seeds57%
Soybeans19%
Sugar beet9%
Rape7%
Other industrial crops
8%

5
Yield of crops
Outlook for agriculture
Krasnodar region
2000: 3.4
2017: 6.2
Yield of various crops in 2000-2017, t/Ha(all household categories)
Winter wheat yield in different regions,
t/Ha
Tula region
2000: 2.8
2017: 5.9
Leningrad region
2000: 1.2
2017: 2.7
Source: Federal State Statistics Service of the Russian Federation
1,6
3,1
1,62,2
1,7
2,6
0,91,4
10,5
15,614,3
23,6
0
5
10
15
20
25
2000 2005 2010 2015 2017
Wheat Rye Barley Oilseeds Potatoes Vegetables

6
Cultivated area and grain production
Outlook for agriculture
Over a ~40-year period production effectiveness
increased more than 2.5 times.
Grain production in 1978 and 2017 Key drivers
of agricultural development:
• implementation of new resource efficient
customized technologies;
• irrigation expansion;
• growing greenhouse area;
• agriculture biologization and greening;
• more complex mineral nutrition
within increasing fertilizer consumption.
Source: Ministry of Agriculture of the Russian Federation
0
50
100
150
USSR, 1978 Russia, 2017
Planted area, M Ha Grain production, M t

7
Implementation of new technologies: Agricultural Lands Atlas
Key drivers for agriculture development
Agricultural Lands Atlas (ALA)
• created by order of Ministry of Agriculture
of the Russian Federation;
• consists of four main parts:
• Survey field data collection system based on GNSS receivers and Mobile GIS platform;
• Storage of remote sensing data serve as the basis for agricultural land mapping
and automated interpretation of vegetation condition;
• Agricultural lands geodatabase used for automatic update of the central storage
by exchanging data with agrochemists;
• Web-interface (geoportal) designed for data publication.
Source: Ministry of Agriculture of the Russian Federation

8
Implementation of new technologies: satellite crop monitoring and subsoil fertilizer application
Key drivers for agriculture development
Liquid fertilizers (UAN, APP, complex/NPK(S) grades)
become more widely used.
Satellite crop monitoring New technologies for fertilizer
application latest developments in domestic agricultural machinery
• connected with implementation of:
• flying drones;
• software for optimization of agricultural processes;
• allows to conduct:
• interactive mapping;
• relief 3D models development;
• NDVI measurement;
• phytosanitary control.
9
Implementation of new technologies: alternative soil cultivation
Key drivers for agriculture development
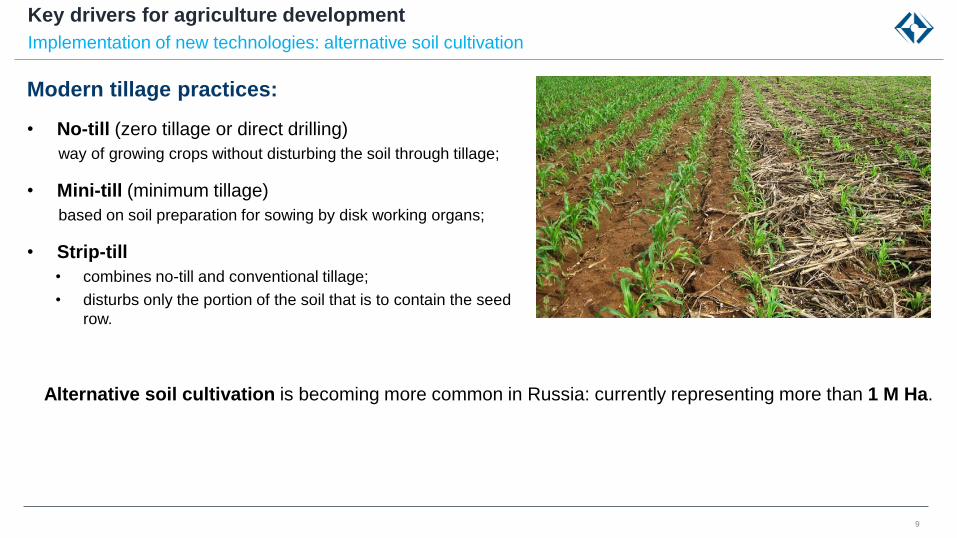
Modern tillage practices:
• No-till (zero tillage or direct drilling)
way of growing crops without disturbing the soil through tillage;
• Mini-till (minimum tillage)
based on soil preparation for sowing by disk working organs;
• Strip-till
• combines no-till and conventional tillage;
• disturbs only the portion of the soil that is to contain the seed
row.
Alternative soil cultivation is becoming more common in Russia: currently representing more than 1 M Ha.
10
Implementation of new technologies: irrigation expansion
Key drivers for agriculture development
Source: Ministry of Agriculture of the Russian Federation
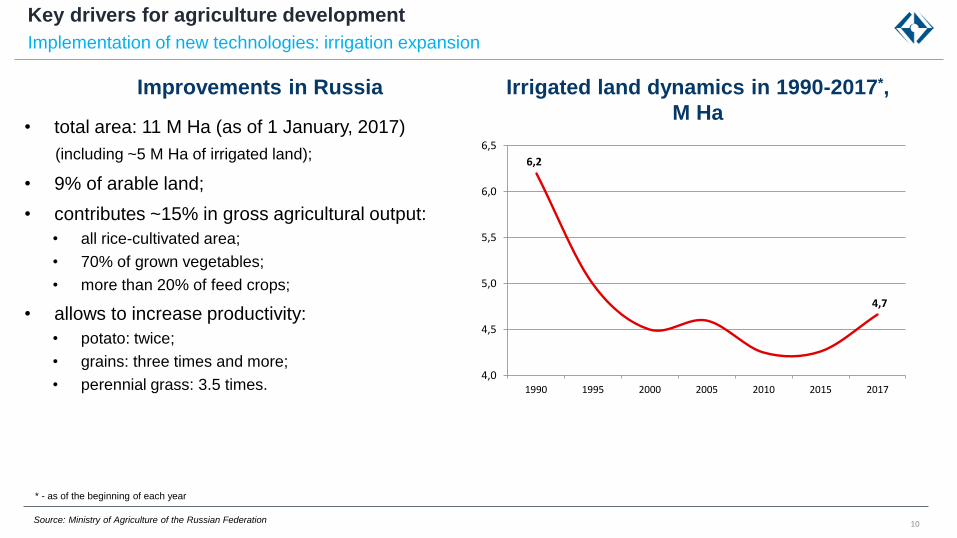
Irrigated land dynamics in 1990-2017*,
M Ha
Improvements in Russia
• total area: 11 M Ha (as of 1 January, 2017)
(including ~5 M Ha of irrigated land);
• 9% of arable land;
• contributes ~15% in gross agricultural output:
• all rice-cultivated area;
• 70% of grown vegetables;
• more than 20% of feed crops;
• allows to increase productivity:
• potato: twice;
• grains: three times and more;
• perennial grass: 3.5 times.
6,2
4,7
4,0
4,5
5,0
5,5
6,0
6,5
1990 1995 2000 2005 2010 2015 2017
* - as of the beginning of each year

11
Implementation of new technologies: growing greenhouse area
Key drivers for agriculture development
Source: “Greenhouses of Russia” Association
Structure of greenhouse production
in 2017
0
1
2
3
4
2000 2005 2010 2015 2017 2020
Cucumber66%
Tomato31%
Other agricultural crops
3%
Greenhouse dynamics in 2000-2020,
thousand Ha

12
Implementation of new technologies: agriculture biologization and greening
Key drivers for agriculture development
Current dynamics in agriculture biologization:
• growing interest in microbial products, particular attention focused on biological soil components
(soil microflora, its composition and activity);
• nationwide introduction of uniform standards for biological and organic farming;
• BIO fertilizer application (microbial products, humates, etc.);
• implementation of “green” technologies (crop residue recycling, use of siderates);
• certified organic agriculture (adoption of ameliorants and products for organic production);
• recultivation of abandoned, saline and eroded agricultural lands.

13
Implementation of new technologies: complex mineral nutrition
Key drivers for agriculture development
2010 2017
Structure of mineral fertilizer supplies for agriculture(calculated from nutrients)
By now the structure’s:
• become more balanced;
• enriched with value added products (liquid, water-soluble, enhanced efficiency fertilizers).
Source: Azotecon, EuroChem’s estimation (based on data by Ministry of Agriculture of the Russian Federation and Russian Fertilizer Producers Association)
Ammonium Nitrate
45%
NPKs32%
MAP 12%
Urea4%
MOP3%
UAN>1%
Other fertilizers4%
Ammonium Nitrate
41%
NPKs26%
MAP 18%
Urea5%
MOP1%
UAN4%
Other fertilizers5%

14
0
2
4
6
8
10
1991
1992
1993
1994
1995
1996
1997
1998
1999
2000
2001
2002
2003
2004
2005
2006
2007
2008
2009
2010
2011
2012
2013
2014
2015
2016
2017
N P2O5 K2O
Implementation of new technologies: growing fertilizer consumption
Key drivers for agriculture development
Dynamics of fertilizer supplies
for agriculture in 1991-2017,
M t of nutrients
Source: Federal State Statistics Service of the Russian Federation, Azotecon, EuroChem’s estimation
Average fertilizer application,
kg nutrients per Ha of crops
1719
25
3842
55
0
10
20
30
40
50
60
1995
1996
1997
1998
1999
2000
2001
2002
2003
2004
2005
2006
2007
2008
2009
2010
2011
2012
2013
2014
2015
2016
2017
15
Russian Federation in the global fertilizer industry
Mineral fertilizer industry
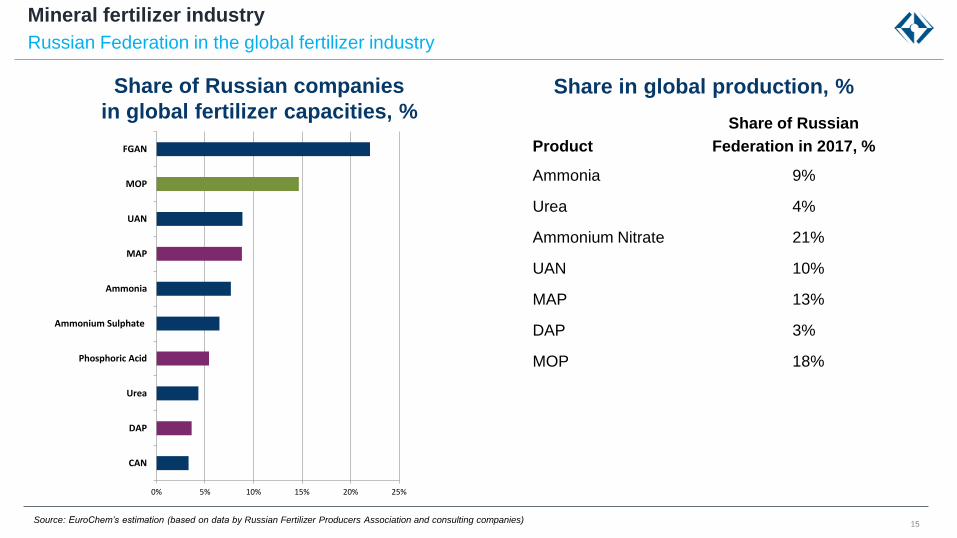
Share of Russian companies
in global fertilizer capacities, %
Source: EuroChem’s estimation (based on data by Russian Fertilizer Producers Association and consulting companies)
Share in global production, %
Share of Russian
Federation in 2017, %
Ammonia
Urea
Ammonium Nitrate
UAN
MAP
DAP
MOP
9%
4%
21%
10%
13%
3%
18%
Product
0% 5% 10% 15% 20% 25%
CAN
DAP
Urea
Phosphoric Acid
Ammonium Sulphate
Ammonia
MAP
UAN
MOP
FGAN
16
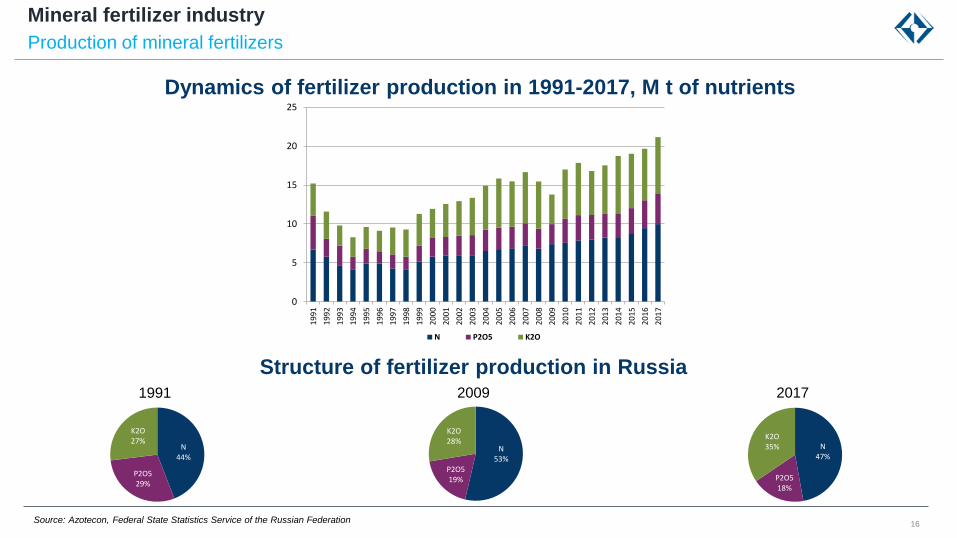
Production of mineral fertilizers
Mineral fertilizer industry
Dynamics of fertilizer production in 1991-2017, M t of nutrients
Structure of fertilizer production in Russia1991 2009 2017
Source: Azotecon, Federal State Statistics Service of the Russian Federation
0
5
10
15
20
25
1991
1992
1993
1994
1995
1996
1997
1998
1999
2000
2001
2002
2003
2004
2005
2006
2007
2008
2009
2010
2011
2012
2013
2014
2015
2016
2017
N P2O5 K2O
N44%
P2O529%
K2O27%
N53%
P2O519%
K2O28%
N47%
P2O518%
K2O35%

17
Structure of fertilizer production in 2017
Mineral fertilizer industry
Nitrogen fertilizers
Source: Azotecon, Russian Fertilizer Producers Association, EuroChem’s estimation
Phosphate fertilizers
* - calculated from K2O
NPK fertilizers*
Urea36%
Ammonium Nitrate
27%
UAN7%
Stabilized Ammonium
Nitrate3%
Ammonium Sulphate
3%
CAN1%
Other N-containing fertilizers
23% MAP42%
DAP14%
NP4%
APP2%
Other P-containing fertilizers
38%
NPK 16:16:16/15:15:15
39%
NPK 10:26:2622%
NK grades2%
Blends1%
Other NPK grades
36%

18
Export of mineral fertilizers
Mineral fertilizer industry
Dynamics of fertilizer exports, M t of nutrients Export share of sales in 2017, %
Nitrogen
Phosphate
Potash
Source: Azotecon, Federal State Statistics Service of the Russian Federation, EuroChem’s estimation
Export structure in 2017
0
5
10
15
20
2000
2001
2002
2003
2004
2005
2006
2007
2008
2009
2010
2011
2012
2013
2014
2015
2016
2017
N P2O5 K2O
N38%
P2O515%
K2O47%
Export78%
Export96%
Export77%

19
National fertilizer development plan
Mineral fertilizer industry
Main 2025 targets:
• to increase fertilizer production by 35% (compared to 2016) up to 28 M t nutrients;
• to raise export share of output up to 75% (vs 71% in 2016);
• to increase average fertilizer application by 23% (to 60 kg nutrients per Ha of crops).
2020 2025
Production, M t of nutrients 20,8 24,1 28,0
including N 9,5 11,7 12,3
P2O5 3,6 3,8 4,0
K2O 7,8 8,6 11,7
Export share of output, % 71 75 75
including Nitrogen fertilizers 63 65 65
Phosphate fertilizers 80 80 78
Potash fertilizers 87 88 89
Average fertilizer application, kg nutrients/Ha 48,8 54 60
Parameter 2016Target indicators

Thank you