overview: investigating the tree of life
TRANSCRIPT

Copyright © 2008 Pearson Education, Inc., publishing as Pearson Benjamin Cummings
Overview: Investigating the Tree of Life
• Phylogeny is the evolutionary history of a
species or group of related species
• The discipline of systematics classifies
organisms and determines their evolutionary
relationships
• Systematists use fossil, molecular, and genetic
data to infer evolutionary relationships

Fig. 26-2
Taxonomy is the ordered division
and naming of organisms

Copyright © 2008 Pearson Education, Inc., publishing as Pearson Benjamin Cummings
Binomial Nomenclature
• In the 18th century, Carolus Linnaeus
published a system of taxonomy based on
resemblances
• Two key features of his system remain useful
today: two-part names for species and
hierarchical classification

Fig. 26-3
Species: Panthera pardus
Genus: Panthera
Family: Felidae
Order: Carnivora
Class: Mammalia
Phylum: Chordata
Kingdom: Animalia
Archaea Domain: Eukarya Bacteria
Linnaeus introduced a
system for grouping
species in increasingly
broad categories
The taxonomic groups
from broad to narrow
are domain, kingdom,
phylum, class, order,
family, genus, and
species
A taxonomic unit at any
level of hierarchy is
called a taxon
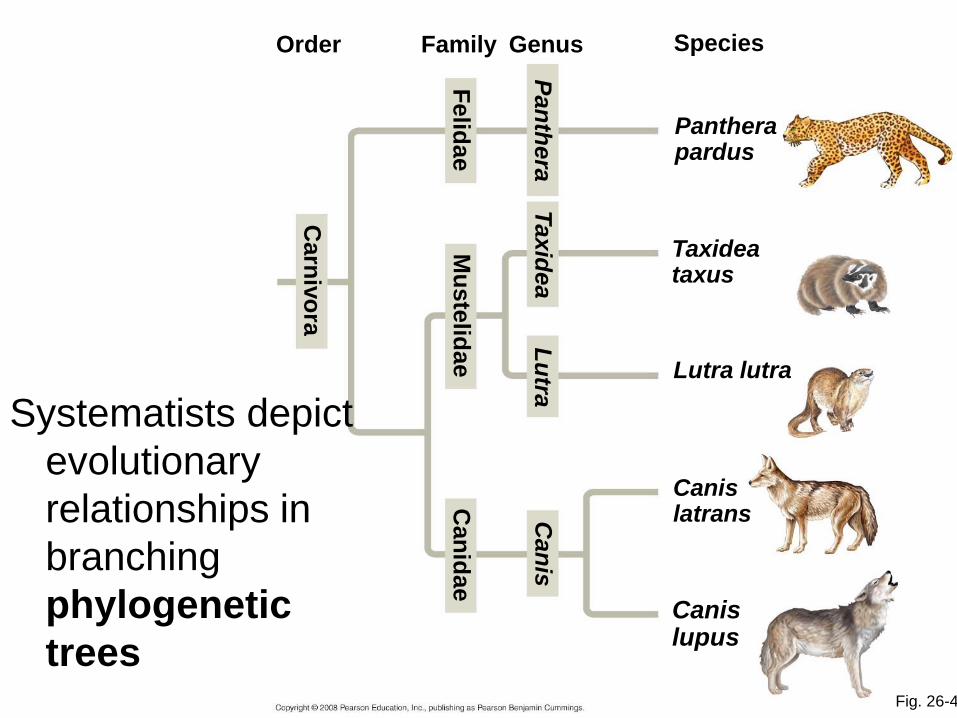
Fig. 26-4
Species
Canis lupus
Pantherapardus
Taxidea taxus
Lutra lutra
Canis latrans
Order Family Genus
Carn
ivo
ra
Felid
ae
Mu
ste
lidae
Can
idae
Can
is
Lu
tra
Taxid
ea
Pan
thera
Systematists depict
evolutionary
relationships in
branching
phylogenetic
trees

Copyright © 2008 Pearson Education, Inc., publishing as Pearson Benjamin Cummings
• A phylogenetic tree represents a hypothesis
about evolutionary relationships
• Each branch point represents the divergence
of two species
• Sister taxa are groups that share an
immediate common ancestor
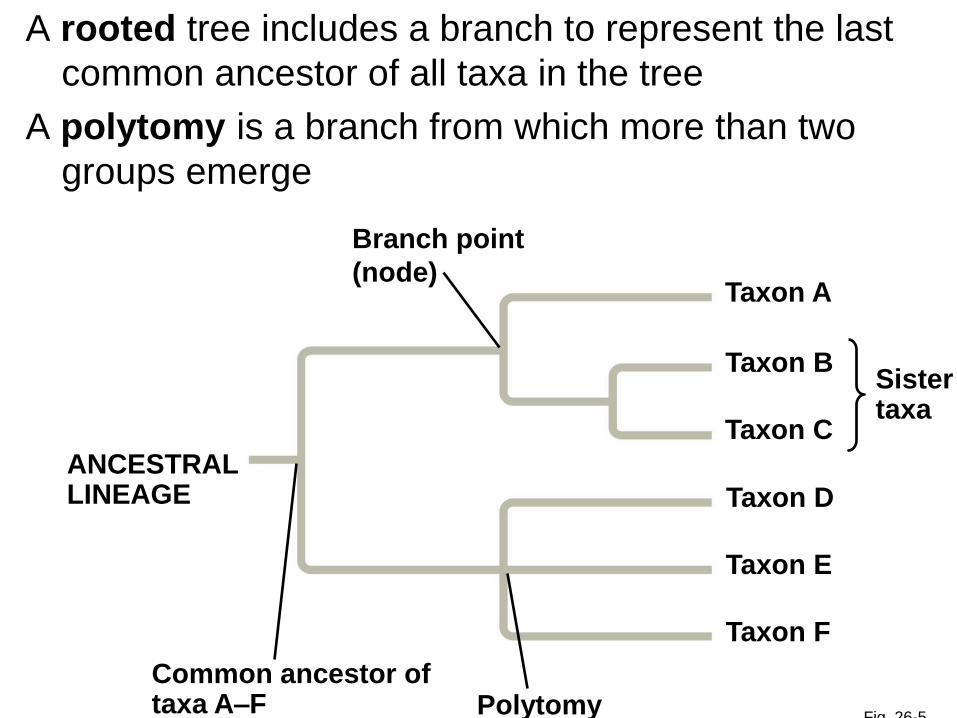
Fig. 26-5
Sister taxa
ANCESTRAL LINEAGE
Taxon A
Polytomy Common ancestor of taxa A–F
Branch point
(node)
Taxon B
Taxon C
Taxon D
Taxon E
Taxon F
A rooted tree includes a branch to represent the last
common ancestor of all taxa in the tree
A polytomy is a branch from which more than two
groups emerge

Copyright © 2008 Pearson Education, Inc., publishing as Pearson Benjamin Cummings
What We Can and Cannot Learn from Phylogenetic Trees
• Phylogenetic trees show patterns of descent
• Phylogenetic trees do not indicate when
species evolved or how much genetic change
occurred in a lineage
• It shouldn’t be assumed that a taxon
evolved from the taxon next to it

Copyright © 2008 Pearson Education, Inc., publishing as Pearson Benjamin Cummings
Applying Phylogenies
• Phylogeny provides important information
about similar characteristics in closely related
species
• A phylogeny was used to identify the species of
whale from which “whale meat” originated

Fig. 26-6
Fin (Mediterranean)
Fin (Iceland)
RESULTS
Unknown #10, 11, 12
Unknown #13
Blue (North Pacific)
Blue (North Atlantic)
Gray
Unknown #1b
Humpback (North Atlantic)
Humpback (North Pacific)
Unknown #9
Minke (North Atlantic)
Minke (Antarctica)
Minke (Australia)
Unknown #1a, 2, 3, 4, 5, 6, 7, 8

Fig. 26-UN1
A
B
A A
B
B
C
C C
D
D
D
(a) (b) (c)
Phylogenies of anthrax bacteria helped researchers
identify the source of a particular strain of anthrax

Copyright © 2008 Pearson Education, Inc., publishing as Pearson Benjamin Cummings
Sorting Homology from Analogy
• When constructing a phylogeny, systematists
need to distinguish whether a similarity is the
result of homology or analogy
• Homology is similarity due to shared ancestry
• Analogy is similarity due to convergent
evolution

Fig. 26-7
Convergent evolution of analogous burrowing
characteristics

Copyright © 2008 Pearson Education, Inc., publishing as Pearson Benjamin Cummings
• Bat and bird wings are homologous as forelimbs, but analogous as functional wings
• Analogous structures or molecular sequences that evolved independently are also called homoplasies
• Homology can be distinguished from analogy by comparing fossil evidence and the degree of complexity
• The more complex two similar structures are, the more likely it is that they are homologous

Copyright © 2008 Pearson Education, Inc., publishing as Pearson Benjamin Cummings
Evaluating Molecular Homologies
• Systematists use computer programs and
mathematical tools when analyzing comparable
DNA segments from different organisms

Fig. 26-8
Deletion
Insertion
1
2
3
4

Copyright © 2008 Pearson Education, Inc., publishing as Pearson Benjamin Cummings
• It is also important to distinguish homology
from analogy in molecular similarities
• Mathematical tools help to identify molecular
homoplasies, or coincidences
• Molecular systematics uses DNA and other
molecular data to determine evolutionary
relationships

Copyright © 2008 Pearson Education, Inc., publishing as Pearson Benjamin Cummings
Cladistics
• Cladistics groups organisms by common
descent
• A clade is a group of species that includes an
ancestral species and all its descendants
• Clades can be nested in larger clades, but not
all groupings of organisms qualify as clades

Copyright © 2008 Pearson Education, Inc., publishing as Pearson Benjamin Cummings
• A valid clade is monophyletic, signifying that it
consists of the ancestor species and all its
descendants
• Once homologous characters have been
identified, they can be used to infer a
phylogeny

Fig. 26-10a
A
B
C
D
E
F
G
Group I
(a) Monophyletic group (clade)

Fig. 26-10b
A
B
C
D
E
F
G
Group II
(b) Paraphyletic group
A paraphyletic grouping consists of an ancestral
species and some, but not all, of the descendants

A
B
C
D
E
F
G
Group III
(c) Polyphyletic group
A polyphyletic grouping consists of various species
that lack a common ancestor – Remember
Monara?

Copyright © 2008 Pearson Education, Inc., publishing as Pearson Benjamin Cummings
• A shared ancestral character is a character
that originated in an ancestor of the taxon
• A shared derived character is an evolutionary
novelty unique to a particular clade
• A character can be both ancestral and derived,
depending on the context
• In comparison with its ancestor, an organism
has both shared and different characteristics
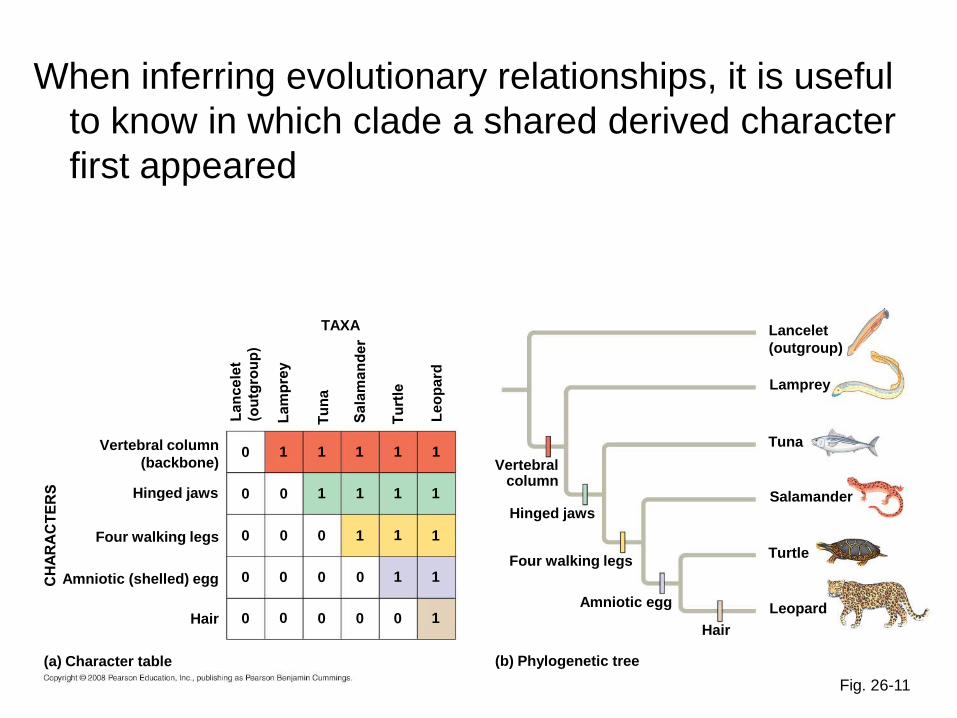
Fig. 26-11
TAXA
Leo
pa
rd
Tu
na
Vertebral column
(backbone)
Hinged jaws
Four walking legs
Amniotic (shelled) egg
Hair
(a) Character table
Hair
Hinged jaws
Vertebral column
Four walking legs
Amniotic egg
(b) Phylogenetic tree
Salamander
Leopard
Turtle
Lamprey
Tuna
Lancelet
(outgroup)
0
0 0
0
0
0
0 0
0
0
0 0
0 0 0 1
1 1
1 1 1
1
1 1
1
1
1 1
1 1
When inferring evolutionary relationships, it is useful
to know in which clade a shared derived character
first appeared

Copyright © 2008 Pearson Education, Inc., publishing as Pearson Benjamin Cummings
• An outgroup is a species or group of species
that is closely related to the ingroup, the
various species being studied – think how your
plant trees turned out – what was the outgroup
when oaks were sampled together?
• Systematists compare each ingroup species
with the outgroup to differentiate between
shared derived and shared ancestral
characteristics

Copyright © 2008 Pearson Education, Inc., publishing as Pearson Benjamin Cummings
• Homologies shared by the outgroup and
ingroup are ancestral characters that predate
the divergence of both groups from a common
ancestor
Fig. 26-11
Hair
Hinged jaws
Vertebral column
Four walking legs
Amniotic egg
(b) Phylogenetic tree
Salamander
Leopard
Turtle
Lamprey
Tuna
Lancelet
(outgroup)
ie. All are
deuterososomes
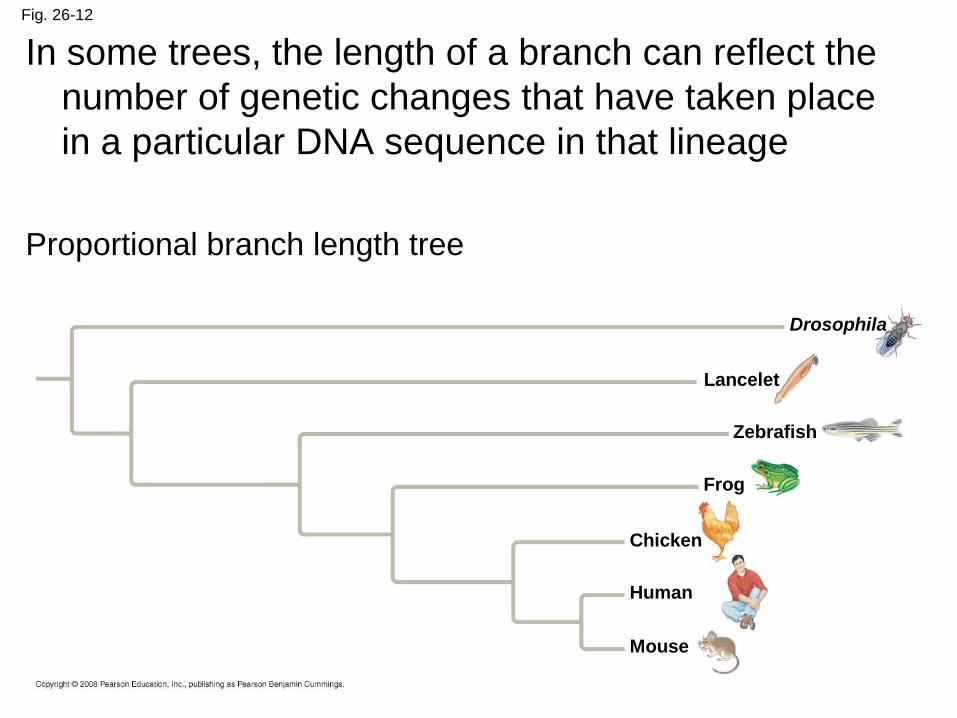
Fig. 26-12
Drosophila
Lancelet
Zebrafish
Frog
Human
Chicken
Mouse
In some trees, the length of a branch can reflect the
number of genetic changes that have taken place
in a particular DNA sequence in that lineage
Proportional branch length tree
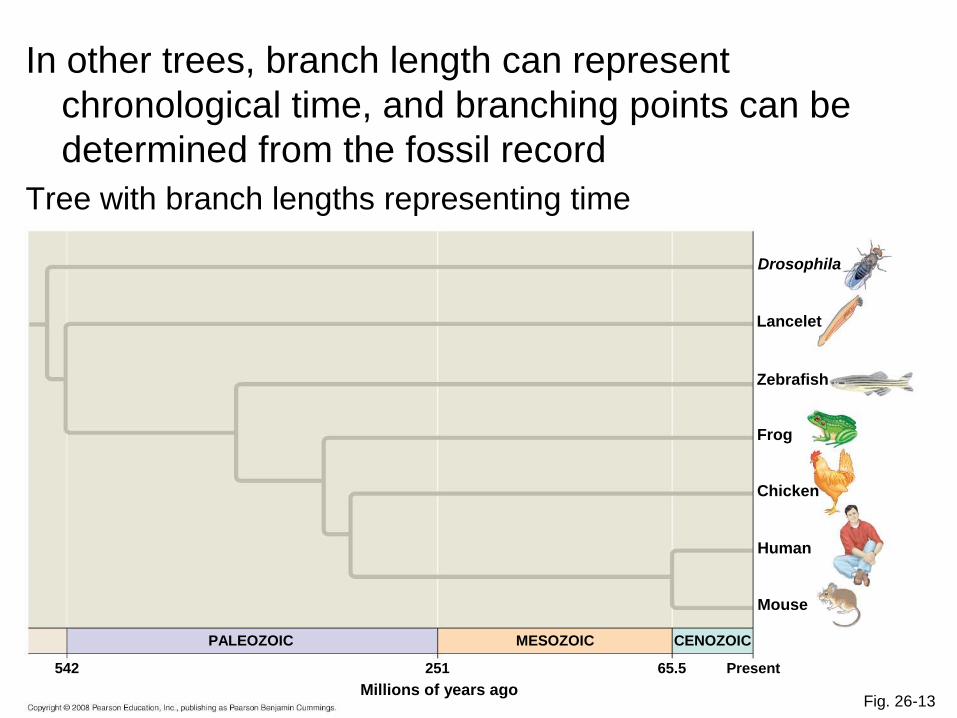
Fig. 26-13
Drosophila
Lancelet
Zebrafish
Frog
Human
Chicken
Mouse
CENOZOIC
Present 65.5
MESOZOIC
251
Millions of years ago
PALEOZOIC
542
In other trees, branch length can represent
chronological time, and branching points can be
determined from the fossil record
Tree with branch lengths representing time

Copyright © 2008 Pearson Education, Inc., publishing as Pearson Benjamin Cummings
Maximum Parsimony and Maximum Likelihood
• Systematists can never be sure of finding the
best tree in a large data set
• They narrow possibilities by applying the
principles of maximum parsimony and
maximum likelihood

Copyright © 2008 Pearson Education, Inc., publishing as Pearson Benjamin Cummings
• Maximum parsimony assumes that the tree
that requires the fewest evolutionary events
(appearances of shared derived characters) is
the most likely
• The principle of maximum likelihood states
that, given certain rules about how DNA
changes over time, a tree can be found that
reflects the most likely sequence of
evolutionary events

Fig. 26-14a
Human 40%
40%
30% 0
0
0
(a) Percentage differences between sequences
Human Mushroom
Mushroom
Tulip
Tulip

Fig. 26-14b
15%
Tree 1: More likely Tree 2: Less likely
(b) Comparison of possible trees
15% 15%
5%
5%
10%
25% 20%

Copyright © 2008 Pearson Education, Inc., publishing as Pearson Benjamin Cummings
• Computer programs are used to search for
trees that are parsimonious and likely
• list of computer programs
• http://paup.csit.fsu.edu/ PAUP

Figure 3: Majority rule tree of the 49 most parsimonious trees for the five combined data
sets (morphological, 28S, 18S, EF-1a, and Wg) . Tree length 3172. Bootstraps of >50%
are shown at branches. (Beal, unpublished)
Actual tree from both
molecular and
morphological data
Delphacidae
Delphacini
Asiracinae
Kelisiinae
Stenocraninae
Saccharosydnini
Delphacinae
Myndus crudus
Myndus sp1
Oliarus sp1
Pentagramma vittatifrons
Anakelisia fasciata
Kelisia curvata
Stenocranus sp1
Stenocranus sp2
Saccharosydne saccharavora
Bakerella minuta
Bostaera nasuta
Liburniella ornata
Conomelus anceps
Stobaera pallida
Stobaera concinna
Stobaera tricarniata
Pissonotus delicatus
Pissonotus piceus
Pissonotus flabellatus
Pissonotus albovenosus
Pissonotus brunneus
Isodelphax basivitta
Phyllodinus nervatus
Delphacodes andromeda
Toya propinqua
Delphacodes puella
Caenodelphax teapae
Delphacodes fulvidorsum
Delphacodes lutulenta
Delphacodes campestris
Delphacodes atralabis
Delphacodes lutea
Delphacodes detecta
Tumidagena minuta
Neomegamelanus dorsalis
Neomegamelanus elongatus
Prokelisia crocea
Prokelisia dolus
Prokelisia marginata
Delphacodes lamimalis
Nilaparvata wolcotti
Euides magnistyla
Peregrinus maidis
Megamelus distinctus
Megamelus sp1
Delphacodes nigrifascies
Delphacodes alexanderi
Sogatella molina
Sogatella fucifera
Sogatella kolophon
Delphacodes pendetacta
Laccocera vittapennis
Javesella kilmani
Javesella pellucida
Nothodelphax gilletti
Nothodelphax consimilis
Nothodelphax lineatipes
63
100
100 91
100
71
67
74
97
100
87
87 97
99
83
100
55
66
78
80
51
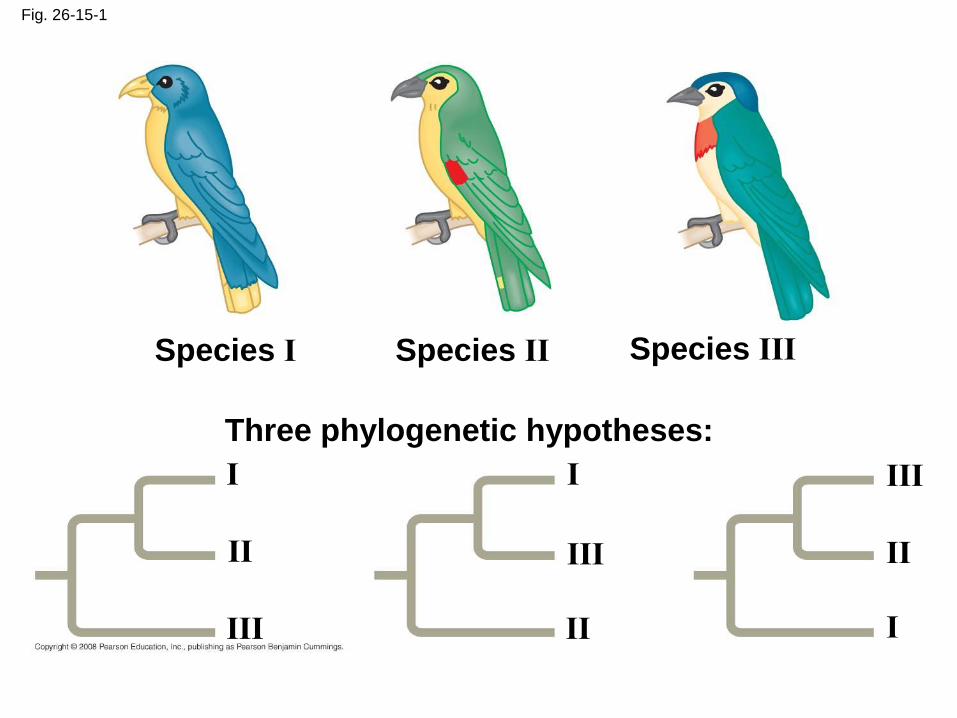
Fig. 26-15-1
Species I
Three phylogenetic hypotheses:
Species II Species III
I
II
III
I
I II
II III
III

Fig. 26-15-2
Species I
Site
Species II
Species III
I
II
III
I
I II
II III
III
Ancestral sequence
1/C
1/C
1/C
1/C
1/C
4 3 2 1
C
C C
C
T
T
T
T
T
T A
A A
A G
G

Fig. 26-15-3
Species I
Site
Species II
Species III
I
II
III
I
I II
II III
III
Ancestral sequence
1/C
1/C
1/C
1/C
1/C
4 3 2 1
C
C C
C
T
T
T
T
T
T A
A A
A G
G
I I
I
II
II
II
III
III
III 3/A
3/A
3/A
3/A
3/A
2/T
2/T
2/T 2/T
2/T 4/C
4/C
4/C
4/C
4/C

Fig. 26-15-4
Species I
Site
Species II
Species III
I
II
III
I
I II
II III
III
Ancestral sequence
1/C
1/C
1/C
1/C
1/C
4 3 2 1
C
C C
C
T
T
T
T
T
T A
A A
A G
G
I I
I
II
II
II
III
III
III 3/A
3/A
3/A
3/A
3/A
2/T
2/T
2/T 2/T
2/T 4/C
4/C
4/C
4/C
4/C
I I
I
II
II
II
III
III
III
7 events 7 events 6 events

Copyright © 2008 Pearson Education, Inc., publishing as Pearson Benjamin Cummings
Phylogenetic Trees as Hypotheses
• The best hypotheses for phylogenetic trees fit
the most data: morphological, molecular, and
fossil
• Phylogenetic bracketing allows us to predict
features of an ancestor from features of its
descendents

Fig. 26-16
Common ancestor of crocodilians, dinosaurs, and birds
Birds
Lizards and snakes
Crocodilians
Ornithischian dinosaurs
Saurischian dinosaurs

Fig. 26-17
Eggs
Front limb
Hind limb
(a) Fossil remains of Oviraptor and eggs
(b) Artist’s reconstruction of the dinosaur’s posture
This has been
applied to
infer features
of dinosaurs
from their
descendents:
birds and
crocodiles

Copyright © 2008 Pearson Education, Inc., publishing as Pearson Benjamin Cummings
Concept 26.4: An organism’s evolutionary history is documented in its genome
• Comparing nucleic acids or other molecules to
infer relatedness is a valuable tool for tracing
organisms’ evolutionary history
• DNA that codes for rRNA changes relatively
slowly and is useful for investigating branching
points hundreds of millions of years ago
• mtDNA evolves rapidly and can be used to
explore recent evolutionary events

Copyright © 2008 Pearson Education, Inc., publishing as Pearson Benjamin Cummings
Concept 26.5: Molecular clocks help track evolutionary time
• To extend molecular phylogenies beyond the
fossil record, we must make an assumption
about how change occurs over time
• A molecular clock uses constant rates of
evolution in some genes to estimate the
absolute time of evolutionary change

Fig. 26-19 Divergence time (millions of years)
120
90
90
60
60
30
30 0
0
Molecular clocks are calibrated against branches
whose dates are known from the fossil record

Copyright © 2008 Pearson Education, Inc., publishing as Pearson Benjamin Cummings
Neutral Theory
• Neutral theory states that much evolutionary
change in genes and proteins has no effect on
fitness and therefore is not influenced by
Darwinian selection
• It states that the rate of molecular change in
these genes and proteins should be regular like
a clock

Copyright © 2008 Pearson Education, Inc., publishing as Pearson Benjamin Cummings
Difficulties with Molecular Clocks
• The molecular clock does not run as smoothly as
neutral theory predicts
• Irregularities result from natural selection in
which some DNA changes are favored over
others
• Estimates of evolutionary divergences older than
the fossil record have a high degree of
uncertainty
• The use of multiple genes may improve
estimates
Copyright © 2008 Pearson Education, Inc., publishing as Pearson Benjamin Cummings
Concept 26.6: New information continues to revise our understanding of the tree of life
• Recently, we have gained insight into the very
deepest branches of the tree of life through
molecular systematics

Copyright © 2008 Pearson Education, Inc., publishing as Pearson Benjamin Cummings
From Two Kingdoms to Three Domains
• Early taxonomists classified all species as either
plants or animals
• Later, five kingdoms were recognized: Monera
(prokaryotes), Protista, Plantae, Fungi, and
Animalia
• More recently, the three-domain system has
been adopted: Bacteria, Archaea, and Eukarya
• The three-domain system is supported by data
from many sequenced genomes Animation: Classification Schemes
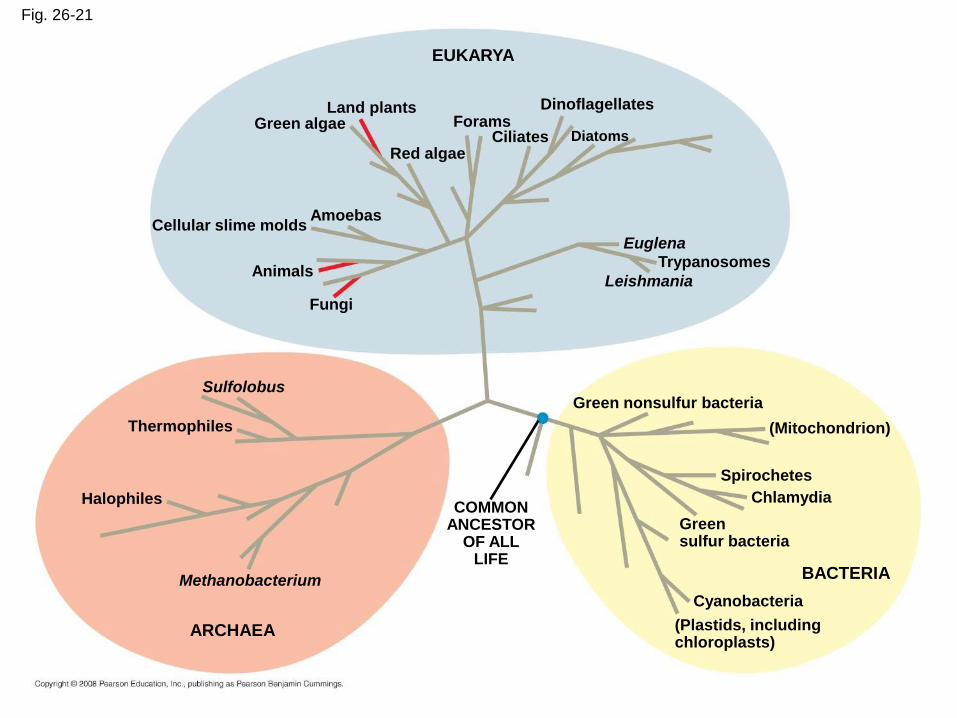
Fig. 26-21
Fungi
EUKARYA
Trypanosomes
Green algae Land plants
Red algae
Forams Ciliates
Dinoflagellates
Diatoms
Animals
Amoebas Cellular slime molds
Leishmania
Euglena
Green nonsulfur bacteria
Thermophiles
Halophiles
Methanobacterium
Sulfolobus
ARCHAEA
COMMON ANCESTOR
OF ALL LIFE
BACTERIA
(Plastids, including chloroplasts)
Green sulfur bacteria
(Mitochondrion)
Cyanobacteria
Chlamydia
Spirochetes

Copyright © 2008 Pearson Education, Inc., publishing as Pearson Benjamin Cummings
A Simple Tree of All Life
• The tree of life suggests that eukaryotes and
archaea are more closely related to each other
than to bacteria
• The tree of life is based largely on rRNA genes,
as these have evolved slowly
Copyright © 2008 Pearson Education, Inc., publishing as Pearson Benjamin Cummings
• There have been substantial interchanges of
genes between organisms in different domains
• Horizontal gene transfer any process in
which an organism incorporates genetic
material from another organism without
being the offspring of that organism
• Horizontal gene transfer complicates efforts to
build a tree of life

Fig. 26-22
3
Archaea
Bacteria
Eukarya
Billions of years ago
4 2 1 0
The role of horizontal gene transfer in the history of life

Copyright © 2008 Pearson Education, Inc., publishing as Pearson Benjamin Cummings
• Some researchers suggest that eukaryotes
arose as an endosymbiosis between a
bacterium and archaean
• If so, early evolutionary relationships might be
better depicted by a ring of life instead of a tree
of life
Is the Tree of Life Really a Ring?

Fig. 26-23
Archaea Bacteria
Eukarya

Copyright © 2008 Pearson Education, Inc., publishing as Pearson Benjamin Cummings
You should now be able to:
1. Explain the justification for taxonomy based on a
PhyloCode
2. Explain the importance of distinguishing between
homology and analogy
3. Distinguish between the following terms:
monophyletic, paraphyletic, and polyphyletic
groups; shared ancestral and shared derived
characters; orthologous and paralogous genes

Copyright © 2008 Pearson Education, Inc., publishing as Pearson Benjamin Cummings
4. Define horizontal gene transfer and explain
how it complicates phylogenetic trees
5. Explain molecular clocks and discuss their
limitations