overview of aquaculture in the united states - usda · fish, crustaceans, molluscs, ... in 1992,...
TRANSCRIPT

Overview ofAquaculture in the
United States
Centers for Epidemiology & Animal HealthUSDA:APHIS:VS
2150 Centre Ave., Bldg. B, MS 2E7Fort Collins, Colroado 80526-8117
(970) [email protected]
October 1995
Aquaculture in the United States is a diverse industry which includes production of a variety offish, crustaceans, molluscs, and plants. Total estimated U.S. aquaculture production in 1992 was313,518 metric tons with production income totaling $724 million (1). Thus, in terms ofeconomic importance, the aquaculture industry is comparable in value to the sheep industry andequivalent to either 18 percent of the swine industry or 30 percent of the turkey industry. Also, aninfrastructure of producers, processors, wholesalers, and retailers exists that is similar to thatfound in traditional livestock. A system of providers exists, which numbered over 2,000 in 1994,that supplies feeds, vaccines, fish diagnostics, medications, growth hormones, and physicalequipment (pumps, feeders, processing machines) (2). The objective of this report is toinvestigate diversity within the industry by providing an overview of the types of aquatic animalsbeing cultured in the U.S., trends in the size and geographic distribution of specific components ofthe industry, existing Federal and State regulations, and Veterinary Services’ current role inaquaculture.
Principal Aquaculture Species
There are five principal aquaculture fish species in the U.S. (catfish, trout, salmon, tilapia, andhybrid striped bass) and two categories of non-food fish production (baitfish and ornamental fish). Contribution to total aquaculture production of other fish species such as walleye, sunfish, andlargemouth bass is rather limited. In addition to fish, several crustacean species, crawfish andvarieties of shrimp, and molluscs are commercially important.
Although each of these aquaculture industries is developing independently, one limit to theircombined expansion in the domestic market will be consumer demand for aquaculture products. Demand will be primarily in the form of consumption, except for the baitfish and tropical fishindustries. Per capita consumption of fish (canned, fresh and frozen, cured) in the U.S. increasedfrom 12.5 to 16.2 pounds per capita in the early 1980's but subsequently has remained relativelystable (Figure 1) (1). The average per capita consumption of fish is less than consumption of beef(68.5 pounds), poultry (51.8 pounds), or pork (47.3 pounds), but substantially more than veal (1.2pounds) or lamb (1.0 pounds) (3).
Since consumption of aquaculture products does not appear to be increasing substantially in theU.S., industry development will depend on becoming competitive on the international market andfilling the niche left by declining catches from the ocean. In 1992, the National Marine FisheriesService (NMFS) listed fisheries stocks, many of which are the Nation's most valuable fisheriesresources, that are being over utilized and/or are below the population levels need to sustainprojected yields (4). The fisheries include New England groundfish, Atlantic sea scallops, gulfshrimp, highly migratory pelagic stocks, Pacific salmon stocks, and many near shore stocks (someoyster populations, bay scallops, abalones, Pacific striped bass).
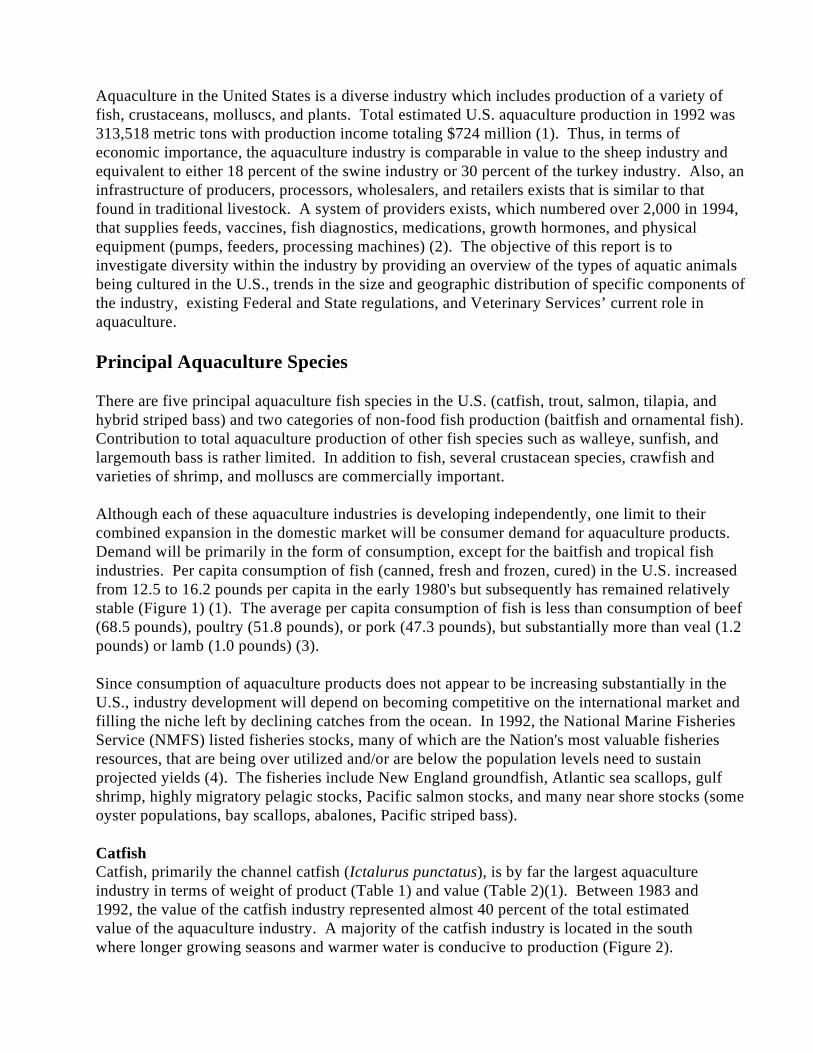
CatfishCatfish, primarily the channel catfish (Ictalurus punctatus), is by far the largest aquacultureindustry in terms of weight of product (Table 1) and value (Table 2)(1). Between 1983 and1992, the value of the catfish industry represented almost 40 percent of the total estimatedvalue of the aquaculture industry. A majority of the catfish industry is located in the southwhere longer growing seasons and warmer water is conducive to production (Figure 2).

USDA:APHIS:VS
2
Total water surface area in production in 1994 was 153,640 surface acres with 97 percent ofthe acreage occurring in five States: Mississippi (93,700 acres), Arkansas (21,900 acres),Alabama (18,170 acres), Louisiana (11,070 acres), and Georgia (4,000 acres) (5). All otherStates each had less than 2,500 surface acres in 1994. The geographic distribution of theindustry has been fairly stable since the early 1980's (Figure 2)(6). Since 1982, the industryhas increased in number of farms from 1,494 to 2,155 with most of the increase occurringbetween 1982 and 1987 (Table 3). Much of the increase in the number of farms has occurredin three States (Louisiana, Mississippi, and Alabama), while notable increases have occurredin both of the Carolinas.
Growth of the catfish industry was fairly steady throughout the 1980's, but in the last few yearsproduction has been a leveling off. In 1994, catfish production fell 4 percent as farmers cut backdue to low prices in 1993 (7). However, production is expected to expand 5-7 percent in 1995due to increasing sales prices. Total acreage of ponds for catfish culture was up in 1994 by 1percent which follows 2 years of decline.
Overview of Aquaculture in the United States
Miscellaneous includes ornamental fish, alligators, algae, aquatic plants, hybrid striped1
bass, tilapia,and others.
3
Table 1 - Estimated U.S. aquaculture production (metric tons) of selected species. (Source: NMFS:Fish. Stat. Div.)
Species Year
1983 1984 1985 1986 1987 1988 1989 1990 1991 1992
Baitfish 10,000 10,704 11,252 11,706 11,794 11,975 10,899 9,802 9,608 9,352
Catfish 62,256 69,970 86,916 96,959 127,232 133,861 155,085 163,492 177,297 207,460
Salmon 833 1,213 1,779 1,305 1,825 3,074 3,857 4,114 7,599 10,858
Trout 21,954 22,653 22,952 23,133 25,513 25,416 25,187 25,772 26,954 25,521
Clams 762 947 907 1,163 1,093 965 1,075 1,669 1,716 1,942
Crawfish 31,524 30,064 29,489 31,676 31,752 29,868 29,937 32,205 27,481 28,591
Mussels 335 355 549 533 528 483 280 275 95 128
Oysters 8,807 11,505 9,936 11,102 10,853 11,067 10,095 10,066 9,359 10,880
Shrimp 125 144 121 81 91 130 159 184 184 147(Freshwater)
Shrimp 116 239 200 614 1,205 998 680 900 1,600 2,000(Saltwater)
Misc. 3,175 4,491 6,350 7,031 7,734 9,072 11,340 11,218 12,127 16,6381
Total 139,887 152,285 170,451 185,304 219,619 226,909 248,584 259,697 274,021 313,518Weight
The long-term trend appears to be similar to what has occurred in other animal industries: concentration into fewer but larger farms. Still there appears to be room for smaller producers,since the average size of fish farms in Mississippi dropped by 20 acres to 323 acres in 1994 (7). More detailed analysis of production and processing linkages would be necessaryto determine the future role of small producers. The industry is trying to promote itself asevidenced by a 1994 Catfish Institute investment of $1.6 million on an advertising campaign thatwas designed to increase public awareness of farm-raised catfish (2).
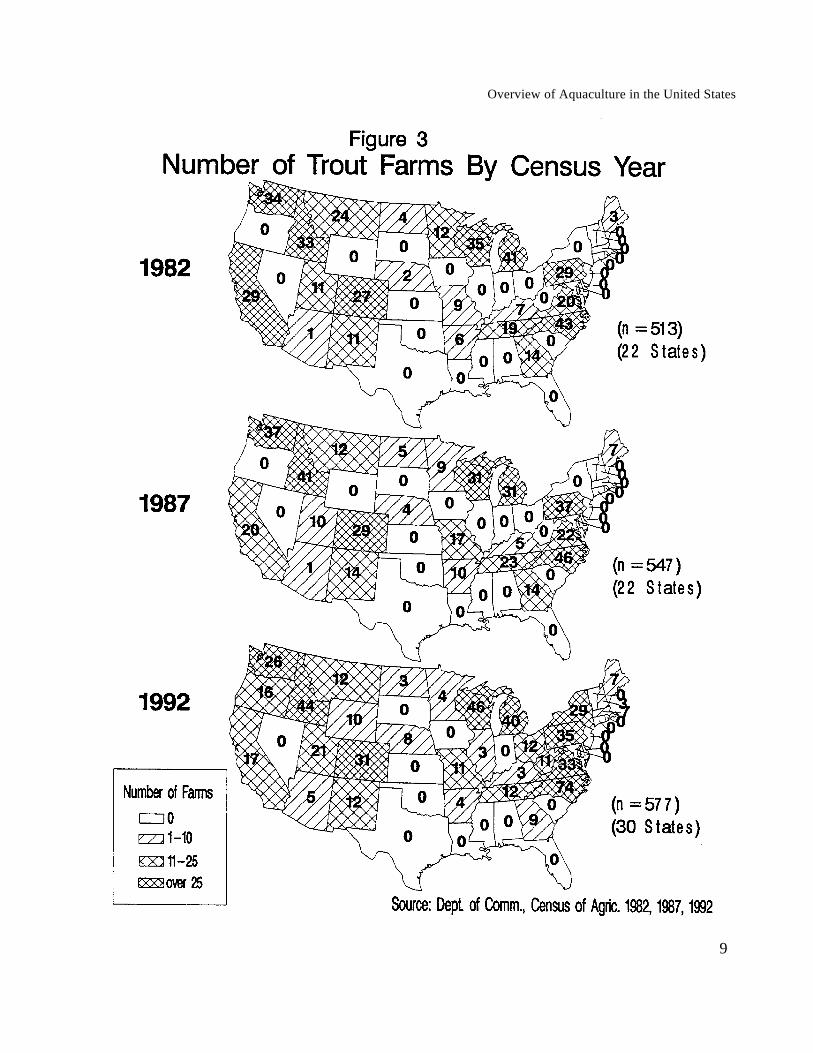
TroutTrout, principally rainbow trout (Oncorhynchus mykiss), production is about one-sixth the size ofthe catfish industry on weight basis but about one-fourth the size on a value basis (Tables 1 and 2). Between 1983 and 1992, value of the trout industry represented 13 percent of the total estimatedvalue of the aquaculture industry. The number of trout farms was 513 in 1982 and 577 in 1992 (6). Trout farms are spread throughout the country, except they do not tend to be found in the southeast(Figure 3). Need for cooler water temperatures during the whole year is the principal driving forcein determining the industry's geographic distribution. The geographic distribution of trout farmsover time indicates an increase in numbers of farms in the eastern U.S., especially North Carolina.
USDA:APHIS:VS
Miscellaneous includes ornamental fish, alligators, algae, aquatic plants, hybrid striped2
bass, tilapia, and others.
4
Table 2 - Estimated value of U.S. aquaculture production of selected species (X $1,000). (Source: NMFS: Fish. Stat. Div.)
Species Year
1983 1984 1985 1986 1987 1988 1989 1990 1991 1992
Baitfish 44,000 47,045 51,280 51,522 71,500 71,000 62,489 53,978 55,948 61,183
Catfish 83,860 106,899 138,922 142,789 173,347 225,463 245,142 273,210 246,639 273,506
Salmon 2,548 3,414 5,465 4,399 7,462 20,647 23,742 26,341 44,156 75,193
Trout 50,000 54,435 55,154 55,590 57,556 57,927 60,041 64,640 59,142 53,942
Clams 6,368 6,670 4,698 8,173 10,311 11,320 12,721 13,486 11,133 11,539
Crawfish 32,664 27,936 29,350 35,009 29,400 24,364 20,460 34,000 33,285 24,860
Mussels 340 309 642 1,032 1,024 1,130 1,136 1,173 947 1,162
Oysters 32,034 47,906 38,882 49,666 49,549 58,900 58,082 77,949 63,463 82,432
Shrimp 1,500 1,698 1,541 893 1,250 1,922 2,537 2,407 2,407 1,728(FW)
Shrimp 510 874 1,566 1,687 3,408 7,609 7,551 7,937 14,110 17,637(SW)
Misc. 7,000 9,900 20,000 21,700 32,285 40,000 45,600 99,991 104,998 111,0052
Total 260,824 307,086 347,500 372460 437,092 520,282 539,501 655,112 636,228 724,187Value
Value of production provides a different perspective on the industry. Idaho produces 50 percent ofU.S. farmed trout with the next closest State being North Carolina, which accounts for 8.6 percentof the U.S. trout production (Table 4)(6). Total U.S. production is increasing at a higher rate thanis the rate of increase in Idaho which has resulted in declining percentage of total production forIdaho in spite of steadily increasing actual production.
Production of trout was fairly steady during the mid-1980's and into the early 1990's (Table 1).Sales of live trout and trout products peaked in 1990 at $64.6 million (Table 2). Decliningproduction, somewhat offset by recent increases in sales prices, resulted in sales of only $53.9million in 1994 (7). Sales in all facets of the industry except exports (eggs, fingerlings, stocker,and food-size fish) declined in 1994 (7). Exports of trout products have steadily increased in therecent past, but still only represent about 5 percent of estimated U.S. production, and are roughlyequivalent to trout imports. These trends combined seem to indicate that the trout industry is notpoised for substantial expansion in the near future. A major constraint may be the availability ofsufficient supplies of cool, clean water that can be diverted to aquaculture production. Forexample, flow-through production
Overview of Aquaculture in the United States
5
USDA:APHIS:VS
6
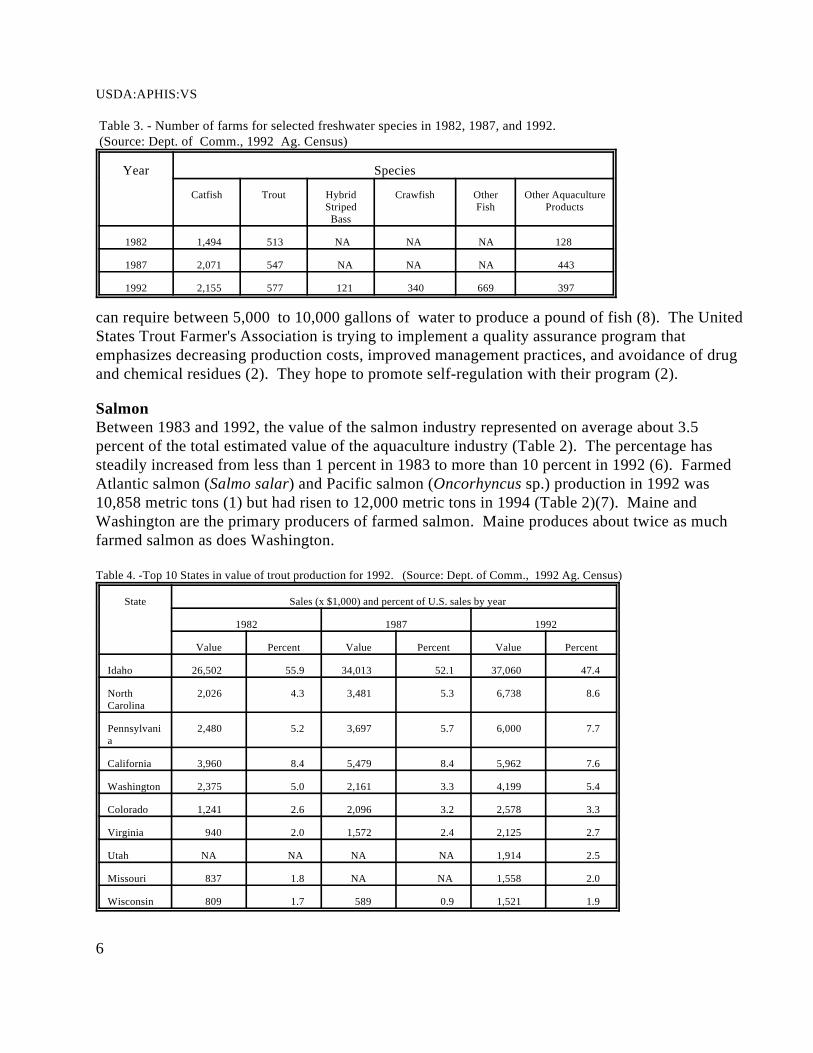
Table 3. - Number of farms for selected freshwater species in 1982, 1987, and 1992. (Source: Dept. of Comm., 1992 Ag. Census)
Year Species
Catfish Trout Hybrid Crawfish Other Other AquacultureStriped Fish ProductsBass
1982 1,494 513 NA NA NA 128
1987 2,071 547 NA NA NA 443
1992 2,155 577 121 340 669 397
can require between 5,000 to 10,000 gallons of water to produce a pound of fish (8). The UnitedStates Trout Farmer's Association is trying to implement a quality assurance program thatemphasizes decreasing production costs, improved management practices, and avoidance of drugand chemical residues (2). They hope to promote self-regulation with their program (2).
SalmonBetween 1983 and 1992, the value of the salmon industry represented on average about 3.5percent of the total estimated value of the aquaculture industry (Table 2). The percentage hassteadily increased from less than 1 percent in 1983 to more than 10 percent in 1992 (6). FarmedAtlantic salmon (Salmo salar) and Pacific salmon (Oncorhyncus sp.) production in 1992 was10,858 metric tons (1) but had risen to 12,000 metric tons in 1994 (Table 2)(7). Maine andWashington are the primary producers of farmed salmon. Maine produces about twice as muchfarmed salmon as does Washington.
Table 4. -Top 10 States in value of trout production for 1992. (Source: Dept. of Comm., 1992 Ag. Census)
State Sales (x $1,000) and percent of U.S. sales by year
1982 1987 1992
Value Percent Value Percent Value Percent
Idaho 26,502 55.9 34,013 52.1 37,060 47.4
North 2,026 4.3 3,481 5.3 6,738 8.6Carolina
Pennsylvani 2,480 5.2 3,697 5.7 6,000 7.7a
California 3,960 8.4 5,479 8.4 5,962 7.6
Washington 2,375 5.0 2,161 3.3 4,199 5.4
Colorado 1,241 2.6 2,096 3.2 2,578 3.3
Virginia 940 2.0 1,572 2.4 2,125 2.7
Utah NA NA NA NA 1,914 2.5
Missouri 837 1.8 NA NA 1,558 2.0
Wisconsin 809 1.7 589 0.9 1,521 1.9
Overview of Aquaculture in the United States
7
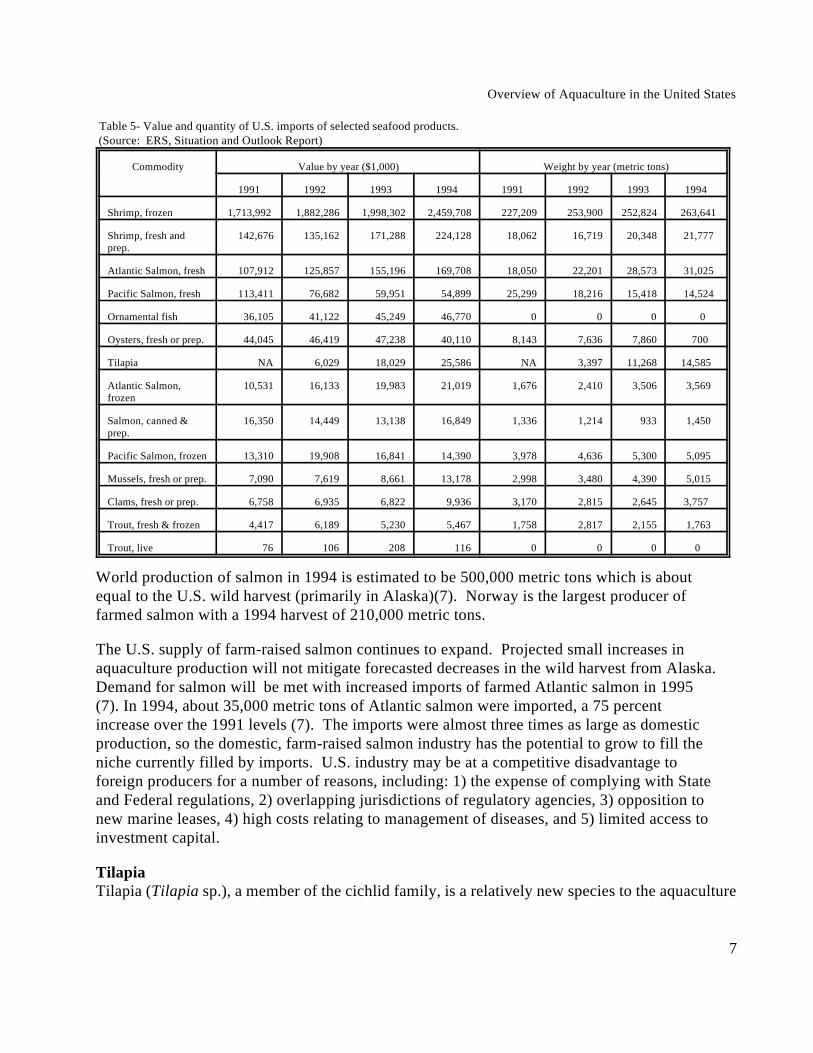
Table 5- Value and quantity of U.S. imports of selected seafood products. (Source: ERS, Situation and Outlook Report)
Commodity Value by year ($1,000) Weight by year (metric tons)
1991 1992 1993 1994 1991 1992 1993 1994
Shrimp, frozen 1,713,992 1,882,286 1,998,302 2,459,708 227,209 253,900 252,824 263,641
Shrimp, fresh and 142,676 135,162 171,288 224,128 18,062 16,719 20,348 21,777 prep.
Atlantic Salmon, fresh 107,912 125,857 155,196 169,708 18,050 22,201 28,573 31,025
Pacific Salmon, fresh 113,411 76,682 59,951 54,899 25,299 18,216 15,418 14,524
Ornamental fish 36,105 41,122 45,249 46,770 0 0 0 0
Oysters, fresh or prep. 44,045 46,419 47,238 40,110 8,143 7,636 7,860 700
Tilapia NA 6,029 18,029 25,586 NA 3,397 11,268 14,585
Atlantic Salmon, 10,531 16,133 19,983 21,019 1,676 2,410 3,506 3,569 frozen
Salmon, canned & 16,350 14,449 13,138 16,849 1,336 1,214 933 1,450 prep.
Pacific Salmon, frozen 13,310 19,908 16,841 14,390 3,978 4,636 5,300 5,095
Mussels, fresh or prep. 7,090 7,619 8,661 13,178 2,998 3,480 4,390 5,015
Clams, fresh or prep. 6,758 6,935 6,822 9,936 3,170 2,815 2,645 3,757
Trout, fresh & frozen 4,417 6,189 5,230 5,467 1,758 2,817 2,155 1,763
Trout, live 76 106 208 116 0 0 0 0
World production of salmon in 1994 is estimated to be 500,000 metric tons which is aboutequal to the U.S. wild harvest (primarily in Alaska)(7). Norway is the largest producer offarmed salmon with a 1994 harvest of 210,000 metric tons.
The U.S. supply of farm-raised salmon continues to expand. Projected small increases inaquaculture production will not mitigate forecasted decreases in the wild harvest from Alaska. Demand for salmon will be met with increased imports of farmed Atlantic salmon in 1995(7). In 1994, about 35,000 metric tons of Atlantic salmon were imported, a 75 percentincrease over the 1991 levels (7). The imports were almost three times as large as domesticproduction, so the domestic, farm-raised salmon industry has the potential to grow to fill theniche currently filled by imports. U.S. industry may be at a competitive disadvantage toforeign producers for a number of reasons, including: 1) the expense of complying with Stateand Federal regulations, 2) overlapping jurisdictions of regulatory agencies, 3) opposition tonew marine leases, 4) high costs relating to management of diseases, and 5) limited access toinvestment capital.
TilapiaTilapia (Tilapia sp.), a member of the cichlid family, is a relatively new species to the aquaculture

USDA:APHIS:VS
8
Table 6- Value and quantity of U.S. exports of selected seafood products (Source: ERS, Situation and Outlook Report)
Commodity Value by year ($1,000) Weight by year (metric tons)
1991 1992 1993 1994 1991 1992 1993 1994
Pacific Salmon, frozen 359,818 594,794 485,488 476,910 90,304 109,124 117,160 118,395
Canned & pres. salmon 135,146 171,939 162,261 163,687 30,540 38,995 38,739 41,088
Shrimp, frozen 64,134 66,382 61,806 55,258 6,809 8,219 7,511 6,192
Shrimp, fresh & pres. 44,611 49,653 48,500 52,988 5,847 6,678 6,507 7,172
Pacific Salmon fresh 29,502 46,871 36,765 40,305 6,763 9,389 11,034 10,220
Ornamental fish 12,746 16,455 17,366 18,867 0 0 0 0
Clams, fresh or prep. 7,037 6,699 6,284 5,779 2,002 2,272 1,917 1,720
Oysters 2,397 2,781 3,514 6,892 422 502 661 1,197
Atlantic Salmon, fresh 1,647 4,920 11,203 3,649 215 635 1,826 538
Trout, fresh & frozen 2,652 2,873 3,233 3,475 739 803 839 890
Mussels, fresh or prep. 1,864 2,657 2,802 2,115 757 1,053 1,041 880
Trout, live 1,383 992 976 1,636 0 0 0 0
industry in the U.S. but worldwide it is a very important species. The popularity of tilapiaculture arises from the species' ability to tolerate crowded conditions and poor water quality butstill have excellent taste and rapid growth from sources of feed low in the food chain(zooplankton and phytoplankton) (9). Production in the U.S. was about 6,800 metric tonscompared to worldwide production of more than 405,000 metric tons(10). Tilapia are grown inmost areas of the U.S. The combination of imports (about 20,000 metric tons in 1994) anddomestic production puts tilapia usage in the U.S. near that of the domestic trout market.
Tilapia are prolific breeders which makes them suitable for aquaculture production. In manywarm weather areas in the U.S. production in open ponds is banned due to the species' abilityto proliferate. The concern is that the species would eventually escape into the wild andbecome uncontrollable (Pers. Comm. Rodney Horner, Ill. DOC). Even in northern areas,where the species could not survive under natural conditions, there is concern that it could getinto an artificially-heated environment like a power plant cooling pond and proliferate. Consequently, most U.S. production of tilapia comes from tank systems using recirculatedwater. Producers’ ability to become more efficient and reduce costs of heating, filtration, andpumping water, will determine the industry's future. The abundant supply of tilapia fromcountries like Taiwan, Costa Rica, Indonesia, and Thailand may put domestic producers at along-term disadvantage.
Overview of Aquaculture in the United States
9
USDA:APHIS:VS
Migrate from saltwater to freshwater for breeding.3
10
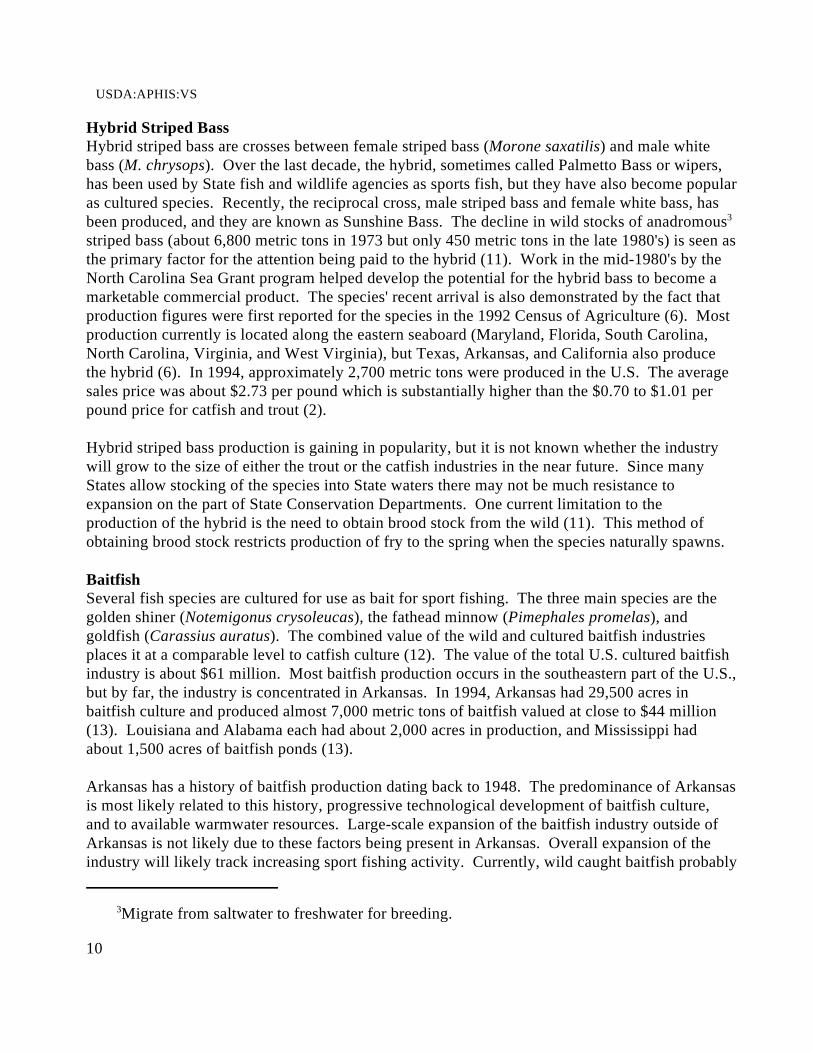
Hybrid Striped BassHybrid striped bass are crosses between female striped bass (Morone saxatilis) and male whitebass (M. chrysops). Over the last decade, the hybrid, sometimes called Palmetto Bass or wipers,has been used by State fish and wildlife agencies as sports fish, but they have also become popularas cultured species. Recently, the reciprocal cross, male striped bass and female white bass, hasbeen produced, and they are known as Sunshine Bass. The decline in wild stocks of anadromous3
striped bass (about 6,800 metric tons in 1973 but only 450 metric tons in the late 1980's) is seen asthe primary factor for the attention being paid to the hybrid (11). Work in the mid-1980's by theNorth Carolina Sea Grant program helped develop the potential for the hybrid bass to become amarketable commercial product. The species' recent arrival is also demonstrated by the fact thatproduction figures were first reported for the species in the 1992 Census of Agriculture (6). Mostproduction currently is located along the eastern seaboard (Maryland, Florida, South Carolina,North Carolina, Virginia, and West Virginia), but Texas, Arkansas, and California also producethe hybrid (6). In 1994, approximately 2,700 metric tons were produced in the U.S. The averagesales price was about $2.73 per pound which is substantially higher than the $0.70 to $1.01 perpound price for catfish and trout (2).
Hybrid striped bass production is gaining in popularity, but it is not known whether the industrywill grow to the size of either the trout or the catfish industries in the near future. Since manyStates allow stocking of the species into State waters there may not be much resistance toexpansion on the part of State Conservation Departments. One current limitation to theproduction of the hybrid is the need to obtain brood stock from the wild (11). This method ofobtaining brood stock restricts production of fry to the spring when the species naturally spawns.
BaitfishSeveral fish species are cultured for use as bait for sport fishing. The three main species are thegolden shiner (Notemigonus crysoleucas), the fathead minnow (Pimephales promelas), andgoldfish (Carassius auratus). The combined value of the wild and cultured baitfish industriesplaces it at a comparable level to catfish culture (12). The value of the total U.S. cultured baitfishindustry is about $61 million. Most baitfish production occurs in the southeastern part of the U.S.,but by far, the industry is concentrated in Arkansas. In 1994, Arkansas had 29,500 acres inbaitfish culture and produced almost 7,000 metric tons of baitfish valued at close to $44 million(13). Louisiana and Alabama each had about 2,000 acres in production, and Mississippi hadabout 1,500 acres of baitfish ponds (13).
Arkansas has a history of baitfish production dating back to 1948. The predominance of Arkansasis most likely related to this history, progressive technological development of baitfish culture,and to available warmwater resources. Large-scale expansion of the baitfish industry outside ofArkansas is not likely due to these factors being present in Arkansas. Overall expansion of theindustry will likely track increasing sport fishing activity. Currently, wild caught baitfish probably
Overview of Aquaculture in the United States
11
represents a substantial part of the baitfish industry. Recent concerns about harvesting impacts onthe environment, however, may lead to restrictions on the number and types of fish that areallowed to be taken and sold as baitfish. Decreases in wild catch may lead to increased productionof farmed baitfish. The ease of handling domesticated strains of some of the most popularcultured baitfish species may also lead to decreased pressure on wild fish (14).
Ornamental FishCommon ornamental species cultured for commercial sales, typically for aquariums, includeguppies, mollies, swordtails, tetras, gouramies and goldfish. Net sales of ornamental fish(sometimes referred to as tropical fish) from Florida alone in 1993 was estimated to be $46.7million up from $21.7 million in 1987 (15). In Florida there are approximately 187 growers andmost of the production occurs in Hillsborough and Polk counties, with some also occurring inDade and Palm Beach counties. The limited geographic distribution of ornamental fishproduction in Florida is reflective of the intensive culture techniques on smaller physicaloperations. The total water surface area in production in Florida in 1994 was 3,735 acres.
Exports of ornamental fish species, worth $17 million in 1993 and $18.9 million in 1994,probably make these species the highest valued domestic aquaculture export. The U.S. is still anet importer of ornamental fish. The top five ornamental fish producing countries are Thailand,Indonesia, Singapore, Hong Kong, and the Philippines (16). The EU market has been one of thelargest importers of U.S. ornamental fish but in early 1994 only the United Kingdom wasincreasing its imports. Most of the growth of U.S. exports of ornamental fish has occurred withJapan, Taiwan, Hong Kong, and Singapore. The forecast for growth in exports from the U.S. isgood as the southeastern Asia economies grow and strengthen.
CrustaceansFreshwater crawfish, primarily red swamp crawfish and a small proportion of white river crawfish, is currently the only crustacean species cultured on a large-scale basis in the U.S. Over a ten yearperiod ending in 1992, the value of crawfish production, on average, represented 12 percent of thetotal value of aquaculture in the U.S. In 1993, over 27,000 metric tons (value $26.7 million) wereproduced in Louisiana on more than 143,000 acres of ponds operated by 1,618 producers (2). Theproduction represents over 90 percent of total U.S. farmed production (28,591 metric tons in1992). There are approximately 21,000 acres of ponds used for culturing crawfish in neighboringTexas. Mississippi, Maryland, South Carolina, North Carolina, Florida, Georgia, and Californiaare all farming crayfish to some degree (17). Louisiana is the primary production area for severalreasons including: 1) regional demand for crawfish is high, 2) warmwater for growing, and 3)source of food which is primarily decaying plant material (rice field stubble) (17).
Other crustaceans produced in the U.S. but which currently play a minor role in the aquacultureindustry are marine shrimp (Penaeus sp.) and freshwater prawns (Macrobrachium rosenbergii). U.S. marine shrimp production is about 2,000 metric tons a year of which about 1,700 metric tonsare produced in Texas (2). South Carolina and Hawaii are also areas of concentration for the
USDA:APHIS:VS
12
industry. International production of marine shrimp was 730,000 metric tons in 1994 (2). China,Indonesia, Ecuador, India, the Philippines, Taiwan, Thailand, and Japan are all large shrimp-producing nations. Production of the freshwater prawn is about 150 metric tons in the U.S. (1). Internationally, there are about 26,000 metric tons produced annually, largely in Thailand andother Asian countries (10).
The future for crustacean species culture in the U.S. is mixed. Biologically, the crayfish is wellsuited to aquaculture in the southeastern U.S., and the potential for expansion is consideredexcellent especially in areas of rice production. A major advantage of the crawfish industry is thesimple culture method. There are no hatcheries to produce young; nor are there formulated rationsfor feeding. Young are produced by brood stock contained within the pond, and vegetation isutilized as forage. Disadvantages include the high volume of water required to maintain waterquality (70-100 gallons per minute per surface acre) and the high expense of harvesting throughtrapping (18). Another limiting factor of industry growth will likely be the regional nature ofconsumption of crawfish. Marketing activities may be able to broaden the appeal for crawfish. Marketing of soft-shell crawfish is seen as an area for development since consumers areacquainted with soft-shell crabs. Also, in 1987 a national restaurant chain purchased over 317metric tons of crawfish from Louisiana producers (2). Competition from imports will be achallenge to the crawfish industry as demonstrated by the doubling of imports in 1994 from Chinaof crawfish meat that is priced below the reported Louisiana production costs (7).
Marine shrimp grow best in less than full strength ocean water (19). Culture facilities must belocated near the coast to accommodate this requirement, but in the U.S., there are many laws andregulations that restrict the use of brackish water areas that are often important wetlands(19). Culture of freshwater shrimp is currently restricted to tropical areas. Special techniques wouldneed to be developed for the species to be cultured in subtropical and temperate regions. Growthin the U.S. shrimp industry will most likely be in production of disease-free brood stock and postlarvae for international distribution.
Molluscs Clams, oysters, and mussels are the primary molluscs (shellfish) cultured in the U.S. The totalproduction value of these three molluscs was estimated to be $95 million in 1992 (Table 2). Regionally, shellfish production can represent a substantial part of the value of the aquacultureindustry. A survey of Virginia aquaculture found that almost 70 percent of the sales generatedfrom saltwater species was from shellfish (2). In 1992, 31 percent of the total value of aquacultureproduction in Hawaii was from shellfish.
Most farm-raised clams are Manilla clams (Tapes philippinarum) from the West Coast or hardshell clams (Mercenaria mercenaria) from the East Coast. Close to 2,000 metric tons of clamswere produced in 1992 (Table 1) which represented a small proportion of the total domesticlandings (farmed and wild catch), 67,000 metric tons in 1993. Clams are the only molluscspecies that appear to have increased production from 1983 to 1992. Pacific oysters (Crassostrea

Overview of Aquaculture in the United States
13
gigas) in the U.S., are primarily from the West Coast and are almost exclusively the product ofaquaculture production. American oysters (Crassostrea virginica) are produced on the East Coastand the Gulf of Mexico. Louisiana had 1,964 oyster producers in 1993 with a gross farm value ofalmost $21 million. Total U.S. farmed oyster production in 1992 was estimated to be almost11,000 metric tons (Table 1) worth $82.4 million (Table 2)(1). Oyster landings in the U.S. during1993 were over 15,000 metric tons valued at $87 million (16). Mussel (Mytilus sp.) production isconcentrated on the West Coast. Estimated production of mussels in 1992 was 128 metric tonsworth slightly over $1 million (1). Domestic mussel landings in 1993 were 2,900 metric tons(Table 1) valued at $2.6 million (Table 2)(7). These landings represented a 31 percent declineover the 1992 landings because of low production from storm damaged beds on the East Coast(16). Overharvesting of wild populations will likely open the way for more aquaculture production ofmollusc species. Restrictions on marine leasing may limit production. Clams have a productionadvantage over other molluscs because they are typically consumed at small size which shortensthe production time for the premium product. Oysters take much longer to produce so, that evenin the face of increased export demand, growers are cautious about expanding before they see ifdemand will continue in the long term. Other problems for the oyster industry include the impactof pathogens and the public's attitude toward safety of consuming molluscs, oysters in particular.
Imports and Exports of Fisheries Products
Statistics for imports and exports of fishery products generally do not distinguish between farmedand wild-caught animals, so discussion of trade necessarily combines both types. The U.S. is anet importer of both edible and nonedible fisheries products even though it is still the largestexporter of fisheries products in the world. In 1993, $10.62 billion of fisheries products wereimported, while $6.92 billion were exported (3). Value of imports of both edible ($5.85 billion)and nonedible ($4.77 billion) products were at record levels in 1993 (1). Shrimp make up morethan one-third of the value of imports of edible fisheries products (Table 5). Primary exporters ofshrimp to the U.S. are Thailand, Ecuador, Mexico, China, and Indonesia. Salmon account for lessthan 5 percent of the edible imports. Farm-raised salmon, primarily Atlantic but also Chinook andCoho (Pacific salmon), make up at least 78 percent of the fresh or frozen salmon imports. Most ofthe salmon imported into the U.S. comes from either Canada or Chile. Norway does not exportmuch to the U.S. despite its world lead in farmed production of salmon.
Value of U.S. exports of nonedible products peaked in 1993 ($3.85 billion), but exports of edibleproducts ($3.08 billion) dipped from a 1992 peak (Table 6). In 1993, export of wild-caught andcultured salmon (fresh and frozen, canned, and roe) represented about 28 percent ($871.4 million)of the value of U.S. export of edible fisheries products (1). Japan received 82.5 percent of thefresh/frozen export while the United Kingdom and Canada imported 79 percent of the U.S.
USDA:APHIS:VS
14
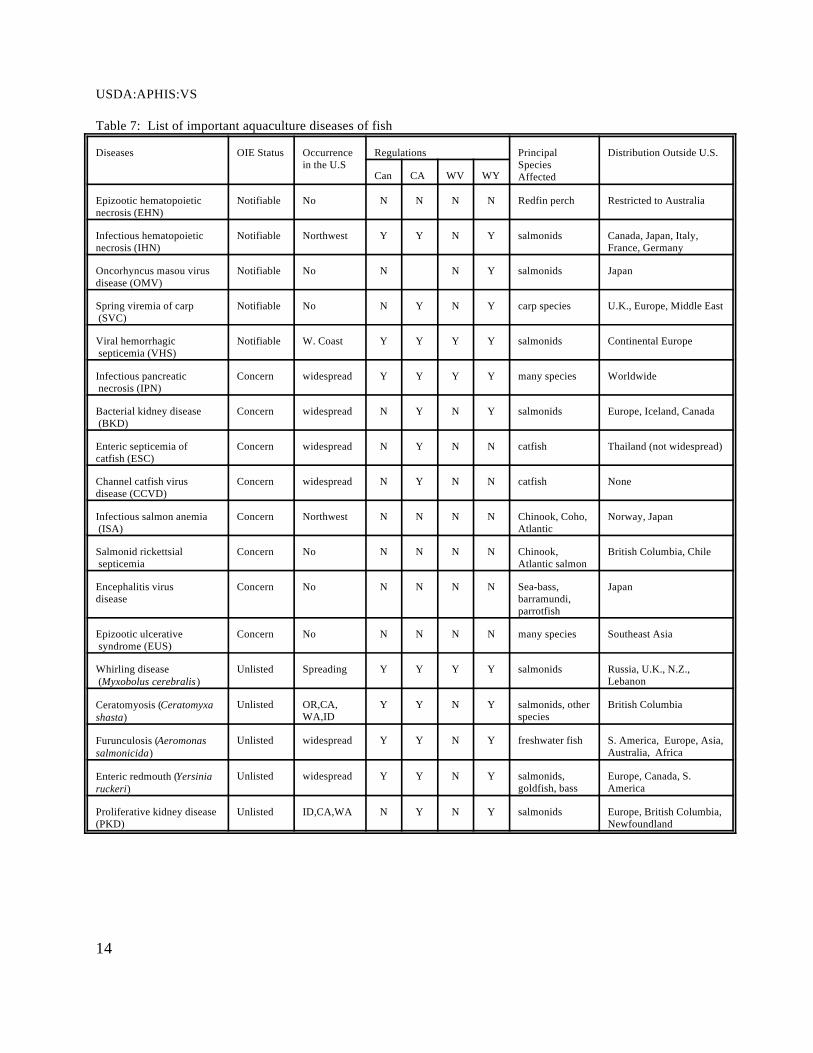
Table 7: List of important aquaculture diseases of fish
Diseases OIE Status Occurrence Regulations Principal Distribution Outside U.S. in the U.S Species
AffectedCan CA WV WY
Epizootic hematopoietic Notifiable No N N N N Redfin perch Restricted to Australianecrosis (EHN)
Infectious hematopoietic Notifiable Northwest Y Y N Y salmonids Canada, Japan, Italy,necrosis (IHN) France, Germany
Oncorhyncus masou virus Notifiable No N N Y salmonids Japandisease (OMV)
Spring viremia of carp Notifiable No N Y N Y carp species U.K., Europe, Middle East (SVC)
Viral hemorrhagic Notifiable W. Coast Y Y Y Y salmonids Continental Europe septicemia (VHS)
Infectious pancreatic Concern widespread Y Y Y Y many species Worldwide necrosis (IPN)
Bacterial kidney disease Concern widespread N Y N Y salmonids Europe, Iceland, Canada (BKD)
Enteric septicemia of Concern widespread N Y N N catfish Thailand (not widespread)catfish (ESC)
Channel catfish virus Concern widespread N Y N N catfish None disease (CCVD)
Infectious salmon anemia Concern Northwest N N N N Chinook, Coho, Norway, Japan (ISA) Atlantic
Salmonid rickettsial Concern No N N N N Chinook, British Columbia, Chile septicemia Atlantic salmon
Encephalitis virus Concern No N N N N Sea-bass, Japandisease barramundi,
parrotfish
Epizootic ulcerative Concern No N N N N many species Southeast Asia syndrome (EUS)
Whirling disease Unlisted Spreading Y Y Y Y salmonids Russia, U.K., N.Z., (Myxobolus cerebralis) Lebanon
Ceratomyosis (Ceratomyxashasta)
Unlisted OR,CA, Y Y N Y salmonids, other British ColumbiaWA,ID species
Furunculosis (Aeromonassalmonicida)
Unlisted widespread Y Y N Y freshwater fish S. America, Europe, Asia, Australia, Africa
Enteric redmouth (Yersiniaruckeri)
Unlisted widespread Y Y N Y salmonids, Europe, Canada, S.goldfish, bass America
Proliferative kidney disease Unlisted ID,CA,WA N Y N Y salmonids Europe, British Columbia,(PKD) Newfoundland
Overview of Aquaculture in the United States
15
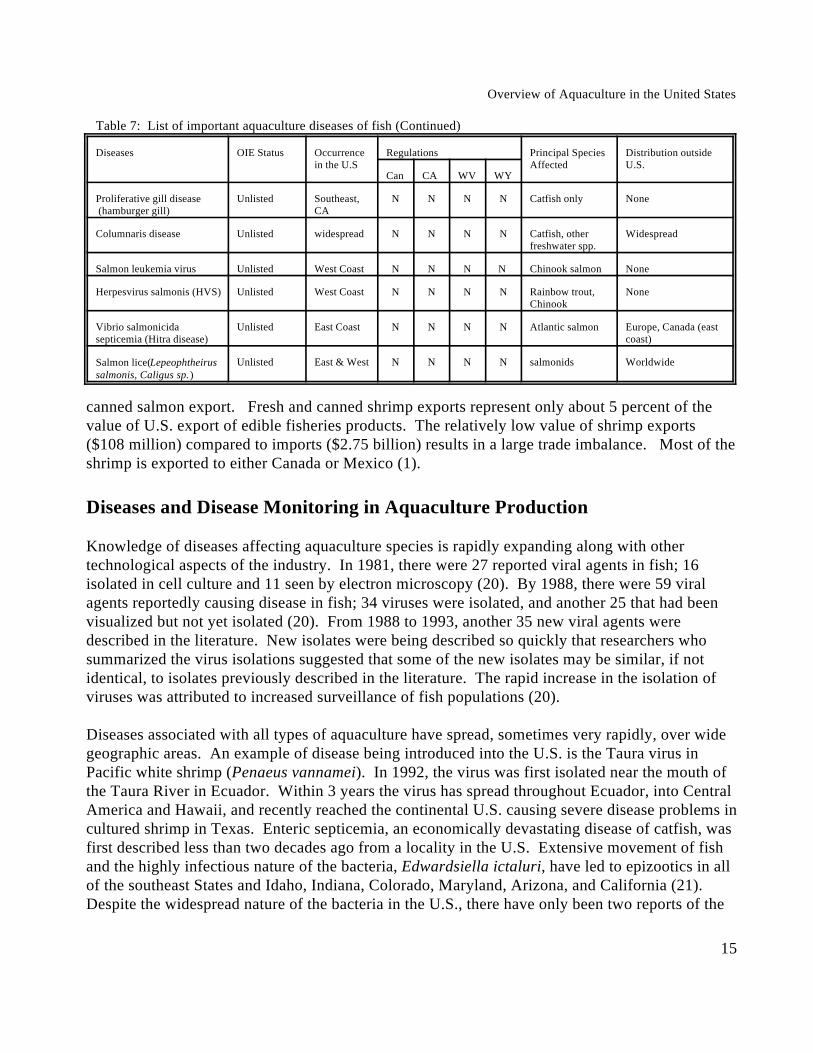
Table 7: List of important aquaculture diseases of fish (Continued)
Diseases OIE Status Occurrence Regulations Principal Species Distribution outsidein the U.S Affected U.S.
Can CA WV WY
Proliferative gill disease Unlisted Southeast, N N N N Catfish only None (hamburger gill) CA
Columnaris disease Unlisted widespread N N N N Catfish, other Widespreadfreshwater spp.
Salmon leukemia virus Unlisted West Coast N N N N Chinook salmon None
Herpesvirus salmonis (HVS) Unlisted West Coast N N N N Rainbow trout, NoneChinook
Vibrio salmonicida Unlisted East Coast N N N N Atlantic salmon Europe, Canada (eastsepticemia (Hitra disease) coast)
Salmon lice(Lepeophtheirussalmonis, Caligus sp.)
Unlisted East & West N N N N salmonids Worldwide
canned salmon export. Fresh and canned shrimp exports represent only about 5 percent of thevalue of U.S. export of edible fisheries products. The relatively low value of shrimp exports($108 million) compared to imports ($2.75 billion) results in a large trade imbalance. Most of theshrimp is exported to either Canada or Mexico (1).
Diseases and Disease Monitoring in Aquaculture Production
Knowledge of diseases affecting aquaculture species is rapidly expanding along with othertechnological aspects of the industry. In 1981, there were 27 reported viral agents in fish; 16isolated in cell culture and 11 seen by electron microscopy (20). By 1988, there were 59 viralagents reportedly causing disease in fish; 34 viruses were isolated, and another 25 that had beenvisualized but not yet isolated (20). From 1988 to 1993, another 35 new viral agents weredescribed in the literature. New isolates were being described so quickly that researchers whosummarized the virus isolations suggested that some of the new isolates may be similar, if notidentical, to isolates previously described in the literature. The rapid increase in the isolation ofviruses was attributed to increased surveillance of fish populations (20). Diseases associated with all types of aquaculture have spread, sometimes very rapidly, over widegeographic areas. An example of disease being introduced into the U.S. is the Taura virus inPacific white shrimp (Penaeus vannamei). In 1992, the virus was first isolated near the mouth ofthe Taura River in Ecuador. Within 3 years the virus has spread throughout Ecuador, into CentralAmerica and Hawaii, and recently reached the continental U.S. causing severe disease problems incultured shrimp in Texas. Enteric septicemia, an economically devastating disease of catfish, wasfirst described less than two decades ago from a locality in the U.S. Extensive movement of fishand the highly infectious nature of the bacteria, Edwardsiella ictaluri, have led to epizootics in allof the southeast States and Idaho, Indiana, Colorado, Maryland, Arizona, and California (21).Despite the widespread nature of the bacteria in the U.S., there have only been two reports of the
USDA:APHIS:VS
16
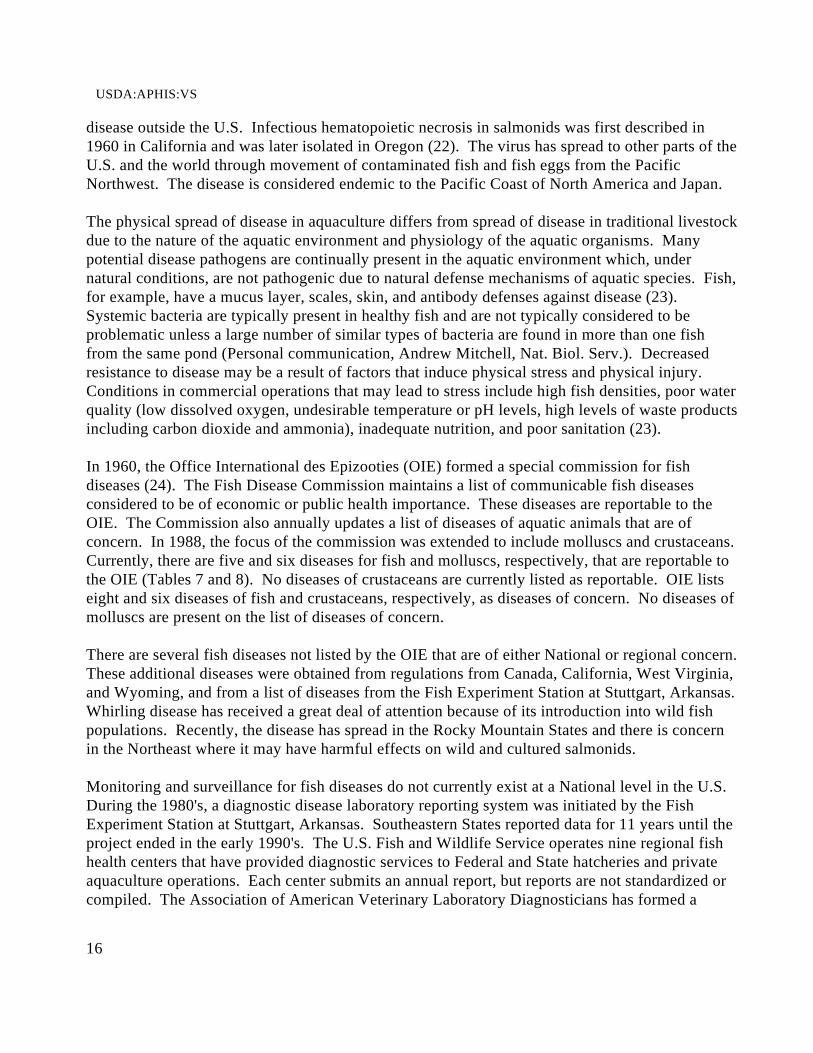
disease outside the U.S. Infectious hematopoietic necrosis in salmonids was first described in1960 in California and was later isolated in Oregon (22). The virus has spread to other parts of theU.S. and the world through movement of contaminated fish and fish eggs from the PacificNorthwest. The disease is considered endemic to the Pacific Coast of North America and Japan.
The physical spread of disease in aquaculture differs from spread of disease in traditional livestockdue to the nature of the aquatic environment and physiology of the aquatic organisms. Manypotential disease pathogens are continually present in the aquatic environment which, undernatural conditions, are not pathogenic due to natural defense mechanisms of aquatic species. Fish,for example, have a mucus layer, scales, skin, and antibody defenses against disease (23). Systemic bacteria are typically present in healthy fish and are not typically considered to beproblematic unless a large number of similar types of bacteria are found in more than one fishfrom the same pond (Personal communication, Andrew Mitchell, Nat. Biol. Serv.). Decreasedresistance to disease may be a result of factors that induce physical stress and physical injury. Conditions in commercial operations that may lead to stress include high fish densities, poor waterquality (low dissolved oxygen, undesirable temperature or pH levels, high levels of waste productsincluding carbon dioxide and ammonia), inadequate nutrition, and poor sanitation (23).
In 1960, the Office International des Epizooties (OIE) formed a special commission for fishdiseases (24). The Fish Disease Commission maintains a list of communicable fish diseasesconsidered to be of economic or public health importance. These diseases are reportable to theOIE. The Commission also annually updates a list of diseases of aquatic animals that are ofconcern. In 1988, the focus of the commission was extended to include molluscs and crustaceans. Currently, there are five and six diseases for fish and molluscs, respectively, that are reportable tothe OIE (Tables 7 and 8). No diseases of crustaceans are currently listed as reportable. OIE listseight and six diseases of fish and crustaceans, respectively, as diseases of concern. No diseases ofmolluscs are present on the list of diseases of concern.
There are several fish diseases not listed by the OIE that are of either National or regional concern. These additional diseases were obtained from regulations from Canada, California, West Virginia,and Wyoming, and from a list of diseases from the Fish Experiment Station at Stuttgart, Arkansas. Whirling disease has received a great deal of attention because of its introduction into wild fishpopulations. Recently, the disease has spread in the Rocky Mountain States and there is concernin the Northeast where it may have harmful effects on wild and cultured salmonids.
Monitoring and surveillance for fish diseases do not currently exist at a National level in the U.S. During the 1980's, a diagnostic disease laboratory reporting system was initiated by the FishExperiment Station at Stuttgart, Arkansas. Southeastern States reported data for 11 years until theproject ended in the early 1990's. The U.S. Fish and Wildlife Service operates nine regional fishhealth centers that have provided diagnostic services to Federal and State hatcheries and privateaquaculture operations. Each center submits an annual report, but reports are not standardized orcompiled. The Association of American Veterinary Laboratory Diagnosticians has formed a

Overview of Aquaculture in the United States
17
committee to investigate available information concerning diagnostic laboratories and commercialreagent suppliers. They hope to look into processes for laboratories to obtain accreditation. Atthis point, existing data on national aquatic animal health appear limited.
Regulations Affecting the Aquaculture Industry
State RegulationsThe aquaculture industry is regulated by many different Federal and State agencies. The diversityof agencies with jurisdiction over the industry is due to the nature of the industry and its history. Both aquaculture and native/game species often share the same water source; the same speciesmay be grown for aquaculture but still be regulated by State fish and game agencies. Use of water(both fresh and salt), treatments of water for therapeutic, water quality, or pesticidal reasons, anddischarges of effluent wastewater or treated water are all regulated, as often is land use andmodifications to the land. Issues regarding nonindigenous species, escapes of cultured animals,disposal of bait species, and habitat also are under the purview of several regulatory agencies. When aquaculture animals are intended for food use another set of agencies is involved, and if theproduct is destined for export, regulations of other countries can impact the industry.
State regulations are highly variable. In some States, the lead regulatory authority rests with theAgriculture agency, but in others it falls under the Natural Resource agency. Typically, a numberof other State agencies will also have some authority over the aquaculture industry. The onlysummary of State regulations currently available was included in a 1993 survey of State aquatichealth policies that was conducted jointly by the Maryland Department of Agriculture'sAquaculture/Seafood Programs and the National Association of State Aquaculture Coordinators(27). The survey results are discussed below. Regulations obtained directly from a few States arealso presented since the survey did not thoroughly address State regulations. The brief review ofregulations from four States demonstrates the diversity of authorities, permiting and reportingrequirements, and importation restrictions.
Thirty-five States, Puerto Rico, and Guam responded to the survey. Almost 65 percent of theStates required health certificates for fish entering the State, while only 2.7 percent reportedrequiring a health certificate when leaving the State. Health certification for intrastate movementand for release into public waters was required by 21.6 percent and 35.1 percent of therespondents, respectively. About one-third of the respondents charged fees. Lists of animalpathogens or species prohibited from introduction into State waters were kept by 49 percent of therespondents.
Aquaculture regulations in Missouri are structured such that the Missouri Department ofConservation (MDC) plays a minimal role in regulation of the aquaculture industry (Pers. Comm.Gary Novinger, MDC). No reporting or permits are required by MDC. MDC has a list of 47 fishspecies and 3 crustaceans (all three are crayfish) that it allows to be cultured in the State. MDC
USDA:APHIS:VS
18
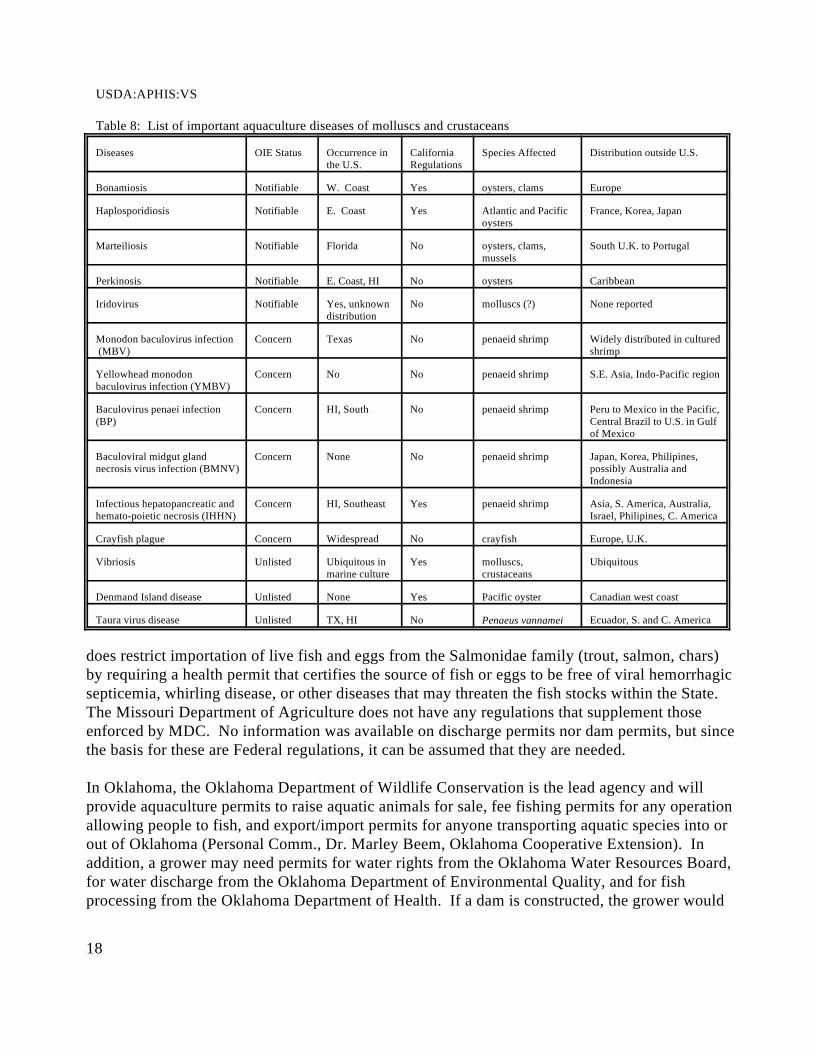
Table 8: List of important aquaculture diseases of molluscs and crustaceans
Diseases OIE Status Occurrence in California Species Affected Distribution outside U.S.the U.S. Regulations
Bonamiosis Notifiable W. Coast Yes oysters, clams Europe
Haplosporidiosis Notifiable E. Coast Yes Atlantic and Pacific France, Korea, Japanoysters
Marteiliosis Notifiable Florida No oysters, clams, South U.K. to Portugalmussels
Perkinosis Notifiable E. Coast, HI No oysters Caribbean
Iridovirus Notifiable Yes, unknown No molluscs (?) None reporteddistribution
Monodon baculovirus infection Concern Texas No penaeid shrimp Widely distributed in cultured (MBV) shrimp
Yellowhead monodon Concern No No penaeid shrimp S.E. Asia, Indo-Pacific regionbaculovirus infection (YMBV)
Baculovirus penaei infection Concern HI, South No penaeid shrimp Peru to Mexico in the Pacific,(BP) Central Brazil to U.S. in Gulf
of Mexico
Baculoviral midgut gland Concern None No penaeid shrimp Japan, Korea, Philipines,necrosis virus infection (BMNV) possibly Australia and
Indonesia
Infectious hepatopancreatic and Concern HI, Southeast Yes penaeid shrimp Asia, S. America, Australia,hemato-poietic necrosis (IHHN) Israel, Philipines, C. America
Crayfish plague Concern Widespread No crayfish Europe, U.K.
Vibriosis Unlisted Ubiquitous in Yes molluscs, Ubiquitousmarine culture crustaceans
Denmand Island disease Unlisted None Yes Pacific oyster Canadian west coast
Taura virus disease Unlisted TX, HI No Ecuador, S. and C. AmericaPenaeus vannamei
does restrict importation of live fish and eggs from the Salmonidae family (trout, salmon, chars)by requiring a health permit that certifies the source of fish or eggs to be free of viral hemorrhagicsepticemia, whirling disease, or other diseases that may threaten the fish stocks within the State. The Missouri Department of Agriculture does not have any regulations that supplement thoseenforced by MDC. No information was available on discharge permits nor dam permits, but sincethe basis for these are Federal regulations, it can be assumed that they are needed.
In Oklahoma, the Oklahoma Department of Wildlife Conservation is the lead agency and willprovide aquaculture permits to raise aquatic animals for sale, fee fishing permits for any operationallowing people to fish, and export/import permits for anyone transporting aquatic species into orout of Oklahoma (Personal Comm., Dr. Marley Beem, Oklahoma Cooperative Extension). Inaddition, a grower may need permits for water rights from the Oklahoma Water Resources Board,for water discharge from the Oklahoma Department of Environmental Quality, and for fishprocessing from the Oklahoma Department of Health. If a dam is constructed, the grower would
Overview of Aquaculture in the United States
19
need a dam inspection from the Oklahoma Water Resource Board.
Massachusetts passed new aquaculture regulations in August 1994. The Division of Fisheries andWildlife is the lead agency. Their regulations "... are designed to create a clear, concise processfor issuing permits for the culture and sale of fish while protecting the Commonwealth's existingfisheries resources from over-exploitation, uncontrolled and unintentional introductions, anddisease infestations." (28). The regulations provide for four distinct permits ranging from culturefor personal use only to a dealers permit. No harvesting of wild fish is allowed under anyaquaculture permit type. The Division has a list of 15 species that are allowed for culture. Theclass 3 aquaculture permit allows for propagation, culture, maintenance, purchase, and sale of fish. Permits are issued for facilities that meet specified requirements for preventing fish escape. Permit holders must keep records of sales of live fish including the permit number of the buyer. No additional permit is required for selling fish as food, but there are additional packing, marking,and tagging requirements.
Regulations in the State of Illinois are considered to be a model that some other States have usedto develop their own regulations. Their regulations are based on an Aquaculture Development Actpassed in 1987 and put into place in 1988. The implementation plan was developed in concertwith industry, agriculture, and fish and wildlife (Pers. Comm. Rodney Horner, IL Dept. ofConservation). Aquaculture producers purchase a permit to culture aquatic organisms (29). Thepermit grants them legal title to the fish which is often retained by the natural resource agencies inother States. It is easier for producers to get development money when they have legal title totheir crop. Also, they are allowed to use any gear needed to harvest their fish and do not fallunder State fishing regulations. The permit is issued for any species on the aquatic life approvedspecies list which includes 37 amphibians, 47 reptiles, 38 crustaceans, 36 molluscs, 62 gastropods,148 fish, and 105 plants. Any species not on the list cannot be imported without a letter ofauthorization. A review of a request for importation of a species not on the list is performed bythe Aquaculture Advisory Committee which is composed of representatives from the fourdivisions of the Department of Conservation (Fisheries, Wildlife, Natural Heritage, LawEnforcement), the president of the Illinois Aquaculture Industry Association, the Natural HistorySurvey, the aquaculture coordinator for the Illinois Department of Agriculture, the director of theSouthern Illinois University Fisheries Research Laboratory, and the Department of Public Health(Division of Food, Drugs, and Dairies). The head of the division of Fisheries must considerrecommendations of the Committee before making a final decision.
Producers in Illinois are not required to report sales or production, but they are required to keeprecords for 2 years. If the producer holds a State pesticide application permit, they are permittedto apply rotenone. The producer must also get a permit to slaughter fish for sale through theIllinois Department of Health. The Illinois model appears to work well by satisfying the needs ofthe conservation agency to control introductions and escapes but also allow the flexibility for theindustry to culture a wide range of species (Personal Comm., Rodney Horner, IL Dept. ofConservation).
USDA:APHIS:VS
20
Federal RegulationsMany Federal agencies have jurisdiction over aspects of the aquaculture industry; sometimesseveral agencies with the same department have different responsibilities. For example, theDepartment of Agriculture has involvement in animal health, export certification, animal damagecontrol (APHIS), in conducting research in aquaculture production and diseases (AgriculturalResearch Service), in providing research funds and technical information (Cooperative StateResearch, Education, and Extension Service), in assistance with pond construction (SoilConservation Service), and in assistance with financing through farm loans (Farmers HomeAdministration). The Economic Research Service and National Agriculture Statistical Serviceboth compile information on the size and value of the industry.
Other Federal agencies (not an exhaustive list) with involvement in or jurisdiction over aspects ofaquaculture include the Food and Drug Administration (FDA), the Environmental ProtectionAgency (EPA), the Department of Interior’s Fish and Wildlife Service (FWS), the Department ofCommerce’s National Marine Fisheries Service (NMFS), and the Department of Defense’s ArmyCorps of Engineers (COE).
Authority for the FDA to regulate the aquaculture industry arises from the Federal Food, Drug,and Cosmetic Act (25). Under this law the FDA regulates manufacturing, testing, registration,distribution, and use of animal drugs and feeds. The FDA centers with authorities involvingaquaculture are the Center for Veterinary Medicine (CVM) and the Center for Food Safety andApplied Nutrition (CFSAN). These centers ensure that drugs used in food-producing animals aresafe and effective, free from harmful residues, and develop and enforce standards for good safety,quality, residues, and nutritional labeling. The FDA also administers, in conjunction with theStates, the Interstate Shellfish Sanitation Commission, which addresses standards for water qualityin growing areas, and processing, transportation, and marketing of molluscs.
The EPA is involved in regulating aquaculture under at least four separate authorities: 1) theFederal Insecticide, Fungicide, and Rodenticide Act; 2) the Federal Food, Drug, and CosmeticAct; 3) the Clean Water Act (National Pollutant Discharge Elimination System- NPDES); and 4)the National Environmental Policy Act (NEPA). The EPA and FDA have mutual responsibilitiesunder the first two acts and have a memorandum of understanding that provides guidance forjurisdiction. The EPA has jurisdiction over disinfectants, sanitizers, and aquatic treatments forcontrol of algae, bacterial slime, or other pest control but which do not include claims for controlof parasites or diseases of fish. The EPA sets tolerances for pesticide residues. The FDA authoritycovers new animal drugs or products intended to treat or prevent parasites or diseases. The FDAenforces the pesticide tolerances in food products. Under the Clean Water Act, EPA has theresponsibility to prohibit discharge of any pollutant to navigable waters unless the discharge iscovered by a NPDES permit. Types of discharge of concern include waste water, drugs, andpesticides. NEPA provides for preparation of environmental impact statements when Federalagencies are involved in activities related to wetlands, floodplain management, environmentally-significant agricultural land, and wild and scenic rivers.
Overview of Aquaculture in the United States
21
The FWS has authority over aquaculture through the Lacey Act, the Endangered Species Act, theConvention on International Trade in Endangered Species of Wild Fauna and Flora, and the Fishand Wildlife Coordination Act. The first three authorities give the FWS a role in controllingimports of live fish, fish eggs and fish products. A recent final rule exempted exports of live farm-raised fish and farm-raised fish eggs from the FWS export requirements because exportation wasnot significantly increasing the risk that illegally taken wild fish were being exported as farm-raised fish. The last authority, the Fish and Wildlife Coordination Act, "requires that Federalagencies involved in actions that will result in the control or structural modification of any naturalstream or body of water for any purpose, to take action to protect the fish and wildlife resourceswhich may be affected by the action." (16 U.S.C. et seq). This authority gives the FWSresponsibility that sometimes affects the construction or operation of aquaculture facilities.
The NMFS in the Department of Commerce has several legislative authorities that allow theservice to oversee aspects of aquaculture in the marine environment: 1) the Magnuson FisheriesConservation and Management Act for conservation of fisheries resources in the U. S. ExclusiveEconomic Zone (EEZ); 2) the Marine Mammal Protection Act for monitoring, protection andmanagement of marine mammal stocks in U.S. waters; 3) The Endangered Species Act formonitoring and protection of marine life considered at risk of extinction; and 4) the Fish andWildlife Coordination Act which provides concurrent responsibilities with FWS for protectingaquatic habitat (4). Essentially, NMFS is the agency responsible for most of the living marineresources within the 200-mile EEZ. The States also have jurisdiction in areas closer to shore, andthe various regional fisheries commissions advise or share responsibilities with NMFS in certainareas or with certain species.
The Department of Agriculture, in accordance with a variety of authorities including the AnimalIndustry Act, the Agricultural Marketing Act, the Animal Damage Control Act, the FederalNoxious Weed Act, the Virus-Serum-Toxin Act, and the Food Security Act, supports aquaculturedevelopment through education, extension, research, and financial assistance (26). Severalagencies within the USDA support aquaculture. The Cooperative State Research, Education, andExtension Service (CSREES) provides leadership for aquaculture activities in the Department andoperates the Aquaculture office. The CSREES also has both National- and State-level extensionpersonnel actively working in aquaculture to provide the public with technical support. TheNational Agriculture Library has developed the Aquaculture Information Center dedicated todeveloping reference material on aquaculture. The Farmers Home Administration is authorizedto make loans for both ownership and operation of controlled environment aquaculture. Economic trends in the aquaculture industry are monitored and routinely reported by theEconomic Research Service. Annual estimates of catfish and trout production are providedthrough surveys conducted by the National Agricultural Statistics Service. The AgricultureResearch Service conducts and sponsors research on freshwater fish production and associatedprocessing/byproduct utilization.
The Animal and Plant Health Inspection Service (APHIS) of USDA has authority to conduct
USDA:APHIS:VS
22
research on and operations to control depredation by birds and other wildlife, to regulate allveterinary biologics produced in, shipped into, or exported from the U.S., and to certify andinspect animals and animal products. APHIS’ role in aquaculture has increased substantially inthe past 15 years and its present role is changing quickly. Much of the involvement has been inpredation, noxious weed control, and endorsements for export of ornamental species. Thebiologics program has been active in aquaculture related products for a number of years. In 1993,APHIS began providing assistance to exporters of live fish and eggs, primarily in the form ofhealth certification. Also, in 1993, APHIS was able to facilitate a shipment of seafood into theEuropean Union.
Current Roles of Veterinary Services, USDA
USDA:APHIS:Veterinary Services (VS), until relatively recently, has had a limited role inaquaculture. Certification of ornamental species for export is a service that VS has been providingfor some time. VS’ role has expanded in several areas as USDA has become more involved inaquaculture.
Headquarters Staff Staff has begun efforts in developing, planning, and assisting inimplementation of all of VS' efforts in aquaculture including Federal laws and regulations. Amajor role for staff is to develop liaisons with State and other Federal agencies, industry, andaquaculture specialists in academia. This coordination includes involvement in cooperative State-Federal-Industry aquatic animal health improvement programs and continued participation in theJoint Subcommittee on Aquaculture. Initial efforts to coordinate activities with industry beganwith a meeting held in March 1995. Agreements at the APHIS/Industry meeting included 1) worktoward designation and inclusion of aquaculture production as "livestock," 2) develop certificationprocess for interstate and international shipment of fish and their products, 3) education andtraining for public and private veterinarians in aquatic health issues and, 4) improve cooperationwith industry by describing services that VS can provide and keeping industry informed of VSactivities and plans. Also, the staff is actively involved in determining export health requirementsfor aquatic species.
National Veterinary Services Laboratories (NVSL) NVSL has taken initial steps toward fulfillinga variety of functions including diagnostics, reagent production, standardization of reagents andreferences, laboratory certification, and external laboratory quality assurance. Preliminary effortshave included training individuals in diagnostic methods, investigating laboratory certification,establishing cell cultures, and virus isolation of fish pathogens.
VS field force Certification of animal health for exportation is the principal role that VS fieldforce has undertaken. Most of the export certification has been with trout eggs and ornamentalspecies but other species have been involved including hybrid striped bass and shrimp. In Maine,field personnel have been interacting closely with the aquaculture industry, State government,academia, and other Federal agencies. Other field personnel are beginning to assess the size and
Overview of Aquaculture in the United States
23
diversity of the industries within their respective areas.
Centers for Epidemiology and Animal Health (CEAH) CEAH is in the initial stages of developinga program for monitoring the health of aquatic species which will develop information concerningmanagement practices, welfare concerns, and production. This monitoring will likely haveongoing components driven by data provided by industry, private veterinarians, or even diagnosticlaboratories. Periodic on-premises data collection may also be undertaken for the purpose ofgenerating national and regional estimates of aquatic animal health parameters. Informationdeveloped during the monitoring process may allow CEAH to assist the industry with qualityassurance activities. Federal, State, and Industry Contacts
Several sources exist to identify organizations and individuals that are involved in aquaculture. The most current and complete source is the document published by the National AgricultureLibrary titled "Resource Guide to Aquaculture Information" (30). The document lists trade andprofessional organizations, State Aquaculture Coordinators and contacts, Federal Agencies(regional and national level), libraries (academic, Federal, and State), and Regional AquacultureCenters. Individual States and State Extension offices often have lists of individuals/businessinvolved in aquaculture. Another valuable source of information for contacts is the AquacultureMagazine’s annual buyer’s guide.
Summary
Aquaculture is distributed throughout the U.S., but the majority of production, in terms of bothquantity and value, occurs in the southern part of the country. Freshwater production, dominatedby catfish, represents a larger segment of the industry than does saltwater production,predominantly salmon and oysters. From 1983 to 1992, the value of catfish production fairlyconsistently represented about 40 percent of the total value of U.S. aquaculture production. Crawfish, trout, and baitfish each represented about 12-13 percent of the value of U.S. productionover the same period. In recent years, the percentage contribution of trout and baitfish to the totalvalue of U.S. production has been declining. Salmon represented a small percentage of the totalU.S. value until the early 1990's, when the percentage doubled to almost 10 percent of total value. In 1992, these five cultured species accounted for 75 percent of the value of U.S. production.
Although the value of the industry is comparable to other livestock industries, the number ofoperations is still relatively few. In 1992, there were only 4,259 farms raising freshwater species. Half of these operations were catfish farms and 13.5 percent were trout farms.
Constraints to growth in the industry are: 1) demand for product, 2) natural resource availability,and 3) a myriad of Federal and State regulations. Domestic demand for fish/seafood probably willnot increase dramatically since per capita consumption does not appear to be increasing in the
USDA:APHIS:VS
24
U.S. Availability of clean water may be a limiting resource for future development of freshwateraquaculture facilities and environmental restrictions may limit marine aquaculture growth. Overlapping jurisdictions and a multitude of concerned Federal and State Agencies tend to inhibitthe development of the aquaculture industry. Agencies with the primary role of protecting naturalresources are often the lead regulatory agency while agriculture-related agencies have morelimited roles.
Aquaculture-related diseases are receiving more attention by researchers and the internationalcommunity. Still, many diseases have become widespread on a national or an international basis,sometimes over a relatively short time period. Data on national aquatic animal health appear to belimited at this time.
Overview of Aquaculture in the United States
25
Bibliography
1) United States Department of Commerce, National Marine Fisheries Service. 1994. Fisheries of the United States, 1993, Current Fishery Statistics No. 9300. Washington, D.C.
2) Anonymous. 1995. Status of world aquaculture 1994. Aquaculture Magazine Buyer's Guide '95. v. 24, pp. 8-23.
3) United States Department of Agriculture, National Agricultural Statistics Service. 1993. Agriculture Statistics 1993. Washington, D.C.
4) United States Department of Commerce, National Marine Fisheries Service. 1993. Our living oceans: The annual report on the status of U.S. living marine resources-1993. Silver Spring, MD.
5) Anonymous. 1994. Warmwater Fish Farming Map. Fish Farming Experimental Laboratory,
Stuttgart, Arkansas.
6) United States Department of Commerce, Bureau of Census. 1995. 1992 Census of Agriculture: Geographic Area Series, Vol. 1. Washington, D.C.
7) United States Department of Agriculture, Economic Research Service. 1995. Aquaculture Situation and Outlook, March 15, 1995. Washington, D.C.
8) Hopkins, T. A. and W. E. Manci. 1992. Aquaculture: Opportunity Now Part 1. Aqua. Mag. Nov/Dec 1992, pp. 43-47.
9) Stickney, R. R. 1986. Culture of Nonsalmonid Freshwater Fishes. CRC Press, Inc. Boca Raton, FL.
10) Food and Agriculture Organization of the United Nations, Fishery Information, Data and Statistics Service. 1993. Aquaculture Production 1985-1991. FAO Fisheries Circular No. 815 Revision 5. Rome, Italy.
11) Hodson, R. G. 1989. Hybrid Striped Bass, Biology and Life History. Southern Reg. Aqua. Center pub. no. 300.
12) Litvak, M. K. and N. E. Mandrak. 1993. Ecology of Freshwater Baitfish Use in Canada and the United States. Fisheries, Vol. 18, No. 12.
13) Fish Farming Experiment Laboratory. 1995. Facts about Arkansas Aquaculture. Brochure. Stuttgart, Arkansas.

USDA:APHIS:VS
26
14) Gray, D. L. 1988. Baitfish. Southern Reg. Aqua. Center pub. no. 120.
15) Florida Agricultural Statistics Service. 1994. Florida aquaculture sales total $73 million in 1993. Aqua. Mag. Sept/Oct. 1994 pp. 46-54.
16) United States Department of Agriculture, Economic Research Service. 1994. Aquaculture Situation and Outlook, October, 1994. Washington, D.C.
17) Avault, J. W. 1992. A review of world crustacean aquaculture part two. Aqua. Mag. July/Aug. 1992. p.83-89.
18) de la Bretonne Jr., L. W. 1990. Crawfish culture: Site selection, pond construction and water quality. Southern Reg. Aqua. Center pub. no. 200.
19) Avault, J. W. 1992. A review of world crustacean aquaculture part one. Aqua. Mag. May/June 1992 pp. 84-93.
20) Hetrick, F. M. and R.P. Hedrick. 1993. New viruses described in finfish from 1988-1992. Ann. Rev. of Fish Diseases, Vol. 3, pp. 187-208
21) Thune, R. L. 1993. Bacterial diseases of catfishes. In: Stoskopf, M. K. (ed.). Fish medicine. W. B. Saunders Co., Philadelphia, PA, pp. 511-520.
22) McAllister, P. E. 1993. Salmonid fish viruses. In: Stoskopf, M. K. (ed.). Fish medicine. W.B. Saunders Co., Philadelphia, PA, pp. 380-408.
23) Rottman, R.W., R. Francis-Floyd, R. Durborow. 1992. The role of stress in fish disease. Southern Reg. Aqua. Center pub. no. 474.
24) Office Internationale des Epizooties. 1993. Fish diseases brouchure. Paris, France.
25) Federal Joint Subcommittee on Aquaculture, Working Group on Quality Assurance in Aquaculture Production. 1994. Guide to Drug, Vaccine, and Pesticide Use in Aquaculture. Texas Ag. Ext. Serv. College Station, TX
26) McDowell, R. and C. Tuszynski. 1989. Aquaculture Policy Study: Part 1. Unpublished Report USDA:APHIS:VS, Washington, D.C.
27) Powers, B. and B. Arnella Jr. 1993. U.S. Aquatic Animal Health Services: Current Status Study Report to the Joint Subcommittee on Aquaculture. Washington, D.C.
Overview of Aquaculture in the United States
27
28) Anonymous. 1995. Division fo Fisheries and Wildlife, Summary of Aquaculture Regulations. Unpub. report, Commonwealth fo Massachusetts, Division of Fisheries and Wildlife, Westboro, MA.
29) Waite, S. W. 1987. The Illinois Aquaculture Development Plan: The Illinois Aquaculture Development Act. Unpub. report to the State of Illinois, Dept. of Agric. Springfield, IL.
30) United States Department of Agriculture, National Agriculture Library. 1994. Resource Guide to Aquaculture Information. Prepared for the Joint Subcommittee on Aquaculture, Aquaculture Information and Technology Transfer Task Force. Beltsville, MD.