overview of south dakota - south dakota public utilities ... wegman.… · overview of south dakota...
TRANSCRIPT

Overview of South Dakota
Steve WegmanSouth Dakota Public Utilities
Commission


Crude Oil Production in SD
0200,000400,000600,000800,000
1,000,0001,200,0001,400,0001,600,0001,800,000
1960
1963
1966
1969
1972
1975
1978
1981
1984
1987
1990
1993
1996
1999
2002
Barr
els

0
5,000,000
10,000,000
15,000,000
20,000,000
25,000,000
1960
1963
1966
1969
1972
1975
1978
1981
1984
1987
1990
1993
1996
1999
2002
Year
Barr
els
Consumption Production *UNREFINED*
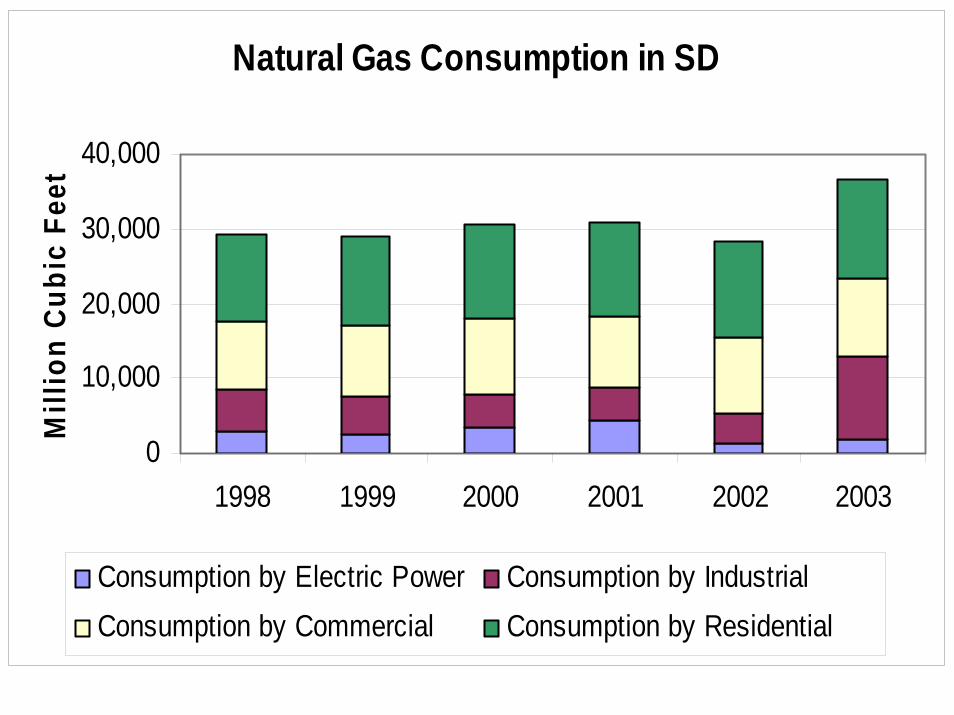
Natural Gas Consumption in SD
0
10,000
20,000
30,000
40,000
1998 1999 2000 2001 2002 2003
Mill
ion
Cubi
c Fe
et
Consumption by Electric Power Consumption by Industrial Consumption by Commercial Consumption by Residential

Production (Million Gallons)
Facility Facility Location
Permitted
Capacity 1999 2000 2001 2002 2003
Broin Enterprises Scotland 8 7.79 8.28 8.36 8.58 8.65
Heartland Grain Fuels Aberdeen 9 7.96 8.89 8.33 8.79 8.88
Heartland Grain Fuels Huron 12 0.28 5.07 11.02 11.98 12.31
JPJ Humboldt NA 0.13 0.16 0.20 0.07 0.16
Dakota Ethanol Wentworth 50 X 12.36 45.09 47.10
Tri-State Ethanol Rosholt 15 X 4.95 -
Northern Lights Ethanol Big Stone City 62 X 19.48 43.93
Glacial Lakes Energy Watertown 50 X 7.23 45.76
Great Plains Ethanol Chancellor 62 X 31.08
James Valley Ethanol Groton 62 X 27.05
VeraSun Energy Aurora 100 X 8.30
Sioux River Ethanol Hudson 62 X
Total Production 492 16.16 22.40 40.28
106.17
233.21

Percent of Ethanol Blended Fuel South Dakota Gasoline
Sales
0
10
20
30
40
50
60
1979 1983 1988 1993 1998 2000 2001 2002 2003
Ethanol blend

Ethanol Consumption and Production in SD
0
50
100
150
200
250
1999 2000 2001 2002 2003
Mill
ion
Gal
lons
Production Consumption
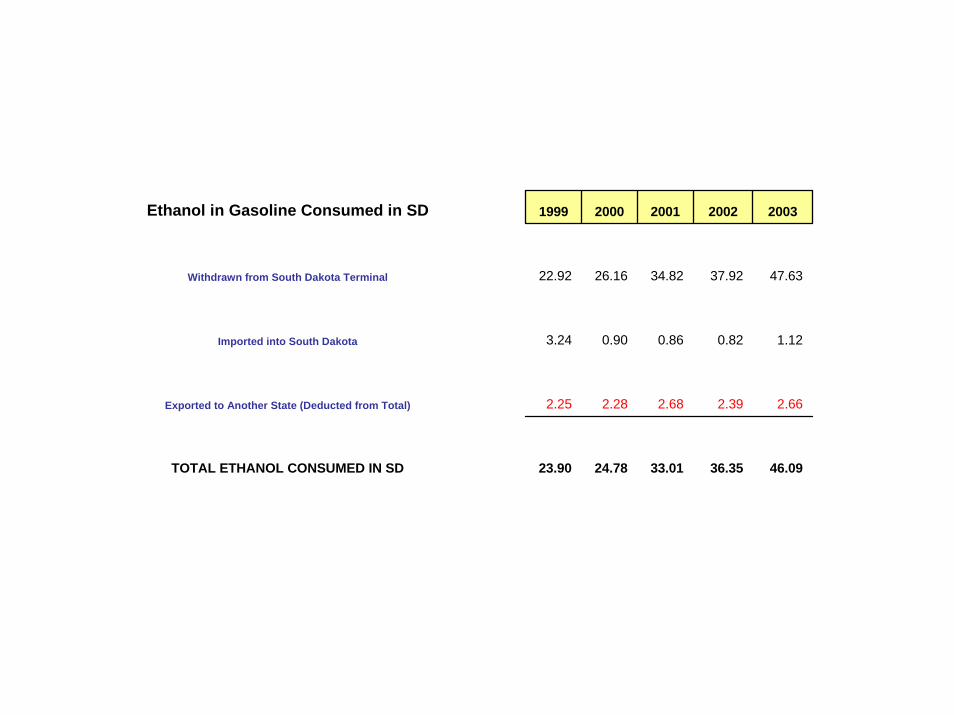
Ethanol in Gasoline Consumed in SD 1999 2000 2001 2002 2003
Withdrawn from South Dakota Terminal 22.92 26.16 34.82 37.92 47.63
Imported into South Dakota 3.24 0.90 0.86 0.82 1.12
Exported to Another State (Deducted from Total) 2.25 2.28 2.68 2.39 2.66
TOTAL ETHANOL CONSUMED IN SD 23.90 24.78 33.01 36.35 46.09

Net Interstate Flow of Electricity(negative value = net outflow of electricity)
-20,000
-15,000
-10,000
-5,000
0
5,000
10,00019
6019
6219
6419
6619
6819
7019
7219
7419
7619
7819
8019
8219
8419
8619
8819
9019
9219
9419
9619
9820
00
Mill
ion
kWH

Location Owner Fuel TypeMegawatt Capacity
Percent of Total
1. Oahe, Pierre US Corps Engineers Hydro 714 24.9%
2. Big Bend, Fort Thompson US Corps Engineers Hydro 509 17.7%
3. Big Stone, Big Stone CityOtter Tail Power/Montana Dakota Utilities/ North Western Public Service Coal, Oil 456 15.9%
4. Fort Randall, near Pickstown US Corps Engineers Hydro 353 12.3%
5. Angus Anson, Sioux Falls Xcel Energy (Northern States Power) Gas, Oil 229 8.0%
6. Gavins Point, near Yankton US Corps Engineers Hydro 102 3.6%
7. Ben French, Rapid City Black Hills PowerGas, Oil,
Coal 100 3.5%
8. Spirit Mound, near Vermillion Basin Electric Coop. Oil 96 3.3%
9. Huron Northwestern Public Service Gas, Oil 55 1.9%
10. Hyde County, near Highmore Basin Electric/ Florida Power and Light Wind 40 1.4%
All others 215 7.5%
Total 2869 100.0%
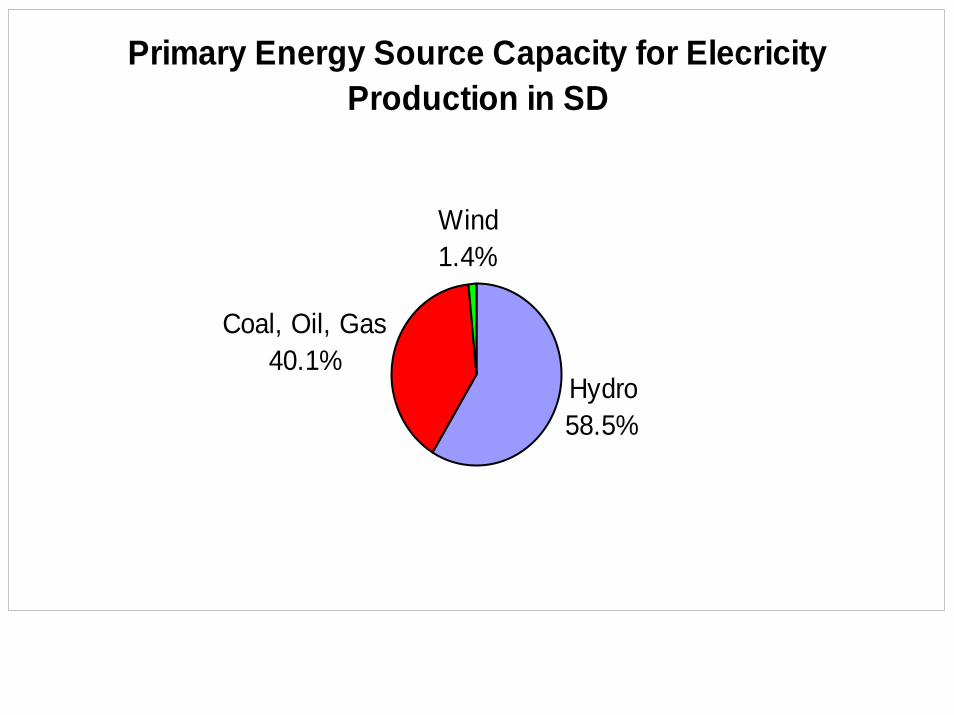
Primary Energy Source Capacity for Elecricity Production in SD
Hydro58.5%
Coal, Oil, Gas40.1%
Wind1.4%

Primary Energy Consumed by Source, 2000
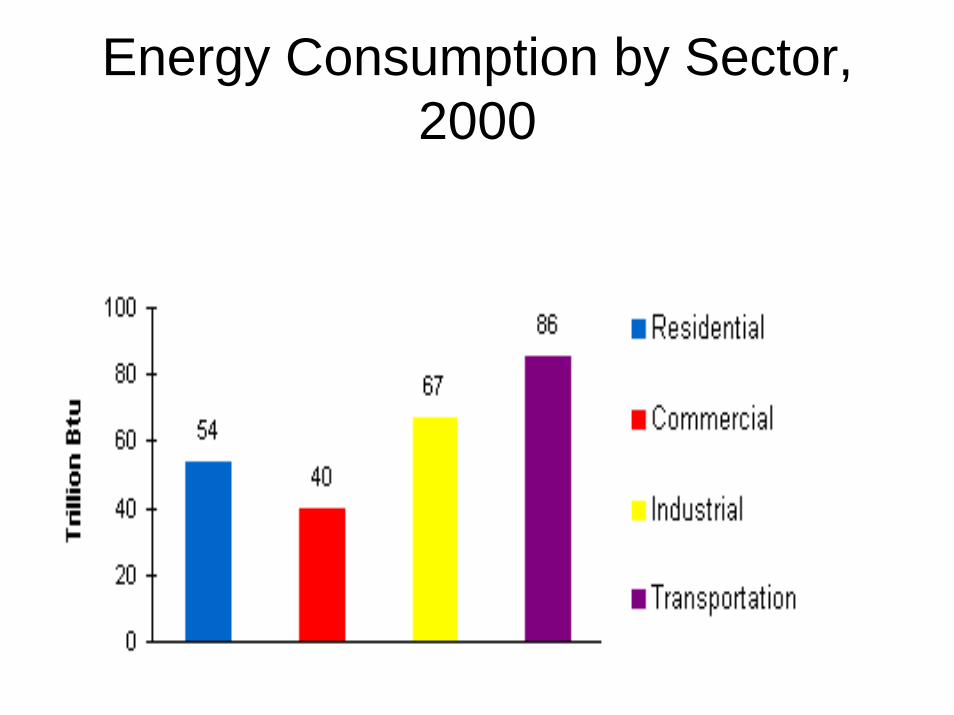
Energy Consumption by Sector, 2000

Methane Recovery
• City of Sioux Falls two 900 kW generators• John Morrell Plant boiler fuel

Wood Waste
• Spearfish pellets, steam• Hill City steam
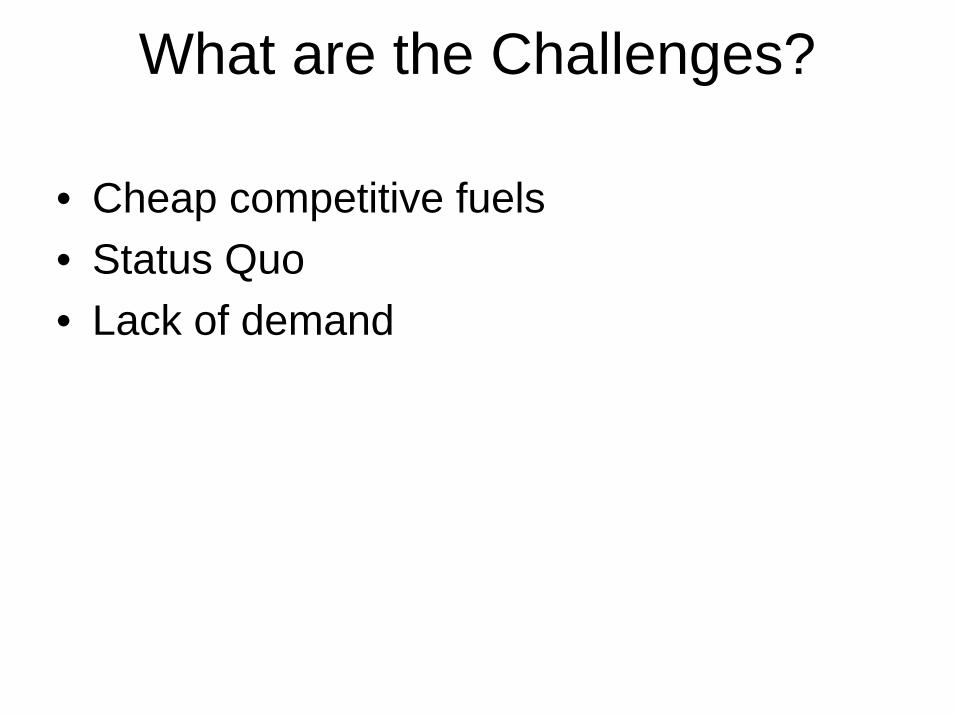
What are the Challenges?
• Cheap competitive fuels• Status Quo• Lack of demand

