overview report melaka - world bankdocuments.worldbank.org/curated/en/408101556608980667/...vi /...
TRANSCRIPT
A / Sustainability Outlook Diagnostic—Overview Report
OVERVIEW REPORT
Sustainability Outlook
Diagnostic
Pathway to Urban Sustainability
MELAKA
Pub
lic D
iscl
osur
e A
utho
rized
Pub
lic D
iscl
osur
e A
utho
rized
Pub
lic D
iscl
osur
e A
utho
rized
Pub
lic D
iscl
osur
e A
utho
rized
© 2019 International Bank for Reconstruction and Development / The World Bank
1818 H Street NWWashington DC 20433Telephone: 202-473-1000Internet: www.worldbank.org
This work is a product of the staff of The World Bank with external contributions. The findings, interpretations, and conclusions expressed in this work do not necessarily reflect the views of The World Bank, its Board of Executive Directors, or the governments they represent.
The World Bank does not guarantee the accuracy of the data included in this work. The boundaries, colors, denominations, and other information shown on any map in this work do not imply any judgment on the part of The World Bank concerning the legal status of any territory or the endorsement or acceptance of such boundaries.
Rights and PermissionsThe material in this work is subject to copyright. Because The World Bank encourages dissemination of its knowledge, this work may be reproduced, in whole or in part, for noncommercial purposes as long as full attribution to this work is given.
Any queries on rights and licenses, including subsidiary rights, should be addressed to World Bank Publications, The World Bank Group, 1818 H Street NW, Washington, DC 20433, USA; fax: 202-522-2625; e-mail: [email protected].
CitationPlease cite the report as follows: Global Platform for Sustainable Cities, World Bank. 2019. Melaka Sustainability Outlook Diagnostic: Overview Report: Pathway to Urban Sustainability. Washington, DC: World Bank.
Cover photo: “Aerial view of Malacca city at sunrise.” Credit: asnidamarwani.
Design: Ultra Designs, Inc.
MELAKA
OVERVIEW REPORT
Sustainability Outlook
Diagnostic
Pathway to Urban Sustainability
ii / Sustainability Outlook Diagnostic—Overview Report
Abbreviations iii
Acknowledgments v
Policy BriefingGPSC Sustainability Outlook Diagnostic 1
Key Areas for Improvement 2
Next Steps 3
Executive SummaryWhy Melaka 4
Assessing Melaka 6
Synopsis of Dimensions Covered 6
Supporting Report 1: Reinforcing Melaka’s Economic Success 6
Supporting Report 2: Integrating Environmental Plans 9
Supporting Report 3: Enhancing Services and Housing 10
Supporting Report 4: Shaping a Compact, Efficient, and Harmonious Urban Form 11
Supporting Report 5: Shifting Melaka’s Mobility Modal Split 12
Supporting Report 6: Demonstrating Fiscal Sustainability 14
Action Plan 16
Conclusion 19
Benchmarking Melaka’s Urban SustainabilityBackground 21
City Selection 22
Methodological Approach 22
Scoring 23
Normalization and Weights 24
Maturity Assessment 24
Benchmarking Excel Model 26
Assessment Results 26
Overall Results 26
Melaka’s Scoring 26
References 28
Annex A. Benchmarking Input Indicators 30
Annex B. Benchmarking Outcome Indicators 29
Table of Contents
ii / Sustainability Outlook Diagnostic—Overview Report MELAKA Pathway to Urban Sustainability / iii
Abbreviations
FIGURES
Figure 1. GPSC Benchmarking: Melaka’s
Pathway to Urban Sustainability 2
Figure 2. Melaka’s Strategic Location 4
Figure 3. Map of Melaka State’s Districts and
Municipalities 5
Figure 4. Benchmarking Melaka’s Urban
Sustainability Maturity 7
Figure 5. Tourist Arrivals to Melaka State
(2000–2014) 8
Figure 6. Melaka State’s Manufacturing Sector
Contribution to GVA and Total Employment
(2010–2016) 8
Figure 7. Melaka State’s Developed Land:
Actual in 2013 (left) and the State Structure
Plan 2035’s Future Potential Extent (right) 11
Figure 8. Melaka Heritage Area’s Pedestrian
Volume 13
Figure 9. Six Dimensions and Key Focus
Areas 22
Figure 10. Izmir’s Score Card: Vision and
Long-term Strategic Planning 24
Figure 11. Dimension Weightage as Part
of Overall Benchmarking Score 24
Figure 12. Overall Benchmarking Score
Reflecting Maturity of Urban Sustainability 24
Figure 13. Urban Maturity Steps 25
Figure 14. Traffic Light Representation
of Dimension Performance 26
Figure 15. Continuum Representation
of Melaka’s Benchmarking Scoring (0–100) 27
BOXES
Box 1. Melaka State’s Geographic and Political Structure 5
Box 2. GPSC Urban Sustainability Benchmarking 7
TABLES
Table 1. Recommended Actions 15
Table 2. Input Indicators (benchmark indicators) 30
Table 3. Output Indicators (background indicators) 32
ADB Asian Development Bank
EIU Economist Intelligence Unit
GEF Global Environment Facility
GHG greenhouse gases
GPSC Global Platform for Sustainable Cities
GSURR Global Practice for Social, Urban, Rural, and Resilience
GVA gross value added
HSR high-speed rail
IMM Izmir Metropolitan Municipality
MIGHT Malaysian Industry-Government Group for High Technology
UNIDO United Nations Industrial Development Organization
USF Urban Sustainability Framework
WHS World Heritage Site
“Melacca City panorama.” Photo: JPLDesigns.
iv / Sustainability Outlook Diagnostic—Overview Report
“Pic
ture
squ
e D
utc
h S
qu
are,
Mal
acca
.” P
ho
to: W
enb
in.
iv / Sustainability Outlook Diagnostic—Overview Report MELAKA Pathway to Urban Sustainability / v
The Melaka Sustainability Outlook Diagnostic was created by the Global Platform for Sustainable Cities (GPSC), which is managed by the World Bank and supported by the Global Environment Facility (GEF).
This document and the six associated supporting reports were prepared by a GPSC team led by Lincoln Lewis. GPSC's program manager is Xueman Wang. The following task team members contributed to the supporting reports as lead authors: Dmitry Sivaev and Diana Tello Medina, World Bank (Supporting Report 1); James Patterson-Waterston and Naina Khandelwal, Vivid Economics (Supporting Report 2); Jonathan Denis, Singapore-ETH Centre’s Future Cities Laboratory (Supporting Reports 3 and 4); Serge Salat, Urban Morphology and Complex Systems Institute (Supporting Reports 4 and 5); and Joshua Gallo and David Painter, World Bank (Supporting Report 6). The section on benchmarking Melaka’s urban sustainability benefited from research by the Economist Intelligence Unit. The team thanks Peter Griffiths for drafting the policy brief and executive summary, and Vivid Economics for its work on the supporting reports. The team also thanks Anne Himmelfarb for her thorough work as the manuscript editor and Miki Fernandez for his attention to detail in the graphic design.
GPSC’s diagnostic was performed with the GEF project Sustainable City Development in Malaysia, which was guided by the United Nations Industrial Development Organization as the implementing agency. The team would like to thank Katarina Barunica for her facilitation throughout the project.
The assessment would not have been possible without a strong connection to the Government of Malaysia and Melaka State. The Malaysian Industry-Government Group for High Technology in the Prime Minister’s Department was the
executing agency for the GEF project. Datuk Mohd Yusoff Sulaiman, Raslan Ahmad, Datuk Nik Ahmad Faizul Abd Malek, Zulkifflee Mohamad, Anusha Magendram, Nik Sufini Nik Mohamed, Fatin Asmida Asman, and Siti Nur Fatimah Noodin provided invaluable facilitation for the assessment. The report was augmented by inputs from AJM-Planning and Urban Design Group Sdn Bhd (Noraida Saludin, Peter Ong, and Mohd Syafiq Subri) and RJ Planning (Rahani Binti Jusoh, Ainun Mahani, and Nabila Norsamsuddin). The team thanks Melaka Green Technology Corporation of Melaka State (Datuk Haji Kamarudin bin Md Shah, Chandru Suparmaniam, Mohd Hafizam bin Mustaffa, and staff) for representing Melaka State during the assessment process and coordinating the stakeholder engagement sessions.
GPSC thanks the numerous participants in the stakeholder engagement meetings, held October and November 2017 and January 2018, and in the subsequent conversations held to inform the development of the report. Presentations of the results were made in October and November 2018. Attendees of the working group meetings and decision meetings came from the Government of Malaysia, Melaka State, municipalities and districts, utility companies, and tertiary educational institutions.
The federal government ministries, agencies, and departments were represented by the project’s National Steering Committee members; Ministry of Federal Territories; Ministry of Housing and Local Government; Ministry of Economic Affairs; Ministry of International Trade and Industries; Ministry of Finance; Ministry of Energy, Science, Technology, Environment and Climate Change; Ministry of Water, Land and Natural Resources; Ministry of Transport; Federal Department of Town and Country Planning Malaysia (PLANMalaysia); Urbanice Malaysia; Kuala Lumpur City Council; Malaysian Bumiputera Economic Empowerment Unit; Malaysian Economic Planning Unit; Land Public Transport Commission; Malaysian
Acknowledgments
vi / Sustainability Outlook Diagnostic—Overview Report
Energy Commission; Malaysian Department of Environment; Malaysia Department of Lands and Mines; Malaysia Green Technology Corporation; and the Kuala Lumpur–Singapore High Speed Rail Corporation.
The Melaka State government and corporations were represented by the Melaka Chief Minister’s Department; Melaka Ministry of Industry, Trade, and Investment; Melaka State Economic Planning Unit; Melaka Housing Board; Melaka State Department of Social Welfare; Melaka State Landscape Department; Melaka State Development Corporation; Malaysian Ministry of Rural Development, Melaka; Malaysian Department of Health, Melaka; Malaysian Department of Statistics, Melaka; Department of Town and Country Planning Peninsular Malaysia, Melaka; National Security Council, Melaka; and Panorama Melaka.
Local stakeholder municipalities were represented by the Melaka Historic City Council; Alor Gajah Municipal Council; Hang Tuah Jaya Municipal Council; and Jasin Municipal Council. Utility companies were represented by SWM Environment Sdn Bhd and Indah Water Consortium Sdn Bhd. Tertiary education stakeholders were represented by the Technical University of Malaysia, Melaka, and Multimedia University, Melaka Campus.
For support throughout the development of this document, the team would like to thank the World Bank’s Global Knowledge and Research Hub in Malaysia, led by Representative to Malaysia and Country Manager Firas Raad, and offer special thanks to Mei Ling Tan for her support. Feedback from peer reviewers Dao Harrison, Olivia D’aoust, Steven Rubinyi, and Aiga Stokenberga was greatly appreciated.
Work on the Melaka Sustainability Outlook Diagnostic at the World Bank’s Global Practice for Social, Urban, Rural, and Resilience (GSURR) was carried out under the guidance of Abhas Jha and Francis Ghesquiere as the Urban and Disaster Risk Management Practice Managers for East Asia and Pacific, Maitreyi Das as the Practice Manager for the Global Programs Unit, Sameh Wahba as GSURR Director, and Ede Ijjasz-Vasquez as GSURR Senior Director. ●
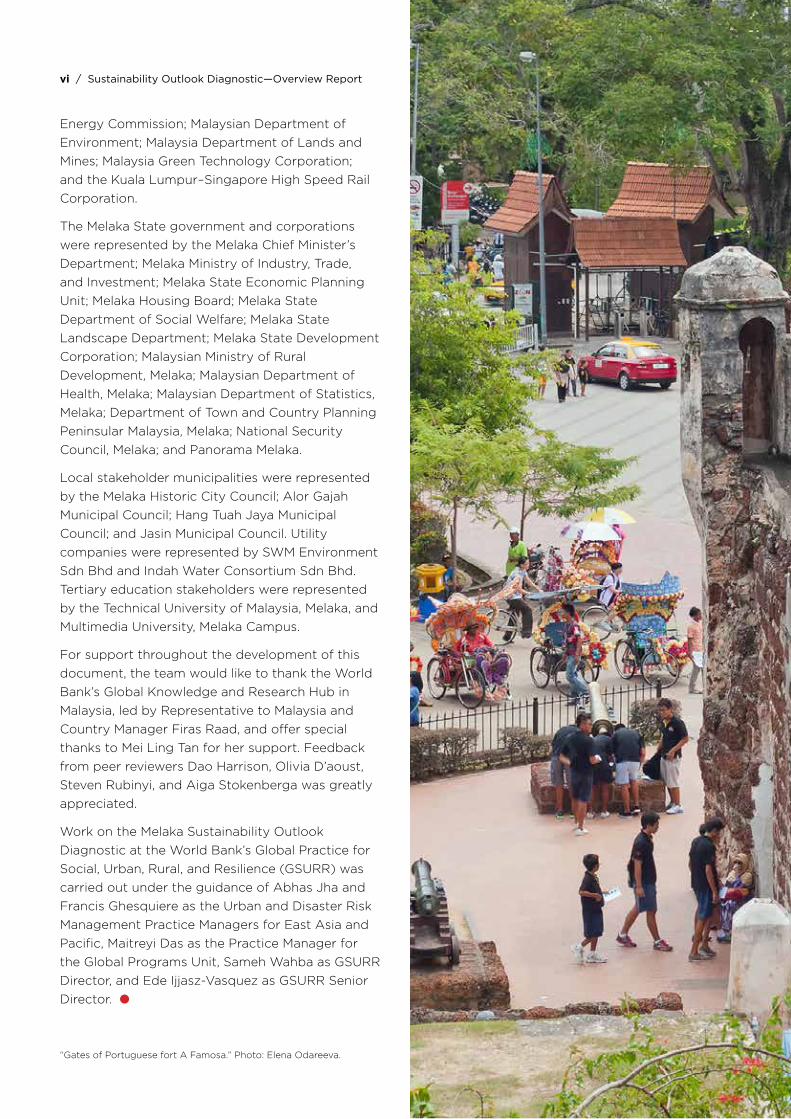
“Gates of Portuguese fort A Famosa.” Photo: Elena Odareeva.
vi / Sustainability Outlook Diagnostic—Overview Report MELAKA Pathway to Urban Sustainability / 1
Realizing Melaka’s sustainability aspirations requires bold steps to maintain the state’s economic success and prepare the necessary infrastructure for its expected population growth. This policy briefing is followed by an executive summary and benchmarking information, and accompanied by six supporting reports offering in-depth analyses. The Global Platform for Sustainable Cities (GPSC), led by the World Bank, is a network of 28 cities in 11 countries that supports adopting an integrated approach to urban planning and financing. An integrated approach requires wide input, and a full list of acknowledgments has been included in this report.
GPSC Sustainability Outlook DiagnosticMelaka State, situated roughly halfway between Kuala Lumpur and Singapore, has unique importance in the global dialogue around the sustainability of our shared urban future. At Melaka’s heart is its historic urban center, a UNESCO World Heritage Site (WHS) strategically located along the Strait of Malacca, one of the world’s busiest shipping routes and a link between the two largest countries by population, China and India. Melaka has taken significant steps toward realizing a more sustainable urban growth trajectory, including becoming a member of GPSC when the platform was launched in 2016. In 2017, GPSC initiated the Sustainability Outlook Diagnostic with the United Nations Industrial
Policy Briefing
2 / Sustainability Outlook Diagnostic—Overview Report
Melaka’s pathway to urban susta
inability
Development Organization (UNIDO) and the
Malaysian Industry-Government Group for High
Technology (MIGHT) to assist Melaka State in
achieving the level of urban sustainability to which
it aspires.
This detailed assessment covers six dimensions of
sustainability, captured in supporting reports titled
Reinforcing Melaka’s Economic Success; Integrating
Environmental Plans; Enhancing Services and
Housing; Shaping a Compact, Efficient, and
Harmonious Urban Form; Shifting Melaka’s Mobility
Split; and Demonstrating Fiscal Sustainability. Each
report provides significant insight into different
aspects of Melaka’s sustainability trajectory and
highlights key areas for improvement.
Melaka was also benchmarked against the cities of
Izmir (Turkey), Lisbon (Portugal), Recife (Brazil),
and Singapore. The policy-focused benchmarking
analyzed 65 indicators to determine a holistic
urban sustainability profile for each city that looked
at several key areas (Governance and Integrated
Urban Planning; Fiscal Sustainability; Urban
Economies; Natural Environment and Resources;
Climate Action and Resilience; and Inclusivity and
Quality of Life). This comprehensive approach
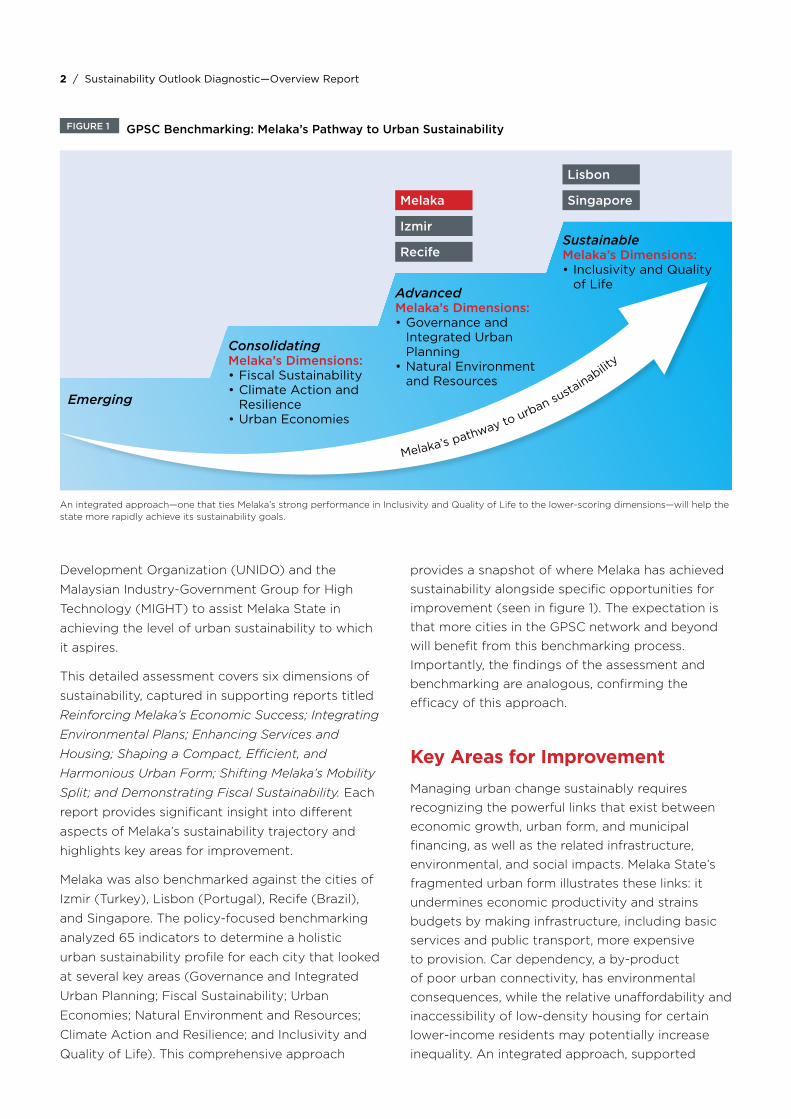
provides a snapshot of where Melaka has achieved sustainability alongside specific opportunities for improvement (seen in figure 1). The expectation is that more cities in the GPSC network and beyond will benefit from this benchmarking process. Importantly, the findings of the assessment and benchmarking are analogous, confirming the efficacy of this approach.
Key Areas for ImprovementManaging urban change sustainably requires recognizing the powerful links that exist between economic growth, urban form, and municipal financing, as well as the related infrastructure, environmental, and social impacts. Melaka State’s fragmented urban form illustrates these links: it undermines economic productivity and strains budgets by making infrastructure, including basic services and public transport, more expensive to provision. Car dependency, a by-product of poor urban connectivity, has environmental consequences, while the relative unaffordability and inaccessibility of low-density housing for certain lower-income residents may potentially increase inequality. An integrated approach, supported
FIGURE 1 GPSC Benchmarking: Melaka’s Pathway to Urban Sustainability
Melaka
Izmir
Recife
Lisbon
An integrated approach—one that ties Melaka’s strong performance in Inclusivity and Quality of Life to the lower-scoring dimensions—will help the state more rapidly achieve its sustainability goals.
SustainableMelaka’s Dimensions:• Inclusivity and Quality
of LifeAdvanced Melaka’s Dimensions:• Governance and
Integrated Urban Planning
• Natural Environment and Resources
ConsolidatingMelaka’s Dimensions:• Fiscal Sustainability• Climate Action and
Resilience• Urban Economies
Emerging
Singapore
2 / Sustainability Outlook Diagnostic—Overview Report MELAKA Pathway to Urban Sustainability / 3
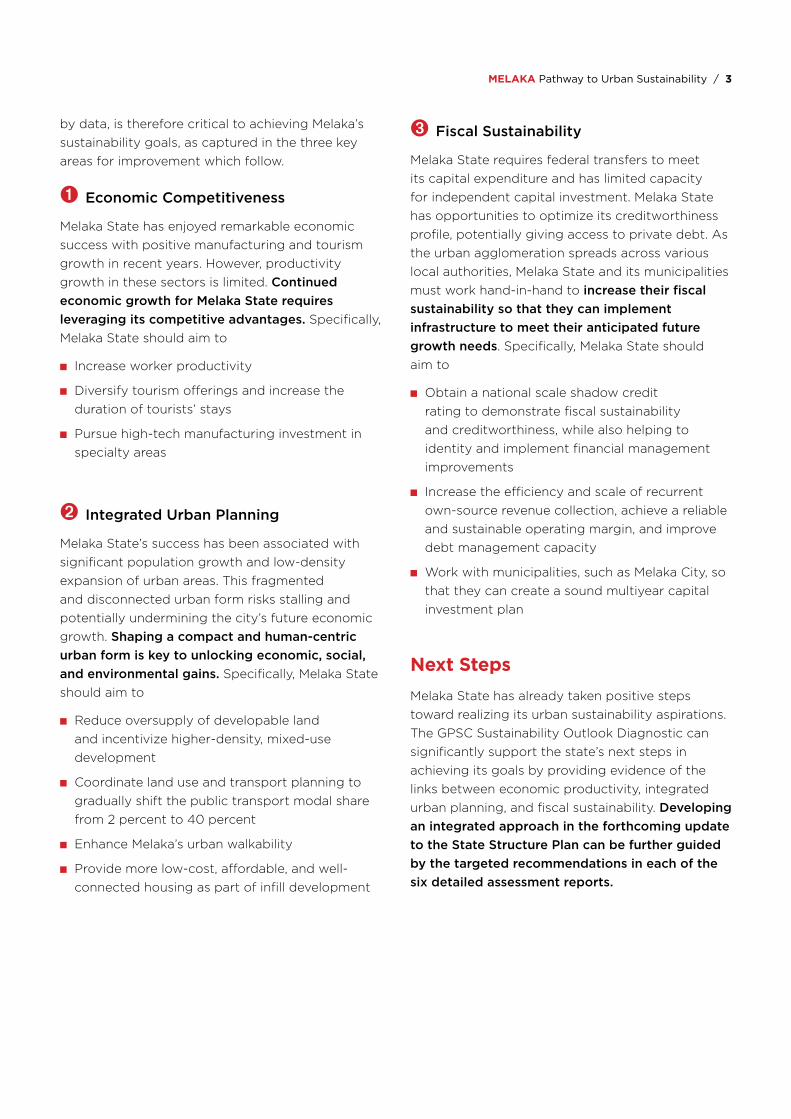
by data, is therefore critical to achieving Melaka’s sustainability goals, as captured in the three key areas for improvement which follow.
➊ Economic Competitiveness
Melaka State has enjoyed remarkable economic success with positive manufacturing and tourism growth in recent years. However, productivity growth in these sectors is limited. Continued economic growth for Melaka State requires leveraging its competitive advantages. Specifically, Melaka State should aim to
■ Increase worker productivity
■ Diversify tourism offerings and increase the duration of tourists’ stays
■ Pursue high-tech manufacturing investment in specialty areas
➋ Integrated Urban Planning
Melaka State’s success has been associated with significant population growth and low-density expansion of urban areas. This fragmented and disconnected urban form risks stalling and potentially undermining the city’s future economic growth. Shaping a compact and human-centric urban form is key to unlocking economic, social, and environmental gains. Specifically, Melaka State should aim to
■ Reduce oversupply of developable land and incentivize higher-density, mixed-use development
■ Coordinate land use and transport planning to gradually shift the public transport modal share from 2 percent to 40 percent
■ Enhance Melaka’s urban walkability
■ Provide more low-cost, affordable, and well-connected housing as part of infill development
➌ Fiscal Sustainability
Melaka State requires federal transfers to meet its capital expenditure and has limited capacity for independent capital investment. Melaka State has opportunities to optimize its creditworthiness profile, potentially giving access to private debt. As the urban agglomeration spreads across various local authorities, Melaka State and its municipalities must work hand-in-hand to increase their fiscal sustainability so that they can implement infrastructure to meet their anticipated future growth needs. Specifically, Melaka State should aim to
■ Obtain a national scale shadow credit rating to demonstrate fiscal sustainability and creditworthiness, while also helping to identity and implement financial management improvements
■ Increase the efficiency and scale of recurrent own-source revenue collection, achieve a reliable and sustainable operating margin, and improve debt management capacity
■ Work with municipalities, such as Melaka City, so that they can create a sound multiyear capital investment plan
Next StepsMelaka State has already taken positive steps toward realizing its urban sustainability aspirations. The GPSC Sustainability Outlook Diagnostic can significantly support the state’s next steps in achieving its goals by providing evidence of the links between economic productivity, integrated urban planning, and fiscal sustainability. Developing an integrated approach in the forthcoming update to the State Structure Plan can be further guided by the targeted recommendations in each of the six detailed assessment reports.
Why MelakaMalaysia’s Melaka State, situated roughly halfway between Kuala Lumpur and Singapore, has unique importance in the global dialogue around the sustainability of our shared urban future. The state has taken significant steps toward realizing a more sustainable urban growth trajectory, including becoming a member of GPSC when the platform was launched in 2016. In 2017, GPSC initiated the Sustainability Outlook Diagnostic with UNIDO and MIGHT; the goal has been to assist Melaka State in
1 This report uses Melaka, the traditional Malay spelling, rather than the alternative spelling of Malacca to reference Melaka State and Melaka City.
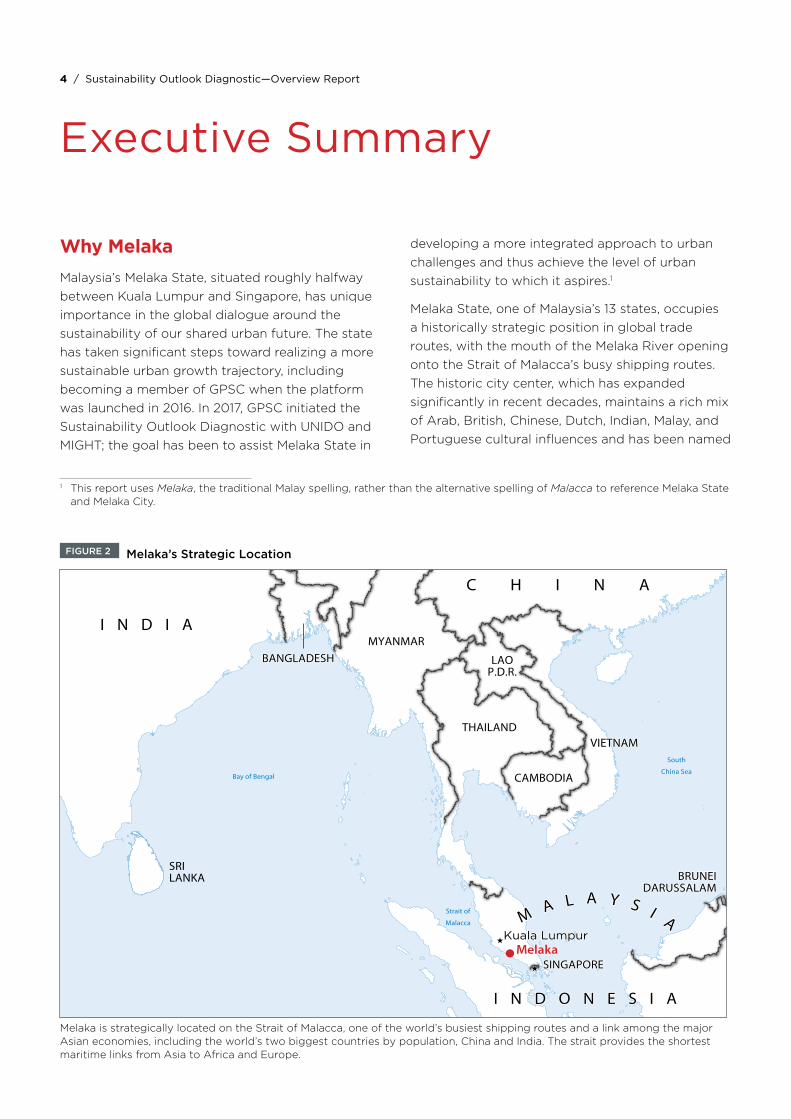
developing a more integrated approach to urban challenges and thus achieve the level of urban sustainability to which it aspires.1
Melaka State, one of Malaysia’s 13 states, occupies a historically strategic position in global trade routes, with the mouth of the Melaka River opening onto the Strait of Malacca’s busy shipping routes. The historic city center, which has expanded significantly in recent decades, maintains a rich mix of Arab, British, Chinese, Dutch, Indian, Malay, and Portuguese cultural influences and has been named
NayPyi
Daw
Thimphu
Islamabad
Kabul
Dhaka
Kathmandu
C H I N A
I N D I A
NEPAL
AFGHANISTAN
P A K I S T A N BHUTAN
M Y A N M A R
THAILAND
BANGLADESH
Bangkok
PhnomPenh
To Washington
Kuala LumpurKuala Lumpur
Thimphu
Islamabad
Kabul
Kathmandu
New Delhi
MelakaMelaka
C H I N A
I N D I A
NEPAL
AFGHANISTAN
P A K I S T A N BHUTAN
MYANMAR
I N D O N E S I AI N D O N E S I A
THAILAND
LAOP.D.R.
VIETNAMVIETNAM
SRILANKA BRUNEI
DARUSSALAMBRUNEI
DARUSSALAM
SINGAPORESINGAPORE
BANGLADESH
MA L A Y S I AMA L A Y S I A
CAMBODIA
Arabian
Sea
Bay of Bengal
South
China Sea
Strait of
Malacca
Executive Summary
Melaka is strategically located on the Strait of Malacca, one of the world’s busiest shipping routes and a link among the major Asian economies, including the world’s two biggest countries by population, China and India. The strait provides the shortest maritime links from Asia to Africa and Europe.
FIGURE 2 Melaka’s Strategic Location
4 / Sustainability Outlook Diagnostic—Overview Report
a UNESCO WHS. Further information regarding Melaka’s geographic and political structure is included in box 1.
The state has recently experienced strong economic growth, and it has high aspirations for its urban sustainability. The state government has shown leadership in several recent initiatives guiding its development strategies. For instance, the Green City Action Plan was developed by the Asian Development Bank (ADB) in 2014 to focus specifically on water management, energy efficiency and renewable energy, green transportation, zero waste, urban agriculture and
forestry, and cultural heritage and tourism (ADB 2014). Melaka’s State Structure Plan 2035 (State of Melaka 2018) further aims to promote economic growth, improve connectivity, reconstruct the physical living environment, manage traffic, improve socioeconomic well-being, and facilitate overall sustainable development.
However, the city faces significant challenges, including a car-dependent, inefficient spatial form that undermines productivity, entails significant social and environmental costs, and exacerbates financial pressures in meeting infrastructure needs. The GPSC’s Sustainability Outlook Diagnostic
BOX 1 Melaka State’s Geographic and Political Structure
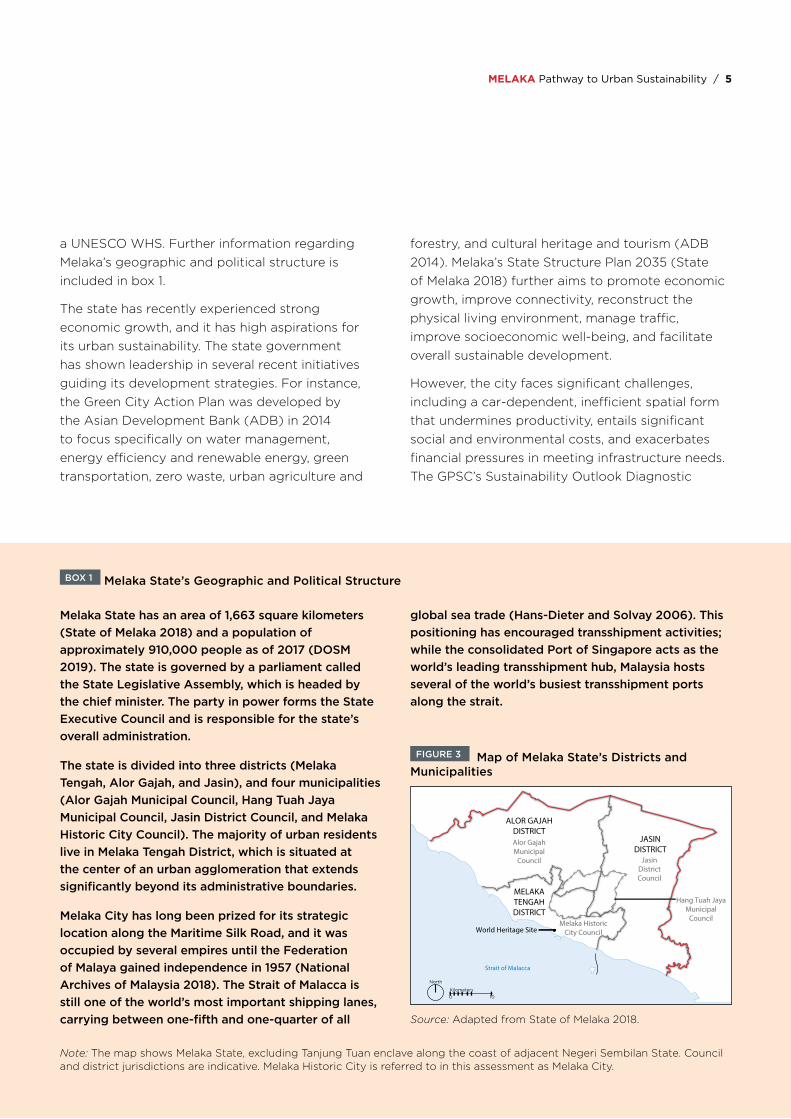
Melaka State has an area of 1,663 square kilometers (State of Melaka 2018) and a population of approximately 910,000 people as of 2017 (DOSM 2019). The state is governed by a parliament called the State Legislative Assembly, which is headed by the chief minister. The party in power forms the State Executive Council and is responsible for the state’s overall administration.
The state is divided into three districts (Melaka Tengah, Alor Gajah, and Jasin), and four municipalities (Alor Gajah Municipal Council, Hang Tuah Jaya Municipal Council, Jasin District Council, and Melaka Historic City Council). The majority of urban residents live in Melaka Tengah District, which is situated at the center of an urban agglomeration that extends significantly beyond its administrative boundaries.
Melaka City has long been prized for its strategic location along the Maritime Silk Road, and it was occupied by several empires until the Federation of Malaya gained independence in 1957 (National Archives of Malaysia 2018). The Strait of Malacca is still one of the world’s most important shipping lanes, carrying between one-fifth and one-quarter of all
global sea trade (Hans-Dieter and Solvay 2006). This positioning has encouraged transshipment activities; while the consolidated Port of Singapore acts as the world’s leading transshipment hub, Malaysia hosts several of the world’s busiest transshipment ports along the strait.
FIGURE 3 Map of Melaka State’s Districts and Municipalities
Source: Adapted from State of Melaka 2018.
Strait of Malacca
100
Kilometers
North
JASINDISTRICT
ALOR GAJAH DISTRICT
MELAKA TENGAH DISTRICT
Hang Tuah JayaMunicipal
CouncilMelaka Historic
City Council
Alor Gajah Municipal
Council JasinDistrictCouncil
World Heritage Site
4 / Sustainability Outlook Diagnostic—Overview Report MELAKA Pathway to Urban Sustainability / 5
Note: The map shows Melaka State, excluding Tanjung Tuan enclave along the coast of adjacent Negeri Sembilan State. Council and district jurisdictions are indicative. Melaka Historic City is referred to in this assessment as Melaka City.
6 / Sustainability Outlook Diagnostic—Overview Report
for Melaka provides a holistic approach to enable leaders to assess Melaka’s strengths and weaknesses as they chart a path toward achieving their sustainability ambitions. The outcome and speed of this type of assessment is heavily reliant on available data, particularly spatially disaggregated data. As Melaka expands its data capabilities it will be able to make more informed policy decisions.
Assessing Melaka GPSC’s Melaka Sustainability Outlook Diagnostic: Pathway to Urban Sustainability and its associated supporting reports were developed to inform the next update to the State Structure Plan, focusing on sectors that are integral to Melaka’s future urban sustainability. Guided by the GPSC’s Urban Sustainability Framework (GPSC, World Bank 2018), it lays out analyses supported with available data, key messages, and recommendations across six detailed assessment reports. These cover how Melaka State can reinforce its economic success (Supporting Report 1); integrate environmental plans (Supporting Report 2); enhance services and housing (Supporting Report 3); shape a more efficient urban form (Supporting Report 4); shift mobility to walking and public transport (Supporting Report 5); and demonstrate fiscal sustainability (Supporting Report 6). They further highlight the degree to which Melaka’s future sustainability is connected to urban form, underscoring the need to develop an integrated approach in responding to sustainability challenges.
In addition, a further benchmarking exercise using 65 indicators has been conducted to more rapidly assess Melaka’s sustainability profile against its peers (box 2). Importantly, the findings of the assessment and benchmarking are analogous, confirming the efficacy of this approach. Full details are captured in the benchmarking section of this report.
Synopsis of Dimensions CoveredThe in-depth analysis in the six supporting assessment reports consistently points to the need for Melaka State to adopt an integrated approach to achieving its sustainability aspirations, with three
key considerations emerging: 1) sustaining Melaka’s remarkable economic success requires focusing on its competitive advantages in the manufacturing and tourism sectors to boost productivity; 2) shaping a compact and human-centric urban form is key to unlocking economic, environmental, and social gains; and 3) implementing infrastructure to meet anticipated future growth needs requires increased fiscal sustainability. Each of the reports includes a set of key messages and recommended actions for improving sustainability. These are summarized as follows.
Supporting Report 1: Reinforcing Melaka’s Economic Success
Key message: ■ Leverage competitive advantages and create conditions for the key sectors of tourism and manufacturing to thrive.
Melaka State has seen remarkable economic growth in recent decades; however, much of this has been through the growth of the tourism sector and related increases in consumer services. The city’s manufacturing sector, while still responsible for 41 percent of economic output (DOSM 2017a), has registered modest growth in productivity and output in recent years. A reliance on tourism and associated short-term low-quality jobs to drive growth may be undermining productivity gains in the wider economy; it may also be straining infrastructure, services, and the heritage assets of the city as well as undermining the region’s long-term economic sustainability. Melaka State’s unusually low unemployment rate of 0.9 percent, possible labor shortages, and relatively lower population growth further suggest the need to increase productivity to sustain growth. Given the competition for talent from Kuala Lumpur and Singapore, Melaka needs to increase its competitiveness—both by building on its strengths to attract talent to better job prospects in highly productive sectors and by improving the quality of life it offers. Having most investment flows for manufacturing in medium- and high-tech sectors is a positive sign that higher-quality jobs are being created. However, a relative lack of connective infrastructure, including limited links to the national rail network, limits labor mobility and Melaka’s access to local and international markets.
6 / Sustainability Outlook Diagnostic—Overview Report
BOX 2 GPSC Urban Sustainability Benchmarking
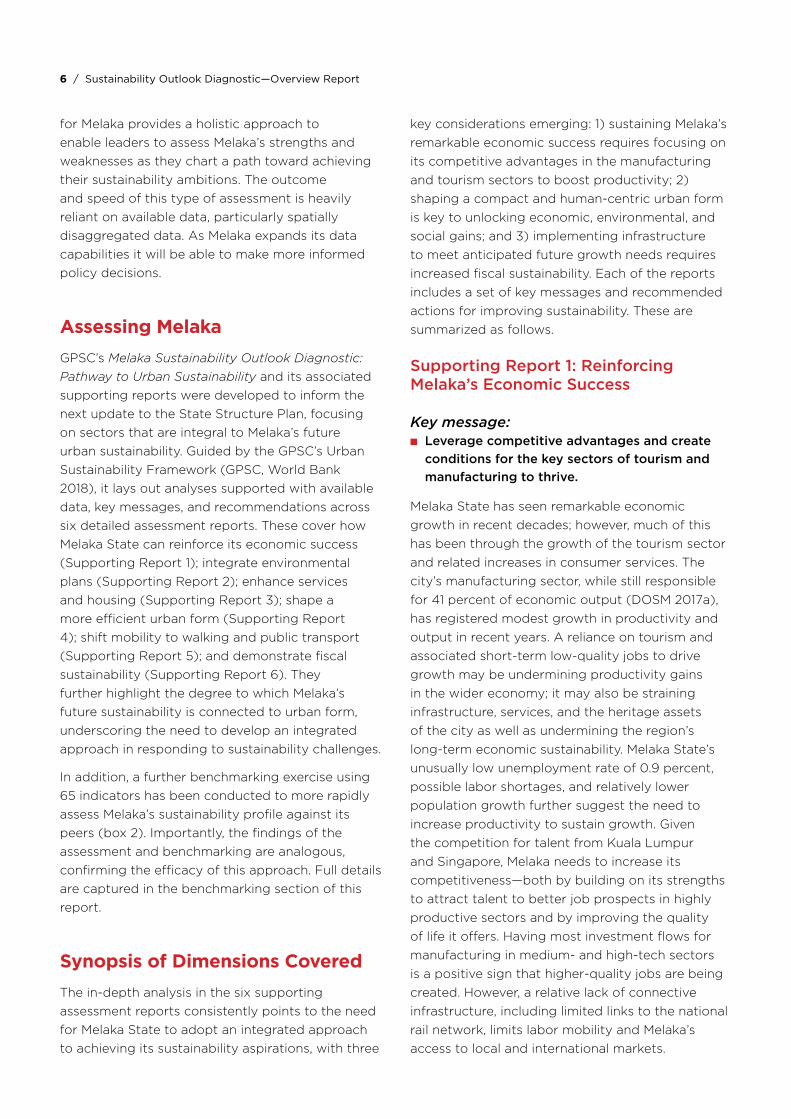
Melaka was benchmarked against Izmir (Turkey), Lisbon (Portugal), Recife (Brazil), and Singapore using 65 indicators. The policy-focused benchmarking analyzed six dimensions of urban sustainability and created a framework having four different steps of urban maturity. While Melaka’s overall development is “Advanced” (the third level), its Inclusivity and Quality of Life dimension is ranked “Sustainable” (the highest level). The Climate Action and Resilience, Fiscal Sustainability, and Urban Economies dimensions are
currently “Consolidating” (the second level). The results of the benchmarking are included in a later section of this Overview Report.
This benchmarking process will be expanded to more urban areas, including much of the GPSC network. Importantly, it does not rank cities, but instead highlights which cities are examples of best practices in different areas and can be seen as achievable models for their peers.
Melaka has taken significant steps toward achieving its sustainability goals. An integrated approach that ties together Melaka’s strong performance in Inclusivity and Quality of Life with the lower-scoring dimensions will help the state more rapidly move from “Advanced” to “Sustainable.”
FIGURE 4 Benchmarking Melaka’s Urban Sustainability Maturity
MELAKA Pathway to Urban Sustainability / 7
Emerging
• Finding a Vision
• Scattered Responses
• Lacking Implementation
Consolidating
• Developing Vision
• Strategic Priorities
• Beginning Implementation
Melaka• Fiscal Sustainability
• Climate Action and Resilience
• Urban Economies
Advanced
• Clear Vision
• Comprehensive Strategy
• Successful Implementation
Melaka• Governance and
Integrated Urban Planning
• Natural Environment and Resources
Sustainable
• Long-term Vision
• Integrated Strategy
• Continuous Implementation
Melaka• Inclusivity and Quality
of Life
Melaka
Izmir
Recife
Lisbon
Singapore
8 / Sustainability Outlook Diagnostic—Overview Report
2000
2010
2001
2011
2002
2012
2003
2013
2004
2014
2005
2015
2006 2007 2008 2009 2010 2011 2012 2013 2014
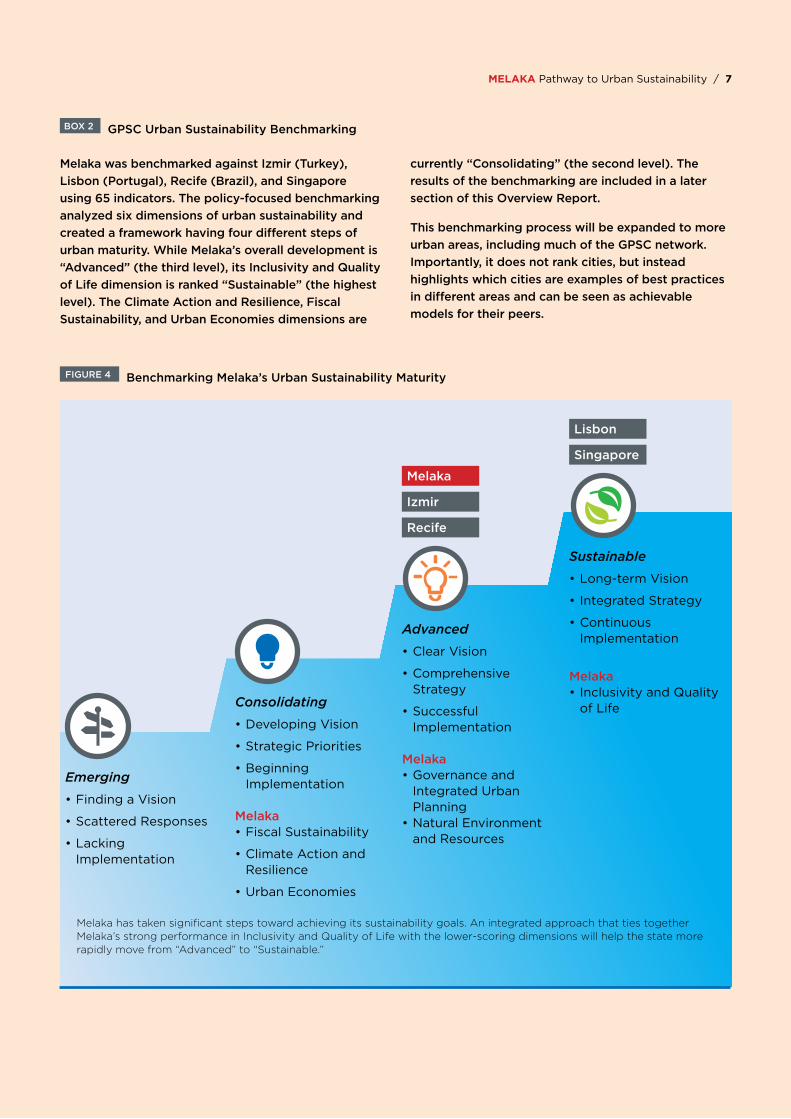
FIGURE 5 Tourist Arrivals to Melaka State (2000–2014)
16
14
12
10
8
6
4
2
0
43%
42%
41%
40%
39%
38%
25%
20%
15%
10%
5%
0%
16,000
14,000
12,000
10,000
8,000
6,000
4,000
2,000
–
Num
ber
of
tour
ist
arri
vals
(m
illio
ns)
Shar
e o
f to
tal G
VA
Year
ly g
row
th o
f to
uris
ts (
%)
GV
A in
man
ufac
turi
ng (
RM
mill
ion)
Despite continuing growth in the absolute number of visitors, the rate of growth has declined in recent years. Diversifying tourism offerings to attract higher-value travelers and encouraging more productive labor will ensure the sector continues to drive economic growth.
Sources: Tourism Malaysia 2015; Melaka Tourism Promotion Division 2015.
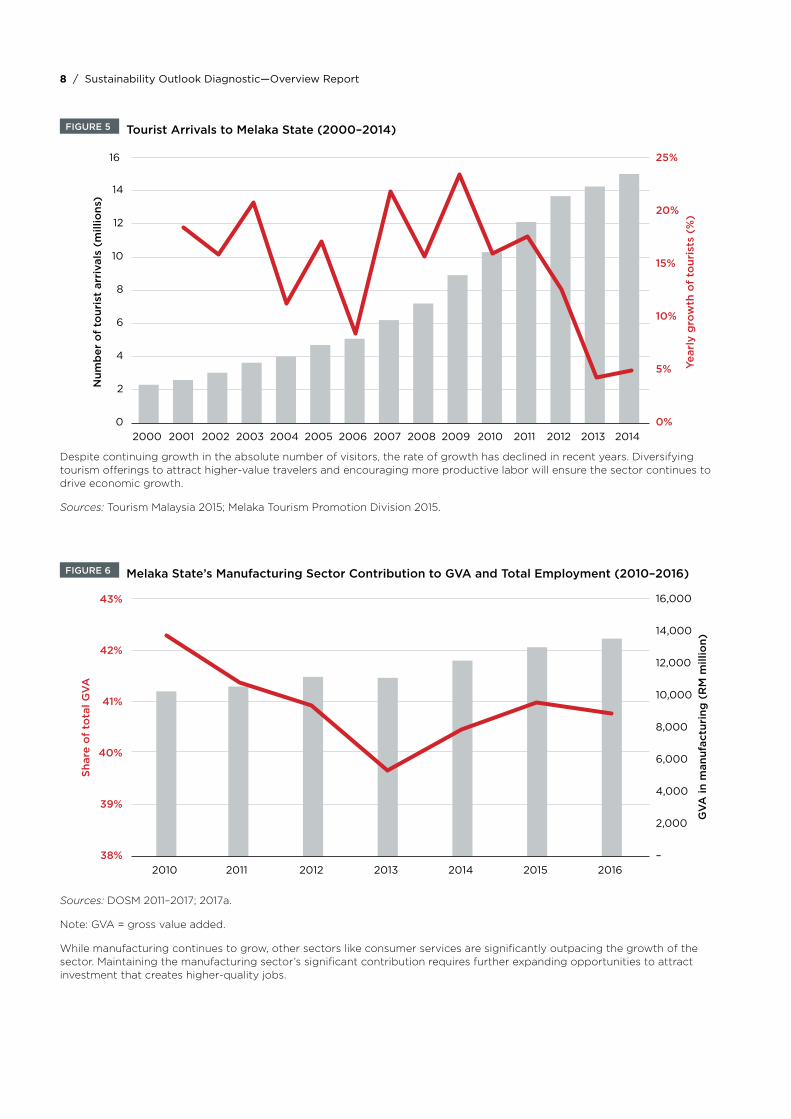
FIGURE 6 Melaka State’s Manufacturing Sector Contribution to GVA and Total Employment (2010–2016)
2016
Sources: DOSM 2011–2017; 2017a.
Note: GVA = gross value added.
While manufacturing continues to grow, other sectors like consumer services are significantly outpacing the growth of the sector. Maintaining the manufacturing sector’s significant contribution requires further expanding opportunities to attract investment that creates higher-quality jobs.
8 / Sustainability Outlook Diagnostic—Overview Report MELAKA Pathway to Urban Sustainability / 9
Recommended actions to improve sustainability:
1-A Reassess large infrastructure projects and create strategies to leverage their opportunities. Ensure that projects like high-speed rail (HSR) and port investment—alongside local connectivity improvements and policy innovations—increase businesses’ access to markets and labor.
1-B Rethink strategic priorities and link them with opportunities for economic development. Understand what caused tourism and manufacturing to cluster in Melaka, and then prioritize opportunities for economic opportunity that build on and recognize local strengths and capacities.
1-C Build a more inclusive and collaborative model of economic decision making. Leverage the power of business and community decision making by building robust partnerships.
1-D Support development of major sectors. Tourism and manufacturing, as existing pillars of the economy, require unique support to continue to thrive, e.g., diversification for tourism offerings and productivity boosts for manufacturing.
Supporting Report 2: Integrating Environmental Plans
Key message:
■ Synthesize existing initiatives by creating an integrated environmental approach and progressing toward recalibrated goals.
Melaka’s rapid urbanization has resulted in significant infrastructure and environmental pressures, despite ambitious attempts by the state to handle growth in a more coordinated manner. Melaka State has responded by seeking international funds and expertise to reposition its trajectory toward smart, green, and sustainable growth. The state has also collaborated with central and city governments and businesses to share best practice and drive further benefits through coordination. Innovative tools to assess green targets could potentially be used to track performance and build targeted solutions but
2 100 Resilient Cities will cease operations in July 2019 (Flavelle 2019), making Melaka’s participation in GPSC ever more important for capacity development and knowledge sharing.
require wider adoption. However, the state’s limited influence over funding for projects limits opportunities for a long-term integrated approach. The state is still responding to a growing list of environmental challenges in key areas.
Solid waste management: Investments have been made to improve future capacity for processing waste through recycling at source, material recovery facilities, incineration, and elimination of landfill waste. However, there is concern that current waste exceeds landfill capacity, and that there isn’t a clear strategy to reduce consumer waste or compost organic waste.
Water management: Melaka State has 100 percent access to piped water and has plans to reduce consumption and distribution losses. Highly subsidized tariffs limit the incentive for behavior change, and aging infrastructure and water pollution present significant risks.
Energy and greenhouse gases (GHG): Melaka has ambitious targets for implementing renewable energy and reducing GHG in the transport sector, responsible for 29.8 percent of total GHG emissions (ICLEI 2016). However, cheap energy prices and a lack of a clear framework to assess integration limit the adoption of renewables.
Climate change and resilience: Melaka is Malaysia’s only representative in the 100 Resilient Cities network.2 This membership increases local resilience capacity while providing access to a network of cities responding to related challenges. Coordinating local and state-level priorities with integrated administration and coordination could further strengthen Melaka’s climate resilience.
Recommended actions to improve sustainability:
2-A Identify a clear champion of each priority project and strategic objective. Identifying ownership of such targets will enable a greater focus on performance assessment and ultimately on budget allocations, in turn enabling more effective implementation.
2-B Optimize existing knowledge sharing and technical leadership arrangements with peer cities and partners. Through better coordination—both internally and externally—
10 / Sustainability Outlook Diagnostic—Overview Report
the state will be able to identify critical pathways to ensure outcomes in line with its sustainability objectives.
2-C Develop clear performance guidelines for water management in buildings and urban areas. Water management and efficiency awareness programs should be launched, including water pricing mechanisms and comparative water usage information, to encourage water use reduction.
2-D Harness environmental data and develop evidence-based targets that inform policy and track performance. Citizens should be included in policy making and implementation through public campaigns, surveys, and awareness programs about environmental protection, recycling, and sustainable water and energy consumption.
2-E Remove natural habitats prone to flooding from areas designated for future development. Policies could be enacted to strengthen the development controls of flood-prone areas. Improved maintenance regimes will reduce instances of flash floods.
2-F Raise public awareness regarding recycling and reuse through environmental protection programs. Special attention should be paid to organic waste, which in this case typically makes up around 60–70 percent of the total waste generated, and compositing and sorting facilities should be developed.
2-G Reduce GHG emissions by increasing use of renewable energy and encouraging energy efficiency. Melaka State should develop a concrete and reliable energy profile, determine energy targets for sustainable and clean energy, and help mobilize financing for energy efficiency and renewable programs.
Supporting Report 3: Enhancing Services and Housing
Key messages:
■ Achieve full coverage of basic services.
■ Continue focus on improving the housing market.
Widely sharing the benefits of Melaka’s stellar economic gains is a key component of urban sustainability. Melaka already has nearly a full provision of basic services throughout the state,
putting full coverage within reach, and 84 percent of Melaka’s households are owner-occupied (DOSM 2017a). While housing is generally considered affordable, particularly for apartments and terraced homes, the relative unaffordability of certain housing types for low-income earners requires greater investigation to identify potential future challenges. A long-term plan to improve sustainability and efficiency through densification and optimizing land-use and infrastructure planning will play a significant role in shaping the success of the built environment.
Recommended actions to improve sustainability:
3-A Increase accessibility of basic infrastructure to 100 percent coverage throughout Melaka State. This is achievable in the medium term by working with the community to identify areas and households where gaps prevail and to allocate resources toward basic infrastructure investment.
3-B Improve Melaka State’s housing data framework. An integrated housing data framework administered by the Melaka Housing Board in collaboration with other government departments and other relevant stakeholders would better inform the current housing schemes and policies of Melaka State.
3-C Integrate long-term housing considerations into planning processes. The housing strategy, which would complement the State Structure Plan 2035, should incorporate a comprehensive diagnostic of the current housing situation in Melaka State, a review of the policy framework, and an action plan to achieve long-term affordability.
3-D Promote housing supply diversification. To ensure a variety of affordable housing options that cater to increasingly diverse households, this strategy should include considerations such as promoting the development of smaller housing units and the densification and redevelopment of excess land on existing family lots.
3-E Deliver additional low-cost and affordable housing through private sector partnerships. Melaka should implement a mandatory land value capture scheme dedicated to affordable housing for sites that achieve significant land
10 / Sustainability Outlook Diagnostic—Overview Report MELAKA Pathway to Urban Sustainability / 11
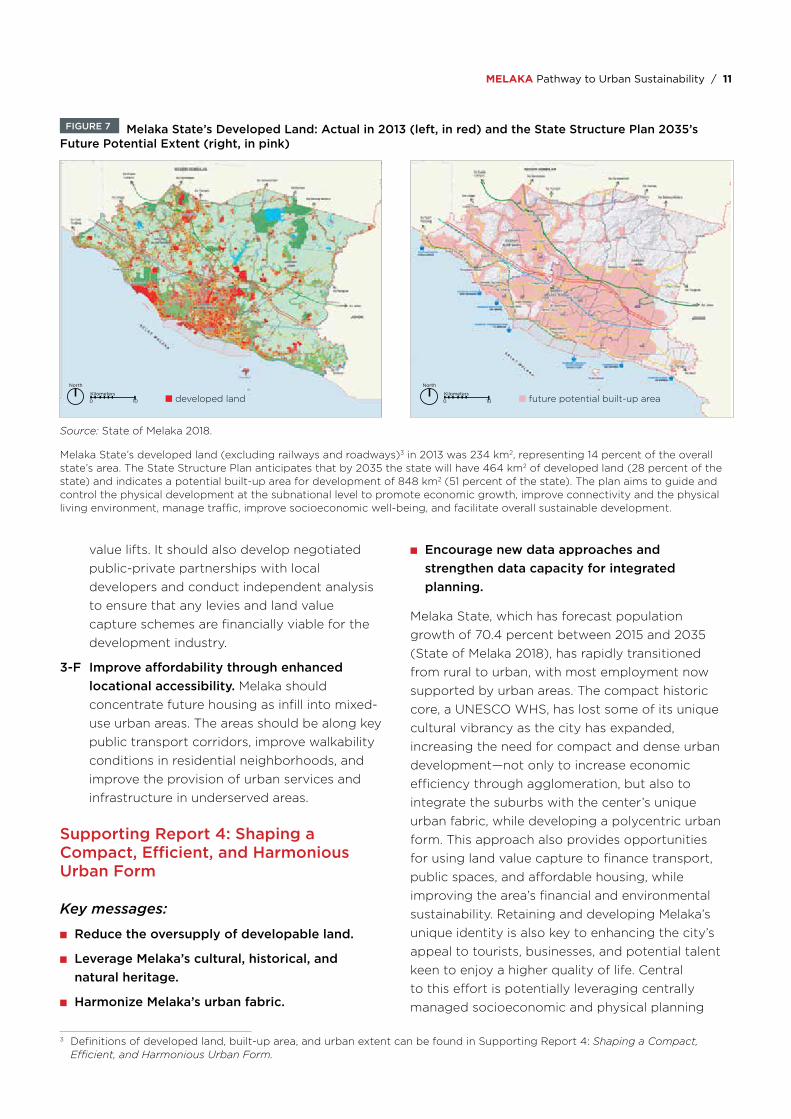
FIGURE 7 Melaka State’s Developed Land: Actual in 2013 (left, in red) and the State Structure Plan 2035’s Future Potential Extent (right, in pink)
Source: State of Melaka 2018.
Melaka State’s developed land (excluding railways and roadways)3 in 2013 was 234 km2, representing 14 percent of the overall state’s area. The State Structure Plan anticipates that by 2035 the state will have 464 km2 of developed land (28 percent of the state) and indicates a potential built-up area for development of 848 km2 (51 percent of the state). The plan aims to guide and control the physical development at the subnational level to promote economic growth, improve connectivity and the physical living environment, manage traffic, improve socioeconomic well-being, and facilitate overall sustainable development.
3 Definitions of developed land, built-up area, and urban extent can be found in Supporting Report 4: Shaping a Compact, Efficient, and Harmonious Urban Form.
value lifts. It should also develop negotiated public-private partnerships with local developers and conduct independent analysis to ensure that any levies and land value capture schemes are financially viable for the development industry.
3-F Improve affordability through enhanced locational accessibility. Melaka should concentrate future housing as infill into mixed-use urban areas. The areas should be along key public transport corridors, improve walkability conditions in residential neighborhoods, and improve the provision of urban services and infrastructure in underserved areas.
Supporting Report 4: Shaping a Compact, Efficient, and Harmonious Urban Form
Key messages:
■ Reduce the oversupply of developable land.
■ Leverage Melaka’s cultural, historical, and natural heritage.
■ Harmonize Melaka’s urban fabric.
■ Encourage new data approaches and strengthen data capacity for integrated planning.
Melaka State, which has forecast population growth of 70.4 percent between 2015 and 2035 (State of Melaka 2018), has rapidly transitioned from rural to urban, with most employment now supported by urban areas. The compact historic core, a UNESCO WHS, has lost some of its unique cultural vibrancy as the city has expanded, increasing the need for compact and dense urban development—not only to increase economic efficiency through agglomeration, but also to integrate the suburbs with the center’s unique urban fabric, while developing a polycentric urban form. This approach also provides opportunities for using land value capture to finance transport, public spaces, and affordable housing, while improving the area’s financial and environmental sustainability. Retaining and developing Melaka’s unique identity is also key to enhancing the city’s appeal to tourists, businesses, and potential talent keen to enjoy a higher quality of life. Central to this effort is potentially leveraging centrally managed socioeconomic and physical planning
100
Kilometers
North
100
Kilometers
North
100
Kilometers
North
100
Kilometers
North
■ developed land ■ future potential built-up area
12 / Sustainability Outlook Diagnostic—Overview Report
data to evaluate and monitor the performance of strategic objectives. One concern is the current and planned oversupply of land, which has led to low employment and residential densities, and which could be a major liability for economic efficiency, infrastructure costs, and climate resilience.
Recommended actions to improve sustainability:
4-A Incentivize higher-density, mixed-use, green, and compact developments with flexible land use regulations. Recalibrate incentives toward redevelopment and increasing density, rather than sprawl. Spatial development should focus on having a mix of compatible uses by integrating areas close to the city center with high-density, high–plot ratio, and fine-grained lot patterns.
4-B Shape a compact polycentric urban form and develop well-connected nodes. Melaka should prioritize integrating land use and transportation infrastructure planning by developing and connecting strong nodes with concentrated economic activity; new functions such as logistics, business, finance, and knowledge industries should be gradually developed in accordance with the city’s growth.
4-C Adopt a sustainable approach to conservation. Melaka is advised to put in place sustainable tourism measures in the WHS. Cultural sustainability principles should also be used to evaluate development interventions within the site.
4-D Increase livability with a more vibrant public realm. Melaka needs to develop animated streets beyond the restricted perimeter of the heritage zone, based on the same principles of the scaled down, traditional streets. Bringing residents closer to parks, water bodies, and waterways will cater to a wide spectrum of social and recreational needs.
4-E Pursue a more harmonious urban fabric by applying sustainability and historical urban landscape principles to development. Melaka’s harmonious urban fabric should be compact, integrated, connected, and diversified to promote diverse neighborhoods, optimize land use, and reduce car dependency.
4-F Address data gaps with alternative data sources and partnerships. Melaka should assess the feasibility of using private proprietary data, including big data and data analytics from private service providers, to address key data gaps such as private transportation patterns, retail spending, housing prices, air and water quality, and public space use.
4-G Increase data integration through cross-agency collaboration. Melaka should develop state-level data management and innovation capability for integrated planning, through the development of a specialized data expertise team and a roadmap, in consultation with all government units involved. The roadmap should identify key data gaps and develop an action plan to achieve cross-agency data integration.
4-H Encourage open source. Developing an open source policy roadmap will identify existing open source solutions for Melaka’s immediate and future data needs. Building in-house capability, including hiring an open source technical specialist and providing training and capacity to staff, will be needed.
4-I Embrace open data. Melaka is advised to identify which integrated planning data sets and information are suitable for public release, as part of the roadmap for data integration and the implementation of the open data policy. It should ideally create one integrated, systematically updated, open data website containing structured and ready-to-use data sets.
Supporting Report 5: Shifting Melaka’s Mobility Modal Split
Key messages:
■ Focus on public transport and green mobility strategies.
■ Enhance Melaka’s Walkability
Melaka’s rising wealth and its low-density, fragmented urban form result in high car dependency, congestion, and pollution. Some 90 percent of Melaka’s trips are estimated to be made using cars (ADB 2017). Ambitious targets for
12 / Sustainability Outlook Diagnostic—Overview Report MELAKA Pathway to Urban Sustainability / 13
reducing GHG emissions require a substantial mode shift to public transport and land use planning that results in better integration between where people live, learn, and work. However, public transport’s market share of around 1 percent necessitates substantial investment in quality, convenience, and availability of passenger information. A poor-quality pedestrian realm further discourages walking, while higher transport costs negatively impact accessibility in low-income groups.
Recommended actions to improve sustainability:
5-A Transform the public transportation industry. Melaka’s state-owned transport company, Panorama, has an estimated market share of around 1 percent. Panorama needs to be transformed into a modern and professional public transport company that is customer oriented, focused on growth, and efficiently managed to attract investment and funding.
5-B Integrate public transport into a comprehensive strategy for a regional economic corridor. The HSR link between Kuala Lumpur and Singapore, which is scheduled to become operational in 2031, has a station planned 15 kilometers from Melaka City. Melaka needs to integrate its public transportation network with a high-quality public transport corridor between the new HSR station and Melaka City. There is an urgent need to safeguard the corridor (ADB 2017).
5-C Adopt transit-oriented development strategies. Efficient land use through transit-oriented development strategies and compact growth will encourage high-density, mixed-use, and balanced development, with walkable streets and jobs close to homes. This approach will be vital to reducing private car use and increasing the financial viability of public transport.
FIGURE 8 Melaka Heritage Area’s Pedestrian Volume
Source: ADB 2017.
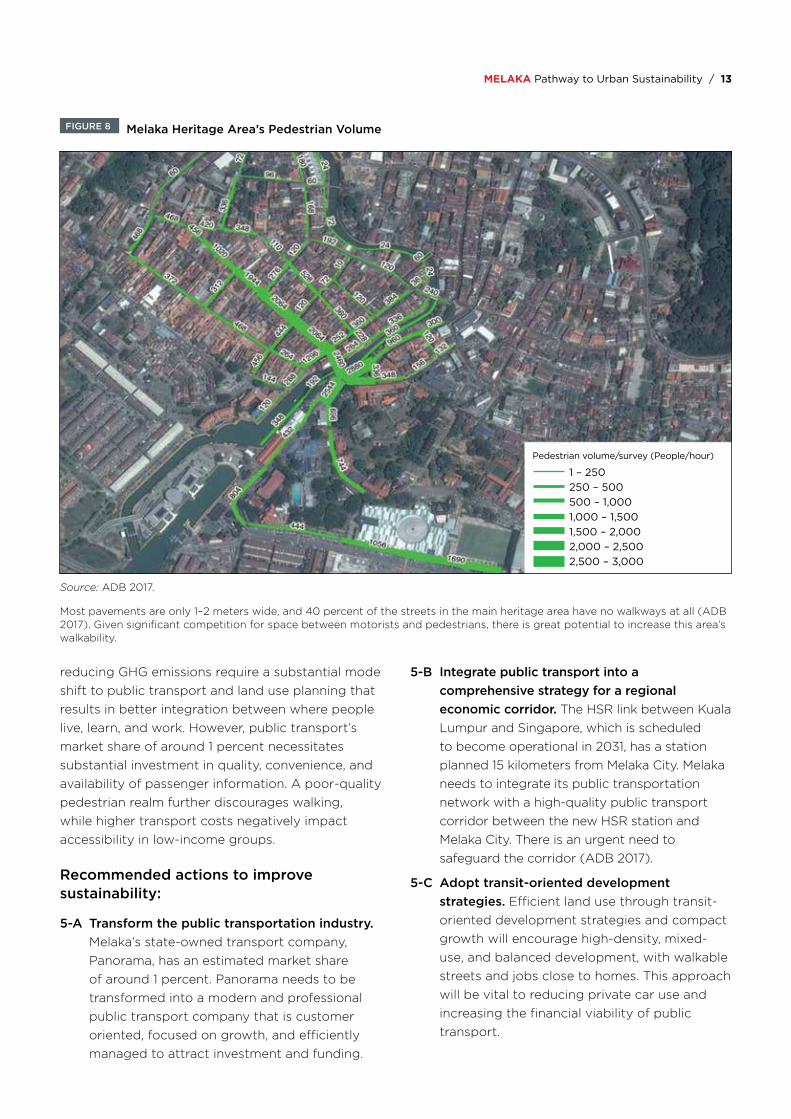
Most pavements are only 1–2 meters wide, and 40 percent of the streets in the main heritage area have no walkways at all (ADB 2017). Given significant competition for space between motorists and pedestrians, there is great potential to increase this area’s walkability.
Pedestrian volume/survey (People/hour)
1 – 250250 – 500500 – 1,0001,000 – 1,5001,500 – 2,0002,000 – 2,5002,500 – 3,000
14 / Sustainability Outlook Diagnostic—Overview Report
5-D Move toward a public transport modal share of 40 percent. Melaka should reduce growth in private vehicle usage by introducing travel demand management measures, such as controlling parking areas, reducing off-street parking, and assessing transport-related development contributions. In addition, Melaka needs to significantly improve passenger convenience on public buses.
5-E Enable walkability. Promoting walkability is a key element to making public space more vibrant, reducing traffic congestion, and stimulating the local commercial economy.
Supporting Report 6: Demonstrating Fiscal Sustainability
Key message:
■ Demonstrate overall fiscal sustainability.
Melaka requires federal transfers to meet its capital expenditure. Diversifying to market-based financing may increase the capacity to shape and deliver on investment priorities; however, neither the state nor the city has a credit rating, limiting this potential. A general reduction in federal transfers and tax receipts at state level, with the state’s total revenue decreasing by 18 percent from 2012 to 2015 (State Government of Melaka 2014, 2015, 2016), along with regular budget deficits, may indicate the state’s risk of being unable to fund urban infrastructure in the future. The revenue decrease was notably during a period of strong population growth. As Melaka State shares infrastructure between several districts and municipalities, Melaka City was also assessed, given the impact it has on the state’s wider fiscal sustainability. The city has responded to its own fiscal challenges by selling assets, which makes it harder for the city’s revenue structure to gain from future urban growth and development. Debt financing is seldom used at local or state levels. If adequate sustainable infrastructure is to be developed at a pace that is consistent with Melaka State’s rapid growth, current legal and regulatory restrictions on the use of long-term debt or PPPs must be overcome, and participation of Malaysian sources of finance, including capital markets, should be catalyzed.
Recommended actions to improve sustainability:
6-A/E State and city: Obtain a shadow credit rating. Both Melaka State and Melaka City should obtain a shadow credit rating on the Malaysian national scale to demonstrate their degree of fiscal sustainability and creditworthiness. This rating would be kept confidential within the government and could help the state identity and implement financial management improvements.
6-B/F State and city: Improve debt management. Both Melaka State and Melaka City should establish written policies and procedures to improve their debt management processes.
6-C State: Undertake a concerted effort to increase own-source revenue. Melaka State should determine if its billing and collection efforts are performing efficiently and if existing revenue streams can be revalued or potential new revenue sources should be introduced.
6-D State: Achieve a reliable operating margin surplus. This requires a combination of increasing own-source recurrent revenues and slowing the growth in operating expenditures as much as possible.
6-G City: Work closely with Melaka State to prepare the city’s own multiyear capital investment plan. This should include a financing plan that identifies market-based and governmental sources of capital for the city’s projects.
6-H City: Substantially increase recurrent own-source revenues and reduce reliance on non-recurrent revenue. Negotiate with Melaka State on ways to make the city property tax more responsive to changes in property values and ways to reduce the city’s heavy dependence on the property tax.
6-I City: Return to maintaining an operating margin surplus. Increase the growth in the city’s operating revenue to a rate that exceeds the growth in operating expenditures.
14 / Sustainability Outlook Diagnostic—Overview Report
“Mel
acca
.” P
hoto
: Ole
h S
lob
od
eniu
k.
16 / Sustainability Outlook Diagnostic—Overview Report
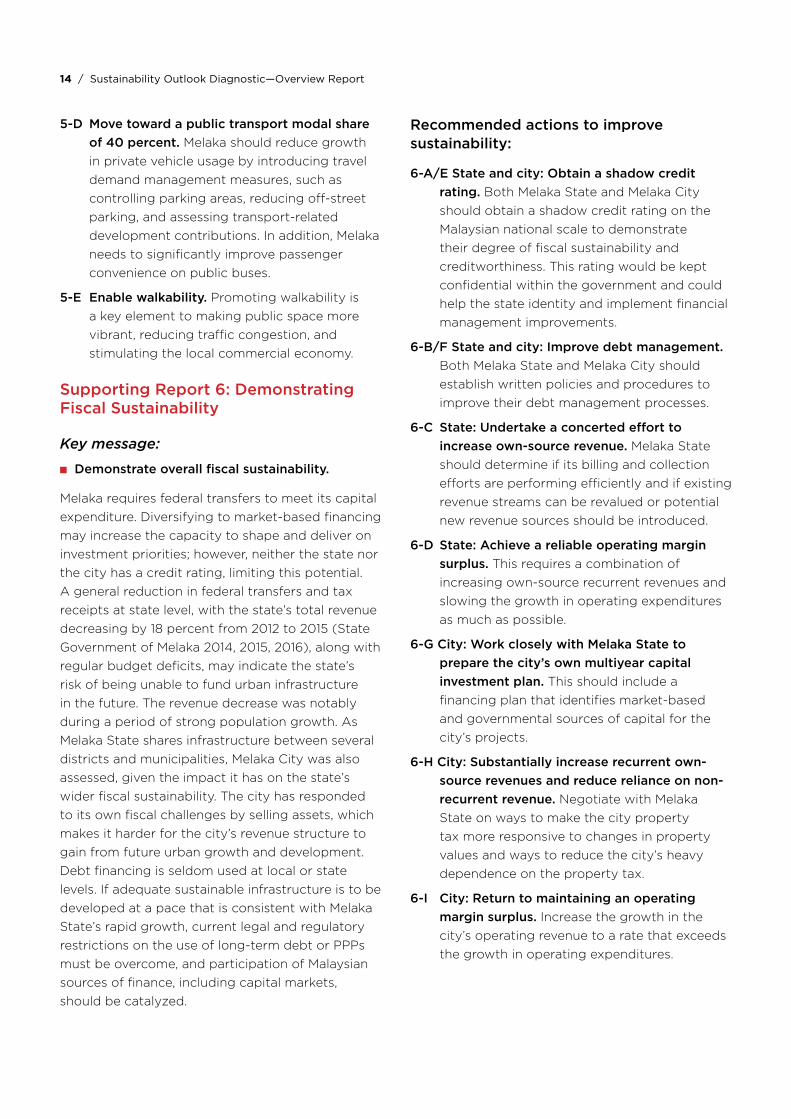
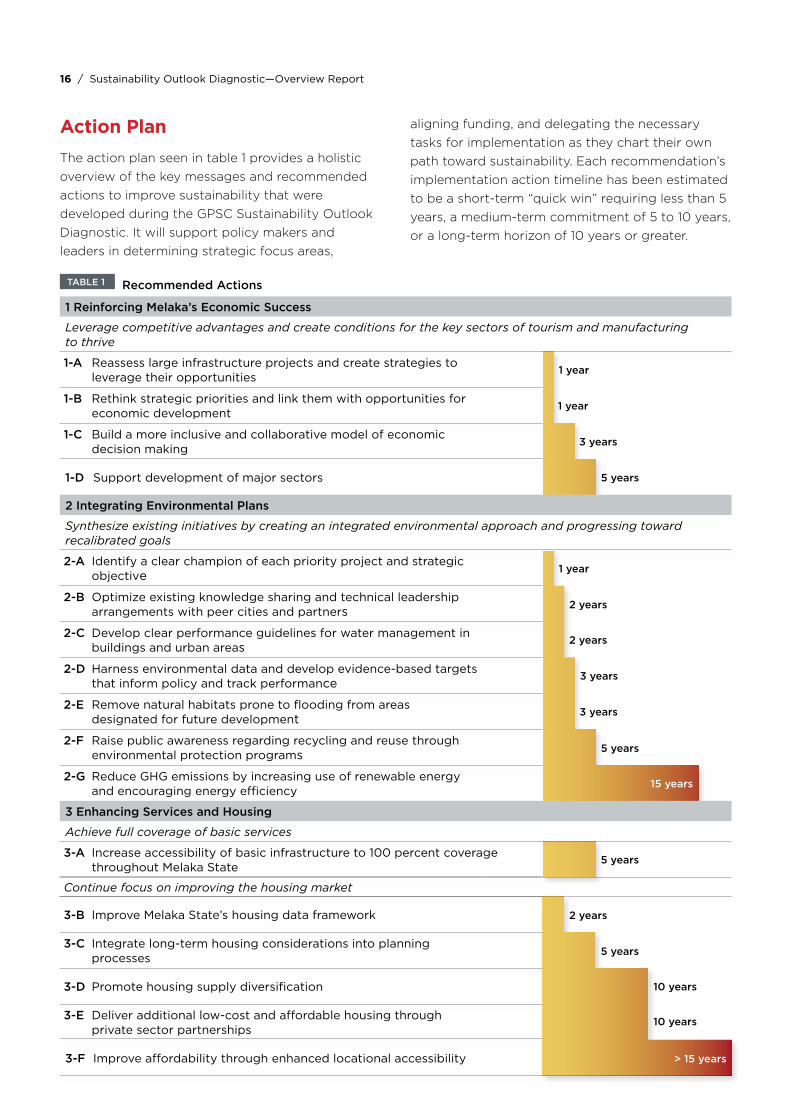
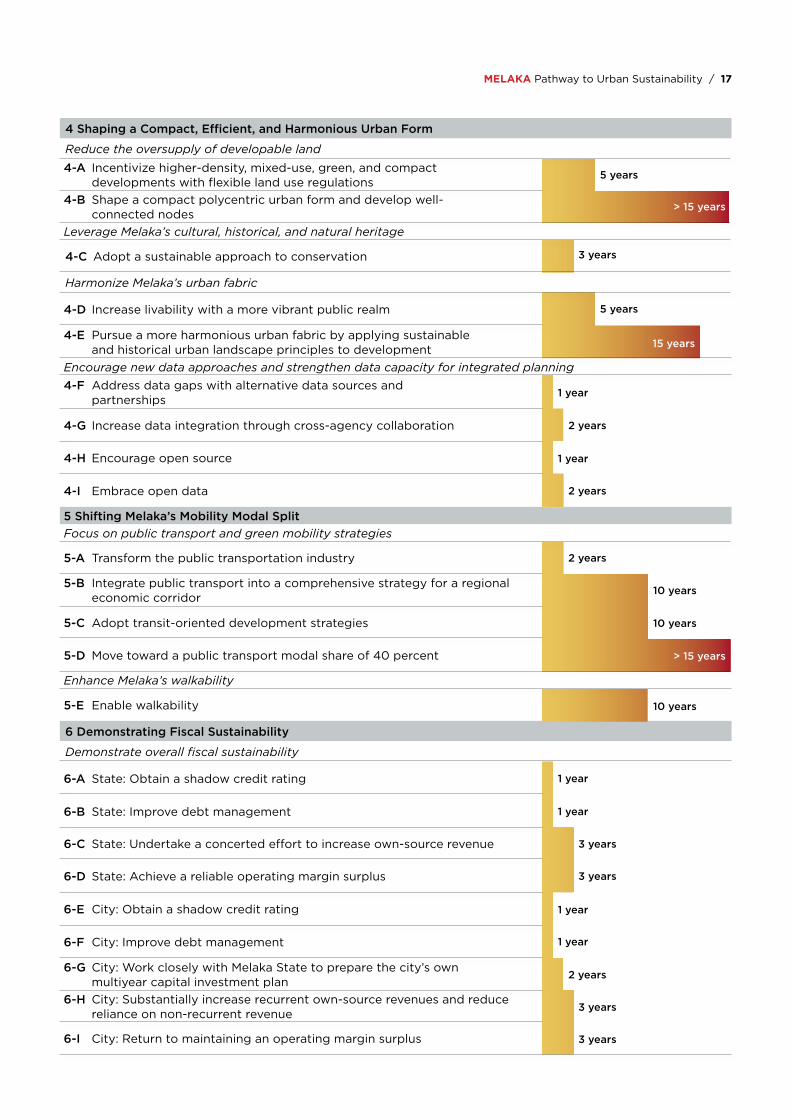
Action PlanThe action plan seen in table 1 provides a holistic overview of the key messages and recommended actions to improve sustainability that were developed during the GPSC Sustainability Outlook Diagnostic. It will support policy makers and leaders in determining strategic focus areas,
aligning funding, and delegating the necessary tasks for implementation as they chart their own path toward sustainability. Each recommendation’s implementation action timeline has been estimated to be a short-term “quick win” requiring less than 5 years, a medium-term commitment of 5 to 10 years, or a long-term horizon of 10 years or greater.
1 Reinforcing Melaka’s Economic Success
Leverage competitive advantages and create conditions for the key sectors of tourism and manufacturing to thrive
1-A Reassess large infrastructure projects and create strategies to leverage their opportunities
1-B Rethink strategic priorities and link them with opportunities for economic development
1-C Build a more inclusive and collaborative model of economic decision making
1-D Support development of major sectors
2 Integrating Environmental Plans
Synthesize existing initiatives by creating an integrated environmental approach and progressing toward recalibrated goals
2-A Identify a clear champion of each priority project and strategic objective
2-B Optimize existing knowledge sharing and technical leadership arrangements with peer cities and partners
2-C Develop clear performance guidelines for water management in buildings and urban areas
2-D Harness environmental data and develop evidence-based targets that inform policy and track performance
2-E Remove natural habitats prone to flooding from areas designated for future development
2-F Raise public awareness regarding recycling and reuse through environmental protection programs
2-G Reduce GHG emissions by increasing use of renewable energy and encouraging energy efficiency
3 Enhancing Services and Housing
Achieve full coverage of basic services
3-A Increase accessibility of basic infrastructure to 100 percent coverage throughout Melaka State
Continue focus on improving the housing market
3-B Improve Melaka State’s housing data framework
3-C Integrate long-term housing considerations into planning processes
3-D Promote housing supply diversification
3-E Deliver additional low-cost and affordable housing through private sector partnerships
3-F Improve affordability through enhanced locational accessibility
TABLE 1 Recommended Actions
2 years
2 years
2 years
1 year
3 years
5 years
1 year
1 year
5 years
5 years
15 years
5 years
3 years
3 years
10 years
10 years
> 15 years
16 / Sustainability Outlook Diagnostic—Overview Report MELAKA Pathway to Urban Sustainability / 17
4 Shaping a Compact, Efficient, and Harmonious Urban Form
Reduce the oversupply of developable land
4-A Incentivize higher-density, mixed-use, green, and compact developments with flexible land use regulations
4-B Shape a compact polycentric urban form and develop well-connected nodes
Leverage Melaka’s cultural, historical, and natural heritage
4-C Adopt a sustainable approach to conservation
Harmonize Melaka’s urban fabric
4-D Increase livability with a more vibrant public realm
4-E Pursue a more harmonious urban fabric by applying sustainable and historical urban landscape principles to development
Encourage new data approaches and strengthen data capacity for integrated planning 2 year4-F Address data gaps with alternative data sources and
partnerships
4-G Increase data integration through cross-agency collaboration
4-H Encourage open source
4-I Embrace open data
5 Shifting Melaka’s Mobility Modal SplitFocus on public transport and green mobility strategies
5-A Transform the public transportation industry
5-B Integrate public transport into a comprehensive strategy for a regional economic corridor
5-C Adopt transit-oriented development strategies
5-D Move toward a public transport modal share of 40 percent
Enhance Melaka’s walkability
5-E Enable walkability
6 Demonstrating Fiscal Sustainability
Demonstrate overall fiscal sustainability
6-A State: Obtain a shadow credit rating
6-B State: Improve debt management
6-C State: Undertake a concerted effort to increase own-source revenue
6-D State: Achieve a reliable operating margin surplus
6-E City: Obtain a shadow credit rating
6-F City: Improve debt management
6-G City: Work closely with Melaka State to prepare the city’s own multiyear capital investment plan
6-H City: Substantially increase recurrent own-source revenues and reduce reliance on non-recurrent revenue
6-I City: Return to maintaining an operating margin surplus
1 year
1 year
1 year
1 year
2 years
2 years
2 years
5 years
5 years
2 years
10 years
10 years
10 years
> 15 years
3 years
3 years
3 years
3 years
15 years
> 15 years
3 years
1 year
1 year

18 / Sustainability Outlook Diagnostic—Overview Report
“Rep
lica
of
a 16
th c
entu
ry P
ort
ugue
se g
alle
on
in t
he S
amud
era
Mar
itim
e M
useu
m in
Mel
acca
.” P
hoto
: Cha
rlie
Tong
.
18 / Sustainability Outlook Diagnostic—Overview Report MELAKA Pathway to Urban Sustainability / 19
ConclusionMelaka State has taken significant steps toward
achieving urban sustainability, including partnering
with international organizations and becoming an
active member of GPSC when the platform was
launched in 2016 to promote knowledge exchange.
Fulfilling its aspirations, however, requires further
bold steps as the area rich in history grapples with
contemporary urban challenges. These include
retaining key areas of economic competitiveness
to support continued growth, developing a more
efficient urban form to unlock economic, social,
and environmental gains, and increasing fiscal
sustainability to meet future growth needs.
The state government has shown leadership in
several recent initiatives guiding its development
strategies. GPSC's Sustainability Outlook
Diagnostic, developed in partnership with UNIDO
and MIGHT, highlights the importance of leveraging
the state’s opportunities and developing an
integrated approach to its urban sustainability
challenges going forward. Using it to inform the
next update to the State Structure Plan will help
the state chart a path toward sustainability.
An integrated approach that coordinates growth at the state, municipality, and community levels, and that leverages centrally managed socioeconomic and physical planning data to evaluate and monitor the performance of strategic objectives, is key to achieving Melaka’s goals. As the assessment highlighted, an integrated approach is also by nature iterative, requiring regular review and updating as new information becomes available. This will enable Melaka State to reinforce its economic success, integrate environmental plans, consolidate housing and services, shape a more efficient urban form, shift mobility to walking and public transport, and demonstrate fiscal sustainability. Ultimately, the future sustainability of Melaka State is strongly connected with the sustainability of its urban form. Melaka’s challenges are not necessarily unique, which means it can benefit from the wider GPSC network of cities. But thanks to its geographical advantages and vibrant historic center, it is uniquely positioned to provide leadership as it defines its sustainability credentials. The future steps taken by Melaka will very likely confirm its singular importance in the global dialogue around the sustainability of our shared urban future.
20 / Sustainability Outlook Diagnostic—Overview Report
“Mel
aka
city
vie
w f
rom
th
e M
enar
a Ta
min
g S
ari T
ow
er.”
Ph
oto
: jya
pa.
20 / Sustainability Outlook Diagnostic—Overview Report MELAKA Pathway to Urban Sustainability / 21
Benchmarking Melaka’s Urban Sustainability
BackgroundThe Urban Sustainability Framework (USF) (GPSC, World Bank 2018) was created by GPSC to build a common understanding of sustainability within an urban context and provide practical guidance to cities on how to pursue such sustainability through integrated approaches.
To assist Melaka State in understanding its level of urban sustainability, the USF was operationalized by developing specific metrics to evaluate local policies on sustainable urban development. The objective of these metrics is to enable city governments around the world to learn more about the policy initiatives that peer cities are undertaking. They can also help cities track their own progress in creating policies to promote sustainable urban development.
The benchmarking was researched by the Economist Intelligence Unit (EIU) from a set of key indicators found in the USF. The benchmarking focuses exclusively on policy inputs (rather than outputs), as these are areas where policy makers can implement changes in measurable and tangible ways. Policy inputs that are part of the benchmarking include an analysis of strategies, programs, regulations, and institutions that governments should consider to promote integrated urban development. As part of this pilot project, the benchmarking identified cities along a policy development continuum that serves as a roadmap for sustainable urban planning.
22 / Sustainability Outlook Diagnostic—Overview Report
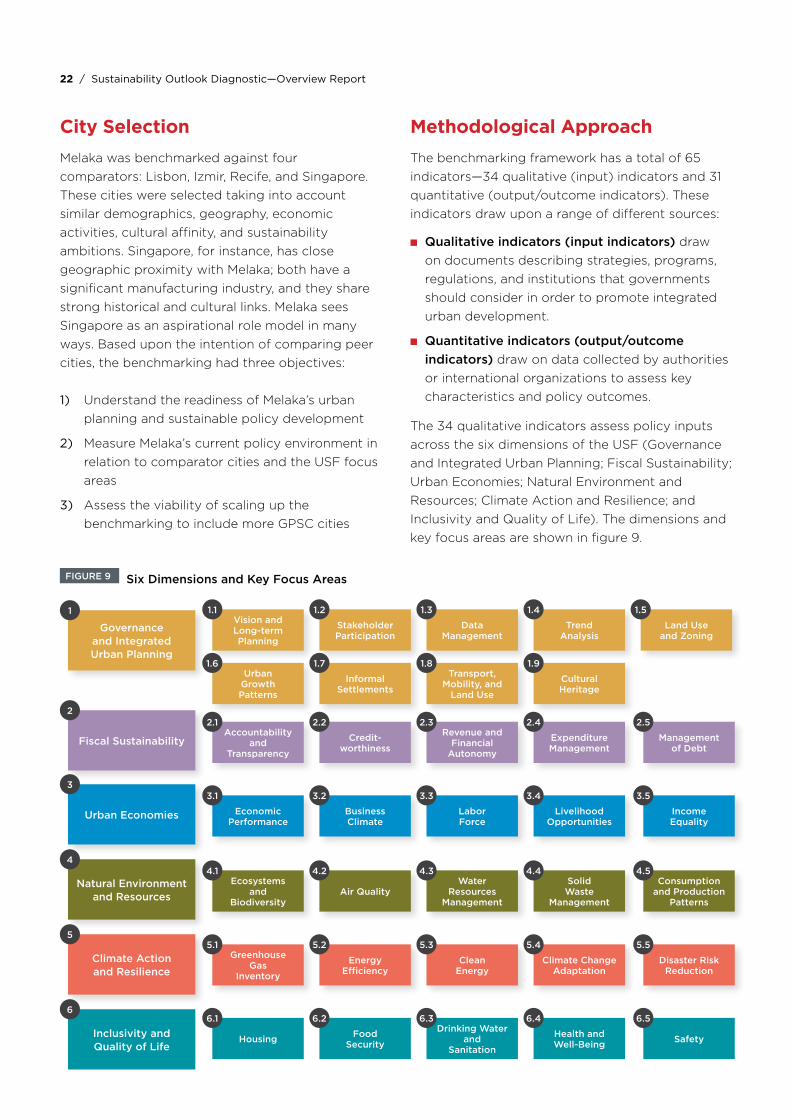
FIGURE 9 Six Dimensions and Key Focus Areas
City SelectionMelaka was benchmarked against four comparators: Lisbon, Izmir, Recife, and Singapore. These cities were selected taking into account similar demographics, geography, economic activities, cultural affinity, and sustainability ambitions. Singapore, for instance, has close geographic proximity with Melaka; both have a significant manufacturing industry, and they share strong historical and cultural links. Melaka sees Singapore as an aspirational role model in many ways. Based upon the intention of comparing peer cities, the benchmarking had three objectives:
1) Understand the readiness of Melaka’s urban planning and sustainable policy development
2) Measure Melaka’s current policy environment in relation to comparator cities and the USF focus areas
3) Assess the viability of scaling up the benchmarking to include more GPSC cities
Methodological ApproachThe benchmarking framework has a total of 65 indicators—34 qualitative (input) indicators and 31 quantitative (output/outcome indicators). These indicators draw upon a range of different sources:
■ Qualitative indicators (input indicators) draw on documents describing strategies, programs, regulations, and institutions that governments should consider in order to promote integrated urban development.
■ Quantitative indicators (output/outcome indicators) draw on data collected by authorities or international organizations to assess key characteristics and policy outcomes.
The 34 qualitative indicators assess policy inputs across the six dimensions of the USF (Governance and Integrated Urban Planning; Fiscal Sustainability; Urban Economies; Natural Environment and Resources; Climate Action and Resilience; and Inclusivity and Quality of Life). The dimensions and key focus areas are shown in figure 9.
Governance and Integrated Urban Planning
Vision and Long-term Planning
Stakeholder Participation
DataManagement
TrendAnalysis
Land Use and Zoning
UrbanGrowthPatterns
Accountabilityand
Transparency
Economic Performance
Ecosystems and
Biodiversity
Greenhouse Gas
Inventory
Housing
Informal Settlements
Credit-worthiness
BusinessClimate
Air Quality
EnergyEfficiency
FoodSecurity
Transport, Mobility, and
Land Use
Revenue and Financial
Autonomy
LaborForce
Water Resources
Management
CleanEnergy
Drinking Waterand
Sanitation
CulturalHeritage
ExpenditureManagement
LivelihoodOpportunities
SolidWaste
Management
Climate Change Adaptation
Health andWell-Being
IncomeEquality
Consumption and Production
Patterns
Disaster Risk Reduction
Safety
Managementof Debt
Fiscal Sustainability
Urban Economies
Natural Environment and Resources
Climate Action and Resilience
Inclusivity and Quality of Life
1 1.1 1.2 1.3 1.4 1.5
1.6
2.1
3.1
4.1
5.1
6.1
1.7
2.2
3.2
4.2
5.2
6.2
1.8
2.3
3.3
4.3
5.3
6.3
1.9
2.4
3.4
4.4
5.4
6.4
3.5
4.5
5.5
6.5
2.52
3
4
5
6
22 / Sustainability Outlook Diagnostic—Overview Report MELAKA Pathway to Urban Sustainability / 23
To score the qualitative indicators, policy questions were created based upon three guiding principles:
1) Objectivity. Qualitative research and benchmarking must rely on tangible evidence. This allows for consistency across large samples and minimizes the risk for interpretation biases.
2) Precision. One question should measure one concept. To achieve this, the streamlined framework adopts a binary (yes/no) scoring system, including qualitative justifications and references to allow for traceability.
3) Comprehensiveness. Questions selected are evenly spread across the dimensions and the focus areas of the USF. This allows the framework to retain the original structure developed by the GPSC while allowing for a focused and repeatable assessment.
Quantitative indicators were collected to inform an assessment of data availability (see annex B for a full list of the indicators). Where data was not directly collected by the government, “n.a.” was inputted into the benchmarking background data and supplemented by a note detailing the nature of data limitations and alternative sources.
Scoring
The 34 qualitative (input) indicators across five cities were scored on a scale of zero to two. A score of zero was assigned to cities where no evidence or negative evidence was available. A score of one was assigned to cities where there was some evidence of a policy, strategy, and/or program, but this evidence was limited or outdated. A score of two was assigned to cities where evidence was encompassing and had been updated in the past five years.
Twenty in-depth interviews with local experts and authorities across five cities were conducted as part of this assessment. Interviews were complemented with secondary research and analysis of laws, strategies and plans, EIU’s proprietary data, academic studies, websites of government authorities and international organizations, websites of industry associations, and local and international news and media reports.
To ensure that scores were properly justified and consistent across all countries, each qualitative score was reviewed, scores were calibrated, and cross-country comparisons were conducted. Consequently, scores are best understood by reading both the scoring criteria and the written justifications provided for each indicator found in the accompanying Excel dashboard. An example score card is seen in figure 10.
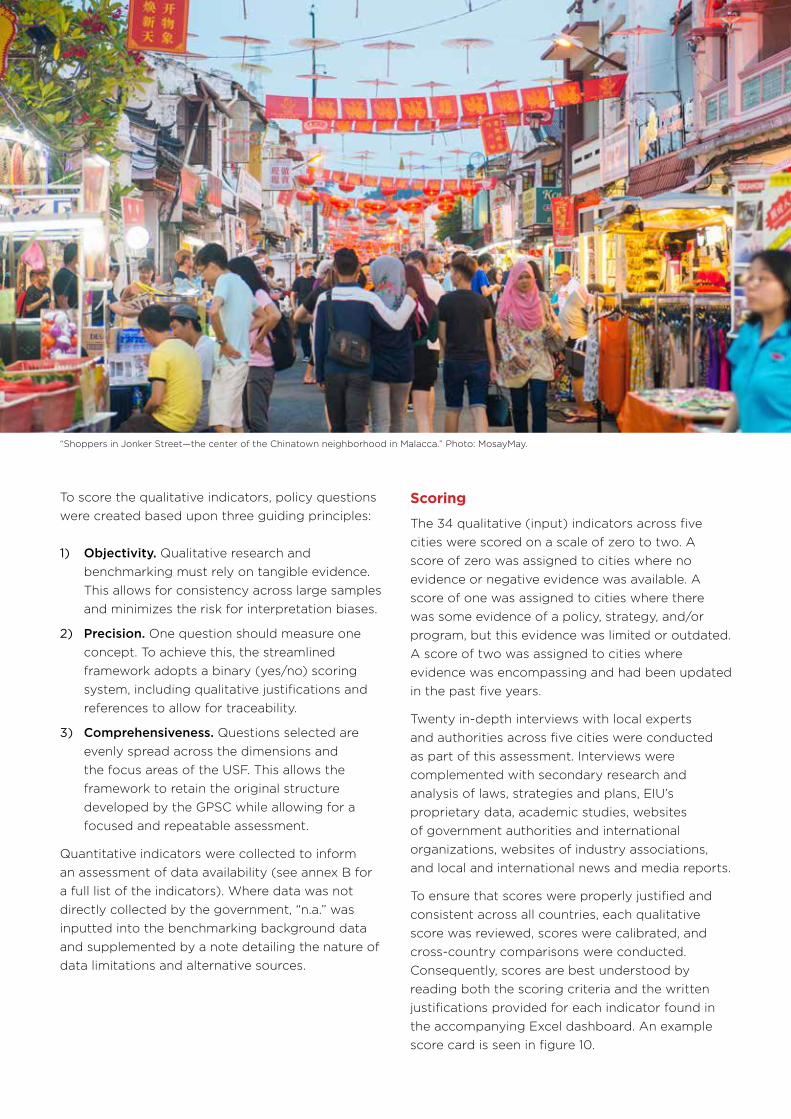
“Shoppers in Jonker Street—the center of the Chinatown neighborhood in Malacca.” Photo: MosayMay.
24 / Sustainability Outlook Diagnostic—Overview Report
Normalization and Weights
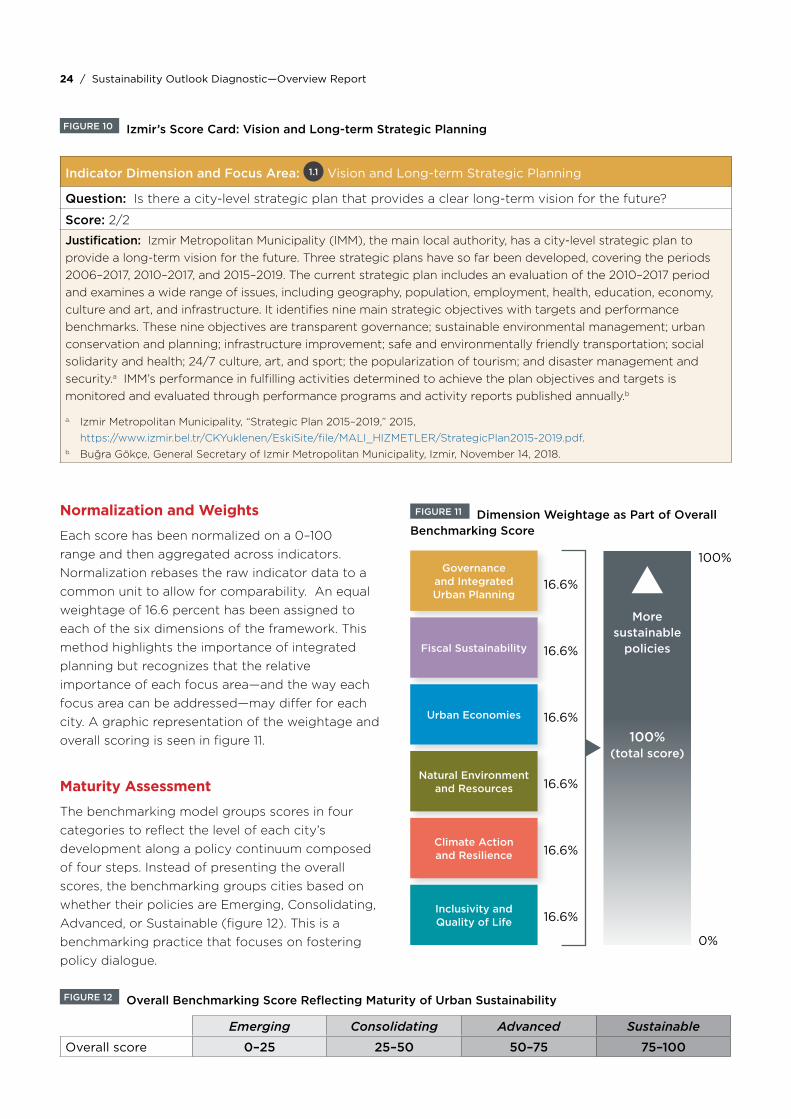
Each score has been normalized on a 0–100 range and then aggregated across indicators. Normalization rebases the raw indicator data to a common unit to allow for comparability. An equal weightage of 16.6 percent has been assigned to each of the six dimensions of the framework. This method highlights the importance of integrated planning but recognizes that the relative importance of each focus area—and the way each focus area can be addressed—may differ for each city. A graphic representation of the weightage and overall scoring is seen in figure 11.
Maturity Assessment
The benchmarking model groups scores in four categories to reflect the level of each city’s development along a policy continuum composed of four steps. Instead of presenting the overall scores, the benchmarking groups cities based on whether their policies are Emerging, Consolidating, Advanced, or Sustainable (figure 12). This is a benchmarking practice that focuses on fostering policy dialogue.
FIGURE 11 Dimension Weightage as Part of Overall Benchmarking Score
FIGURE 10 Izmir’s Score Card: Vision and Long-term Strategic Planning
Indicator Dimension and Focus Area: 1.1 Vision and Long-term Strategic Planning
Question: Is there a city-level strategic plan that provides a clear long-term vision for the future?
Score: 2/2
Justification: Izmir Metropolitan Municipality (IMM), the main local authority, has a city-level strategic plan to provide a long-term vision for the future. Three strategic plans have so far been developed, covering the periods 2006–2017, 2010–2017, and 2015–2019. The current strategic plan includes an evaluation of the 2010–2017 period and examines a wide range of issues, including geography, population, employment, health, education, economy, culture and art, and infrastructure. It identifies nine main strategic objectives with targets and performance benchmarks. These nine objectives are transparent governance; sustainable environmental management; urban conservation and planning; infrastructure improvement; safe and environmentally friendly transportation; social solidarity and health; 24/7 culture, art, and sport; the popularization of tourism; and disaster management and security.a IMM’s performance in fulfilling activities determined to achieve the plan objectives and targets is monitored and evaluated through performance programs and activity reports published annually.b
a. Izmir Metropolitan Municipality, “Strategic Plan 2015–2019,” 2015,
https://www.izmir.bel.tr/CKYuklenen/EskiSite/file/MALI_HIZMETLER/StrategicPlan2015-2019.pdf. b. Buğra Gökçe, General Secretary of Izmir Metropolitan Municipality, Izmir, November 14, 2018.
Governance and Integrated Urban Planning
Fiscal Sustainability
Urban Economies
Natural Environment and Resources
Climate Action and Resilience
Inclusivity and Quality of Life
More sustainable
policies
100%(total score)
▲16.6%
100%
16.6%
16.6%
16.6%
16.6%
16.6%
0%
Emerging Consolidating Advanced Sustainable
Overall score 0–25 25–50 50–75 75–100
FIGURE 12 Overall Benchmarking Score Reflecting Maturity of Urban Sustainability
24 / Sustainability Outlook Diagnostic—Overview Report MELAKA Pathway to Urban Sustainability / 25
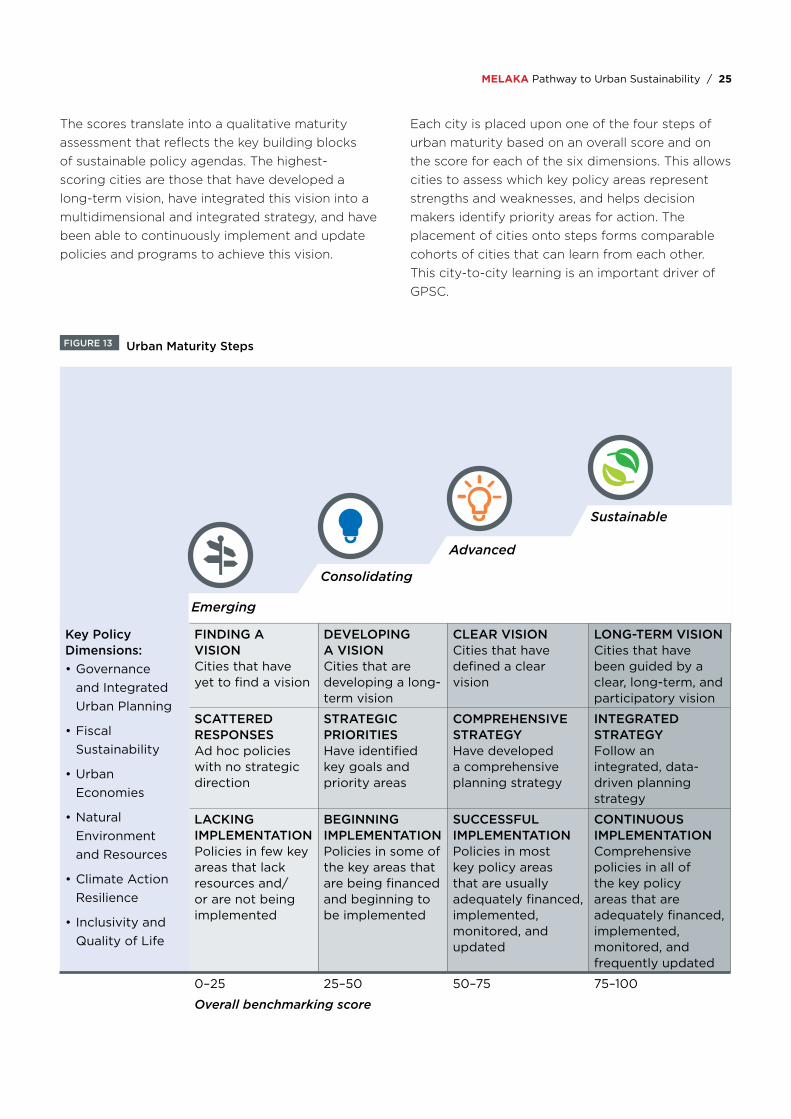
FIGURE 13 Urban Maturity Steps
The scores translate into a qualitative maturity assessment that reflects the key building blocks of sustainable policy agendas. The highest-scoring cities are those that have developed a long-term vision, have integrated this vision into a multidimensional and integrated strategy, and have been able to continuously implement and update policies and programs to achieve this vision.
Each city is placed upon one of the four steps of urban maturity based on an overall score and on the score for each of the six dimensions. This allows cities to assess which key policy areas represent strengths and weaknesses, and helps decision makers identify priority areas for action. The placement of cities onto steps forms comparable cohorts of cities that can learn from each other. This city-to-city learning is an important driver of GPSC.
Key Policy Dimensions:• Governance
and Integrated Urban Planning
• Fiscal Sustainability
• Urban Economies
• Natural Environment and Resources
• Climate Action Resilience
• Inclusivity and Quality of Life
FINDING A VISIONCities that have yet to find a vision
DEVELOPING A VISIONCities that are developing a long-term vision
CLEAR VISIONCities that have defined a clear vision
LONG-TERM VISIONCities that have been guided by a clear, long-term, and participatory vision
SCATTERED RESPONSESAd hoc policies with no strategic direction
STRATEGIC PRIORITIESHave identified key goals and priority areas
COMPREHENSIVE STRATEGY Have developed a comprehensive planning strategy
INTEGRATED STRATEGYFollow an integrated, data-driven planning strategy
LACKING IMPLEMENTATIONPolicies in few key areas that lack resources and/or are not being implemented
BEGINNING IMPLEMENTATIONPolicies in some of the key areas that are being financed and beginning to be implemented
SUCCESSFUL IMPLEMENTATIONPolicies in most key policy areas that are usually adequately financed, implemented, monitored, and updated
CONTINUOUS IMPLEMENTATIONComprehensive policies in all of the key policy areas that are adequately financed, implemented, monitored, and frequently updated
0–25 25–50 50–75 75–100
Overall benchmarking score
Emerging
Consolidating
Advanced
Sustainable
26 / Sustainability Outlook Diagnostic—Overview Report
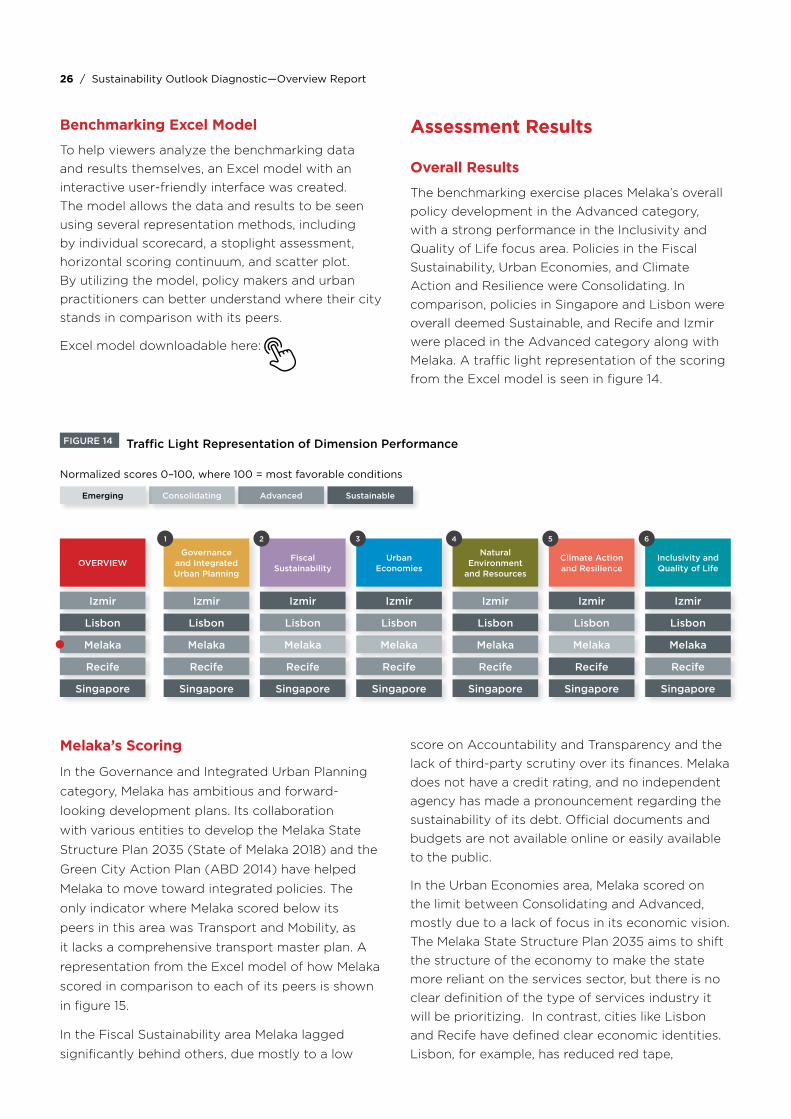
FIGURE 14 Traffic Light Representation of Dimension Performance
Benchmarking Excel Model
To help viewers analyze the benchmarking data and results themselves, an Excel model with an interactive user-friendly interface was created. The model allows the data and results to be seen using several representation methods, including by individual scorecard, a stoplight assessment, horizontal scoring continuum, and scatter plot. By utilizing the model, policy makers and urban practitioners can better understand where their city stands in comparison with its peers.
Excel model downloadable here:
Assessment Results
Overall Results
The benchmarking exercise places Melaka’s overall policy development in the Advanced category, with a strong performance in the Inclusivity and Quality of Life focus area. Policies in the Fiscal Sustainability, Urban Economies, and Climate Action and Resilience were Consolidating. In comparison, policies in Singapore and Lisbon were overall deemed Sustainable, and Recife and Izmir were placed in the Advanced category along with Melaka. A traffic light representation of the scoring from the Excel model is seen in figure 14.
OVERVIEW
Izmir
Melaka
Lisbon
Recife
Governance and Integrated Urban Planning
1
Izmir
Melaka
Lisbon
Recife
SingaporeSingapore
Fiscal Sustainability
2
Izmir
Melaka
Lisbon
Recife
Singapore
Urban Economies
3
Izmir
Melaka
Lisbon
Recife
Singapore
Natural Environment
and Resources
4
Izmir
Melaka
Lisbon
Recife
Singapore
Climate Action and Resilience
5
Izmir
Melaka
Lisbon
Recife
Singapore
Inclusivity and Quality of Life
6
Izmir
Melaka
Lisbon
Recife
Singapore
SustainableAdvancedConsolidatingEmerging
Normalized scores 0–100, where 100 = most favorable conditions
Melaka’s Scoring
In the Governance and Integrated Urban Planning
category, Melaka has ambitious and forward-
looking development plans. Its collaboration
with various entities to develop the Melaka State
Structure Plan 2035 (State of Melaka 2018) and the
Green City Action Plan (ABD 2014) have helped
Melaka to move toward integrated policies. The
only indicator where Melaka scored below its
peers in this area was Transport and Mobility, as
it lacks a comprehensive transport master plan. A
representation from the Excel model of how Melaka
scored in comparison to each of its peers is shown
in figure 15.
In the Fiscal Sustainability area Melaka lagged
significantly behind others, due mostly to a low
score on Accountability and Transparency and the lack of third-party scrutiny over its finances. Melaka does not have a credit rating, and no independent agency has made a pronouncement regarding the sustainability of its debt. Official documents and budgets are not available online or easily available to the public.
In the Urban Economies area, Melaka scored on the limit between Consolidating and Advanced, mostly due to a lack of focus in its economic vision. The Melaka State Structure Plan 2035 aims to shift the structure of the economy to make the state more reliant on the services sector, but there is no clear definition of the type of services industry it will be prioritizing. In contrast, cities like Lisbon and Recife have defined clear economic identities. Lisbon, for example, has reduced red tape,
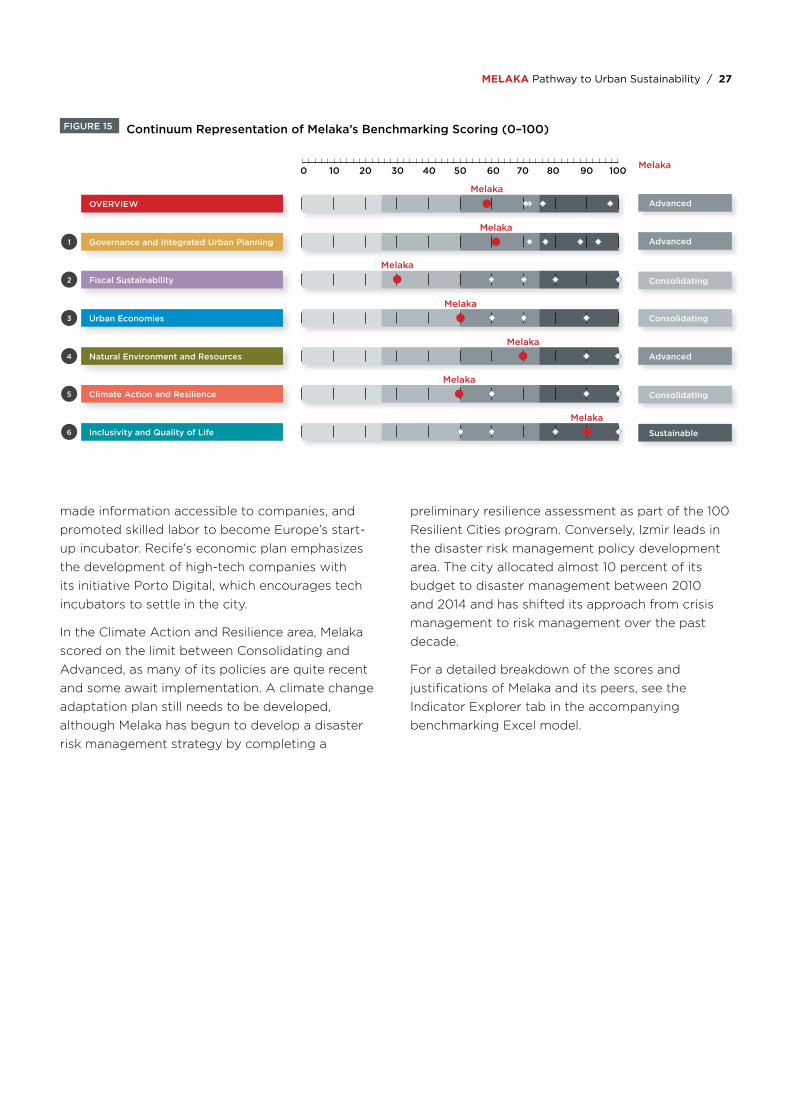
26 / Sustainability Outlook Diagnostic—Overview Report MELAKA Pathway to Urban Sustainability / 27
made information accessible to companies, and promoted skilled labor to become Europe’s start-up incubator. Recife’s economic plan emphasizes the development of high-tech companies with its initiative Porto Digital, which encourages tech incubators to settle in the city.
In the Climate Action and Resilience area, Melaka scored on the limit between Consolidating and Advanced, as many of its policies are quite recent and some await implementation. A climate change adaptation plan still needs to be developed, although Melaka has begun to develop a disaster risk management strategy by completing a
preliminary resilience assessment as part of the 100 Resilient Cities program. Conversely, Izmir leads in the disaster risk management policy development area. The city allocated almost 10 percent of its budget to disaster management between 2010 and 2014 and has shifted its approach from crisis management to risk management over the past decade.
For a detailed breakdown of the scores and justifications of Melaka and its peers, see the Indicator Explorer tab in the accompanying benchmarking Excel model.
FIGURE 15 Continuum Representation of Melaka’s Benchmarking Scoring (0–100)
AdvancedGovernance and Integrated Urban Planning1
Melaka
AdvancedOVERVIEW
Melaka
ConsolidatingFiscal Sustainability2
Melaka
AdvancedNatural Environment and Resources4
Melaka
SustainableInclusivity and Quality of Life6
Melaka
ConsolidatingUrban Economies3
Melaka
ConsolidatingClimate Action and Resilience5
Melaka
100 Melaka9080706050403020100
28 / Sustainability Outlook Diagnostic—Overview Report
ReferencesADB (Asian Development Bank). 2014. “Green City
Action Plan: A Framework for GrEEEN Actions: Melaka, Malaysia.” https://www.adb.org/sites/default/files/related/41571/imt-gt-green-city-action-plan-melaka-april-2014.pdf.
——. 2017. “Towards a Greener Transport System in Melaka.” Draft Version Report, October.
Flavelle, Christopher. 2019. “Rockefeller to Wind Down Biggest Private Climate Resilience Push.” Bloomberg, April 1. https://www.bloomberg.com/news/articles/2019-04-01/rockefeller-announces-end-of-major-climate-resilience-initiative.
DOSM (Department of Statistics Malaysia). 2011–2017. “Labour Force Survey Report 2011, 2012, 2013, 2014, 2015, 2016, 2017.”
——. 2017a. “Report on GDP for Melaka by Kind of Economic Activity, 2010–2016 at Constant 2010 Prices.”
——. 2019. “Melaka @ a Glance.” https://www.dosm.gov.my/v1/index.php?r=column/cone&menu_id=TmlOYTJZTEJJZXg5QUZQMUxrRVF-KUT09.
Evers, Hans-Dieter, and Solvay Gerke. 2006. “The Strategic Importance of the Straits of Malacca.” SSRN Electronic Journal. https://dx.doi.org/10.2139/ssrn.1020877.
GPSC (Global Platform for Sustainable Cities), World Bank. 2018. Urban Sustainability Framework. 1st ed. Washington, DC: World Bank. https://www.thegpsc.org/usf.
ICLEI. 2016. “Melaka State: Greenhouse Gas Emission Inventory Report 2013.” November.
Melaka Tourism Promotion Division [Bahagian Promosi Pelancongan Negeri Melaka]. 2015. “Data Asas Negeri Melaka 2015 [Melaka Basic Data 2015].” https://www.melaka.gov.my/ms/kerajaan/jabatan-ketua-menteri-melaka/sektor-pembangunan/bahagian-promosi-pelancongan-bpp.
National Archives of Malaysia. 2018. “Declaration of Independence of Malaya.” http://www.arkib.gov.my/en/web/guest/pengisytiharan-kemerdekaan-tanah-melayu.
Oxford Economics Database. 2017.
State Government of Melaka. 2014. “Audited Financial Statement 2013.” Melaka, Malaysia: State Government of Melaka.
——. 2015. “Audited Financial Statement 2014.” Melaka, Malaysia: State Government of Melaka.
——. 2016. “Audited Financial Statement 2015.” Melaka, Malaysia: State Government of Melaka.
State of Melaka. 2018. “Melaka State Structure Plan 2035.”
Tourism Malaysia. 2015. Annual Report. https://www.tourism.gov.my/activities/view/tourism-malaysia-2015-annual-report.

28 / Sustainability Outlook Diagnostic—Overview Report
“Men
ara
Tam
ing
Sar
i To
wer
, Ban
dar
Hili
r, M
elac
ca.”
Pho
to: C
harl
ieTo
ng.
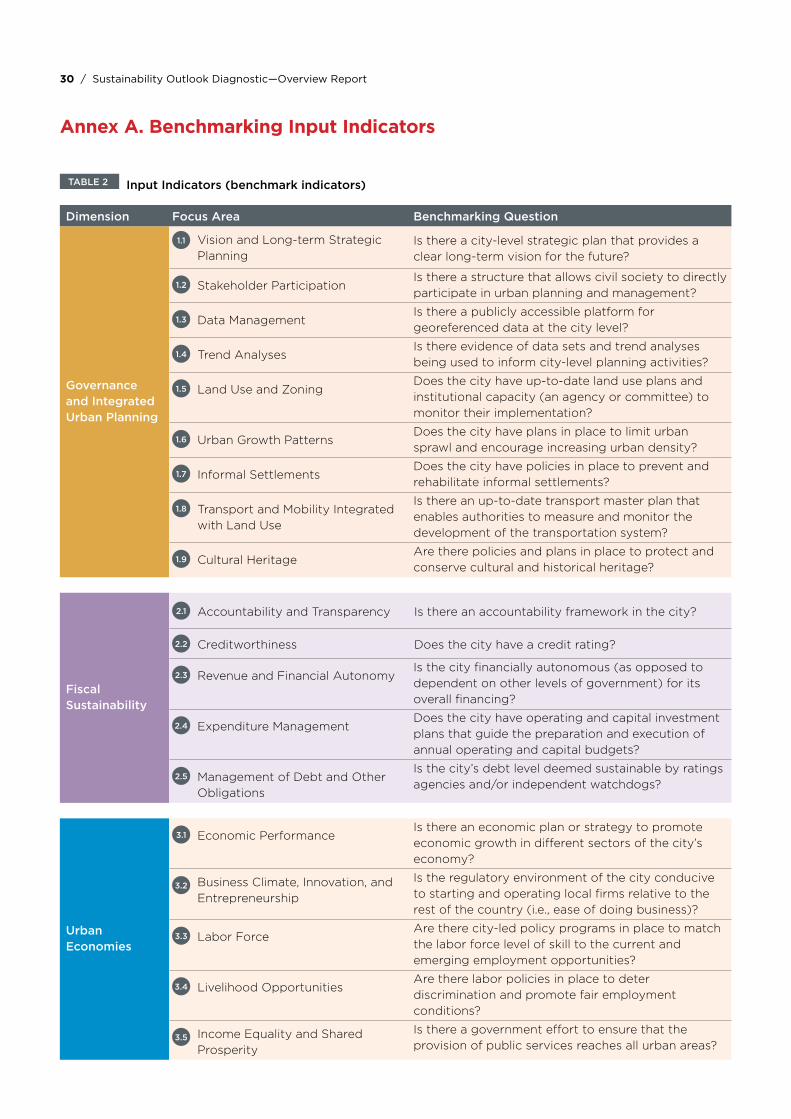
30 / Sustainability Outlook Diagnostic—Overview Report
Annex A. Benchmarking Input Indicators
TABLE 2 Input Indicators (benchmark indicators)
Dimension Focus Area Benchmarking Question
Governance and Integrated Urban Planning
1.1 Vision and Long-term Strategic Planning
Is there a city-level strategic plan that provides a clear long-term vision for the future?
1.2 Stakeholder ParticipationIs there a structure that allows civil society to directly participate in urban planning and management?
1.3 Data ManagementIs there a publicly accessible platform for georeferenced data at the city level?
1.4 Trend AnalysesIs there evidence of data sets and trend analyses being used to inform city-level planning activities?
1.5 Land Use and ZoningDoes the city have up-to-date land use plans and institutional capacity (an agency or committee) to monitor their implementation?
1.6 Urban Growth PatternsDoes the city have plans in place to limit urban sprawl and encourage increasing urban density?
1.7 Informal SettlementsDoes the city have policies in place to prevent and rehabilitate informal settlements?
1.8 Transport and Mobility Integrated with Land Use
Is there an up-to-date transport master plan that enables authorities to measure and monitor the development of the transportation system?
1.9 Cultural HeritageAre there policies and plans in place to protect and conserve cultural and historical heritage?
Fiscal Sustainability
2.1 Accountability and Transparency Is there an accountability framework in the city?
2.2 Creditworthiness Does the city have a credit rating?
2.3 Revenue and Financial AutonomyIs the city financially autonomous (as opposed to dependent on other levels of government) for its overall financing?
2.4 Expenditure ManagementDoes the city have operating and capital investment plans that guide the preparation and execution of annual operating and capital budgets?
2.5 Management of Debt and Other Obligations
Is the city’s debt level deemed sustainable by ratings agencies and/or independent watchdogs?
Urban Economies
3.1 Economic PerformanceIs there an economic plan or strategy to promote economic growth in different sectors of the city’s economy?
3.2 Business Climate, Innovation, and Entrepreneurship
Is the regulatory environment of the city conducive to starting and operating local firms relative to the rest of the country (i.e., ease of doing business)?
3.3 Labor ForceAre there city-led policy programs in place to match the labor force level of skill to the current and emerging employment opportunities?
3.4 Livelihood OpportunitiesAre there labor policies in place to deter discrimination and promote fair employment conditions?
3.5 Income Equality and Shared Prosperity
Is there a government effort to ensure that the provision of public services reaches all urban areas?
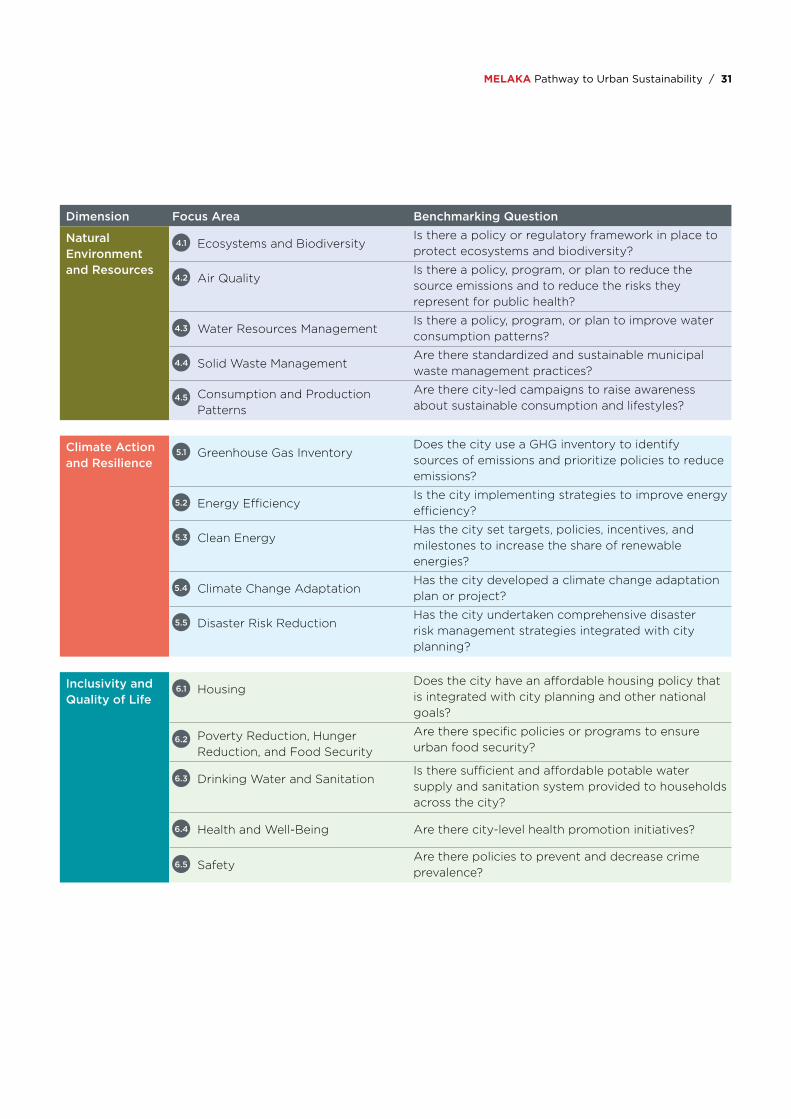
30 / Sustainability Outlook Diagnostic—Overview Report MELAKA Pathway to Urban Sustainability / 31
Dimension Focus Area Benchmarking Question
Natural Environment and Resources
4.1 Ecosystems and BiodiversityIs there a policy or regulatory framework in place to protect ecosystems and biodiversity?
4.2 Air QualityIs there a policy, program, or plan to reduce the source emissions and to reduce the risks they represent for public health?
4.3 Water Resources ManagementIs there a policy, program, or plan to improve water consumption patterns?
4.4 Solid Waste ManagementAre there standardized and sustainable municipal waste management practices?
4.5 Consumption and Production Patterns
Are there city-led campaigns to raise awareness about sustainable consumption and lifestyles?
Climate Action and Resilience
5.1 Greenhouse Gas InventoryDoes the city use a GHG inventory to identify sources of emissions and prioritize policies to reduce emissions?
5.2 Energy EfficiencyIs the city implementing strategies to improve energy efficiency?
5.3 Clean EnergyHas the city set targets, policies, incentives, and milestones to increase the share of renewable energies?
5.4 Climate Change AdaptationHas the city developed a climate change adaptation plan or project?
5.5 Disaster Risk ReductionHas the city undertaken comprehensive disaster risk management strategies integrated with city planning?
Inclusivity and Quality of Life
6.1 HousingDoes the city have an affordable housing policy that is integrated with city planning and other national goals?
6.2 Poverty Reduction, Hunger Reduction, and Food Security
Are there specific policies or programs to ensure urban food security?
6.3 Drinking Water and SanitationIs there sufficient and affordable potable water supply and sanitation system provided to households across the city?
6.4 Health and Well-Being Are there city-level health promotion initiatives?
6.5 SafetyAre there policies to prevent and decrease crime prevalence?
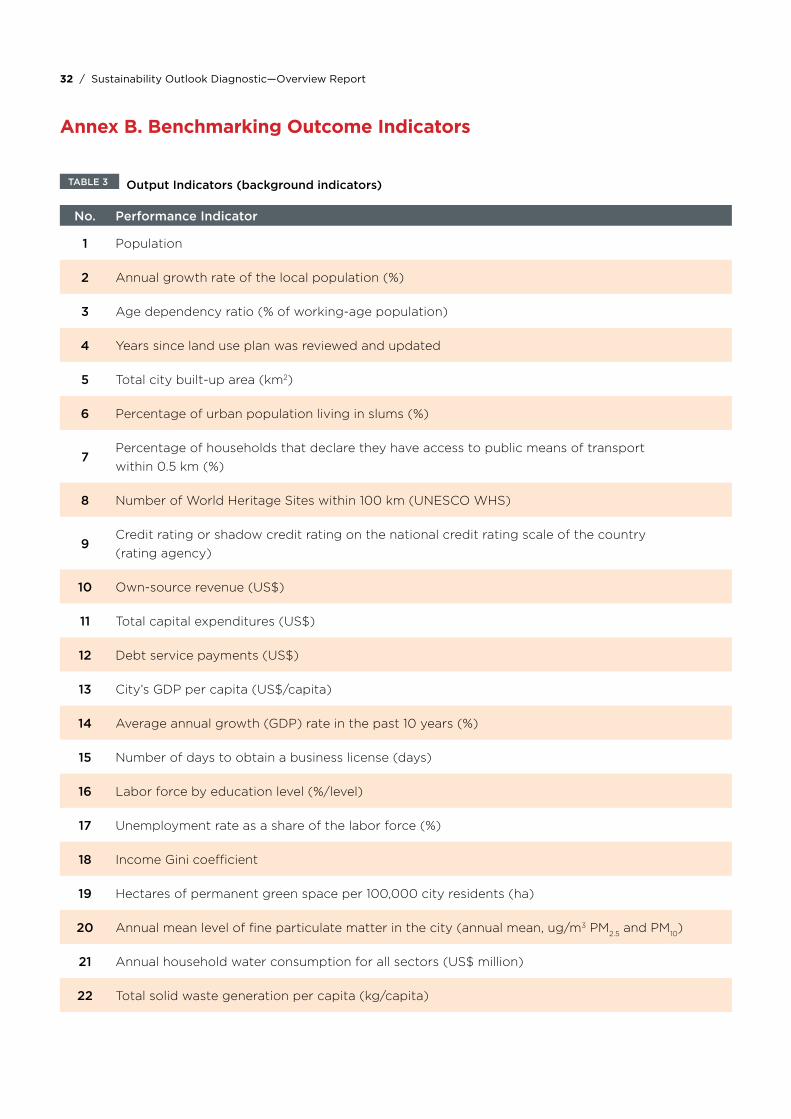
32 / Sustainability Outlook Diagnostic—Overview Report
Annex B. Benchmarking Outcome Indicators
TABLE 3 Output Indicators (background indicators)
No. Performance Indicator
1 Population
2 Annual growth rate of the local population (%)
3 Age dependency ratio (% of working-age population)
4 Years since land use plan was reviewed and updated
5 Total city built-up area (km2)
6 Percentage of urban population living in slums (%)
7Percentage of households that declare they have access to public means of transport within 0.5 km (%)
8 Number of World Heritage Sites within 100 km (UNESCO WHS)
9Credit rating or shadow credit rating on the national credit rating scale of the country (rating agency)
10 Own-source revenue (US$)
11 Total capital expenditures (US$)
12 Debt service payments (US$)
13 City’s GDP per capita (US$/capita)
14 Average annual growth (GDP) rate in the past 10 years (%)
15 Number of days to obtain a business license (days)
16 Labor force by education level (%/level)
17 Unemployment rate as a share of the labor force (%)
18 Income Gini coefficient
19 Hectares of permanent green space per 100,000 city residents (ha)
20 Annual mean level of fine particulate matter in the city (annual mean, ug/m3 PM2.5 and PM10)
21 Annual household water consumption for all sectors (US$ million)
22 Total solid waste generation per capita (kg/capita)
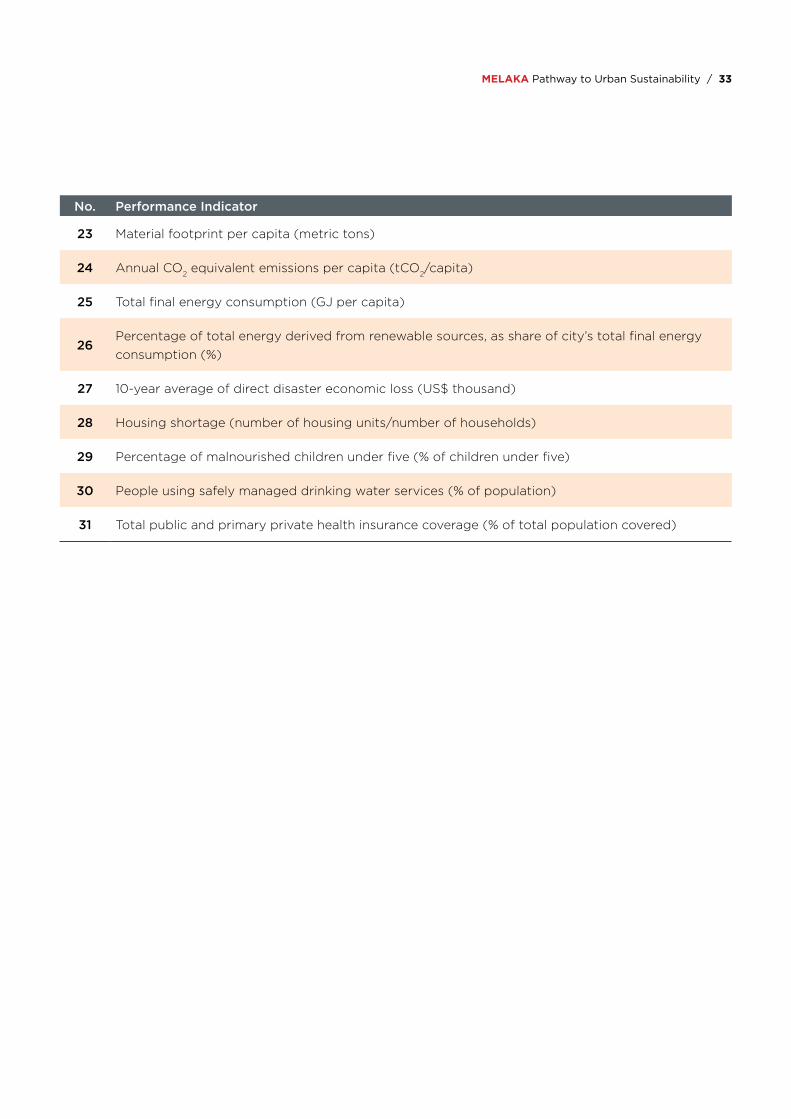
32 / Sustainability Outlook Diagnostic—Overview Report MELAKA Pathway to Urban Sustainability / 33
No. Performance Indicator
23 Material footprint per capita (metric tons)
24 Annual CO2 equivalent emissions per capita (tCO2/capita)
25 Total final energy consumption (GJ per capita)
26Percentage of total energy derived from renewable sources, as share of city’s total final energy consumption (%)
27 10-year average of direct disaster economic loss (US$ thousand)
28 Housing shortage (number of housing units/number of households)
29 Percentage of malnourished children under five (% of children under five)
30 People using safely managed drinking water services (% of population)
31 Total public and primary private health insurance coverage (% of total population covered)
“Vie
w o
f th
e fa
mo
us c
olo
nial
Dut
ch S
qua
re in
Mal
acca
.” P
hoto
: Cha
rlie
Tong
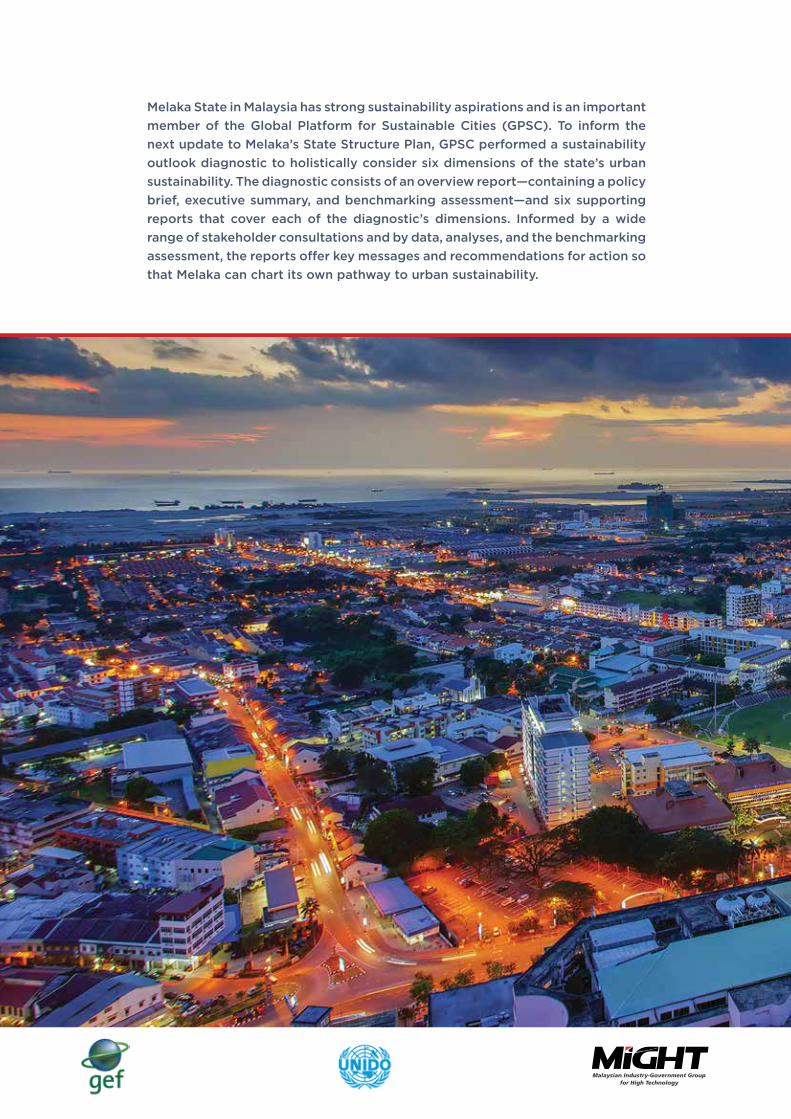
Melaka State in Malaysia has strong sustainability aspirations and is an important member of the Global Platform for Sustainable Cities (GPSC). To inform the next update to Melaka’s State Structure Plan, GPSC performed a sustainability outlook diagnostic to holistically consider six dimensions of the state’s urban sustainability. The diagnostic consists of an overview report—containing a policy brief, executive summary, and benchmarking assessment—and six supporting reports that cover each of the diagnostic’s dimensions. Informed by a wide range of stakeholder consultations and by data, analyses, and the benchmarking assessment, the reports offer key messages and recommendations for action so that Melaka can chart its own pathway to urban sustainability.