overview uk water companies wessex water –water supply –waste water regulation –business...
TRANSCRIPT

Overview
• UK Water companies
• Wessex Water– Water supply– Waste water
• Regulation– Business Planning– Performance commitments
• Leakage PC’s
• Leakage strategy
• Data
• Pressure management2
• Targeting
• Active leakage control
• Seasonality

3
The water and waste water companiesof England and Wales

4
The Wessex Water region

5
The company
• One of the 10 regional water and sewerage businesses in England and Wales
• One of the most efficient water and sewerage companies according to the industry regulator Ofwat
• Highest standards of service and quality in UK
• Since privatisation in 1989 we have invested more than £3.6bn in improving and maintaining water and sewerage services
• Consistently the most profitable water and sewerage company

6
Water supply
• Approximately 330Ml/d of water produced per day
– 96 water sources
• 75% groundwater and 25% surface water
– 110 treatment plants

• 11,650km of water mains in the supply network
• 1,500km – Trunk mains
• 10,150km – Distribution mains
• 340 service reservoirs and water towers
• 209 booster pumping stations
• 600,000 Connections
• 1.3 million customers
7
Water supply

Wastewater
• 35,000km of public sewer
• 1,600 pumping stations
• 1,003 combined sewer overflows
• All will be monitored by 2020
• 2.7 million customers
• 407 sewage treatment works
• 460Ml/d treated per day
8

Regulation
• Ofwat– Economic regulator - UK Gov– Regulates bills & measures performance
• Service incentive mechanism• Performance commitments
• DWI – Water quality regulator – UK Gov
• EA – Environmental regulator – UK Gov
9

Customer priorities
10
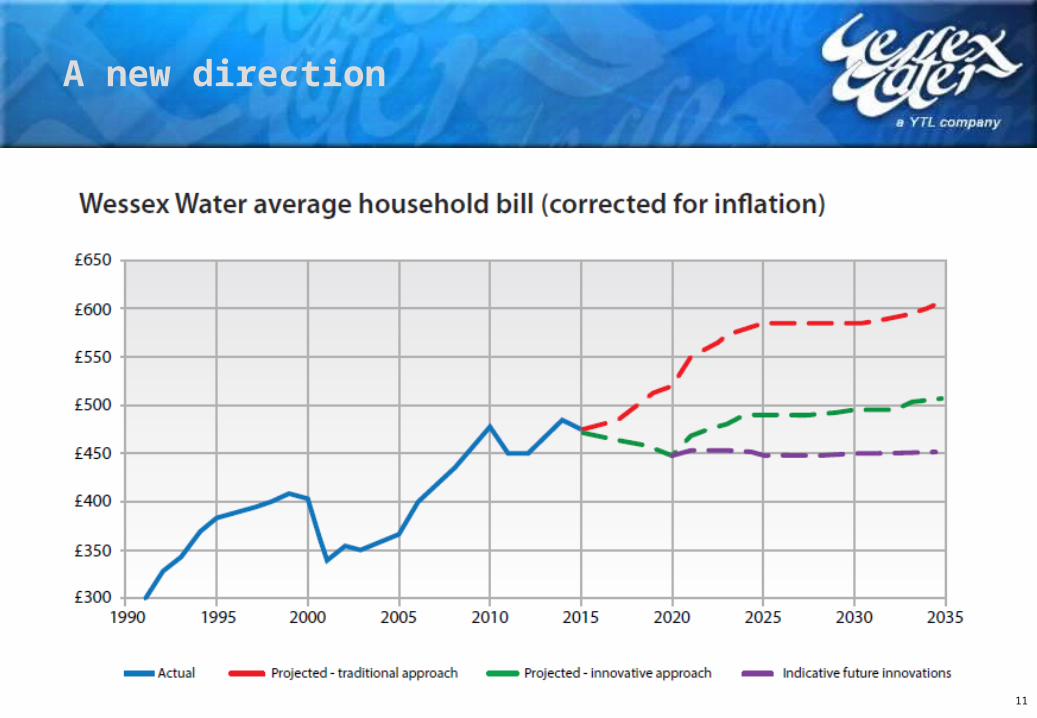
A new direction
11

The business plan
Our nine outcomes
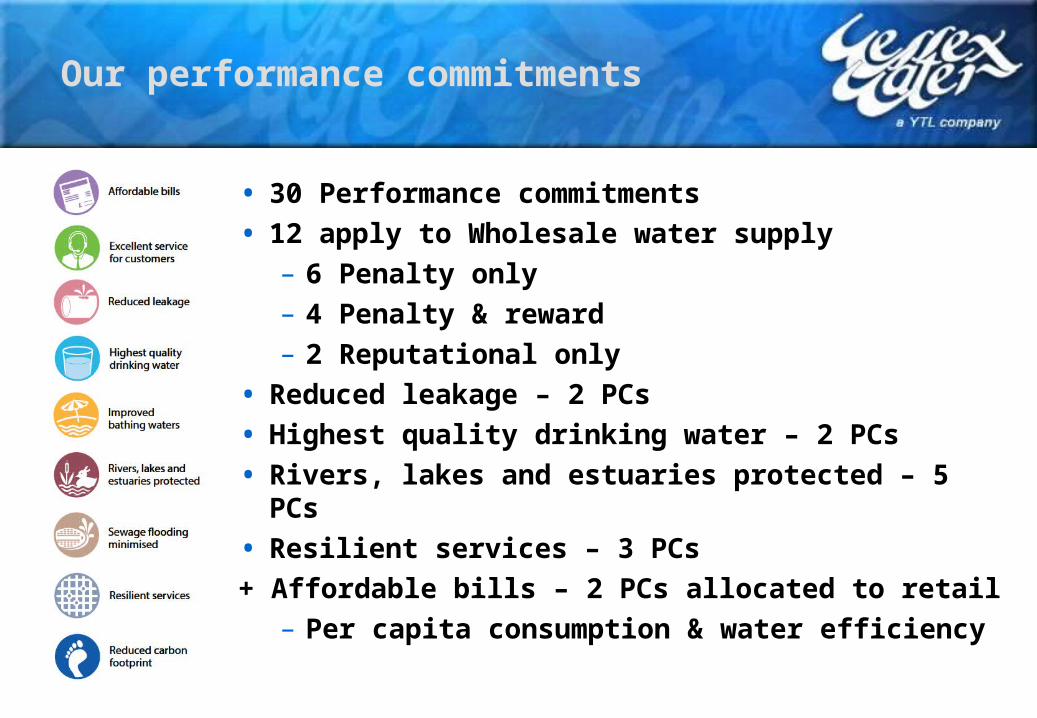
Our performance commitments
• 30 Performance commitments
• 12 apply to Wholesale water supply– 6 Penalty only– 4 Penalty & reward– 2 Reputational only
• Reduced leakage – 2 PCs
• Highest quality drinking water – 2 PCs
• Rivers, lakes and estuaries protected – 5 PCs
• Resilient services – 3 PCs
+ Affordable bills – 2 PCs allocated to retail– Per capita consumption & water efficiency
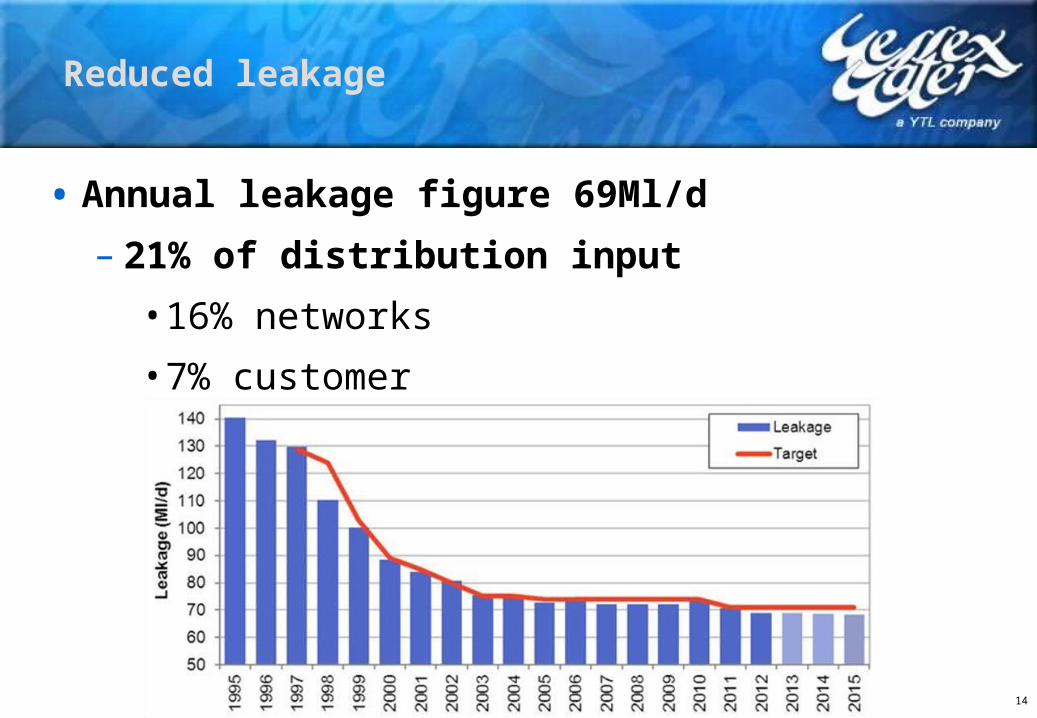
• Annual leakage figure 69Ml/d
– 21% of distribution input
• 16% networks
• 7% customer
14
Reduced leakage
• Current leakage expenditure
– Circa. £13.5M/year
• Active leakage control
• Repair & maintenance
• Pressure management
• Special projects
15
Reduced leakage

• Challenging target – 5% reduction
• Out performance not cost beneficial due to limited rewards
HIGH BUSINESS RISK, DUE TO CHALLENGING TARGET AND ONGOING REPUTATIONAL IMPACT
Volume of water leakedReduced Leakage

• Challenging target
• New reporting mechanism being developed as number of exclusions apply to data reported externally
• Retail driven customer perception target that places cost and inefficiencies on wholesale business
LOW BUSINESS RISK
Reported leaks fixed within a day
Reduced Leakage

18
Future leakage target
71Ml/d 66.5Ml/d
52.5Ml/d

Leakage strategy
• How will we deliver the 5%?
• Customer metering– Circa 55% of customers metered
• All non-domestic metered• Domestic metering optional
– Water resource surplus
• Proposed strategy– Increased positive publicity
• In the right situation a meter saves money– Metering on change of occupier
19

Leakage strategy
• How will we deliver the 5%?
• Metering
• More trunk main meters
• More meter calibration
• Pressure management
• More pressure controllers
• Redesign pressure managed areas
• Asset renewal
• More mains replacement
• More service pipe replacement20

Leakage strategy
• How will we deliver the 5%... Then 25% by 2040?
• Innovation• Beyond 2020 project
– 75 ideas/concepts– Refined to 35 for cost benefit analysis– Quick wins for 2020 target
Better use of data!
21

Data structure
• Wessex Water Region
– Water in to supply zones (WIS)
• 33
– District Metered Areas (DMAs)
• 650
– Pressure managed areas (PMAs)
• 960
22
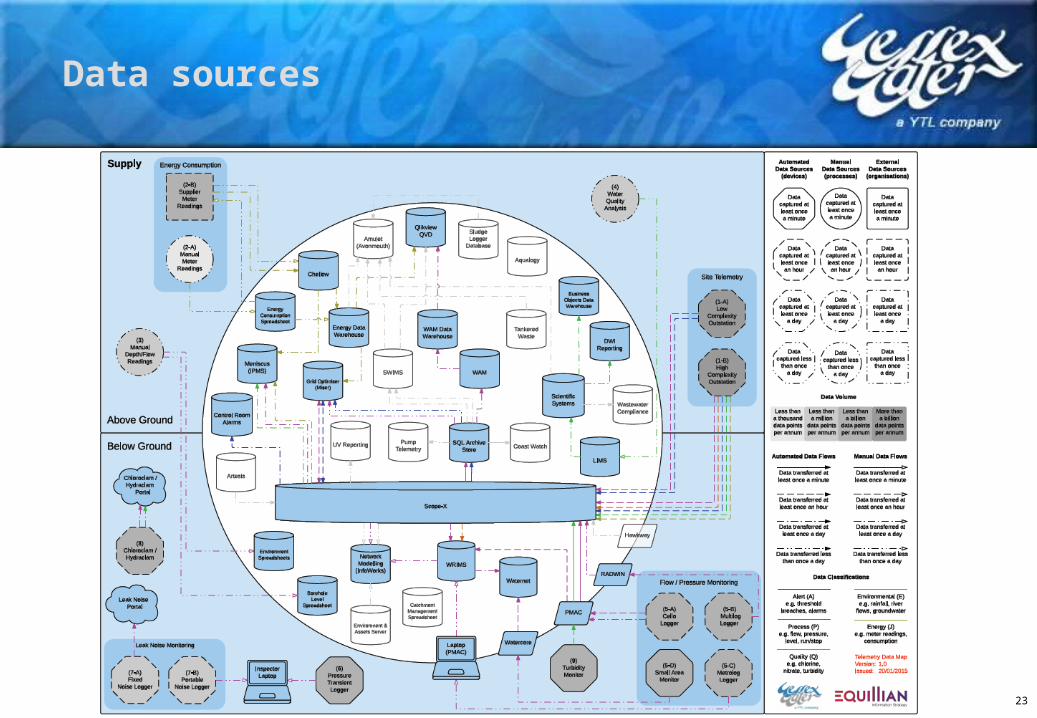
Data sources
23
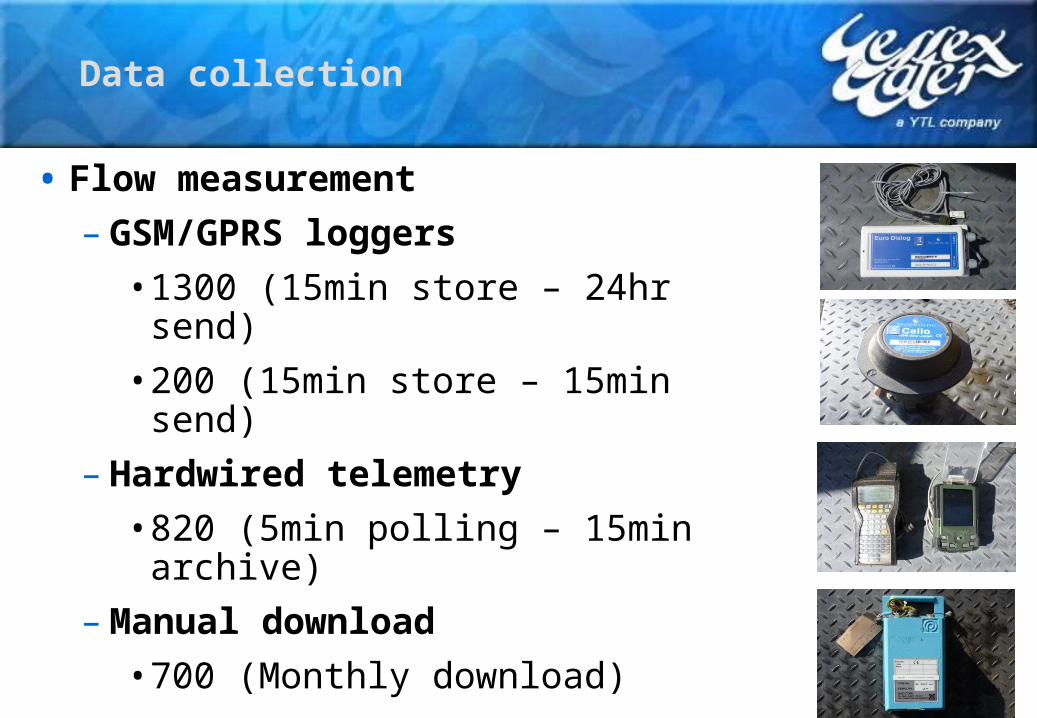
Data collection
• Flow measurement– GSM/GPRS loggers
• 1300 (15min store – 24hr send)• 200 (15min store – 15min send)
– Hardwired telemetry• 820 (5min polling – 15min archive)
– Manual download• 700 (Monthly download)
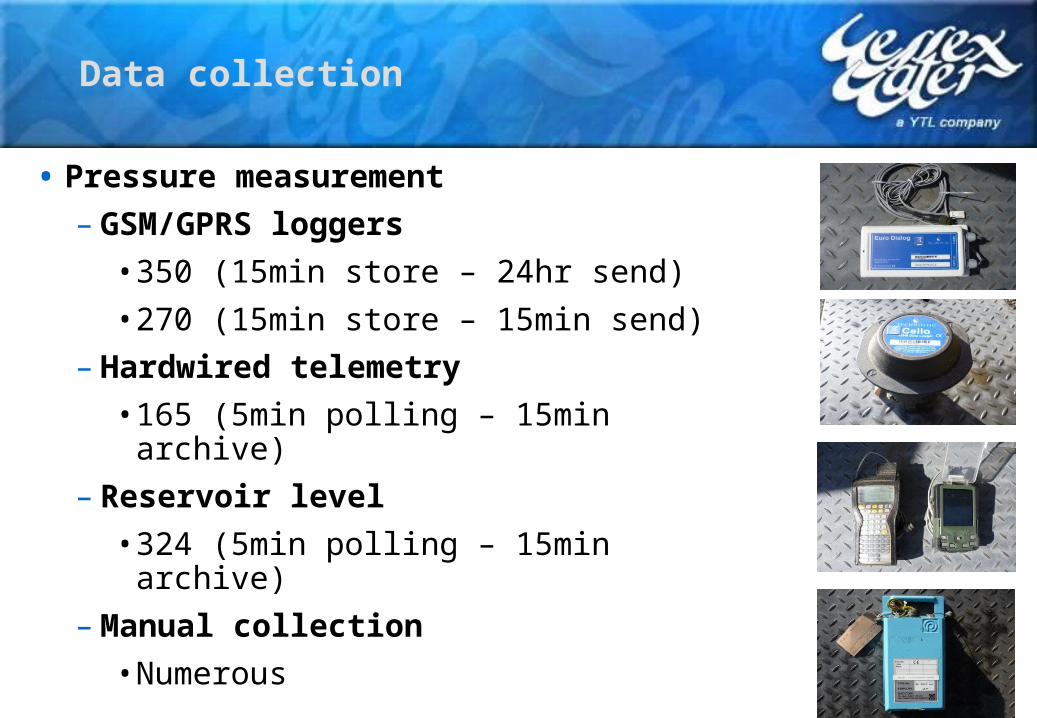
Data collection
• Pressure measurement– GSM/GPRS loggers
• 350 (15min store – 24hr send)• 270 (15min store – 15min send)
– Hardwired telemetry• 165 (5min polling – 15min archive)
– Reservoir level• 324 (5min polling – 15min archive)
– Manual collection• Numerous
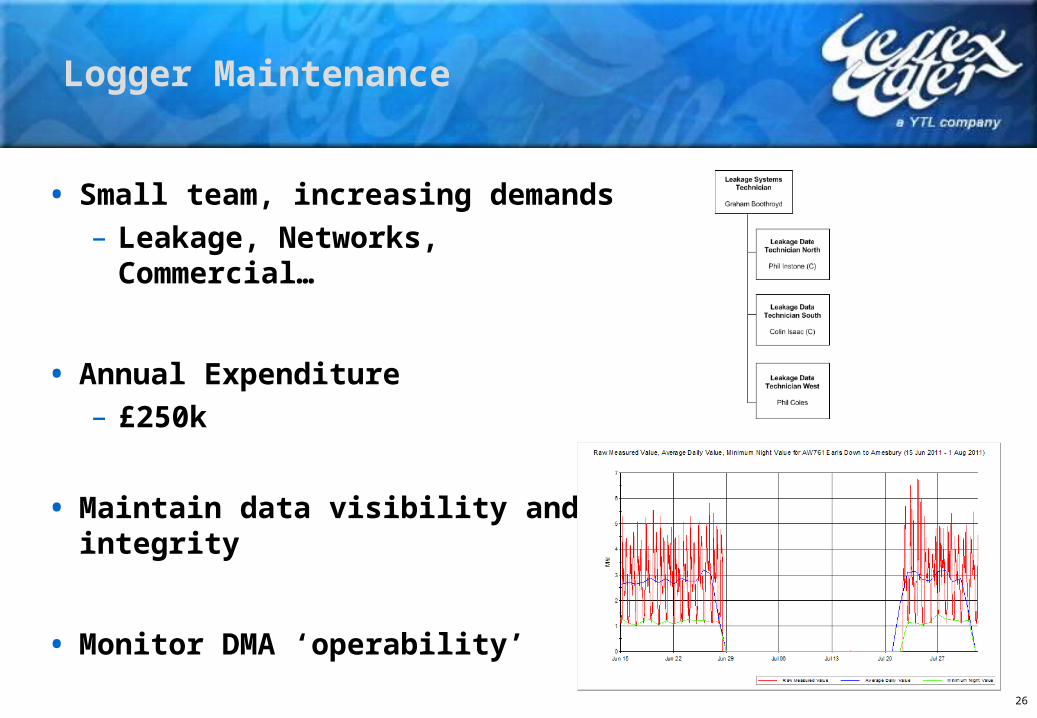
Logger Maintenance
26
• Small team, increasing demands– Leakage, Networks, Commercial…
• Annual Expenditure– £250k
• Maintain data visibility and integrity
• Monitor DMA ‘operability’

Data visualisation
• Telemetry
– Servelec technologies ScopeX
– Control room tool
– 24hr, 365 days a year
– 100’s of business users
– Includes alarm management
27

Data analysis
• Telemetry
– Threshold alarms
– High/low flow
– High/low pressure
– High/low level
28
29
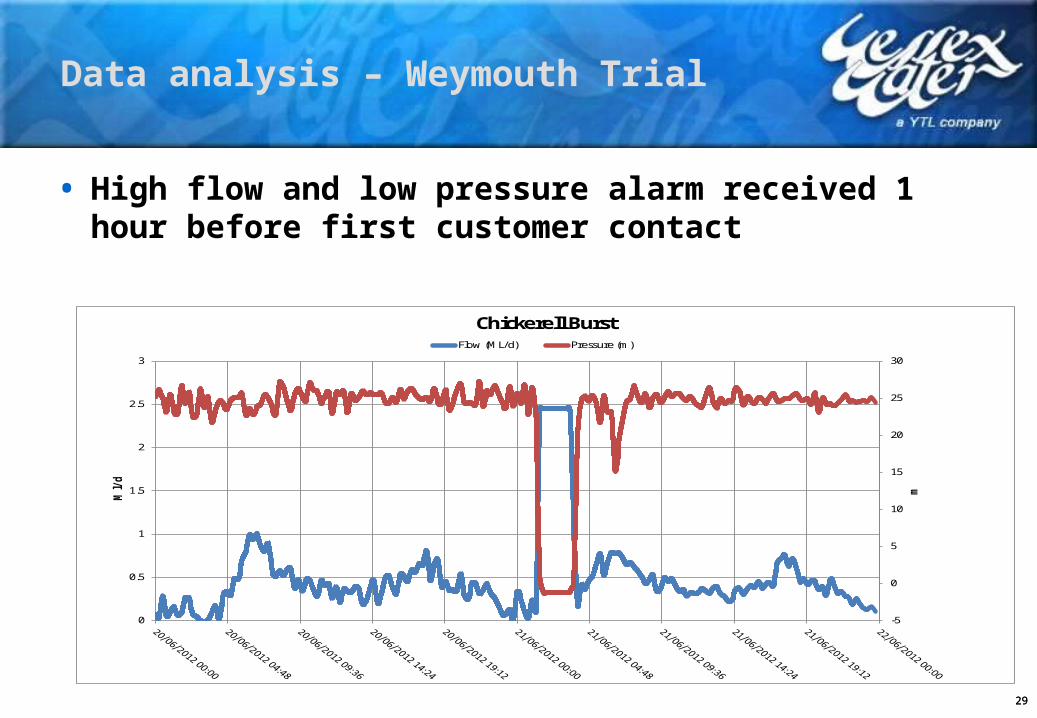
Data analysis – Weymouth Trial
• High flow and low pressure alarm received 1 hour before first customer contact
29
-5
0
5
10
15
20
25
30
0
0.5
1
1.5
2
2.5
3
m
Ml/
d
Chickerell BurstFlow (ML/d) Pressure (m)

30
– Burst occurred at 02:30– Alarms received at 02:41– First customer contacted us at 03:41
30
-5
0
5
10
15
20
25
30
0
0.5
1
1.5
2
2.5
3
m
Ml/
d
Chickerell BurstFlow (ML/d) Pressure (m)
High flow alarm level 1.6Ml/d
Low pressure alarm level 12m
Data analysis – Weymouth Trial

31
• High flow alarm – 00:50– based on historic values
31
Data analysis – Weymouth Trial
32
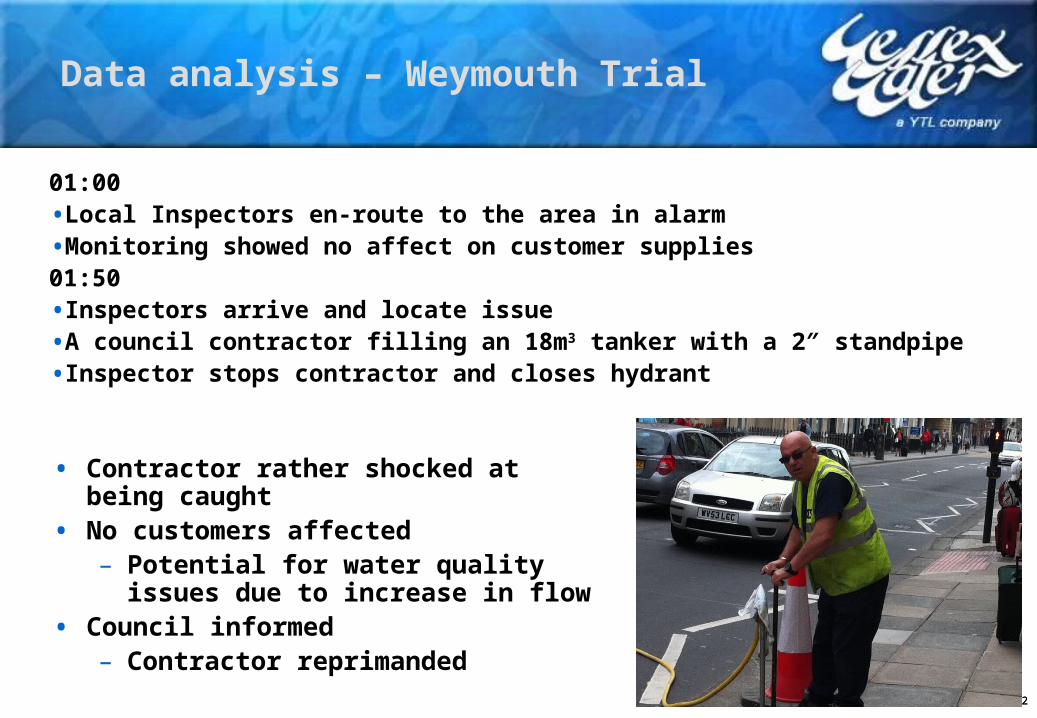
01:00•Local Inspectors en-route to the area in alarm•Monitoring showed no affect on customer supplies01:50 •Inspectors arrive and locate issue•A council contractor filling an 18m3 tanker with a 2″ standpipe•Inspector stops contractor and closes hydrant
32
• Contractor rather shocked at being caught
• No customers affected – Potential for water quality issues due
to increase in flow• Council informed
– Contractor reprimanded
Data analysis – Weymouth Trial

Data visualisation
• WRIMs – Water Resources Information Management System
– Developed by Wessex Water
• 100’s of users
– Bespoke leakage tool
• Monitoring flow
• Monitoring pressure
• MNF Calculation
• Long term trending
33

• Daily flow (and pressure) alarm report
34
0.04
0.06
0.08
0.10
0.12
0.14
0.16
0.18
0.20
0.22
0.24
Aug 25 Sep 01 Sep 08 Sep 15
Ml/d
Readings over last 30 days, for DW628 Throop (18 Aug 2014 - 17 Sep 2014)
Last 30 Day s' Readings Flow Alarm Threshold f or Dev ice0
1
2
3
4
Aug 19 Aug 26 Sep 02 Sep 09 Sep 16
m3/
h
Readings over last 30 days, for DW155 Bryanston Village (19 Aug 2014 - 18 Sep 2014)
Last 30 Day s' Readings Flow Alarm Threshold f or Dev ice
Data analysis
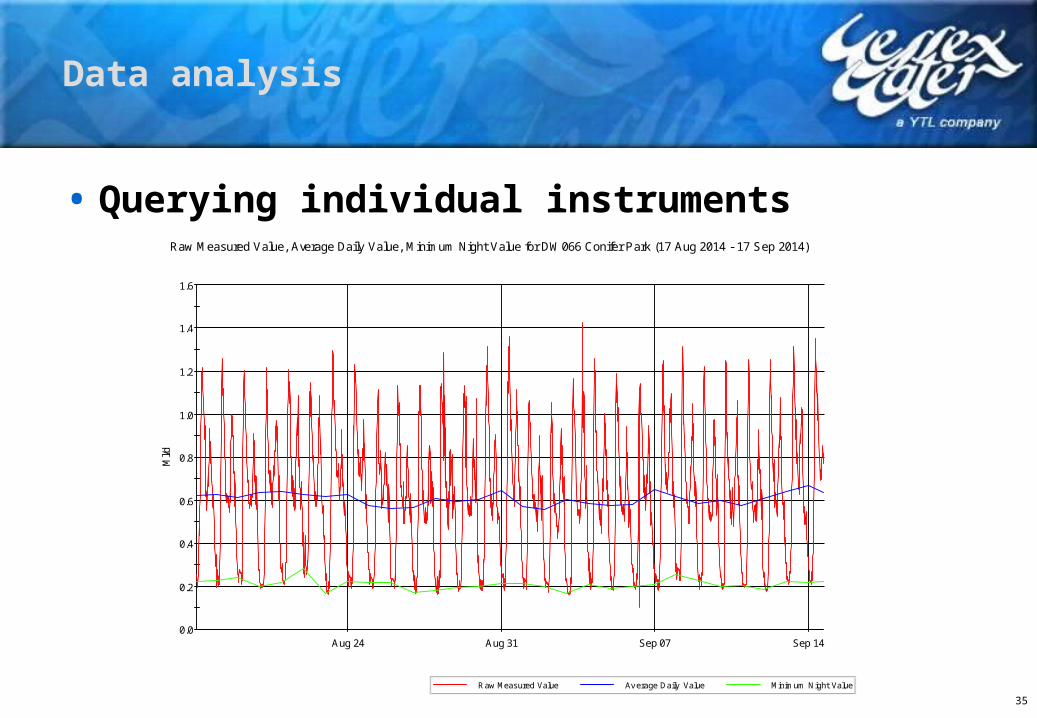
• Querying individual instruments
35
0.0
0.2
0.4
0.6
0.8
1.0
1.2
1.4
1.6
Aug 24 Aug 31 Sep 07 Sep 14
Ml/d
Raw Measured Value, Average Daily Value, Minimum Night Value for DW066 Conifer Park (17 Aug 2014 - 17 Sep 2014)
Raw Measured Value Av erage Daily Value Minimum Night Value
Data analysis
Data visualisation
• WaterNet
– Developed by RPS
– Implementation started 2011/12
• System build
• Bottom up leakage calculation
– Still growing and developing
• 2012/13 NRR & policy minimum study
• 2013/14 Meter audit & small area monitor scope
• More leakage functionality in development…36
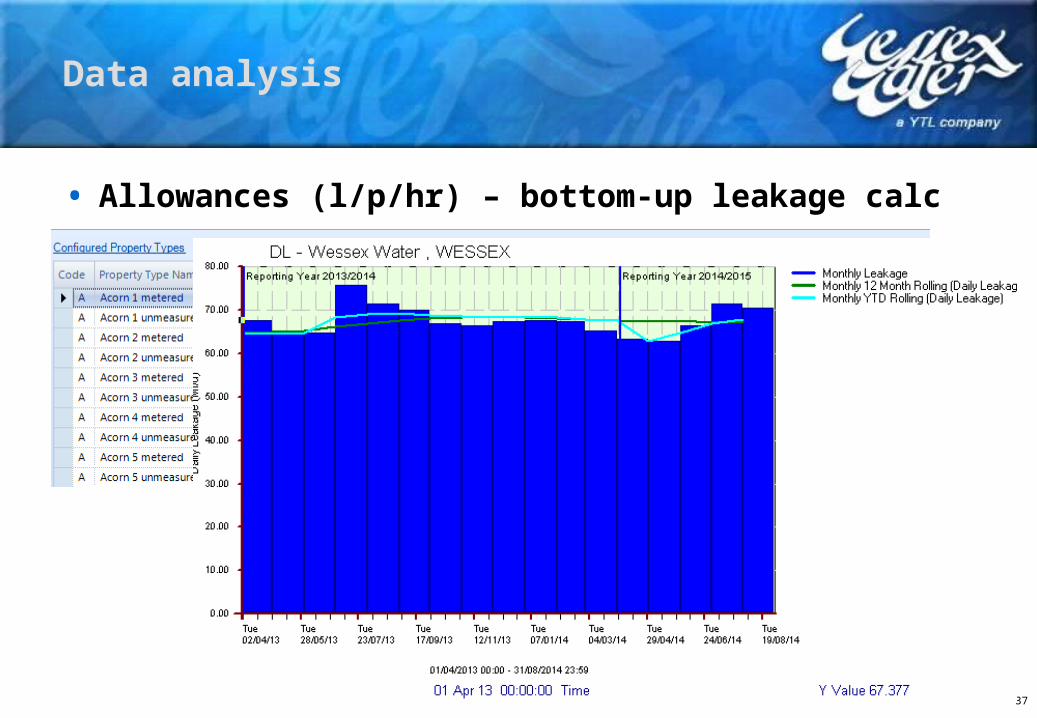
• Allowances (l/p/hr) – bottom-up leakage calc
37
Data analysis
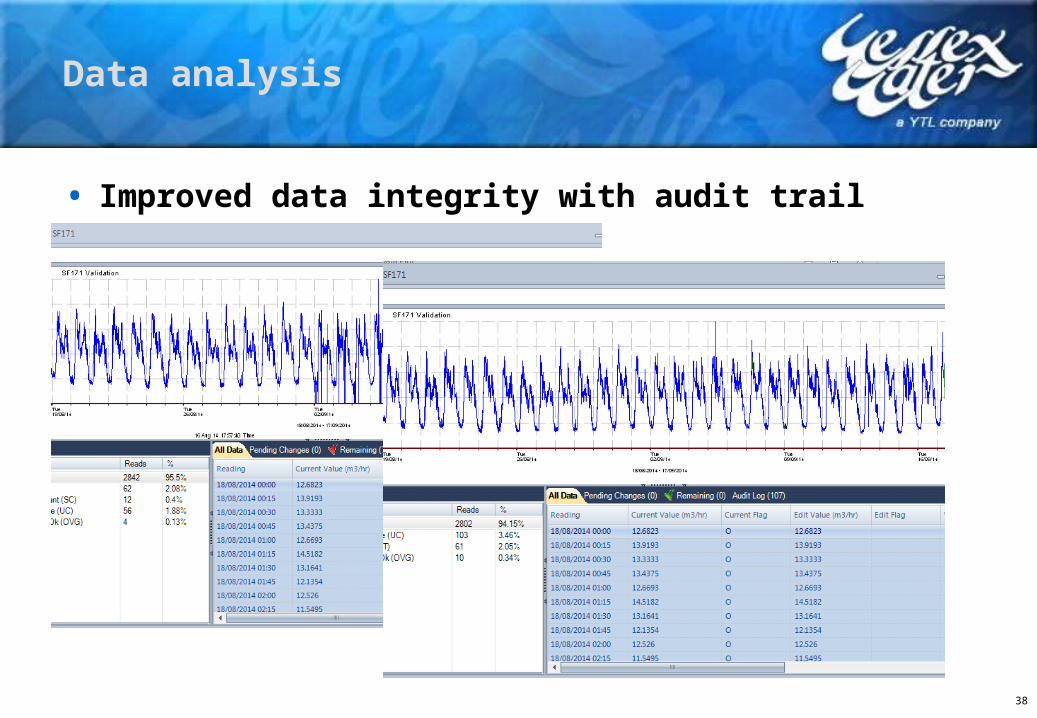
• Improved data integrity with audit trail
38
Data analysis

• Improved MNF calculations – pumped flows
39
Data analysis

• More sophisticated flow balancing, inc. res overflows
• Established trunk main balance area
40
Data analysis

• Pressure management
• Hydraulic modelling
• Smart analytics
41
Supporting leakage functions

• Assets operated– 1692 PRV’s– 1491 sites– 201 Standby
42
Pressure management
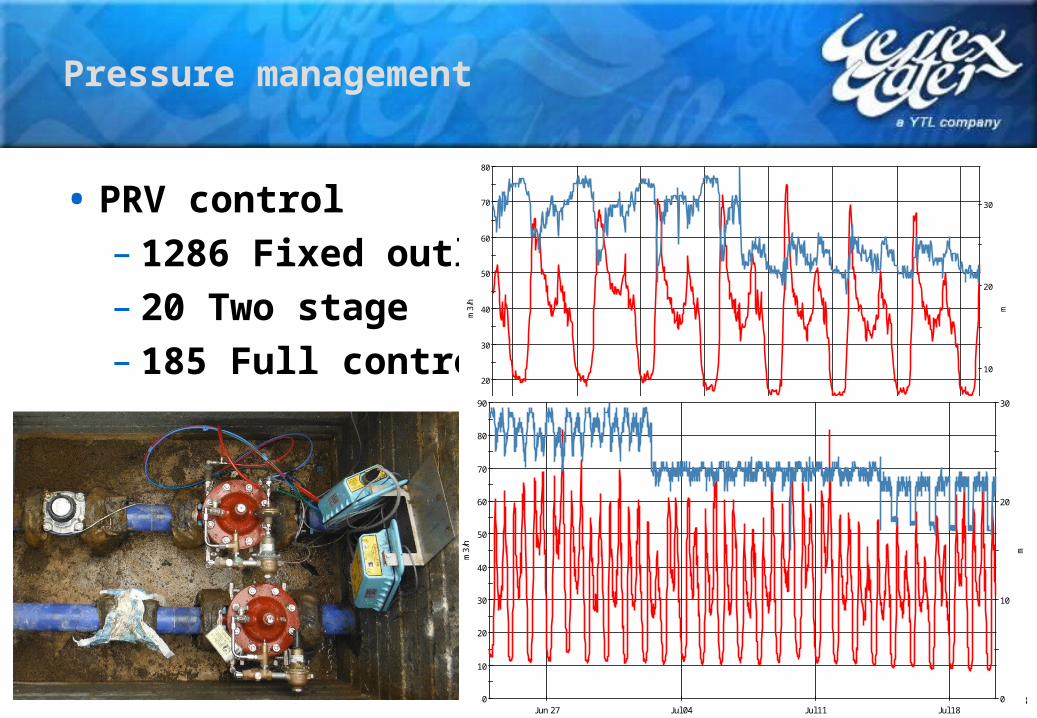
• PRV control– 1286 Fixed outlet– 20 Two stage– 185 Full control
43
Pressure management
0
10
20
30
40
50
60
70
80
Sat 16 Sun 17 Mon 18 Tue 19 Wed 20 Thu 21 Fri 22 Sat 23m
3/h
0
10
20
30
m
Raw Measured Value for JT Kingston St Michael F and P (1 Jun 2012 - 1 Jul 2012)
Raw Measured Value AW139 Raw Measured Value AM042
0
10
20
30
40
50
60
70
80
90
Jun 27 Jul 04 Jul 11 Jul 18
m3/
h
0
10
20
30
m
Raw Measured Value for JT Adastral Road (20 Jun 2010 - 31 Jul 2010)
Raw Measured Value DW084 Raw Measured Value DM183

• Assets operated– 110 Service Reservoir inlet controls
44
Pressure management
0
1
2
3
4
5
6
7
8
9
10
11
12
13
Mon 19 Tue 20 Wed 21 Thu 22 Fri 23 Sat 24 Sun 25 Mon 26 Tue 27
Ml/d
Raw Measured Value for SF655 Willett New Inlet (1 Oct 2012 - 4 Dec 2012)
Raw Measured Value
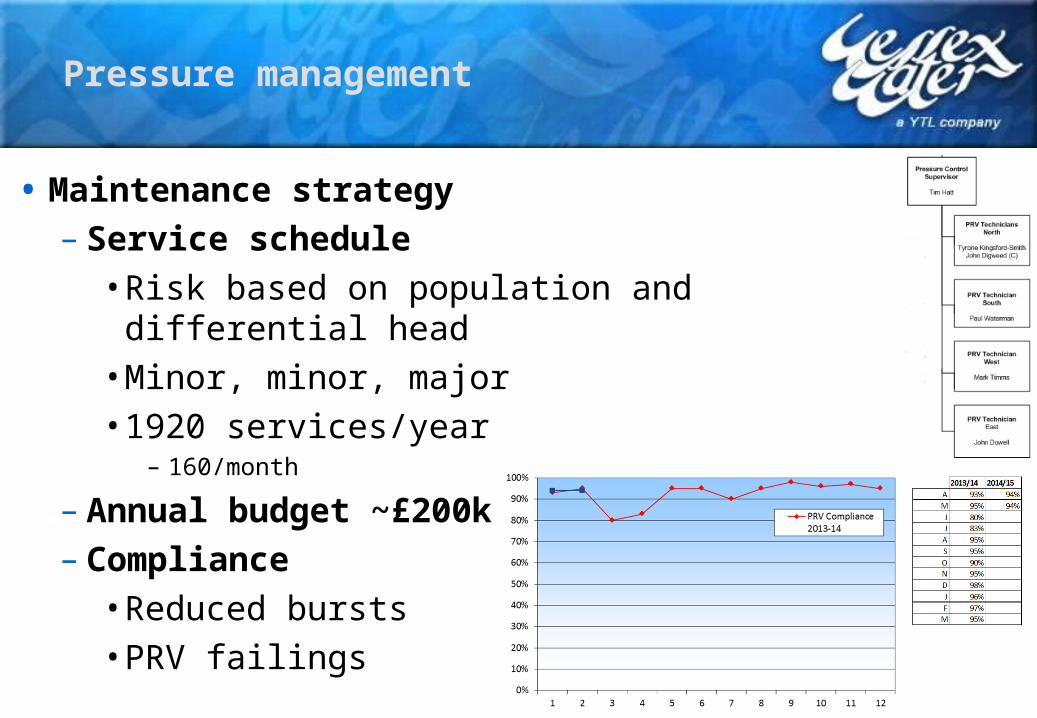
• Maintenance strategy– Service schedule
• Risk based on population and differential head• Minor, minor, major• 1920 services/year
– 160/month
– Annual budget ~£200k– Compliance
• Reduced bursts• PRV failings
45
Pressure management

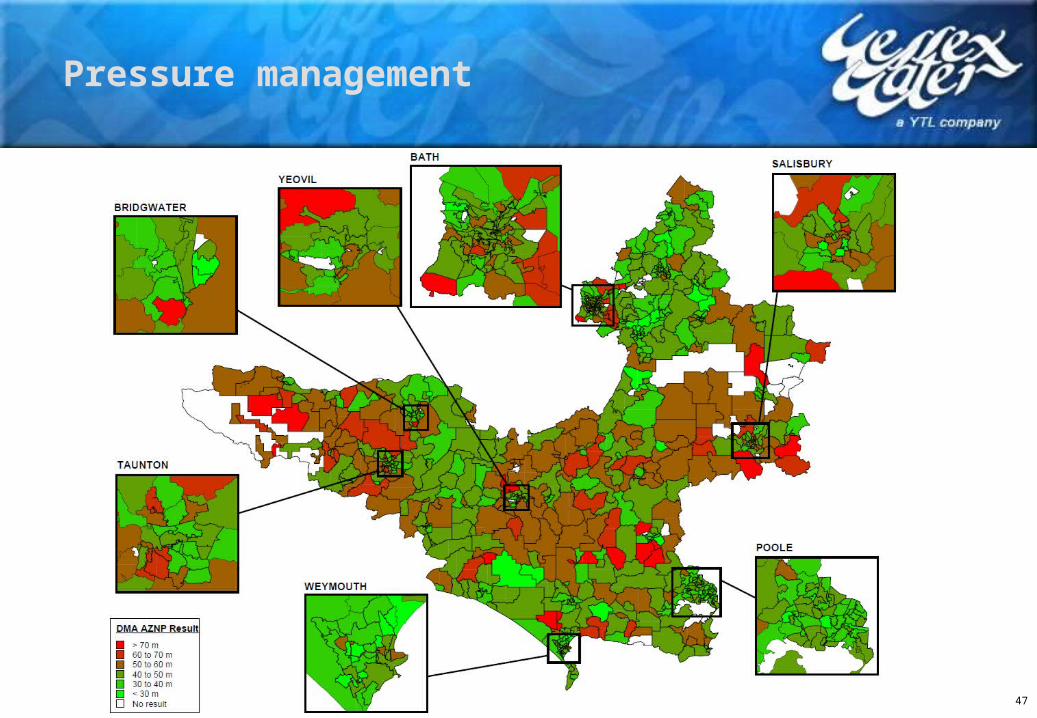
• AZNP Study - 2012– Wessex Water AZNP
• Average = 43m• 20 DMAs > 70m• 54 DMAs > 60m
– Wessex Water AZP• 41.5m
– Correlated with leakage results
46
Pressure management
47
Pressure management

48
Break for coffee/tea
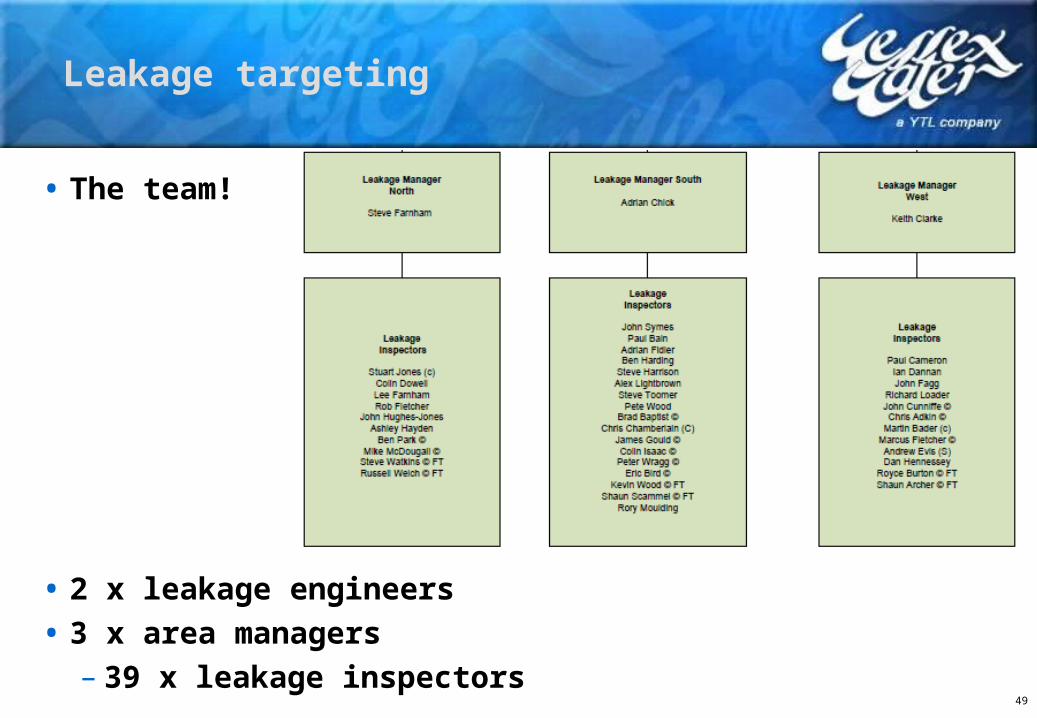
• The team!
• 2 x leakage engineers
• 3 x area managers– 39 x leakage inspectors 49
Leakage targeting

• WRIMs– Daily flow (and pressure) alarm report
• Reactive• Manual interpretation• Manual prioritisation
– Old technology– Visualises flows not leakage
50
Leakage targeting

• WaterNet– Improves leakage
targeting• Policy minimum
leakage– Enables ranking
of zones• Better
prioritisation
51
Leakage targeting

• Analysis ‘model’
• Efficient targeting =
Min. hours detectionm3 volume over target
+ local network knowledge
52Da
y Divisional Controller
LI & Controller
Divisional Controller
Leakage Engineer
1 Alarm2 Alarm3 Alarm4 Alarm5 Alarm6 Alarm7 Alarm8 Alarm9 Alarm
10 Alarm11 Alarm12 Alarm13 Alarm14 Alarm15 Alarm16 Alarm17 Alarm18 Alarm19 Alarm20 Alarm21 Alarm22 Alarm23 Alarm24 Alarm25 Alarm26 Alarm27 Alarm28 Alarm29 Alarm30 Alarm
DMA & CZ level trend
analysis
On
goin
g, h
igh
leve
l ana
lysi
s (t
runk
mai
n ba
lanc
es, r
es b
alan
ces)
. Lo
nger
term
tren
d an
alys
is
PML r
epor
tPM
L rep
ort
DMA & CZ level trend
analysis
DMA & CZ level trend
analysis
DMA & CZ level trend
analysis
DMA & CZ level trend
analysis
Leakage targeting

• Still mostly reactive– No longer sustainable– Smarter approach required
• Moving towards proactive model– Requires greater analysis resource– Better software solutions
• Trial into predictive analytics
53
Leakage targeting

• Predictive– Artificial neural networks, fuzzy logic etc…– Currently commercial providers limited
54
Leakage targeting
55
Leakage targeting

56
Active leakage control

57
Active leakage control
• Customer App

58
Active leakage control
• Methodologies– Listening stick
• Daily use• Better results at night
– Ground microphone• Daily use• Better results at night
– Correlation• Daily use• Material and fitting dependant

59
Active leakage control
• Methodologies– Step testing
• Night work only• 2 per week in each area• Refines detection resource
– Acoustic logging• Lift & shift
– 80 units for regional use
• Multi point acoustic correlation• Permanent network monitoring
60
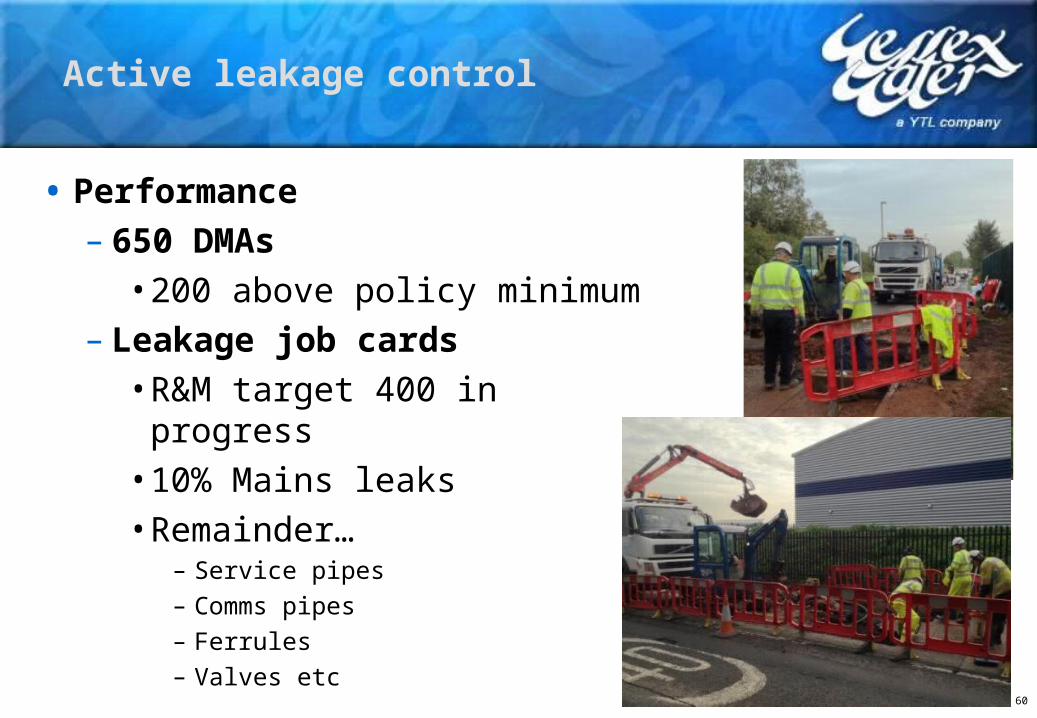
Active leakage control
• Performance– 650 DMAs
• 200 above policy minimum– Leakage job cards
• R&M target 400 in progress• 10% Mains leaks• Remainder…
– Service pipes– Comms pipes– Ferrules– Valves etc

61
Leakage job cards

62
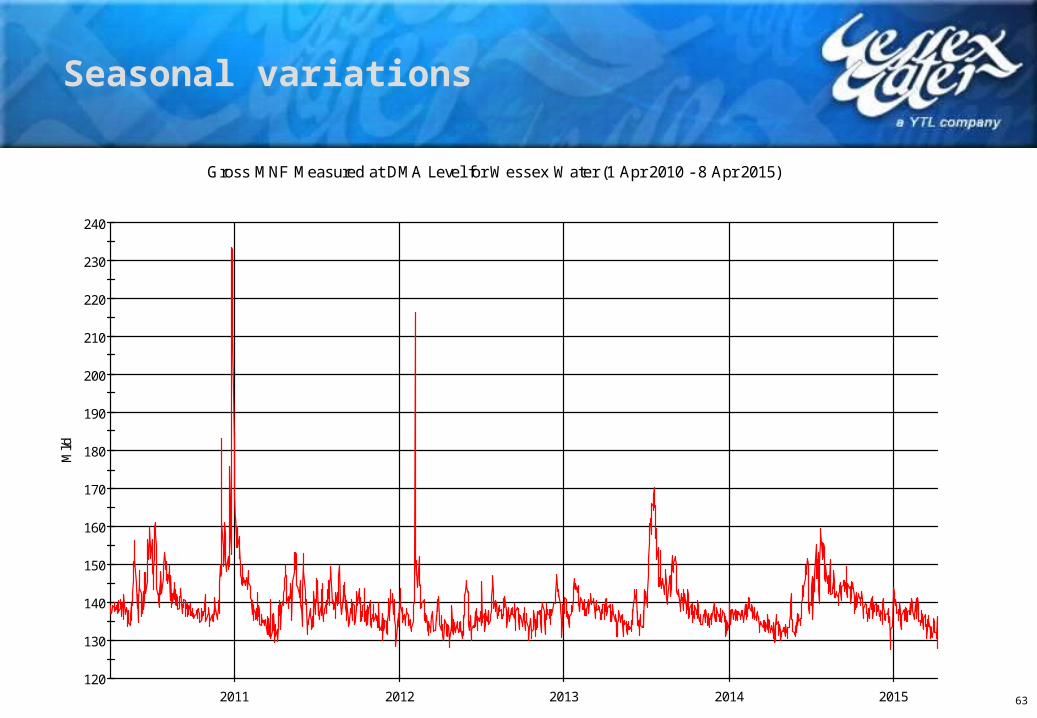
Seasonal variations
• Summer demand masking leaks– Summer breakout– Difficult to detect– Expected drops in demand didn’t occur
• Occurred 2 years in a row• Makes meeting the regulatory deadline
challenging
63
120
130
140
150
160
170
180
190
200
210
220
230
240
2011 2012 2013 2014 2015
Ml/d
Gross MNF Measured at DMA Level for Wessex Water (1 Apr 2010 - 8 Apr 2015)
Gross MNF Measured at DMA Lev el
Seasonal variations
64
Seasonal variations
• Small area monitoring– WaterNet solution– 1 second logging
• Between 01:00 and 06:00– 70 sites
• New meter installation• Domestic areas
– 10 – 25 properties
– Help understand night use• Flag when DMA’s are outside tolerance

65
Seasonal variations

66
Questions & Discussion