overweight and obesity in michigan: surveillance report series
TRANSCRIPT
Overweight and Obesity in Michigan:
Surveillance Report Series
Nutrition Chapter 2009

Michigan’s CDC funded Nutrition, Physical Activity and Obesity Program is in the process of developing the “Overweight and Obesity in Michigan” surveillance report. The report will contain four chapters, Physical Activity, Nutrition, Breastfeeding and Obesity. Each chapter will be released individually with the fi nal report completed and released by the summer of 2009.
The second released chapter, Nutrition, contains surveillance data on Inadequate Fruit and Vegetable Consumption, Fast Food (Adults) and Sugar-Sweetened Beverages (Youth).
Permission is granted for the reproduction of this publication provided that the reproductions contain appropriate reference to the source.
Suggested citation: BE Anderson, SK Lyon-Callo, MD Boivin, SE Monje and G Imes. Overweight and Obesity in Michigan: Surveillance Report Series 2009. Lansing, MI: Michigan Department of Community Health, Bureau of Epidemiology, Chronic Disease Epidemiology Section.
This report was supported by Grant/Cooperative Agreement Number 1U58DP001386-01 from the Centers for Disease Control and Prevention (CDC). Its contents are solely the responsibility of the authors and do not necessarily represent the offi cial views of the CDC.
The maps in this report were made possible by a grant from the Division of Heart Disease and Stroke, Centers for Disease Control and Prevention through the National Association of Chronic Disease Directors.
Produced June 2009

Michigan Department of Community Health, 2009
Chapter 3. Nutrition Overweight and Obesity in Michigan
Contributors:Beth Anderson, MPHSarah Lyon-Callo, MA, MSSarah Monje, MPH, RDGwendoline Imes MS, RD
Introduction:The 2005 Dietary Guidelines for Americans1 published by the U.S. Department of Health and Human Services and the United States Department of Agriculture recommend that adults consume a variety of nutrient-dense foods and beverages within and among the basic food groups. Research shows that healthy eating can contribute to maintaining a healthy weight or losing excess weight. This in turn can help lower people’s risk for chronic diseases, including heart disease, stroke, some cancers, diabetes, and osteoporosis. However, a large gap remains between healthy dietary patterns and what Americans actually eat.1
Substituting foods relatively high in water and fi ber (low energy dense) for foods high in carbohydrates, fat, protein or alcohol (high energy dense) will tend to help a person feel full while consuming fewer calories. Most fruits and vegetables have a lower energy density than foods from other food groups.2
It is estimated that each year in the United States more than $33 billion in direct medical costs and $9 billion in lost productivity resulting from heart disease, stroke, cancer and diabetes are attributed to poor eating habits. Healthy foods does not have to be expensive when it is available. One study showed that consumers could get three servings of fruits and four servings of vegetables daily for an average cost of 64 cents per day (in 1999 dollars).3
Key Findings:Adults
In 2008, 78.3% of Michigan adults consumed inadequate fruits and vegetables.• Inadequate fruit and vegetable consumption decreased with increasing education. Females • (26.6%) were more likely to get an adequate amount than males (16.0%).Nearly 1 in 4 Michigan adults went to a fast food restaurant two or more times a week in 2005.•
YouthIn 2007, 83.0% of Michigan youth consumed inadequate fruits and vegetables.• There were no signifi cant differences by race or gender.• Almost 30% of youth drank at least one non-diet pop or soda a day. There was a signifi cant • difference in soda consumption between males (34.6%) and females (23.1%).
12

Michigan Department of Community Health, 2009
Chapter 3. Nutrition Overweight and Obesity in Michigan
Figure 1. Prevalence of inadequate fruit and vegetable consumption* among adults, 18 years and over in Michigan and United States, 2002 to 2008.
Sources: Michigan Behavioral Risk Factor Survey (BRFS) and CDC Behavioral Risk Factor Surveillance System.*The proportion whose total reported consumption of fruits (including juice) and vegetables was less than fi ve times per day (The national BRFS did not include this question in 2008).
AdultsThe 2005 Dietary Guidelines for Americans1 recommend that adults eat between 1.5 to 2.5 cups of fruit daily and 2.5 to 4 cups of vegetables daily, depending on age, gender, and amount of regular physical activity, see Appendix A. Within a week, adults are advised to choose options from all fi ve of the vegetable subgroups (dark green, orange, legumes, starchy and other vegetables). Eating a diet high in fruits and vegetables is associated with lowering your risk of developing diseases such as cancer.2
Although the 2005 guidelines recommend 4 to 6.5 cups of fruit and vegetables per day, data is still collected based on the Healthy People 2010 goals.4 These goals state that adults should get two servings of fruit and three servings of vegetables per day for a total of fi ve servings.
0
10
20
30
40
50
60
70
80
90
100
2002 2003 2005 2007 2008Year
Prev
alen
ce (%
)
Michigan United States
In 2008, the prevalence of • inadequate fruit and vegetable consumption was 78.3% among Michigan adults.
Females (73.4%) had a lower • prevalence of inadequate fruit and vegetable consumption than males (84.0%).
Consumption of fruits and • vegetables did not differ by race or household income.
Adults who were high school • graduates (83.8%) had a higher prevalence of inadequate fruit and vegetable consumption compared with adults with a college education (73.5%).
13
Michigan Department of Community Health, 2009
Chapter 3. Nutrition Overweight and Obesity in Michigan
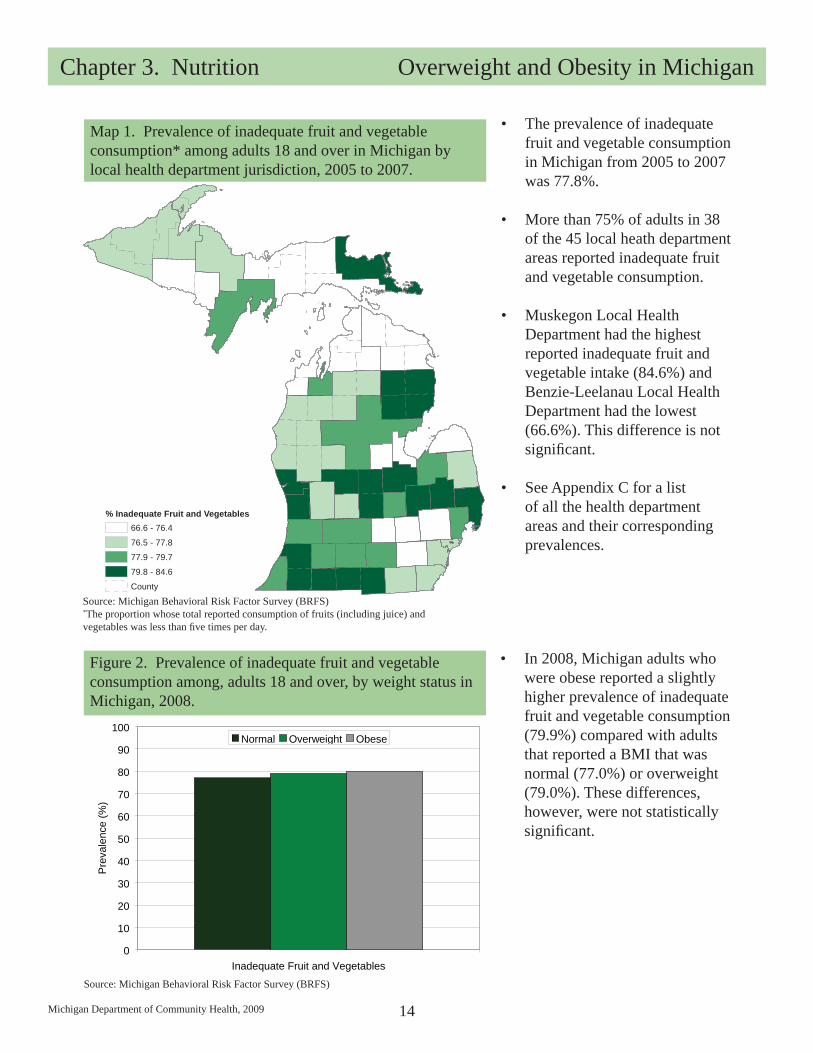
Map 1. Prevalence of inadequate fruit and vegetable consumption* among adults 18 and over in Michigan by local health department jurisdiction, 2005 to 2007.
Source: Michigan Behavioral Risk Factor Survey (BRFS)*The proportion whose total reported consumption of fruits (including juice) and vegetables was less than fi ve times per day.
The prevalence of inadequate • fruit and vegetable consumption in Michigan from 2005 to 2007 was 77.8%.
More than 75% of adults in 38 • of the 45 local heath department areas reported inadequate fruit and vegetable consumption.
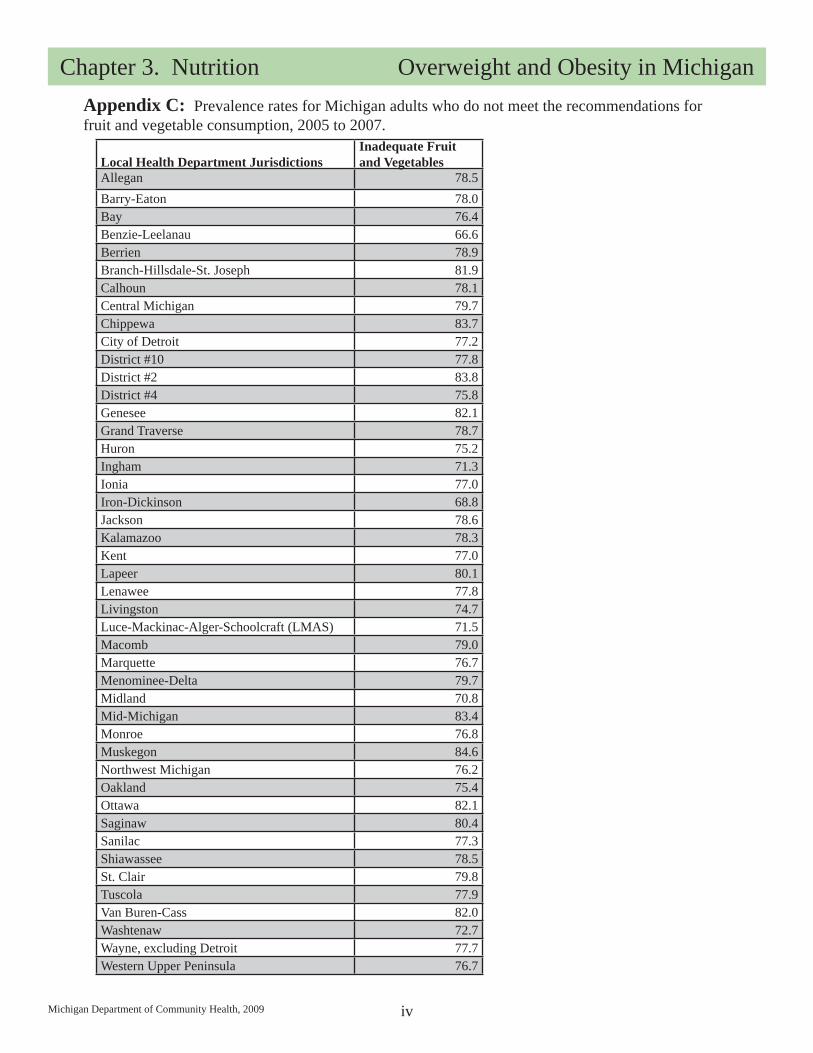
Muskegon Local Health • Department had the highest reported inadequate fruit and vegetable intake (84.6%) and Benzie-Leelanau Local Health Department had the lowest (66.6%). This difference is not signifi cant.
See Appendix C for a list • of all the health department areas and their corresponding prevalences.
0
10
20
30
40
50
60
70
80
90
100
Inadequate Fruit and Vegetables
Prev
alen
ce (%
)
Normal Overweight Obese
Source: Michigan Behavioral Risk Factor Survey (BRFS)
Figure 2. Prevalence of inadequate fruit and vegetable consumption among, adults 18 and over, by weight status in Michigan, 2008.
In 2008, Michigan adults who • were obese reported a slightly higher prevalence of inadequate fruit and vegetable consumption (79.9%) compared with adults that reported a BMI that was normal (77.0%) or overweight (79.0%). These differences, however, were not statistically signifi cant.
14
% Inadequate Fruit and Vegetables66.6 - 76.4
76.5 - 77.8
77.9 - 79.7
79.8 - 84.6
County

Michigan Department of Community Health, 2009
Chapter 3. Nutrition Overweight and Obesity in Michigan
0
5
10
15
20
25
30
35
< 1 1-2 2-3 3+Time per Week
Perc
ent O
bese
(%)
Figure 4. Prevalence of obesity by frequency of fast food consumption among adults, 18 and over, in Michigan, 2005.
Sources: Michigan Behavioral Risk Factor Survey (BRFS).
The prevalence of obesity • increased with increased number of visits to fast food restaurants in a week from less than once a week (24.0%) to more than three visits a week (32.9%).
The odds of being obese were • about 60% greater for those eating fast food two or more times a week compared to those consuming it less frequently.
The most frequent reason • people reported going to a fast food restaurant was speed and convenience (62.7%).
In 2005, nearly one-in-four • (24.9%) Michigan adults went to a fast food restaurant two or more times a week.
The prevalence of fast food • consumption for males (30.4%) was higher than for females (20.0%) and blacks (30.3%) was higher than whites (23.9%).
There were no differences by • education but prevalence did decrease with age from 36.5% of 18 to 24 year-olds to 11.3% of those aged 65 and older.
0
5
10
15
20
25
30
Never < 1/month
< 1 1 2 3 4Times per Week
Perc
ent (
%)
Figure 3. Prevalence of fast food consumption among adults, 18 and over, in Michigan, 2005.
Sources: Michigan Behavioral Risk Factor Survey (BRFS).
Fast FoodThe consumption of fast food, a recent trend in the American lifestyle, is a suggested contributor to the rise in obesity.5 Meals consumed away from home tend to be low in fruits and vegetables, generously portioned, served in combination packages, and offered with sugar-sweetened beverages. It stands to reason that today, eating away from home can make it diffi cult to follow the current evidence-based dietary advice. See Appendix G for the survey question used in this analysis.The proportion of all food expenditures that represent meals consumed out of the home has increased from 25% in 1957 to 49% in 2007. Of the meals and snacks consumed out of the home the proportion of sales that were from fast food restaurants increased from 5% in 1958 to 37% in 2007.3
15
Michigan Department of Community Health, 2009
Chapter 3. Nutrition Overweight and Obesity in Michigan
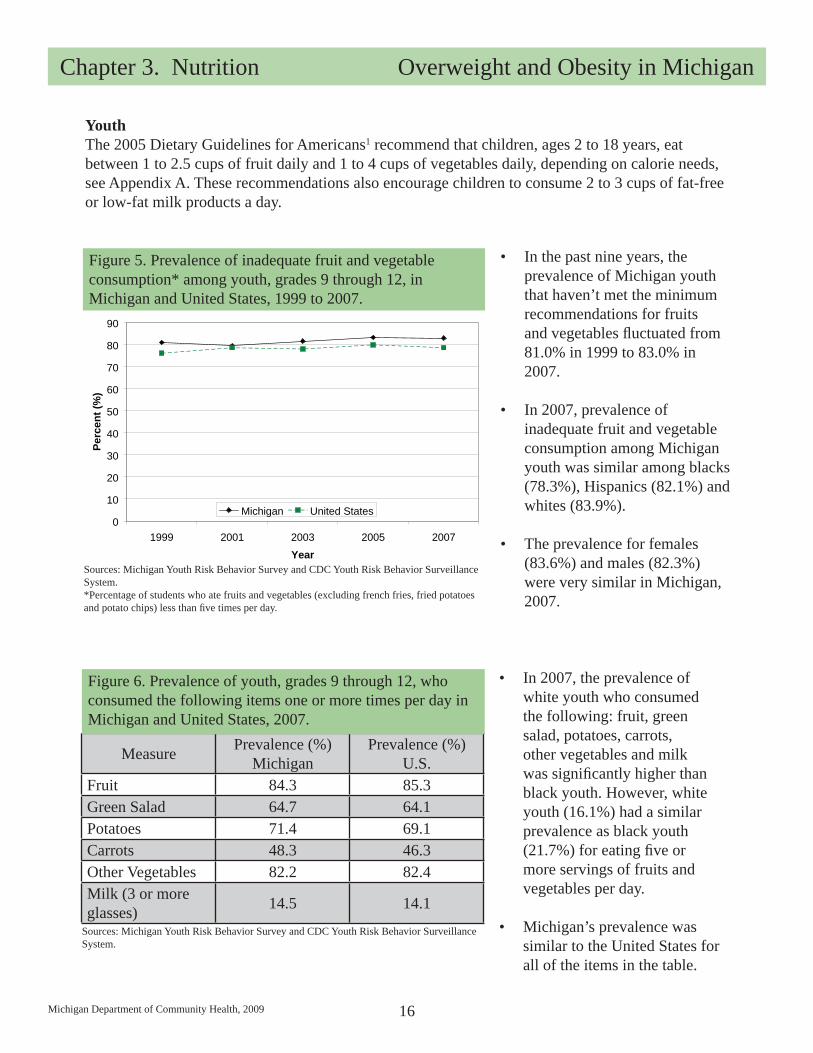
Figure 5. Prevalence of inadequate fruit and vegetable consumption* among youth, grades 9 through 12, in Michigan and United States, 1999 to 2007.
Sources: Michigan Youth Risk Behavior Survey and CDC Youth Risk Behavior Surveillance System.*Percentage of students who ate fruits and vegetables (excluding french fries, fried potatoes and potato chips) less than fi ve times per day.
In the past nine years, the • prevalence of Michigan youth that haven’t met the minimum recommendations for fruits and vegetables fl uctuated from 81.0% in 1999 to 83.0% in 2007.
In 2007, prevalence of • inadequate fruit and vegetable consumption among Michigan youth was similar among blacks (78.3%), Hispanics (82.1%) and whites (83.9%).
The prevalence for females • (83.6%) and males (82.3%) were very similar in Michigan, 2007.
0
10
20
30
40
50
60
70
80
90
1999 2001 2003 2005 2007Year
Perc
ent (
%)
Michigan United States
YouthThe 2005 Dietary Guidelines for Americans1 recommend that children, ages 2 to 18 years, eat between 1 to 2.5 cups of fruit daily and 1 to 4 cups of vegetables daily, depending on calorie needs, see Appendix A. These recommendations also encourage children to consume 2 to 3 cups of fat-free or low-fat milk products a day.
Measure Prevalence (%)Michigan
Prevalence (%)U.S.
Fruit 84.3 85.3Green Salad 64.7 64.1Potatoes 71.4 69.1Carrots 48.3 46.3Other Vegetables 82.2 82.4Milk (3 or more glasses) 14.5 14.1
Figure 6. Prevalence of youth, grades 9 through 12, who consumed the following items one or more times per day in Michigan and United States, 2007.
Sources: Michigan Youth Risk Behavior Survey and CDC Youth Risk Behavior Surveillance System.
In 2007, the prevalence of • white youth who consumed the following: fruit, green salad, potatoes, carrots, other vegetables and milk was signifi cantly higher than black youth. However, white youth (16.1%) had a similar prevalence as black youth (21.7%) for eating fi ve or more servings of fruits and vegetables per day.
Michigan’s prevalence was • similar to the United States for all of the items in the table.
16

Michigan Department of Community Health, 2009
Chapter 3. Nutrition Overweight and Obesity in Michigan
Measure Prevalence (%)Michigan
Prevalence (%)U.S.
Total 28.9 33.8
Male 34.6 38.6
Female 23.1 29.0
Black 25.8 37.6
White 29.9 34.0
Hispanic 27.2 33.4
Figure 7. Prevalence of youth, grades 9 through 12, that drank soda or pop* one or more times per day in the past week in Michigan and United States, 2007.
* Percentage of students who drank a can, bottle, or glass of soda or pop (not including diet soda or diet pop) at least one time per day during the seven days before the survey.Sources: Michigan Youth Risk Behavior Survey and CDC Youth Risk Behavior Surveillance System.
In 2007, the prevalence of • Michigan youth that drank at least one pop per day (28.9%) was lower than the United States youth (33.8%) prevalence.
There was a statistically • signifi cant difference between prevalence of male (34.6%) and female (23.1%) soda or pop drinkers in Michigan.
The racial pattern between • Michigan and the United States for soda consumption is different.
Sugar-Sweetened BeveragesSugars can be found naturally in nutrient dense foods such as fruit or milk. Sugars can also be added to beverages such as soda, however, soda provides calories but few or no nutrients. The more sugar-sweetened beverages a person consumes, the more likely he or she is to be overweight.6
17

Michigan Department of Community Health, 2009
Chapter 3. Nutrition Overweight and Obesity in Michigan
Table of AppendicesAppendix A: Fruit and vegetable recommendations by age, gender and activity level ............................. iiAppendix B: A map of Michigan showing the local health department jurisdictions .............................. iiiAppendix C: Inadequate fruit and vegetable consumption prevalence rates for Michigan adults, 2005 to 2007 ........................................................................................................................ ivAppendix D: The Healthy People 2010 goals related to nutrition. ............................................................ vAppendix E: List of abbreviations. ........................................................................................................... vi Appendix F: Methods. ............................................................................................................................. viiAppendix G: Data sources. ..................................................................................................................... viiiAppendix H: References ........................................................................................................................... ix
i
Michigan Department of Community Health, 2009
Chapter 3. Nutrition Overweight and Obesity in Michigan
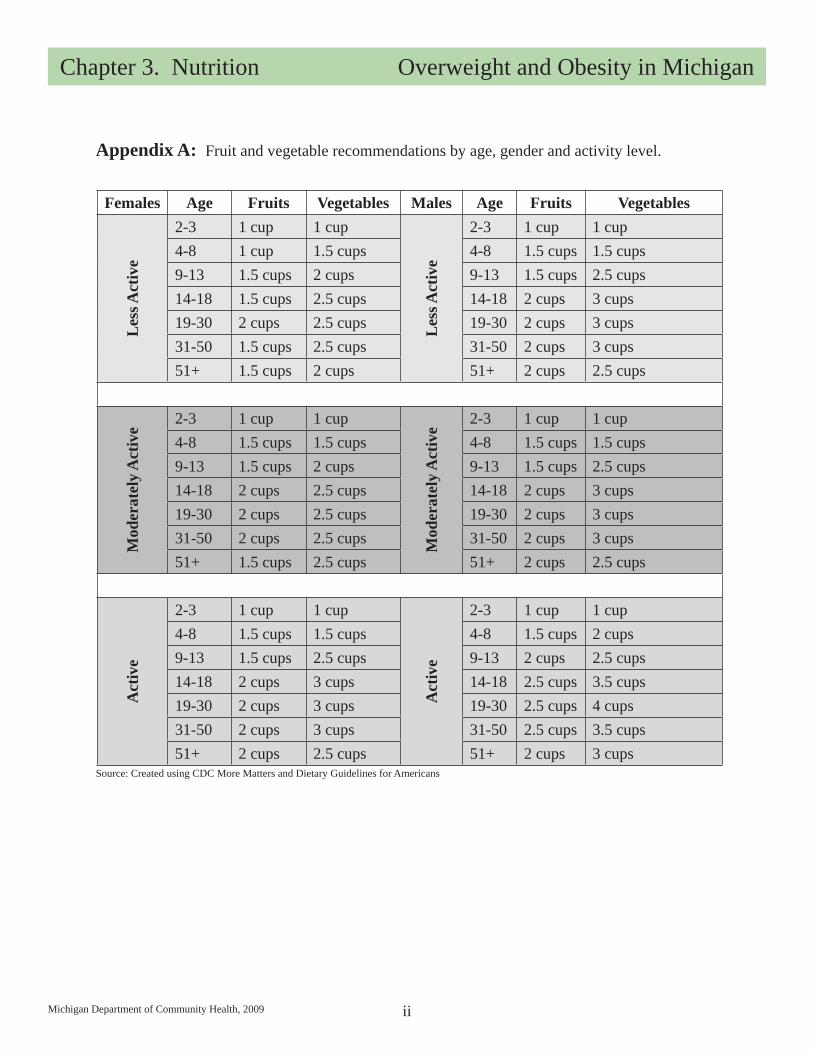
Females Age Fruits Vegetables Males Age Fruits Vegetables
Les
s Act
ive
2-3 1 cup 1 cup
Les
s Act
ive
2-3 1 cup 1 cup4-8 1 cup 1.5 cups 4-8 1.5 cups 1.5 cups9-13 1.5 cups 2 cups 9-13 1.5 cups 2.5 cups14-18 1.5 cups 2.5 cups 14-18 2 cups 3 cups19-30 2 cups 2.5 cups 19-30 2 cups 3 cups31-50 1.5 cups 2.5 cups 31-50 2 cups 3 cups51+ 1.5 cups 2 cups 51+ 2 cups 2.5 cups
Mod
erat
ely
Act
ive
2-3 1 cup 1 cupM
oder
atel
y A
ctiv
e2-3 1 cup 1 cup
4-8 1.5 cups 1.5 cups 4-8 1.5 cups 1.5 cups9-13 1.5 cups 2 cups 9-13 1.5 cups 2.5 cups14-18 2 cups 2.5 cups 14-18 2 cups 3 cups19-30 2 cups 2.5 cups 19-30 2 cups 3 cups31-50 2 cups 2.5 cups 31-50 2 cups 3 cups51+ 1.5 cups 2.5 cups 51+ 2 cups 2.5 cups
Act
ive
2-3 1 cup 1 cup
Act
ive
2-3 1 cup 1 cup4-8 1.5 cups 1.5 cups 4-8 1.5 cups 2 cups9-13 1.5 cups 2.5 cups 9-13 2 cups 2.5 cups14-18 2 cups 3 cups 14-18 2.5 cups 3.5 cups19-30 2 cups 3 cups 19-30 2.5 cups 4 cups31-50 2 cups 3 cups 31-50 2.5 cups 3.5 cups51+ 2 cups 2.5 cups 51+ 2 cups 3 cups
Appendix A: Fruit and vegetable recommendations by age, gender and activity level.
Source: Created using CDC More Matters and Dietary Guidelines for Americans
ii

Michigan Department of Community Health, 2009
Chapter 3. Nutrition Overweight and Obesity in Michigan
District#10
L. M. A. S.*
District #2
District #4
Central Michigan
Kent
Marquette
Western Upper Peninsula
Mid-Michigan
Chippewa
Huron
Iron-Dickinson
Sanilac
Menominee-Delta
Ionia
Bay
AlleganOakland
Tuscola
Barry-Eaton
Saginaw
Lapeer
Northwest Michigan
St. Clair
JacksonCalhoun
Lenawee
Ottawa
Berrien
Ingham
Monroe
Genesee
Van Buren-Cass
Midland
Wayne
Branch-Hillsdale-St. Joseph
Macomb
Kala-mazoo
Muskegon
BenzieLeelanau Grand
Traverse
DetroitWashtenaw
Livingston
Shiaw-assee
Appendix B: The Local Health Department Jurisdictions in Michigan.
* Luce-Mackinac-Alger-Schoolcraft
iii
Michigan Department of Community Health, 2009
Chapter 3. Nutrition Overweight and Obesity in Michigan
Local Health Department JurisdictionsInadequate Fruit and Vegetables
Allegan 78.5Barry-Eaton 78.0Bay 76.4Benzie-Leelanau 66.6Berrien 78.9Branch-Hillsdale-St. Joseph 81.9Calhoun 78.1Central Michigan 79.7Chippewa 83.7City of Detroit 77.2District #10 77.8District #2 83.8District #4 75.8Genesee 82.1Grand Traverse 78.7Huron 75.2Ingham 71.3Ionia 77.0Iron-Dickinson 68.8Jackson 78.6Kalamazoo 78.3Kent 77.0Lapeer 80.1Lenawee 77.8Livingston 74.7Luce-Mackinac-Alger-Schoolcraft (LMAS) 71.5Macomb 79.0Marquette 76.7Menominee-Delta 79.7Midland 70.8Mid-Michigan 83.4Monroe 76.8Muskegon 84.6Northwest Michigan 76.2Oakland 75.4Ottawa 82.1Saginaw 80.4Sanilac 77.3Shiawassee 78.5St. Clair 79.8Tuscola 77.9Van Buren-Cass 82.0Washtenaw 72.7Wayne, excluding Detroit 77.7Western Upper Peninsula 76.7
Appendix C: Prevalence rates for Michigan adults who do not meet the recommendations for fruit and vegetable consumption, 2005 to 2007.
iv

Michigan Department of Community Health, 2009
Chapter 3. Nutrition Overweight and Obesity in Michigan
(Objective 19-5) Increase the proportion of persons aged 2 years and older who consume at least two daily servings of fruit to 75%.
(Objective 19-6) Increase the proportion of persons aged 2 years and older who consume at least three daily servings of vegetables, with at least one-third being dark green or orange vegetables to 50%.
(Objective 19-7) Increase the proportion of persons aged 2 years and older who consume at least six daily servings of grain products, with at least three being whole grains to 50%.
(Objective 19-8) Increase the proportion of persons aged 2 years and older who consume less than 10 percent of calories from saturated fat to 75%.
(Objective 19-9) Increase the proportion of persons aged 2 years and older who consumer no more than 30 percent of calories from total fat to 75%.
(Objective 19-10) Increase the proportion of persons aged 2 years and older who consume 2,400mg or less of sodium daily to 65%.
(Objective 19-11) Increase the proportion of persons aged 2 years and older who meet dietary recommendations for calcium to 75%.
(Objective 19-12) Reduce iron defi ciency among young children and females of childbearing age to 5% of children aged 1 to 2 years, 1% for children aged 3 to 4 years and 7% for nonpregnant females aged 12 to 49 years.
(Objective 19-13) Reduce anemia among low-income pregnant females in their third trimester to 20%.
(Objective 19-14) (Developmental) Reduce iron defi ciency among pregnant females.
(Objective 19-15) (Developmental) Increase the proportion of children and adolescents aged 6 to 19 years whose intake of meals and snacks at school contributes to good overall dietary quality.
(Objective 19-16) Increase the proportion of worksites that offer nutrition or weight management classes or counseling to 85%.
(Objective 19-17) Increase the proportion of physician offi ce visits made by patients with a diagnosis of cardiovascular disease, diabetes, or hyperlipidemia that include counseling or education related to diet and nutrition to 75%.
(Objective 19-18) Increase food security among U.S. households to 94% and in so doing reduce hunger.
Source: Healthy People 2010, Chapter 19.http://www.healthypeople.gov/Document/HTML/Volume2/19Nutrition.htm
Appendix D: Healthy People 2010 goals related to nutrition.
v

Michigan Department of Community Health, 2009
Chapter 3. Nutrition Overweight and Obesity in Michigan
BMI ..................... Body Mass IndexBRFS ................... Behavioral Risk Factor SurveyCDC .................... Centers for Disease Control and PreventionL.M.A.S. ............. Luce-Mackinac-Alger-SchoolcraftMDCH................. Michigan Department of Community HealthYRBS .................. Youth Risk Behavior Survey
Appendix E: List of abbreviations.
vi

Michigan Department of Community Health, 2009
Chapter 3. Nutrition Overweight and Obesity in Michigan
Appendix F: Methods
Prevalence =Number of existing cases of disease
Total population
Prevalence
Prevalence is the proportion of individuals in a population who have the disease or condition at a point in time or during a given time period. It is often used to describe the health burden on a given population. Prevalence is computed by dividing the number of existing cases at a particular point or period in time by the total population from which the cases came. It is often multiplied by 100 and expressed as a percent. In this report, prevalence estimates are generated in the analysis of data from the Behavioral Risk Factor Surveillance System and Youth Risk Behavior Survey.
For example, 25.1% of adults in Michigan do not participate in leisure-time physical activity. This is the prevalence of no leisure-time physical activity. The number of survey respondents who reported no leisure-time physical activity was divided by the total number of respondents that were asked the question. This proportion is also weighted to adjusted for the survey design and nonresponse.
Geographical Information System Mapping
Environmental Systems Research Institute’s (ESRI) ArcGIS Map was used to create the maps presented in the report. Data used in the maps were from the Behavioral Risk Factor Survey. Analyses of the data used in the maps were performed externally from the ArcGIS program.
vii

Michigan Department of Community Health, 2009
Chapter 3. Nutrition Overweight and Obesity in Michigan
Name: Michigan Behavioral Risk Factor Surveillance SystemAcronym: BRFSSBasic Purpose and History: The BRFSS is a source of estimates of the prevalence of certain health behaviors, conditions, and practices associated with leading causes of death. Michigan has conducted the BRFSS survey since 1987. Data Collection Process: Annual estimates are based on data collected by telephone from a sample of Michigan adults selected using random-digit dial methods. It is a population-based representative sample of non-institutionalized Michigan residents. The data are weighted to represent estimates for the general adult population. BRFSS interviewers use a Computer Assisted Telephone Interviewing (CATI) system, which provides the interviewer with prompts. The interviewer types the respondent’s responses directly into the computer, providing quality control and minimizing interviewer error.Population Included: A record is a completed telephone interview. The selected respondent must be a Michigan resident, 18 years of age or older who lives in a private residence and has a telephone. One randomly selected adult from a household is interviewed.Additional Information: For more information about the BRFSS and national data for comparison, visit http://www.cdc.gov/brfss/index.htm. For a complete report from the Michigan survey, visit http://www.michigan.gov/brfs.
Fast Food Questions: The next questions are about eating out. How often do you usually go to a fast food restaurant?• When you go to a fast food restaurant, what is the main reason you choose this type of a • restaurant instead of another type?
•
Name: Youth Risk Behavior SurveyAcronym: YRBSBasic Purpose and History: YRBS was designed to determine the prevalence of health-risk behaviors among high school students. It was also designed to monitor trends and progress toward achieving national health objectives. Michigan fi rst administered the survey in 1997. Data Collection Process: A two-stage cluster sampling method is implemented in which public schools with grades 9 through 12 are fi rst selected, followed by classes within those schools. The questionnaire is self-administered by students. The survey is conducted every odd year at the national, state and local levels.Population Included: Public and private school students in grades 9 through 12 are eligible to participate.Additional Information: For more information about the YRBS and national data for comparison, visit http://www.cdc.gov/HealthyYouth/yrbs/index.htm.
Appendix G: Data Sources
viii

Michigan Department of Community Health, 2009
Chapter 3. Nutrition Overweight and Obesity in Michigan
ix
Appendix G: References
U.S. Department of Health and Human Services and U.S. Department of Agriculture. “Dietary 1. Guidelines for Americans, 2005.” 6th Edition, Washington, DC: U.S. Government Printing Offi ce, January 2005.
http://www.cdc.gov/physicalactivity/everyone/health/index.html. 2. U.S. Department of Health and Human Services and Centers for Disease Control and Prevention, Division of Nutrition, Physical Activity and Obesity. Research to Practice Series, No. 1. “Can eating fruits and vegetables help people to manage their weight?” 3. American Heart Association. “Heart Disease and Stroke Statistics – 2009 Update. A Report From the American Heart Association Statistics Committee and Stroke Statistics Subcommittee.” Circulation. 2009;119:e1-e161.4. U.S. Department of Health and Human Services. Healthy People 2010: Understanding and Improving Health. 2nd ed. Washington, DC: U.S. Government Printing Offi ce, November 2000. 5. Jeffery RW and French SA. “Epidemic Obesity in the United States: Are Fast Foods and Television Viewing Contributing?” Am J Public Health. 1998;88:277-280.6. U.S. Department of Health and Human Services and Centers for Disease Control and Prevention, Division of Nutrition, Physical Activity and Obesity. Research to Practice Series, No. 2. “Does Drinking Beverages with Added Sugars Increase the Risk of Overweight?” http://www.cdc.gov/nchs/products/pubs/pubd/hestats/physicalactivity/physicalactivity.htm

MDCH is an equal opportunity employer, service and program provider.