p poorrtt hheeddllaanndd ppoorrtt …
TRANSCRIPT

PPPOOORRRTTT HHHEEEDDDLLLAAANNNDDD PPPOOORRRTTT AAAUUUTTTHHHOOORRRIIITTTYYY 222000000222 AAANNNNNNUUUAAALLL RRREEEPPPOOORRRTTT
- 1 -
TTAABBLLEE OOFF CCOONNTTEENNTTSS
HISTORY.................................................................................................................................................................2
HIGHLIGHTS .........................................................................................................................................................3
STATISTICAL ABSTRACT ..................................................................................................................................3
CHAIRMAN & CEO’S REPORT..........................................................................................................................4
CORPORATE PLAN ..............................................................................................................................................6
PERSONNEL .........................................................................................................................................................11
OVERVIEW OF PORT OPERATIONS .............................................................................................................14
DIRECTORS’ REPORT.......................................................................................................................................18
DIRECTORS’ DECLARATION..........................................................................................................................23
FINANCIAL REPORT – 30 JUNE 2002 .............................................................................................................25
NOTES TO AND FORMING PART OF THE ACCOUNTS ............................................................................31
2002/03 FINANCIAL ESTIMATES.....................................................................................................................49
PERFORMANCE INDICATORS........................................................................................................................52
STATISTICAL INFORMATION 2002 ...............................................................................................................55

PPPOOORRRTTT HHHEEEDDDLLLAAANNNDDD PPPOOORRRTTT AAAUUUTTTHHHOOORRRIIITTTYYY 222000000222 AAANNNNNNUUUAAALLL RRREEEPPPOOORRRTTT
- 2 -
HHIISSTTOORRYY The coast of Western Australia was visited by many exploring parties prior to the foundation of the colony in 1829. However, it was not until 1863 that the vessel ‘Mystery’ dropped anchor in a mangrove inlet, which was given the name of Port Hedland after the Master of the ‘Mystery’, Captain Peter Hedland. Towards the end of the century it became apparent that the pastoral industry in the Eastern Pilbara needed a port, and in 1896 the first Port Hedland jetty was begun. With the discovery of gold in the Marble Bar area a few years later, the jetty was extended in 1908, and a railway between Marble Bar and Port Hedland was completed in 1911. From then until the late 1930s, the port was mainly used for the import of stores and producer items for the local industries, and the export of pearl shell, wool, livestock, gold, tin and small amounts of copper. After the Second World War, the port continued to serve the pastoral industry, and began to export significant quantities of manganese. However, in 1965 the iron ore industry, as we know it today, began in the port, when Goldsworthy Mining Ltd (now BHP Billiton Iron Ore) dredged an approach channel and turning basin for ships of up to 65,000 Dead Weight Tonnes (DWT). At the same time the Leslie Salt Company (now Dampier Salt Ltd) commenced development of a solar salt industry. A new land backed wharf was built to cater for salt exports and to improve the facilities available for the import of fuel and producer items. Subsequently the Mt. Newman Mining Company (now BHP Billiton Iron Ore) chose Port Hedland as its export port, and further dredging and development took place to allow the use of the port by very large bulk carriers of up to 120,000 DWT. With experience, the size of vessels was increased, and vessels of up to 315m in length, and 185,000 DWT, were accepted. In 1975/76 further work was carried out when extensions to the turning basin and some channel widening took place, allowing ships of up to 225,000 DWT to be handled. In 1986 major capital dredging was undertaken to deepen the channel by 2.5m. In conjunction with a computerised under keel clearance programme, (the first in an Australian port) this allowed the port to handle ships up to 330m, and 260,000 DWT. The channel at Port Hedland is now 20 nautical miles in length for outward vessels, varying in both width and depth with minima of 183m and 14.2m respectively. Gated pairs of synchronised beacons, which are maintained and owned by the Port Authority mark the channel to Port limits 10 nautical miles offshore. The Outer Channel (beyond Port Limits) which varies in width from 250m to 470m is marked by 13 synchronised beacons owned and maintained by the Australian Maritime Safety Authority. Today the Port continues to serve the mining and pastoral industries of the Pilbara. Iron ore continues to be the dominant export trade but also important to the regional economy are exports of salt, HBI, manganese, chromite, feldspar, copper concentrates and livestock.
PPPOOORRRTTT HHHEEEDDDLLLAAANNNDDD PPPOOORRRTTT AAAUUUTTTHHHOOORRRIIITTTYYY 222000000222 AAANNNNNNUUUAAALLL RRREEEPPPOOORRRTTT
- 3 -
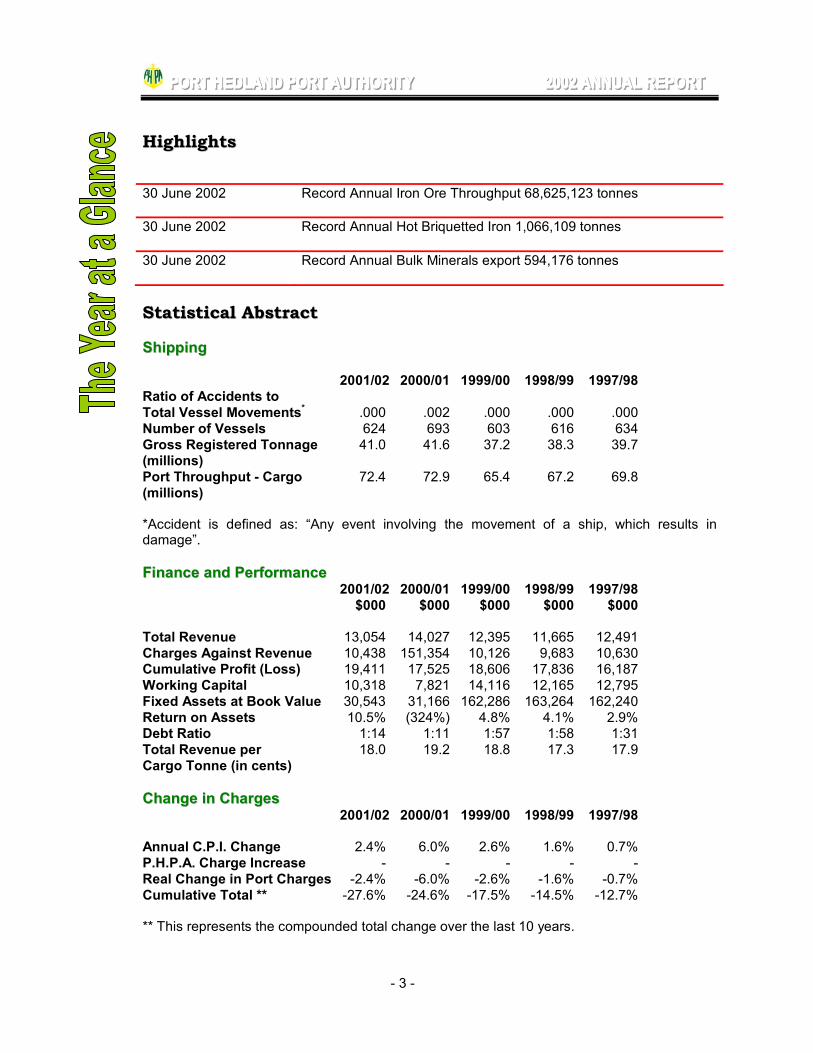
HHiigghhlliigghhttss 30 June 2002
Record Annual Iron Ore Throughput 68,625,123 tonnes
30 June 2002 Record Annual Hot Briquetted Iron 1,066,109 tonnes
30 June 2002 Record Annual Bulk Minerals export 594,176 tonnes
SSttaattiissttiiccaall AAbbssttrraacctt SShhiippppiinngg 2001/02 2000/01 1999/00 1998/99 1997/98 Ratio of Accidents to Total Vessel Movements* .000 .002 .000 .000 .000 Number of Vessels 624 693 603 616 634 Gross Registered Tonnage 41.0 41.6 37.2 38.3 39.7 (millions) Port Throughput - Cargo 72.4 72.9 65.4 67.2 69.8 (millions) *Accident is defined as: “Any event involving the movement of a ship, which results in damage”. FFiinnaannccee aanndd PPeerrffoorrmmaannccee 2001/02 2000/01 1999/00 1998/99 1997/98 $000 $000 $000 $000 $000 Total Revenue 13,054 14,027 12,395 11,665 12,491 Charges Against Revenue 10,438 151,354 10,126 9,683 10,630 Cumulative Profit (Loss) 19,411 17,525 18,606 17,836 16,187 Working Capital 10,318 7,821 14,116 12,165 12,795 Fixed Assets at Book Value 30,543 31,166 162,286 163,264 162,240 Return on Assets 10.5% (324%) 4.8% 4.1% 2.9% Debt Ratio 1:14 1:11 1:57 1:58 1:31 Total Revenue per 18.0 19.2 18.8 17.3 17.9 Cargo Tonne (in cents) CChhaannggee iinn CChhaarrggeess 2001/02 2000/01 1999/00 1998/99 1997/98 Annual C.P.I. Change 2.4% 6.0% 2.6% 1.6% 0.7% P.H.P.A. Charge Increase - - - - - Real Change in Port Charges -2.4% -6.0% -2.6% -1.6% -0.7% Cumulative Total ** -27.6% -24.6% -17.5% -14.5% -12.7% ** This represents the compounded total change over the last 10 years.
PPPOOORRRTTT HHHEEEDDDLLLAAANNNDDD PPPOOORRRTTT AAAUUUTTTHHHOOORRRIIITTTYYY 222000000222 AAANNNNNNUUUAAALLL RRREEEPPPOOORRRTTT
- 4 -
CChhaaiirrmmaann && CCEEOO’’ss RReeppoorrtt The Authority enjoyed another very good trade year with total throughput reaching 72.4 million tonnes. Although this was less than budgeted and less by about 0.5 million tonnes than last year’s record, it was, nonetheless, a very good result. New records were set for iron ore exports that amounted to 68.6 million tonnes, miscellaneous bulk minerals totalling 594,176 tonnes and Hot Briquetted Iron (HBI) totalling 1,066,109 tonnes. Both HBI and salt were well down on budget but we are expecting that the next year will see results that are closer to the forecasts for both products. We were once again able to hold our charges at previous levels. This was the fourteenth consecutive year that the Authority has managed to do this and the benefits to shippers have been significant over those years. Although revenue was less than budgeted, careful management of expenditure yielded good profit and rate of return results. There were several issues of concern for the Port Authority arising from the siltation problems and dredging maintenance activities of the previous financial year. Following an independent study of the issues, the Authority has decided to upgrade its water level (tide) monitoring equipment. It also accepted advice on the updating hydrographic survey methods and will be considering a recommendation for a new hydrographic survey contract based on a new specification at its July 2002 Board Meeting. Recommendations on the structure of future dredging maintenance contracts will also be adopted. On 29 December 2001 we reached the 30th anniversary of using helicopters for marine pilot transfers. Port Hedland was a leader in the use of helicopters for this type of service and 30 years of safe operations is a significant achievement. The helicopter service has proven to be safer, more efficient and more economical than using a pilot boat. The Port Authority is preparing to celebrate this achievement in a joint ceremony with the opening of its shiploader on No 1 Berth in July 2002. Commissioning of the shiploader on No 1 Berth was completed this year. Despite some mechanical and electrical faults during the year, the performance of the shiploader has progressively improved so that we can now look forward with confidence to the benefits that it promised. After a lengthy tender period, the Authority awarded a contract for asset maintenance to Cervan Marine, a local firm. The three year contract is to commence on 1 July 2002. Through the contract the Port Authority will apply modern asset management techniques to ensure that proper provision is made for the maintenance of its assets. Work commenced on a Port Development Planning Study in 2002. From the study the Port Authority is seeking a master plan to guide future development and to protect the options for future development of the port. The plan is being developed in consultation with community interest groups and will be completed during the coming year. BHP Billiton’s Iron Ore’s announcement that its Products and Capacity Expansion (PACE) Project was to proceed was very pleasing news. BHP Billiton Iron Ore’s proposed development within the port will provide the capacity to lift its iron ore exports to about 90 million tonnes per annum by 2007.
PPPOOORRRTTT HHHEEEDDDLLLAAANNNDDD PPPOOORRRTTT AAAUUUTTTHHHOOORRRIIITTTYYY 222000000222 AAANNNNNNUUUAAALLL RRREEEPPPOOORRRTTT
- 5 -
Hope Downs Management Services Pty Ltd progressed its bankable feasibility study during the year. It is understood that the near complete study shows the project to be sound both technically and financially which is very encouraging news. If the project proceeds, exports of iron ore from Hope Downs could commence in 2006 and could rise to about 25 million tonnes per annum by the end of the decade. The Port Authority acknowledges the efforts of Captain Brian Digby who retired from service as a Pilot to the port on 31 March 2002. Captain Digby was first appointed as a pilot with Port Hedland Port Authority in November 1979 and retired 22 years later. Captain Digby was the first Pilot to retire whilst in service to the port. We would also like to take the opportunity to acknowledge the contribution made by Peter Gooch over 25 years of service to the Port Authority as a Port Marine Officer. Peter retired in December 2001. The appointment of two new senior staff members during the year has brought renewed stability and expertise to the management team. There has been a heavy workload on all staff from the need to support new private sector development proposals and to pursue operational improvements in a number of areas. The efforts of the whole team are much appreciated and they are to be congratulated on their contribution to a good year’s result. We welcome Mr Dean Dalla Valle who was appointed to the Board to replace Mr Netterfield as the Alternate to Mr Derek Miller. The contribution of all directors has been much appreciated during the year. Their leadership and sound decisions have made it possible for the Port Authority to enjoy another successful year. Peter G Hardie Ian M Hutton CHAIRMAN CHIEF EXECUTIVE OFFICER

PPPOOORRRTTT HHHEEEDDDLLLAAANNNDDD PPPOOORRRTTT AAAUUUTTTHHHOOORRRIIITTTYYY 222000000222 AAANNNNNNUUUAAALLL RRREEEPPPOOORRRTTT
- 6 -
CCOORRPPOORRAATTEE PPLLAANN The Authority’s Vision, Mission and Broad Objectives provide guidance in its decision making. These were first adopted in 1999 and are still seen as being relevant and helpful. VVIISSIIOONN To be recognised by customers and other stakeholders as providing the best mix of facilities and services at the Port of Port Hedland. MMIISSSSIIOONN To facilitate trade through the Port of Port Hedland. BBRROOAADD OOBBJJEECCTTIIVVEESS Service Provision The provision of reliable, competitive and efficient port and marine services that meet and are responsive to the needs of users. Port Facilities The provision and maintenance of suitable, reliable and competitive port facilities to meet user needs. Planning and Development Through forward planning, ensure that future development is not unreasonably constrained by external restrictions, effectively meets the needs of expected trades, is coordinated, and efficiently uses the port area. Trade Facilitation Facilitate trade and business opportunities within and through the Port. Financial To establish pricing for users of port services and facilities commensurate with the achievement of the required return on Government investment and consistent with the Authority’s trade facilitation objective. Human Resources To provide a safe, healthy and supportive environment that encourages employees to work with commitment and enthusiasm to achieve corporate objectives. Environment, Community Safety and Health Ensure the impact of development and operational activities within, and adjacent to, the port meet recognised standards for the environment and for community safety and health.

PPPOOORRRTTT HHHEEEDDDLLLAAANNNDDD PPPOOORRRTTT AAAUUUTTTHHHOOORRRIIITTTYYY 222000000222 AAANNNNNNUUUAAALLL RRREEEPPPOOORRRTTT
- 7 -
Community Support Establish and maintain a close relationship with the Port Hedland community in order to win support for current port operations and future developments. AACCHHIIEEVVEEMMEENNTTSS AAGGAAIINNSSTT SSTTAATTEEDD MMAAJJOORR GGOOAALLSS PPLLAANNNNEEDD FFOORR 22000011//22000022 The Authority set a number of major goals for itself for 2001/2002 in its Statement of Corporate Intent submitted to the Minister for Transport. Those goals and the achievements in respect of those goals are detailed below:
GGOOAALLSS AACCHHIIEEVVEEMMEENNTTSS
SSeerrvviiccee PPrroovviissiioonn Introduce improvements to the Dynamic Under Keel Clearance System to allow deeper draft loadings under most situations whilst maintaining or improving the safety of the system of under keel clearance management.
The upgrade to DUKC Series III was successfully implemented.
Continue to monitor the new system of non-exclusive stevedoring licenses to ensure that the needs of customers are satisfied.
Some discontent from customers towards some stevedoring services was noted. The Authority is working with stevedores in accordance with the terms of the licence in an effort to reach a resolution that meets the needs of all parties.
PPoorrtt FFaacciilliittiieess Review the feasibility study for the extension of the No 1 Berth in the light of new information on potential trade increases.
A further review has yielded encouraging results confirming the benefit of the proposed berth extension. A detailed assessment will be completed before proceeding with the project.
Review, in conjunction with the livestock export industry, provision of additional facilities, such as portable races and penning facilities, to improve the efficiency of loading livestock.
The proposed additional facilities were procured and made available for loading during the 2002 winter season.
Finalise the development and implementation of a set of management plans for key assets in order to ensure that the Authority delivers port facilities that meet user needs. These plans are to include a policy statement and are to address the following: Utilities Plant & Vehicles
These were completed during the year.
PPllaannnniinngg aanndd DDeevveellooppmmeenntt In conjunction with the relevant State Agencies and Local Government, complete the preparation of a Port Development Plan that provides for the ultimate development of the harbour and surrounds.
This study is well advanced with phase 1 having been completed and the study programmed for completion by December 2002.
TTrraaddee FFaacciilliittaattiioonn Restructure port charges in the budget year to introduce a berthage charge with commensurate reductions in wharfage. This will be essentially revenue neutral to the Authority but will make charges more equitable thus encouraging shippers.
This was achieved. The new charging regime was generally well accepted.

PPPOOORRRTTT HHHEEEDDDLLLAAANNNDDD PPPOOORRRTTT AAAUUUTTTHHHOOORRRIIITTTYYY 222000000222 AAANNNNNNUUUAAALLL RRREEEPPPOOORRRTTT
- 8 -
GGOOAALLSS AACCHHIIEEVVEEMMEENNTTSS
Include land areas and water frontage for all anticipated future trades in an ultimate development plan that will show potential developers the opportunities at Port Hedland.
As per Planning and Development.
Achieve improvements in the efficiency and effectiveness of port and marine services and facilities as indicated above.
As above.
FFiinnaanncciiaall The budgeted rate of return of 7.5% is greater than the normal target rate of return set by Government for the Port of 6.5%. It is planned that this will be achieved through increases in throughput, without a general increase in charges.
The financial result for the year achieved a RoR of 10.5%. This was accomplished as planned with the higher than anticipated return being largely attributed to a change in asset valuation methodology to deprival values.
CCoorrppoorraattee Continue the development of a shared understanding amongst staff of, and the proper application of, new financial, human resource and supply procedures prepared following proclamation of the Port Authorities Act 1999.
Some good progress was made with respect to this objective.

PPPOOORRRTTT HHHEEEDDDLLLAAANNNDDD PPPOOORRRTTT AAAUUUTTTHHHOOORRRIIITTTYYY 222000000222 AAANNNNNNUUUAAALLL RRREEEPPPOOORRRTTT
- 9 -
MMAAJJOORR GGOOAALLSS PPLLAANNNNEEDD FFOORR 22000022//22000033 The Authority has established for itself the following major goals for 2002/2003. Service Provision Maximise the gains achievable from the latest version of the Dynamic Under Keel Clearance System. The greatest benefit to be achieved from the Series III package is wider time windows during which loaded vessels can depart the port safely. Introduce improved water level monitoring and hydrographic survey procedures that will yield higher quality survey records, and hence greater confidence in available under-keel clearance. Submit application for a 5 year offshore dredge spoil disposal permit to minimise the future likelihood of delays in executing a maintenance dredging program. Work with service providers and customers to resolve concerns about the costs of some privately provided services. Port Facilities Continue to introduce minor improvements to the shiploader to make cleaning of the machine simpler and cheaper with less risk of marine pollution. Construct a 130 metre extension to No 1 Berth to meet the needs of growing mineral and livestock exports. Deepen the berthing pocket at No 1 Berth and its extension by 2 metres to 13.2 metres to allow Panamax vessels to load at all states of the tide. Construct pens for two additional tugs within the existing tug harbour. These are required to meet the growth in the number of iron ore vessels. Investigate the feasibility of providing a limited number of moorings suitable for small commercial craft and, if feasible at an acceptable cost, provide those moorings. Planning and Development Continue the work with BHP Billiton Iron Ore, Hope Downs Management Services Pty Ltd and Newcrest Mining Ltd to advance these companies plans for imminent and future development within the port. In conjunction with the relevant State Agencies and Local Government, complete the preparation of a Port Development Plan that provides for the ultimate development of the harbour and surrounds. This study which is proceeding during the 2001/02 financial year will also provide a strategic plan, consistent with the ultimate development plan, based on trade forecasts for the next 20 years. During 2002/03, it is the intention to seek environmental and planning endorsement for the ultimate development plan to protect the future potential of the port site and to give confidence to future developers.

PPPOOORRRTTT HHHEEEDDDLLLAAANNNDDD PPPOOORRRTTT AAAUUUTTTHHHOOORRRIIITTTYYY 222000000222 AAANNNNNNUUUAAALLL RRREEEPPPOOORRRTTT
- 10 -
Trade Facilitation The retendering of some long term contracts this year at considerable increases in cost, in line with market trends for these services, will make it necessary for the Authority to increase charges. This is the first time since 1987 that the Authority has initiated a change in its pricing regime to generate increased revenue to meet rising costs. The increasing scale of the port’s operations and improved efficiencies have allowed the Port Authority to achieve this enviable record for its customers. The Authority will continue to seek opportunities to improve efficiency in its operations and reduce its costs in future. Seek environmental and planning endorsement for the ultimate development plan to provide guidance to future proponents on opportunities within the port and to provide greater confidence that development will be acceptable. Achieve improvements in the efficiency and effectiveness of port and marine services and facilities as indicated above. Financial The Authority has budgeted to achieve a net profit before tax of $2,283,040 which represents a return of 15% of turnover. This result is marginally below the average over the previous six years. Due to increases in specific contracted services and the need to provide additional tug pens it has been necessary to increase Pilotage and Tonnage fees by 12%. The Authority is cognisant of meeting the Government’s Rate of Return requirements and will endeavor to achieve this without further increases in Port charges. The estimated ROR on the deprival value of assets for the budget year is 10.5% Corporate Review in detail all aspects of the Authority’s Marine Safety Plan to ensure the plan takes into account all emerging issues. Review and update the Authority’s Environmental Management Plan and its safety management plan.

PPPOOORRRTTT HHHEEEDDDLLLAAANNNDDD PPPOOORRRTTT AAAUUUTTTHHHOOORRRIIITTTYYY 222000000222 AAANNNNNNUUUAAALLL RRREEEPPPOOORRRTTT
- 11 -
PPeerrssoonnnneell OOrrggaanniissaattiioonnaall CChhaarrtt
EXECUTIVE SECRETARY
SECURITY OFFICER
PORT MARINE OFFICERS X 5
HARBOUR MASTER
LEADING HAND
MANAGER, TECHNICAL SERVICES
ACCOUNTANT
ADMINISTRATION OFFICER
SYSTEMS ADMIN OFFICER
ACCOUNTS OFFICER
CLERICAL OFFICER
MANAGER, FINANCE & ADMIN
CHIEF EXECUTIVE OFFICER
BOARD

PPPOOORRRTTT HHHEEEDDDLLLAAANNNDDD PPPOOORRRTTT AAAUUUTTTHHHOOORRRIIITTTYYY 222000000222 AAANNNNNNUUUAAALLL RRREEEPPPOOORRRTTT
- 12 -
PPoolliiccyy SSttaatteemmeennttss Employment It is the committed policy of Port Hedland Port Authority to ensure that the talents and resources of employees are utilised to the full and that no job applicant or employee receives less favourable treatment on the grounds of age, sex, marital status, pregnancy, race, family, religious or political conviction, or impairment. In addition, this organisation is committed to promoting equal employment opportunity for all of its employees. The overall responsibility for monitoring the effectiveness of this policy, and for implementing an on-going program of action to make the policy fully operative, is vested in the Chief Executive Officer. It is the responsibility of all employees to accept their personal involvement in the practical application of this policy. Occupational Safety & Health This policy recognises that the safety and health of all employees within this Authority is the responsibility of Authority management. In fulfilling this responsibility, management has a duty to provide and maintain so far as is practicable a working environment that is safe and without risks. The Chief Executive Officer is responsible for the implementation and monitoring of this policy. The safety and health duties of management at all levels are documented, and Authority procedures for training and back-up support are followed. In fulfilling the objectives of this policy, management is committed to regular consultation with employees to ensure that the policy operates effectively, and that safety and health issues are regularly reviewed. In this respect, the Authority has established a Safety & Health Committee comprising of representatives from each section and of representatives of key contractors. Management seeks co-operation from all employees in realising our safety and health objectives and creating a safe work environment. All employees will be advised, in writing, of agreed changes and arrangements for their implementation.

PPPOOORRRTTT HHHEEEDDDLLLAAANNNDDD PPPOOORRRTTT AAAUUUTTTHHHOOORRRIIITTTYYY 222000000222 AAANNNNNNUUUAAALLL RRREEEPPPOOORRRTTT
- 13 -
Workplace Injuries Performance Indicators Notes 2001/02 2000/01 1999/00 1998/99 1997/98 No. of Lost Time Injuries 0 0 0 0 1 Lost Time Injury Frequency (1) 0 0 0 0 29 Rate Estimated Cost of Claims (2) 0 0 0.045 0.019 3.896 Incurred/$100 wages roll Premium Rate (3) 2.84 2.98 3.11 2.08 1.93 Rehabilitation Success Rate (4) - - - - - Notes: These indicators have been prepared from information provided by the underwriters, Riskcover: (1) The Lost Time Injury Frequency Rate is the number of lost time injuries/diseases where one day or more
was lost multiplied by 1,000,000, divided by the total hours worked. (2) Estimated Cost of Claims incurred per $100 wages is the actuarially estimated cost of claims incurred in the
renewal period, adjusted to their present day value, multiplied by 100, divided by total wages. (3) Premium Rate is the total premium paid, multiplied by 100 and divided by total wages. (4) Rehabilitation Success Rate is the number of rehabilitated employees, multiplied by 100 and divided by the
number of eligible employees.
SSttaaffffiinngg New Appointments Mr Matt Reid –Systems Admin/Records Mr Lyle Stanley – Manager Technical Services Captain Lindsay Copeman – Harbour Master Mr Nathan Fry – Port Marine Officer Resignations Ms Teresa Hatch – Manager Technical Services Mr Brett Byfield – Systems Admin/Records Other departures Mr Peter Gooch - Retired FFuuttuurree DDiirreeccttiioonn –– HHuummaann RReessoouurrcceess As is shown above the Port Authority has again experienced a number of changes (on all levels) over the past year. The focus for the coming year is to re-establish a team within the Authority to continue to improve the efficiency and operation of the Port. It is proposed to refine and continue the training program initiated in the prior year for all staff members. It is also proposed to implement the now complete Human Resource policies and the new Performance Enhancement system for all staff. The new Certified Agreement was registered in December of 2001 and will be in place until December of 2004. The overall aim of all of the above objectives is to retain valuable staff by making the Port Authority an attractive and supportive environment in which to work.

PPPOOORRRTTT HHHEEEDDDLLLAAANNNDDD PPPOOORRRTTT AAAUUUTTTHHHOOORRRIIITTTYYY 222000000222 AAANNNNNNUUUAAALLL RRREEEPPPOOORRRTTT
- 14 -
OOvveerrvviieeww ooff PPoorrtt OOppeerraattiioonnss IInnttrroodduuccttiioonn Port Hedland Port Authority is responsible for the control of the port of Port Hedland, which consists of extensive water and land areas within the port limits. The port is located on the coast of North Western Australia and is some 1,650 kilometres by road from Perth, the State Capital. The Authority provides a service to the Pilbara Region of Western Australia and in particular to the mining companies and their customers, as well as servicing the needs of other industries throughout the region. The Authority’s revenue derives from charges in respect to the services that it provides and our historical strategy has been to maintain an efficient and long term financially viable operation, notwithstanding the cyclical nature of the port’s activities. TTrraaddee aanndd SShhiippppiinngg During the 2001/2002 financial year, 624 vessels visited the port compared to 693 during 2000/2001. This trend is for the main part due to the decrease in salt exports of 43% following the sale of Cargill Salt to Dampier Salt and high rainfall affecting salt production. HBI cargoes for the latter half of the year were also down following mechanical failures at the facility. Total tonnage through the port was 72,374,426 tonnes, down 2.98% on the previous year, with iron ore exports accounting for 68,625,123 of this total. The average iron ore cargo was 151,156 tonnes. Total miscellaneous bulk mineral exports from the Port Authority wharves were 594,176 tonnes. With regard to new products, the port began exporting chrome again for Consolidated Minerals. Other export cargoes included cattle and scrap metal. The port also handled import cargoes of bulk liquid petroleum products, acid, containers of magnesium oxide and containers of bulk cement. PPoorrtt OOppeerraattiioonnss The new shiploader at the No 1 Berth is beginning to perform reliably after some earlier setbacks. The shiploader is continuing to be modified to allow for easier access, cleaning, improved air draft and tonnage rate. The maintenance of all Port Authority assets has been contracted to Cervan Marine, a local maintenance contractor. A key element in the contract is the development of a computerised database for all maintenance activities. TTeecchhnnoollooggiiccaall IImmpprroovveemmeennttss Dynamic Under Keel Clearance System (DUKC) The DUKC system was upgraded to Series III. The latest version provides further improvement in available drafts and widening of the sailing window for deep drafted vessels.

PPPOOORRRTTT HHHEEEDDDLLLAAANNNDDD PPPOOORRRTTT AAAUUUTTTHHHOOORRRIIITTTYYY 222000000222 AAANNNNNNUUUAAALLL RRREEEPPPOOORRRTTT
- 15 -
PPoorrtt CClloossuurreess Another quiet cyclone season was experienced with only one cyclone, TC Chris, impacting close to Port Hedland. This cyclone caused closure of the port for 32 hours. The cyclone mooring arrangements for tugs are under review to allow for an improved response when closing and opening the port. PPllaannnniinngg aanndd DDeevveellooppmmeenntt Stage 1 of the Port Development Plan has been completed. The next stage is to seek the views of interested stakeholders to ensure all issues are being considered and that the issues have the correct emphasis. The ore storage area adjacent the No 1 Berth was increased in size to allow for greater storage of miscellaneous bulk mineral products. The No 1 Berth is to be extended a further 130m to the south to allow two vessels alongside at a time. The berthing pocket will also be deepened by 2m to 13.2m to make it the same as the No 3 Berth. Preliminary ground investigations and sediment sampling have been completed. OOccccuuppaattiioonnaall HHeeaalltthh && SSaaffeettyy The Port Authority remains committed to Occupational Health & Safety. The Port Safety Management Plan has been revamped and updated during the year. EEnnvviirroonnmmeenntt Port Hedland Port Authority continues to pursue its commitment to the protection of the environment. In conjunction with stevedores and mining companies stockpile management is carefully monitored to ensure that any dust emissions are kept within acceptable standards. Ongoing road sweeping has proved effective in the control of dust caused by heavy traffic throughout the port. New portable dust monitoring equipment has been purchased to allow a base line dust level to be determined and to allow potential improvements to be recognised and any increase in dust to be dealt with promptly PPiilloott TTrraannssffeerrss Pilot transfers from ships are either by pilot boat or helicopter. Port Hedland was a leader in initiating helicopter hatch-top landings for pilot exchange. To date, 22,399 transfers have been effected by this method. The service commenced during the first year of the Port Authority on 29th December 1971, completing 30 years of safe helicopter operations. When individual ship design precludes use of helicopter for pilot exchange, transfer is effected by pilot boat. Of the year’s 1,218 pilot movements, 1,070 (87.8%) were by helicopter. When required the helicopter service can also be mobilised for medivac and marine search and rescue operations.

PPPOOORRRTTT HHHEEEDDDLLLAAANNNDDD PPPOOORRRTTT AAAUUUTTTHHHOOORRRIIITTTYYY 222000000222 AAANNNNNNUUUAAALLL RRREEEPPPOOORRRTTT
- 16 -
PPoorrtt FFaacciilliittiieess Port Area The port area vested in the Authority comprises the water mass of the Inner Harbour with all of the adjacent shore except for the BHP Billiton Iron Ore leaseholds at Finucane Island and Nelson Point. To seaward, the port’s boundary is delineated by an arc of 10 nautical miles radius centred upon Hunt Point (at the entrance to the Inner Harbour) and terminating at the high water mark at the shore line to the east and west of the port. A Pilotage Area, which lies beyond the boundaries of the port to seaward within an arc of 20 nautical miles radius from Hunt Point, has been defined by the Port Authorities Act 1999. This allows the Authority to control the movement of piloted ships within this extended area. Port Hedland Port Authority Berths Numbers 1 and 3 Berths, owned and controlled by the Authority, have a berth face length of 213m and 183m respectively. No 1 Berth basin is dredged to 11.2m below chart datum, while No 3 Berth basin is dredged to 13.2m. Oil lines, for both oil imports and ships' bunkers (diesel only), lines for sulphuric acid import, fresh water lines and electricity, are available at each berth. Both berths are suitable for use by general cargo vessels, tankers and rig tenders. The new shiploading system on No 1 Berth has a capacity of 1,000 tonnes per hour (tph) and is operated by licensed stevedores, while on No 3 Berth a bulk salt loader of 2,200 tph capacity is owned and operated by Dampier Salt Ltd. Warehouses and sheds providing 1,750 square metres of undercover storage are available adjacent to No 3 Berth, together with some 5 hectares of open storage. Private Berths The length of BHP Billiton Iron Ore Nelson Point Berth is 658m and the berth pocket alongside is 679m x 65m with a depth of 19m below chart datum. Two 315m length vessels may be simultaneously berthed and loaded by either of the two 8,500 tph rated shiploaders. BHP Billiton Iron Ore Finucane Island Berth is sited on the western side of the harbour with a berth pocket of 370m x 61m and a depth of 17m. The loader is rated at 4,500 tph. Vessels up to 170,000 DWT and 314m in length may load to a guaranteed departure draft of 16.3m. BHP Billiton Iron Ore has announced an upgrade to achieve a 90mtpa capacity by the year 2007. This will involve considerable dredging and the construction of an additional berth and shiploader at Finucane Island plus an increase in the capacity of the under harbour conveyor. Ground investigation work commenced in June of this year. Tug Haven The tug haven was completed in May 1987 and is now leased to BHP Billiton Transport and Logistics Pty Ltd. The haven is designed to provide safe, all-weather berthing for the port’s fleet of 6 tugs and the Authority’s contract pilot boat and survey boat. During the year management of the tugs passed to Teekay Shipping.

PPPOOORRRTTT HHHEEEDDDLLLAAANNNDDD PPPOOORRRTTT AAAUUUTTTHHHOOORRRIIITTTYYY 222000000222 AAANNNNNNUUUAAALLL RRREEEPPPOOORRRTTT
- 17 -
Port Control Tower The Port Control Tower is manned on a 24 hour a day basis and provides the essential communications centre for shipping and boating activities, port security, support role to the local police during marine search and rescue (SAR) and emergency operations. Navigational Aids The Authority owns and is responsible for the 35 beacons which mark the channel within port limits, various leading marks and an offshore buoy as well as the 6 buoys marking the Inner Harbour turning basin. Two Sarus Towers mark the eastern approach to the port. All navigation lights are solar powered with the main channel being fully synchronised. A number of key leads have been upgraded with new LED style lights as a trial to gauge their ability to stand out against background illumination from the shiploading plant and facilities at Finucane Island and Nelson Point. Should the trials be successful additional lights will be upgraded. Services Towage - The port is serviced by a fleet of 6 tugs, each with a nominal minimum bollard pull of 50 tonnes. Launches - Launches are available from various companies, comprising workboats, lines boats and fast launches. Ship Repairs and General Services A number of companies in Port Hedland are able to provide minor ship repair services, including machinery, welding, electrical, airconditioning and refrigeration repairs. Other contracting services available in the port are sandblasting/spray painting, plumbing, civil engineering, earthmoving, diving services, surveying, providoring, general maintenance, vehicle maintenance, light engineering and a supply of light building materials EExxiissttiinngg TTeennaannttss Ampol Ltd Newcrest Mining Limited BHP Billiton Iron Ore Ltd P&O Ports Limited BHP Billiton Transport & Logistics Pty Ltd Pilbara Manganese Pty Ltd BGC Contracting Pilbara Chromite Pty Ltd BP Australia Pty Ltd Pilbara Marine Port Services Brown’s Auto Repairs Pty Ltd Port Hedland Pilots Cervan Marine & Maintenance Pty Ltd Portside Fabrications Pty Ltd Cockburn Cement Limited Seafarers Centre Commercial Minerals Sealanes (1985) Pty Ltd Consolidated Minerals Pty Ltd Shell Company of Australia Ltd Coogee Chemicals Pty Ltd Stirling Marine Services Pty Ltd Dampier Salt Ltd Toll Energy Logistics Pty Ltd Gondwana Chemicals Pty Ltd Total Corrosion Control Pty Ltd Hedland Launch Service Town of Port Hedland Intertek Testing Services (Australia) Pty Ltd Unimin Australia Limited
PPPOOORRRTTT HHHEEEDDDLLLAAANNNDDD PPPOOORRRTTT AAAUUUTTTHHHOOORRRIIITTTYYY 222000000222 AAANNNNNNUUUAAALLL RRREEEPPPOOORRRTTT
- 18 -
DDiirreeccttoorrss’’ RReeppoorrtt In accordance with Schedule 5 of the Port Authorities Act 1999, the Directors submit their report for the year ended 30th June 2002. DDiirreeccttoorrss The names and details of the Directors of the Port Hedland Port Authority during the financial year and until the date of this report are: PETER G HARDIE Chairman Mr Hardie was reappointed Chairman on 1 July 2001 for a one year term expiring on 30 June 2002. Mr Hardie, a pastoralist, has owned and has resided at Boodarie Station, south west of Port Hedland, since 1956. He was previously a Member of the Authority from 1982 to 1988 and was first appointed to the position of Chairman on 1 November 1993. Mr Hardie was presented with the “Westfarmers Dalgety Pastoralist of the Year Award” in 1999. JACK HAUNOLD Director Mr Haunold was reappointed to the Board on 1 July 2000 for a three year term expiring on 30 June 2003. Mr Haunold is a local businessman and a former Town Councillor. Mr Haunold is also Chairman of the Hedland Community Crime Prevention Committee. BARRY RALSTON Director Mr Ralston, who has 38 years experience in management and shipping, was reappointed to the Board in 2001 for a 12 month term expiring 30 June 2002. Mr Ralston is Managing Director of FJ Sherborne (WA) Pty Ltd, customs brokers. Mr Ralston is also a Director of Sherborne ACA Cargo Services Ltd, freight forwarders, Trade Facilitators International Pty Ltd and Pakenham Pty Ltd. BRENT RUDLER Director Mr Rudler was reappointed as a Director on 1 July 2001 for a two year term to expire on 30 June 2003. Mr Rudler is a local businessman and is currently the Town of Port Hedland’s Mayor. Mr Rudler has been involved in the development and support of the community since 1994 and is also a Board Member of the Small Business Development Corporation. MARY RUSSELL Director Mrs Russell was appointed to the Board on 1 July 2001 for a three year term to expire on 30 June 2004. Mrs Russell has been a Director of Golden Eagle Airlines since 1990. She holds an arts degree from the University of Western Australia and her work experience prior to the formation of Golden Eagle Airlines was in human resource management.

PPPOOORRRTTT HHHEEEDDDLLLAAANNNDDD PPPOOORRRTTT AAAUUUTTTHHHOOORRRIIITTTYYY 222000000222 AAANNNNNNUUUAAALLL RRREEEPPPOOORRRTTT
- 19 -
DEREK J MILLER Director Mr Miller was reappointed to the Board on the nomination of BHP Billiton on 6 August 1999 for a term expiring 30 June 2002. He is the Vice President Operations, BHP Billiton Iron Ore Pty Ltd. Mr Miller is a mining and metallurgical engineer and has held a variety of different mining positions over a career, which has spanned some 30 years. ROGER RICHARDSON Director Mr Richardson was reappointed to the Board on the nomination of BHP Billiton in 2001 for a further term, expiring 30 June 2004. Mr Richardson is Superintendent Shipping for BHP Billiton Iron Ore Pty Ltd and a former Town Councilor. Mr Richardson is also Chairman of the Tropical Cyclone Industrial Liaison Committee. DEAN DALLA VALLE Alternate Director Mr Dalla Valle is the Alternate Director for Mr D J Miller. Mr Dalla Valle was appointed on the nomination of BHP Billiton in 2001 for a term expiring 30 June 2002. Mr Dalla Valle is Vice President Ports for BHP Billiton Iron Ore Pty Ltd. Mr Dalla Valle is a qualified electrical engineer and has held various engineering and managerial positions. JEFF ROWE Alternate Director Mr Rowe is Deputy Director to Mr R E Richardson. Mr Rowe was reappointed to the Board on the nomination of BHP Billiton in 2001 for a further term, expiring 30 June 2004. Mr Rowe is Manager Special Projects for BHP Billiton Iron Ore Pty Ltd. Mr Rowe is a qualified engineer and has held various engineering and managerial positions.
PPPOOORRRTTT HHHEEEDDDLLLAAANNNDDD PPPOOORRRTTT AAAUUUTTTHHHOOORRRIIITTTYYY 222000000222 AAANNNNNNUUUAAALLL RRREEEPPPOOORRRTTT
- 20 -
PPrriinncciippaall AAccttiivviittiieess Port Hedland Port Authority: � Provides and maintains essential facilities including the channel and turning basin,
navigation aids, berths, shiploader, storage areas and utilities. � Provides services for the safe movement of ships within the port including scheduling
and movement control, pilotage, and under keel clearance optimisation. � Controls services provided by others in the port including stevedoring, towage, and line
boats. � Controls the activities of others in the port including the planning and construction of
dedicated private facilities. � Leases industrial land for port related activities. � Plans for the future growth and development of the port. There have been no significant changes in the nature of the principal activities during the financial year. OOppeerraattiinngg RReessuullttss The operating profit after providing for income tax for the financial year was $1,899,000 DDiivviiddeennddss PPrrooppoosseedd In accordance with the current dividend policy the Directors have recommended a dividend of $949,000 being 50% of net profit after tax. An Efficiency Dividend of $101,000 required by the State Government will be paid in 2002/03. RReevviieeww OOff OOppeerraattiioonnss AAnndd EExxppeecctteedd RReessuullttss A review of the operations of the Port Authority during the financial year, the result of those operations and the likely developments are contained in the Chairman’s and Chief Executive Officer’s Information Statement and Overview of Port Operations. SSiiggnniiffiiccaanntt CChhaannggeess iinn tthhee SSttaattee ooff AAffffaaiirrss
There have been no significant changes in the state of affairs of the Authority since the previous Directors’ Report. EEvveennttss SSuubbsseeqquueenntt TToo BBaallaannccee DDaattee The Directors are not aware of any matter or circumstances that have arisen since the end of the year that has significantly affected the operations of the Port.
PPPOOORRRTTT HHHEEEDDDLLLAAANNNDDD PPPOOORRRTTT AAAUUUTTTHHHOOORRRIIITTTYYY 222000000222 AAANNNNNNUUUAAALLL RRREEEPPPOOORRRTTT
- 21 -
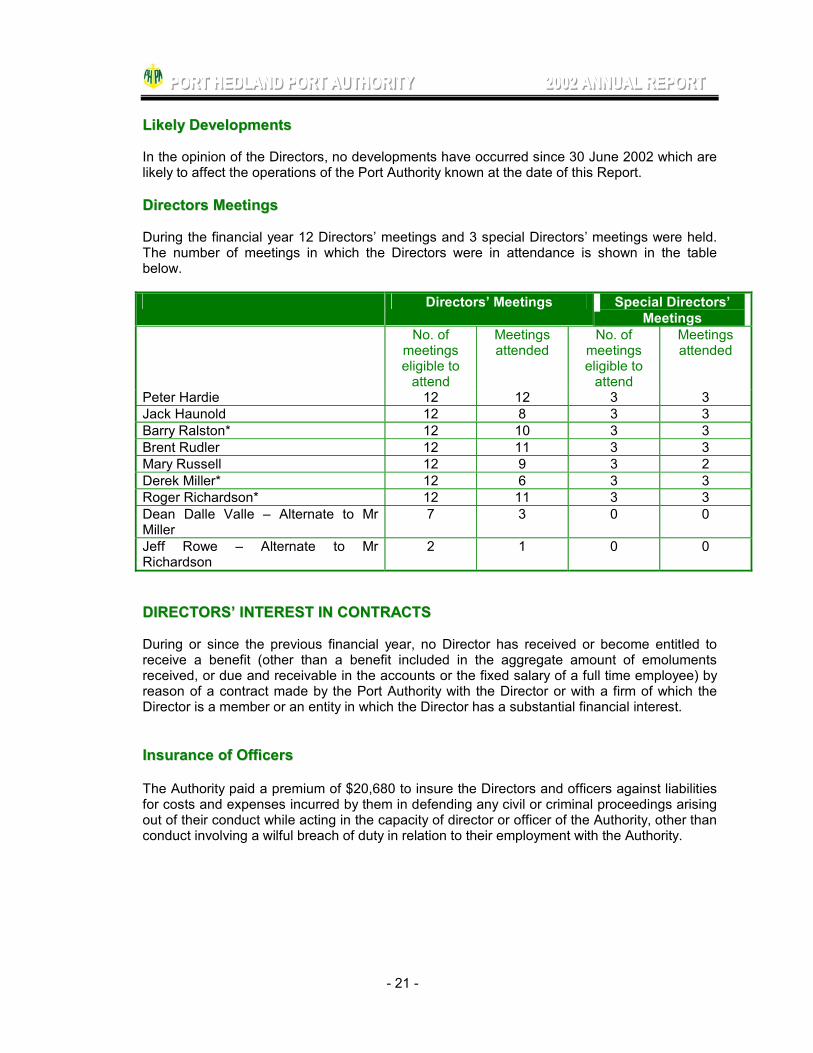
LLiikkeellyy DDeevveellooppmmeennttss In the opinion of the Directors, no developments have occurred since 30 June 2002 which are likely to affect the operations of the Port Authority known at the date of this Report. DDiirreeccttoorrss MMeeeettiinnggss During the financial year 12 Directors’ meetings and 3 special Directors’ meetings were held. The number of meetings in which the Directors were in attendance is shown in the table below.
Directors’ Meetings Special Directors’ Meetings
No. of meetings eligible to
attend
Meetings attended
No. of meetings eligible to
attend
Meetings attended
Peter Hardie 12 12 3 3 Jack Haunold 12 8 3 3 Barry Ralston* 12 10 3 3 Brent Rudler 12 11 3 3 Mary Russell 12 9 3 2 Derek Miller* 12 6 3 3 Roger Richardson* 12 11 3 3 Dean Dalle Valle – Alternate to Mr Miller
7 3 0 0
Jeff Rowe – Alternate to Mr Richardson
2 1 0 0
DDIIRREECCTTOORRSS’’ IINNTTEERREESSTT IINN CCOONNTTRRAACCTTSS During or since the previous financial year, no Director has received or become entitled to receive a benefit (other than a benefit included in the aggregate amount of emoluments received, or due and receivable in the accounts or the fixed salary of a full time employee) by reason of a contract made by the Port Authority with the Director or with a firm of which the Director is a member or an entity in which the Director has a substantial financial interest. IInnssuurraannccee ooff OOffffiicceerrss The Authority paid a premium of $20,680 to insure the Directors and officers against liabilities for costs and expenses incurred by them in defending any civil or criminal proceedings arising out of their conduct while acting in the capacity of director or officer of the Authority, other than conduct involving a wilful breach of duty in relation to their employment with the Authority.
PPPOOORRRTTT HHHEEEDDDLLLAAANNNDDD PPPOOORRRTTT AAAUUUTTTHHHOOORRRIIITTTYYY 222000000222 AAANNNNNNUUUAAALLL RRREEEPPPOOORRRTTT
- 22 -
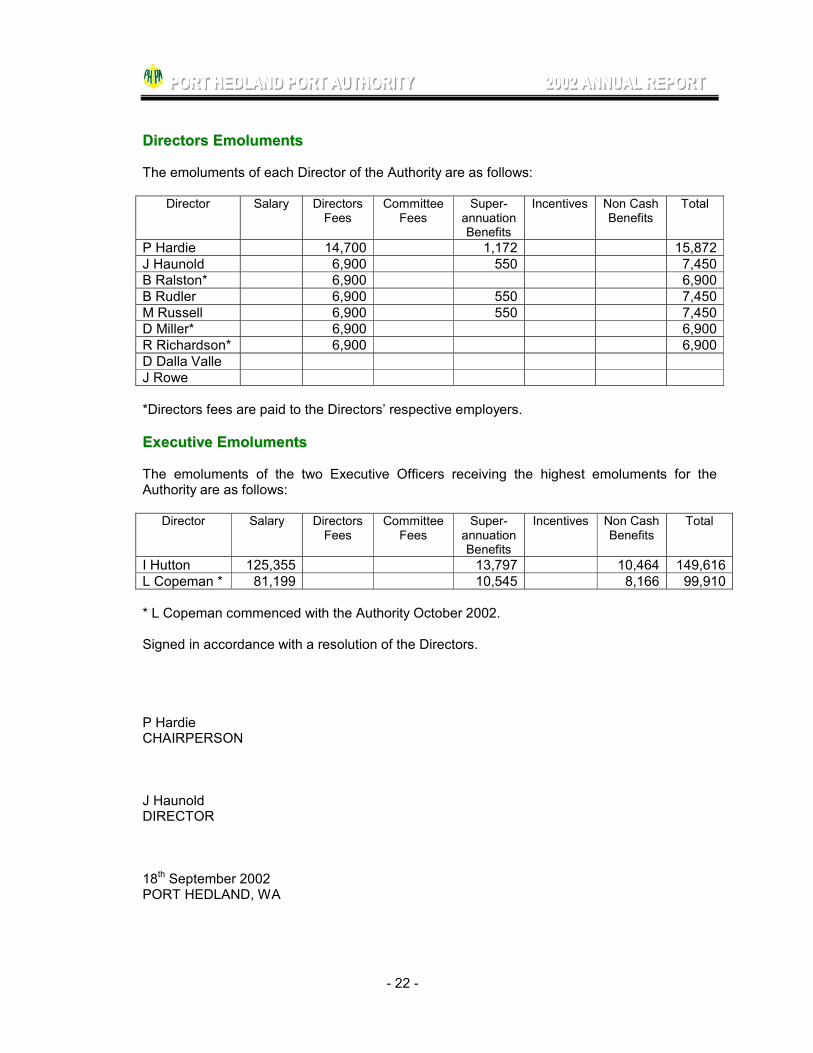
DDiirreeccttoorrss EEmmoolluummeennttss The emoluments of each Director of the Authority are as follows:
Director Salary Directors Fees
Committee Fees
Super- annuation Benefits
Incentives Non Cash Benefits
Total
P Hardie 14,700 1,172 15,872J Haunold 6,900 550 7,450B Ralston* 6,900 6,900B Rudler 6,900 550 7,450M Russell 6,900 550 7,450D Miller* 6,900 6,900R Richardson* 6,900 6,900D Dalla Valle J Rowe *Directors fees are paid to the Directors’ respective employers. EExxeeccuuttiivvee EEmmoolluummeennttss The emoluments of the two Executive Officers receiving the highest emoluments for the Authority are as follows:
Director Salary Directors Fees
Committee Fees
Super- annuation Benefits
Incentives Non Cash Benefits
Total
I Hutton 125,355 13,797 10,464 149,616L Copeman * 81,199 10,545 8,166 99,910 * L Copeman commenced with the Authority October 2002. Signed in accordance with a resolution of the Directors. P Hardie CHAIRPERSON J Haunold DIRECTOR 18th September 2002 PORT HEDLAND, WA
PPPOOORRRTTT HHHEEEDDDLLLAAANNNDDD PPPOOORRRTTT AAAUUUTTTHHHOOORRRIIITTTYYY 222000000222 AAANNNNNNUUUAAALLL RRREEEPPPOOORRRTTT
- 23 -
DDIIRREECCTTOORRSS’’ DDEECCLLAARRAATTIIOONN In the opinion of the Directors of Port Hedland Port Authority:
a) The Statement of Financial Performance gives a true and fair view of the Port Authority’s profit for the financial year 1 July 2001 to 30 June 2002;
b) The Statement of Financial Position gives a true and fair view of the Port
Authority’s state of affairs as at 30 June 2002;
c) At the date of this declaration there are reasonable grounds to believe that the Port Hedland Port Authority will be able to pay its debts as and when they fall due.
The financial statements as set out on the following pages have been prepared in accordance with applicable Accounting Standards, other mandatory professional reporting requirements and the financial reporting provisions of the Port Authorities Act 1999. This declaration is made in accordance with a resolution of the Directors. R Richardson DIRECTOR J Haunold DIRECTOR 18th September 2002 PORT HEDLAND, WA

PPPOOORRRTTT HHHEEEDDDLLLAAANNNDDD PPPOOORRRTTT AAAUUUTTTHHHOOORRRIIITTTYYY 222000000222 AAANNNNNNUUUAAALLL RRREEEPPPOOORRRTTT
- 24 -
PPPOOORRRTTT HHHEEEDDDLLLAAANNNDDD PPPOOORRRTTT AAAUUUTTTHHHOOORRRIIITTTYYY
FFFIIINNNAAANNNCCCIIIAAALLL SSSTTTAAATTTEEEMMMEEENNNTTTSSS
22000022

PPPOOORRRTTT HHHEEEDDDLLLAAANNNDDD PPPOOORRRTTT AAAUUUTTTHHHOOORRRIIITTTYYY 222000000222 AAANNNNNNUUUAAALLL RRREEEPPPOOORRRTTT
- 25 -
PPOORRTT HHEEDDLLAANNDD PPOORRTT AAUUTTHHOORRIITTYY FFiinnaanncciiaall RReeppoorrtt –– 3300 JJuunnee 22000022
TTAABBLLEE OOFF CCOONNTTEENNTTSS –– FFIINNAANNCCIIAALL RREEPPOORRTTSS
FINANCIAL OVERVIEW ...................................................................................................................................26 STATEMENTS OF FINANCIAL PERFORMANCE FOR THE YEAR ENDED 30 JUNE, 2002..............................................28 STATEMENTS OF FINANCIAL POSITION AS AT 30 JUNE, 2002.................................................................................29 STATEMENTS OF CASH FLOWS FOR THE YEAR ENDED 30 JUNE, 2002...................................................................30
NOTES TO AND FORMING PART OF THE ACCOUNTS ............................................................................31 NOTE 1 - SUMMARY OF SIGNIFICANT ACCOUNTING POLICIES..............................................................................31 NOTE 2 - REVENUE FROM ORDINARY ACTIVITIES ...............................................................................................36 NOTE 3 - PROFIT / (LOSS) FROM ORDINARY ACTIVITIES BEFORE INCOME TAX....................................................36 NOTE 4 – INCOME TAX .......................................................................................................................................37 NOTE 5 – CURRENT ASSETS................................................................................................................................37 NOTE 6 - RECEIVABLES .......................................................................................................................................38 NOTE 7 – INVENTORY .........................................................................................................................................38 NOTE 8 – PROPERTY, PLANT AND EQUIPMENT....................................................................................................39 NOTE 9 – DEFERRED TAX ASSETS.......................................................................................................................40 NOTE 10 - CURRENT LIABILITIES - PAYABLES ....................................................................................................40 NOTE 11 – CURRENT LIABILITIES - PROVISIONS ..................................................................................................40 NOTE 12 – CURRENT TAX LIABILITIES .................................................................................................................41 NOTE 13 - PROVISIONS (NON CURRENT LIABILITIES) ..........................................................................................41 NOTE 14 - DEFERRED TAX LIABILTIES ................................................................................................................41 NOTE 15 – CONTRIBUTED EQUITY ......................................................................................................................41 NOTE 16 - RETAINED PROFITS ..............................................................................................................................41 NOTE 17 - RESERVES ..........................................................................................................................................42 NOTE 18 - NOTES ACCOMPANYING CASHFLOW STATEMENT..............................................................................43 NOTE 19 - RELATED PARTIES ..............................................................................................................................43 NOTE 20 – EVENTS SUBSEQUENT TO REPORTING DATE ......................................................................................44 NOTE 21 - DEBTS AND ASSETS WRITTEN OFF.....................................................................................................44 NOTE 22 – REMUNERATION OF DIRECTORS.........................................................................................................44 NOTE 23 – REMUNERATION OF EXECUTIVES.........................................................................................................45 NOTE 24 – EMPLOYEE BENEFITS.........................................................................................................................45 NOTE 25 - FINANCIAL INSTRUMENTS ..................................................................................................................46 NOTE 26 - SEGMENT INFORMATION ....................................................................................................................47
2002/03 FINANCIAL ESTIMATES.....................................................................................................................49 OPERATING BUDGET .....................................................................................................................................49 CAPITAL BUDGET ...........................................................................................................................................50
The Port Hedland Port Authority was established through the Port Authorities Act 1999.
Its principal place of business is Wharf Road Port Hedland. Financial reports and other information are available on our Website:
www.phpa.wa.gov.au

PPPOOORRRTTT HHHEEEDDDLLLAAANNNDDD PPPOOORRRTTT AAAUUUTTTHHHOOORRRIIITTTYYY 222000000222 AAANNNNNNUUUAAALLL RRREEEPPPOOORRRTTT
- 26 -
FFiinnaanncciiaall OOvveerrvviieeww ANALYSIS OF REVENUE BY SOURCE
2001/02 2000/01 VARIATION $000 % $000 % $000 %Charges on Ships 7,000 53 6,895 49 105 10 Charges on Cargo 3,515 27 4,055 29 (540) (55) Lease Rental 1,513 12 1,553 11 (40) (4) Other revenue 1,026 8 1,524 11 (498) (51) Total 13,054 100 14,027 100 (973) (100) PRINCIPAL ITEMS OF REVENUE AND EXPENDITURE
2001/02 2000/01 1999/00 1998/99 1997/98 $000 % $000 % $000 % $000 % $000 %
REVENUE Pilotage & Tonnage 6,660 51 6,895 49 6,144 50 6,269 54 6,464 52Wharfage & Berthage 2,672 20 4,055 29 3,171 25 2,595 22 2,352 19Other 3,722 29 3,077 22 3,080 25 2,801 24 3,675 29 Total 13,054 100 14,027 100 12,395 100 11,665 100 12,491 100 CHARGES AGAINST REVENUE 2001/02 2000/01 1999/00 1998/99 1997/98 $000 % $000 % $000 % $000 % $000 %Maintenance 2,091 20 6,471 4 1,814 18 1,498 15 1,461 14Salaries and Wages 1,144 11 1,188 1 1,089 11 1,042 11 1,078 10Interest 0 0 0 0 0 0 205 2 331 3Depreciation 1,902 18 1,596 1 1,715 17 1,924 20 1,666 16Pilot Transit Service & Hydro Survey
2,730 26 3,209 2 2,998 30 2,851 29 2,879 27
Deferred Maintenance 0 0 0 0 0 0 0 0 600 6Other Charges 2,571 25 138,890 92 2,589 24 2,163 23 2,615 24 Total 10,438 100 151,354 100 10,205 100 9,683 100 10,630 100 APPROPRIATION STATEMENT 2001/02 2000/01 1999/00 1998/99 1997/98 $000 $000 $000 $000 $000Operating Net Profit / (Loss) 2,616 (137,327) 2,190 1,981 1,861Income Tax Expense (717) 84 (803) (712) (448)Prior Period Tax Adjustments - 136,263 - (365) -Extraordinary Item Net of Tax - - - - (768)Accumulated Profit 17,525 18,606 17,836 16,187 15,994 Total 19,424 17,626 19,223 17,091 16,639

PPPOOORRRTTT HHHEEEDDDLLLAAANNNDDD PPPOOORRRTTT AAAUUUTTTHHHOOORRRIIITTTYYY 222000000222 AAANNNNNNUUUAAALLL RRREEEPPPOOORRRTTT
- 27 -
LESS APPROPRIATIONS 2001/02 2000/01 1999/00 1998/99 1997/98 $000 $000 $000 $000 $000Catastrophe Salvage Reserve - - (200) (200) (200)Adjustment for Prior Periods - - - 1,411 -Accumulated Profits - - - - -Tax Effect - - - - -Increase in Prior Year Dividend - - (1) (86) (58)Proposed Dividend (949) (101) (416) (380) (194) Accumulated Profit as at the 30 June 18,475 17,525 18,606 17,836 16,187
PPPOOORRRTTT HHHEEEDDDLLLAAANNNDDD PPPOOORRRTTT AAAUUUTTTHHHOOORRRIIITTTYYY 222000000222 AAANNNNNNUUUAAALLL RRREEEPPPOOORRRTTT
- 28 -
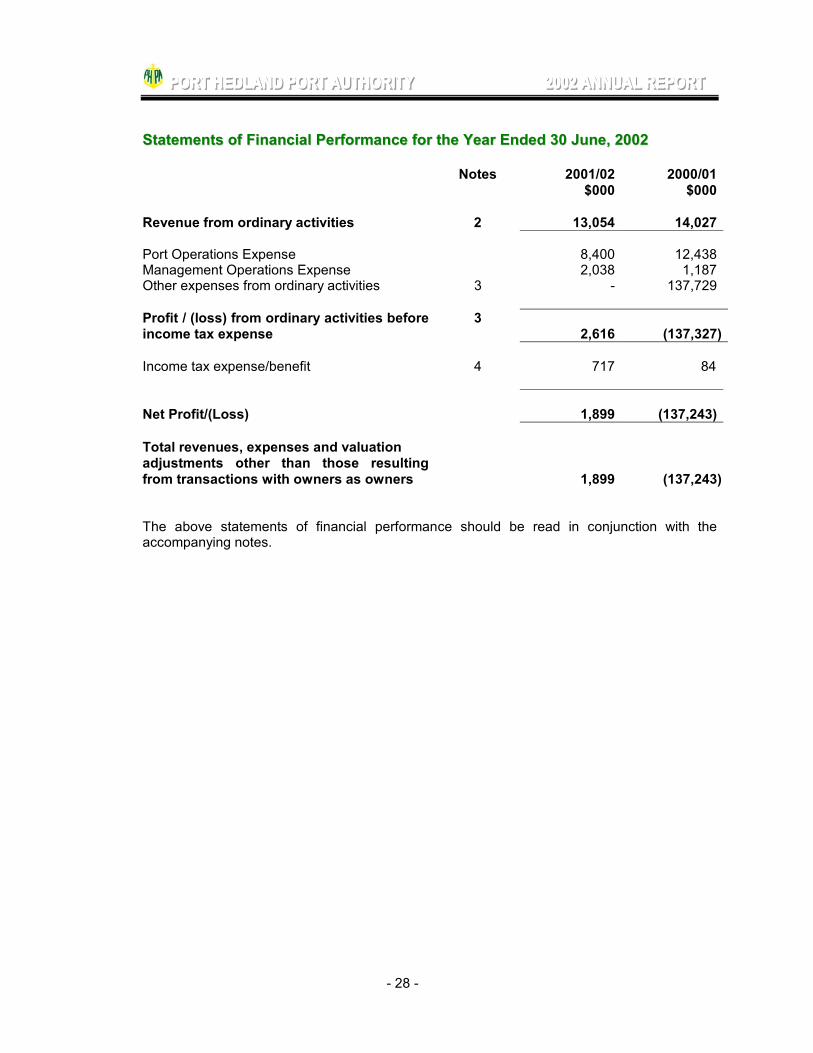
SSttaatteemmeennttss ooff FFiinnaanncciiaall PPeerrffoorrmmaannccee ffoorr tthhee YYeeaarr EEnnddeedd 3300 JJuunnee,, 22000022 Notes 2001/02 2000/01 $000 $000 Revenue from ordinary activities 2 13,054 14,027 Port Operations Expense 8,400 12,438Management Operations Expense 2,038 1,187Other expenses from ordinary activities 3 - 137,729 Profit / (loss) from ordinary activities before income tax expense
3 2,616 (137,327)
Income tax expense/benefit 4 717 84 Net Profit/(Loss) 1,899 (137,243) Total revenues, expenses and valuation adjustments other than those resulting from transactions with owners as owners
1,899 (137,243)
The above statements of financial performance should be read in conjunction with the accompanying notes.

PPPOOORRRTTT HHHEEEDDDLLLAAANNNDDD PPPOOORRRTTT AAAUUUTTTHHHOOORRRIIITTTYYY 222000000222 AAANNNNNNUUUAAALLL RRREEEPPPOOORRRTTT
- 29 -
SSttaatteemmeennttss ooff FFiinnaanncciiaall PPoossiittiioonn aass aatt 3300 JJuunnee,, 22000022
Notes 2001/02 2000/01 $000 $000CURRENT ASSETS Cash assets 5 10,293 8,812Receivables 6 2,385 2,129Inventory 7 73 - Total Current Assets 12,751 10,941 NON - CURRENT ASSETS Property, Plant & Equipment 8 30,543 31,166Deferred tax assets 9 411 542 Total - Non Current Assets 30,954 31,708 TOTAL ASSETS 43,705 42,649 CURRENT LIABILITIES Payables 10 1,668 2,773Provisions 11 1,377 377Current tax liabilities 12 324 120 Total Current Liabilities 3,369 3,270 NON - CURRENT LIABILITIES Provisions 13 467 461Deferred tax liabilities 14 181 180 Total Non-Current Liabilities 648 641 TOTAL LIABILITIES 4,017 3,911 NET ASSETS 39,688 38,738 Contributed Equity 15 1,665 1,665Retained profits 16 18,475 17,525Reserves 17 19,548 19,548 TOTAL EQUITY 39,688 38,738 The above statement of financial position should be read in conjunction with the accompanying notes.

PPPOOORRRTTT HHHEEEDDDLLLAAANNNDDD PPPOOORRRTTT AAAUUUTTTHHHOOORRRIIITTTYYY 222000000222 AAANNNNNNUUUAAALLL RRREEEPPPOOORRRTTT
- 30 -
SSttaatteemmeennttss ooff CCaasshh FFlloowwss ffoorr tthhee YYeeaarr EEnnddeedd 3300 JJuunnee,, 22000022
Notes 2001/02 2000/01 $000 $000Cash flows from operating activities Receipts from Customers 11,745 13,841Payments to Suppliers and Employees (9,139) (11,931)Interest Received 382 842Income Tax and Sales Tax Paid (381) (405) Net cash inflows provided by operating activities 18
2,607 2,347
Cash flows from investing activities Payments for Purchase of Property, Plant and Equipment
(1,361) (7,613)
Proceeds from Disposal of Property, Plant and Equipment
235 38
Net cash used in investing activities (1,126) (7,575) Cash flows from financing activities Dividends Paid - (416) Net cash used in financing activities - (416) Net increase (decrease) in cash held 1,481 (5,644) Cash at the beginning of the financial year 8,812 14,456 Cash at the end of the financial year 18 10,293 8,812 The above statement of cash flows should be read in conjunction with the accompanying notes.

PPPOOORRRTTT HHHEEEDDDLLLAAANNNDDD PPPOOORRRTTT AAAUUUTTTHHHOOORRRIIITTTYYY 222000000222 AAANNNNNNUUUAAALLL RRREEEPPPOOORRRTTT
- 31 -
NNootteess ttoo aanndd FFoorrmmiinngg PPaarrtt ooff tthhee AAccccoouunnttss NNOOTTEE 11 -- SSuummmmaarryy ooff SSiiggnniiffiiccaanntt AAccccoouunnttiinngg PPoolliicciieess The following accounting policies have been adopted in the preparation of the financial statements for the year ended 30 June 2002. These policies are consistent with those adopted in the prior year unless otherwise stated. (a) Basis of Accounting
The financial statements are prepared on an accrual basis of accounting on an historical cost basis.
The financial statements constitute a general purpose financial report, which has been prepared in accordance with Australian Accounting Standards and Urgent Issues Group (UIG) Consensus Views and the Port Authorities Act 1999 which generally reflect the Corporations Act 2001.
(b) Cash For the purposes of the Statement of Cash Flows, cash includes cash on hand, cash at bank, commercial bills which are readily converted to cash on hand and are the subject of insignificant risk of change in value.
(c) Revenue Recognition
Revenue from ordinary activities is net of returns and taxes, for services to entities outside the authority and is recognised when the revenue for services have been provided. Miscellaneous Revenue is derived predominantly from house rentals and is recognised when accrued. Interest revenue includes interest on short-term investments and is recognised when accrued.
(d) Goods and Services Tax
Revenues, expenses and assets are recognised net of the amount of GST, except where the amount of GST incurred is not recoverable from the Australian Tax Office. In these circumstances the GST is recognised as part of the cost of acquisition of the asset or as part of the item of expense. Receivables and payables in the statement of financial position are shown inclusive of GST.
(e) Income Tax The Authority adopts the liability method of tax-effect accounting whereby the income tax
attributable to profit shown in the Statement of Financial Performance is based on the profit from ordinary activities before income tax adjusted for any permanent differences. The provisions for deferred income tax and the future income tax benefit represent the tax effect of timing differences calculated at the rate of income tax applicable when those timing differences are expected to reverse. The future tax benefit relating to tax losses is not carried forward as an asset unless the benefit is virtually certain of realisation. From 1 July 2001 the Authority was subject to taxation under the National Tax Equivalent Regime (“NTER”). Under NTER the Authority is required to implement full tax effect accounting and pay to the State Government the equivalent tax that would be paid to the Federal Government under Federal Tax Legislation.

PPPOOORRRTTT HHHEEEDDDLLLAAANNNDDD PPPOOORRRTTT AAAUUUTTTHHHOOORRRIIITTTYYY 222000000222 AAANNNNNNUUUAAALLL RRREEEPPPOOORRRTTT
- 32 -
(f) Payment of Dividend to the State In accordance with Section 84 of the Port Authorities Act 1999 the Board of the Authority
shall, as soon as practicable after the end of each financial year make a recommendation to the Minister as to the amount of dividend appropriate for the financial year.
(g) Receivables Debtors are recognised at the amounts due and are generally settled within 30 days
except for property rentals, which are governed by individual lease agreements. Bad debts are written off when formally recognised as being irrecoverable.
(h) Inventories Inventories are measured at the lower of cost and net realisable value. Costs are
assigned on the basis of weighted average cost. (i) Payables
These amounts represent liabilities for goods and services provided to the Authority prior to the end of the financial year and which are unpaid. Payables, including trade creditors and accrued expenses, are recognised when the Authority becomes obliged to make future payments as a result of a purchase for goods or services. Trade creditors are unsecured and are usually paid within 30 days of recognition.
(j) Property, Plant and Equipment and Depreciation
Until 30 June 2000 the Authority’s fixed assets were carried at cost or independent valuation. In complying with the requirements of Australian Accounting Standard AASB1041, the Authority has elected to revert to the cost basis of measuring all property plant and equipment. In changing from a revaluation to cost policy, the carrying amounts of property, plant and equipment previously carried at revalued amounts, are the deemed cost of those assets.
The Authority’s fixed assets are depreciated using the straight line method, at a rate
estimated to write off the cost of the asset over the assets anticipated useful life. Rates vary from 1.11% to 33% where the useful life has been estimated at only three years.
The depreciation rates for the classes of non-current assets are as follows:
ASSET CLASSIFICATION DEPRECIATION RATES (%) Building and Improvements 2.50 - 12.50 Other Equipment 5.00 - 33.00 Wharves 1.11 - 20.00 Navigational Aides 3.33 - 16.67
Revaluation decrements are recognised as expenses in the Statement of Financial Performance, unless they are reversing revaluation increments previously credited to, and still included in the balance of, the asset revaluation reserve in respect of that same class of assets, in which case they are debited directly to the asset revaluation reserve. Revaluation increments are credited directly to the asset revaluation reserve, unless they are reversing a previous decrement charged to the Statement of Financial Performance in which case the increment is credited to the Statement of Financial Performance.

PPPOOORRRTTT HHHEEEDDDLLLAAANNNDDD PPPOOORRRTTT AAAUUUTTTHHHOOORRRIIITTTYYY 222000000222 AAANNNNNNUUUAAALLL RRREEEPPPOOORRRTTT
- 33 -
Revaluations do not result in the carrying value of property, plant and equipment exceeding their recoverable amount. (Refer Note 1 (k)).
PPPOOORRRTTT HHHEEEDDDLLLAAANNNDDD PPPOOORRRTTT AAAUUUTTTHHHOOORRRIIITTTYYY 222000000222 AAANNNNNNUUUAAALLL RRREEEPPPOOORRRTTT
- 34 -
Expenditures in respect of assets with a value greater than $1,000 are capitalised and included as Assets in the Statement of Financial Position. Physical control is maintained over all assets regardless of cost.
(k) Recoverable Amount of Property, Plant and Equipment The recoverable amount of an asset is the net amount expected to be recovered through
the net cash inflows arising from its continued use and subsequent disposal. All property, plant and equipment are reviewed at least annually to determine whether
their carrying amounts require write down to recoverable amount. Recoverable amount is determined using net cash flows discounted to present values.
(l) Changes in Accounting Policy – Property, Plant and Equipment
Disclosures of property, plant and equipment is prepared in conformity with the new Accounting Standard, AASB 1041 Revaluation of Non-current assets. This Standard has been applied for the year ended 30 June 2001. In accordance with this Standard, property, plant and equipment previously carried at valuation is now carried at “deemed cost”. This change in policy had a significant impact on the financial position and financial performance of the Authority’s previous years financial statements.
(m) Employee Entitlements Provision is made for the Authority’s liability for employee entitlements arising from services rendered by employees to reporting date. Employee entitlements expected to be settled within one year together with entitlements arising from salaries and wages, annual leave and sick leave, which will be settled after one year, have been measured at their nominal amount. Other employee entitlements payable later than one year have been measured at the present value of the estimated cash outflows to be made for those entitlements.
(n) Employee Superannuation The Gold State Superannuation Scheme, is a defined benefit lump sum scheme, and the Superannuation and Family Benefits Act Scheme, a defined benefit pension scheme are now closed to new members. The Authority is responsible for superannuation benefits for past years’ service of members of the Superannuation and Family Benefits Act Scheme who elected to transfer to the Gold State Superannuation Scheme. The Authority also accrues for superannuation benefits to the pension scheme for those members who elected not to transfer from that scheme. The liability for superannuation charges under the Gold State Superannuation Scheme and West State Superannuation Scheme are extinguished by payment of the employer contributions to the Government Employees Superannuation Board. The note disclosure required by paragraph 14(e) of AASB1028 (being the employer’s share of the difference between employee’s accrued superannuation benefits and the attributable net market value of plan assets) has not been provided. State scheme deficiencies are recognized by the State on its whole of government reporting. The Government Employees Superannuation Board’s records are not structured to provide the information for the Authority. Accordingly, deriving the information for the Authority is impractical under current arrangements, and thus any benefits thereof would be exceeded by the cost of obtaining the information.

PPPOOORRRTTT HHHEEEDDDLLLAAANNNDDD PPPOOORRRTTT AAAUUUTTTHHHOOORRRIIITTTYYY 222000000222 AAANNNNNNUUUAAALLL RRREEEPPPOOORRRTTT
- 35 -
(o) Sick Leave Experience indicates that no liability for sick leave exists as on average, sick leave taken
in each financial year is less than entitlements accruing in that period and this experience is expected to recur in future periods.
(p) Insurance The Authority has an extensive insurance portfolio, however due to the high cost of
premiums, the Authority chooses to self-insure navigational aid structures. In the event of damage caused by a ship to these assets, repair costs are usually recoverable from the ship’s owners.
(q) Investments Investments are stated at cost and interest revenue is recognised when accrued. (r) Comparatives
Where required by Accounting Standards comparative figures have been adjusted to conform with changes in presentation for the current financial year.
(s) Net Fair Values of Financial Assets and Liabilities Net fair value of financial instruments are determined on the following basis: Financial instruments traded in an organised financial market (traded securities) –
current quoted market bid price for an asset or offer price for a liability adjusted for any transaction costs necessary to realise the asset or settle the liability. Financial monetary assets and liabilities not traded in an organised financial market – cost basis carrying amounts of receivables, payables and accruals (which approximate net market value).
(t) Maintenance and repairs
Channels, port structures and plant and equipment are maintained on a planned and routine basis. This is managed as part of an ongoing major maintenance program. The costs of this maintenance is expensed as incurred, except where it relates to the improvement of an asset , in which case the costs are capitalised and depreciated in accordance with note 1(j).
(u) Rounding of Amounts The Authority presents amounts in the Financial Statements and Director’s Report rounded to the nearest thousand dollars.

PPPOOORRRTTT HHHEEEDDDLLLAAANNNDDD PPPOOORRRTTT AAAUUUTTTHHHOOORRRIIITTTYYY 222000000222 AAANNNNNNUUUAAALLL RRREEEPPPOOORRRTTT
- 36 -
NNOOTTEE 22 -- RReevveennuuee ffrroomm OOrrddiinnaarryy AAccttiivviittiieess Revenue from Ordinary Activities consists of the following items: 2001/02 2000/01 $000 $000 Revenue from Operating Activities Charges on Cargo 3,515 4,055Charges on Ships 7,000 6,895Utilities and Lease Revenue 1,838 1,943 12,353 12,893 Revenue from outside operating activities Miscellaneous Revenue 122 272Interest 413 824Proceeds on Disposal of Property, Plant and Equipment 166 38 Revenue From Ordinary Activities 13,054 14,027 Miscellaneous Revenue is predominantly made up of revenue earned from the lease of equipment and insurance claims recovered. NNOOTTEE 33 -- PPrrooffiitt // ((LLoossss)) ffrroomm OOrrddiinnaarryy AAccttiivviittiieess bbeeffoorree IInnccoommee TTaaxx a) Net Gains and Expenses
2001/02 2000/01$000 $000
Profit / (Loss) from ordinary activities before income tax expense includes the following specific net gains and expenses
2,616 (137,327)
Net Gains Interest 413 824Net gain on disposal of property, plant & equipment 154 10 Expenses Depreciation Buildings and Port improvements 172 170Other equipment 653 336Navigational Aids 377 397Wharves and Utilities 700 694 Total Depreciation 1,902 1,597 Provisions Employee entitlements 162 131

PPPOOORRRTTT HHHEEEDDDLLLAAANNNDDD PPPOOORRRTTT AAAUUUTTTHHHOOORRRIIITTTYYY 222000000222 AAANNNNNNUUUAAALLL RRREEEPPPOOORRRTTT
- 37 -
NNOOTTEE 44 –– IInnccoommee TTaaxx The income tax attributable to the financial year differs from the amount prima facie payable on the profit from ordinary activities and is reconciled as follows: 2001/02 2000/01 $000 $000 Profit / (Loss) from ordinary activities 2,616 (137,327) Prima facie income tax on the operating profit at 30% (2001 – 34%) 785 (46,691) Tax effect of permanent differences:
Capital dredging and channels - 46,614Sundry items - 2Capital profit on sale of freehold land (40) -
Income tax adjusted for permanent differences 1 - 746 (75) Net adjustment to deferred income tax liabilities and assets to reflect the decrease in company tax rate to 30% (2001/34%)
(29) 159
Income tax attributable to profit from ordinary activities 717 84 Income tax attributable to profit compromises: Current income taxation provision 737 (150)Deferred income taxation provision 133 102Future income tax benefit 2 132(Under) provision in previous year (155) - 717 84 NNOOTTEE 55 –– CCuurrrreenntt AAsssseettss Cash Assets Cash Assets represent the Cash at Bank, Cash on Hand and Commercial Bills. Funds surplus to operational requirements has been invested in Commercial Bills to maximise earnings. 2001/02 2000/01 $000 $000 Cash at Bank and Cash on Hand 1,458 765Commercial Bills 8,835 8,047 10,293 8,812

PPPOOORRRTTT HHHEEEDDDLLLAAANNNDDD PPPOOORRRTTT AAAUUUTTTHHHOOORRRIIITTTYYY 222000000222 AAANNNNNNUUUAAALLL RRREEEPPPOOORRRTTT
- 38 -
(i) Significant Terms and Conditions
Interest on Cash at Bank and Commercial bills varied approximately between 4.2% and 5.0% (2001 2% and 6.25%) during the year. Commercial bills are normally held for periods of between 30 and 90 days.
NNOOTTEE 66 -- RReecceeiivvaabblleess
2001/02 2000/01$000 $000
Debtors 2,307 2,121Prepayments 78 8 Total 2,385 2,129 NNOOTTEE 77 –– IInnvveennttoorryy
2001/02 2000/01$000 $000
Replacement parts at cost 73 - 73 -
PPPOOORRRTTT HHHEEEDDDLLLAAANNNDDD PPPOOORRRTTT AAAUUUTTTHHHOOORRRIIITTTYYY 222000000222 AAANNNNNNUUUAAALLL RRREEEPPPOOORRRTTT
- 39 -
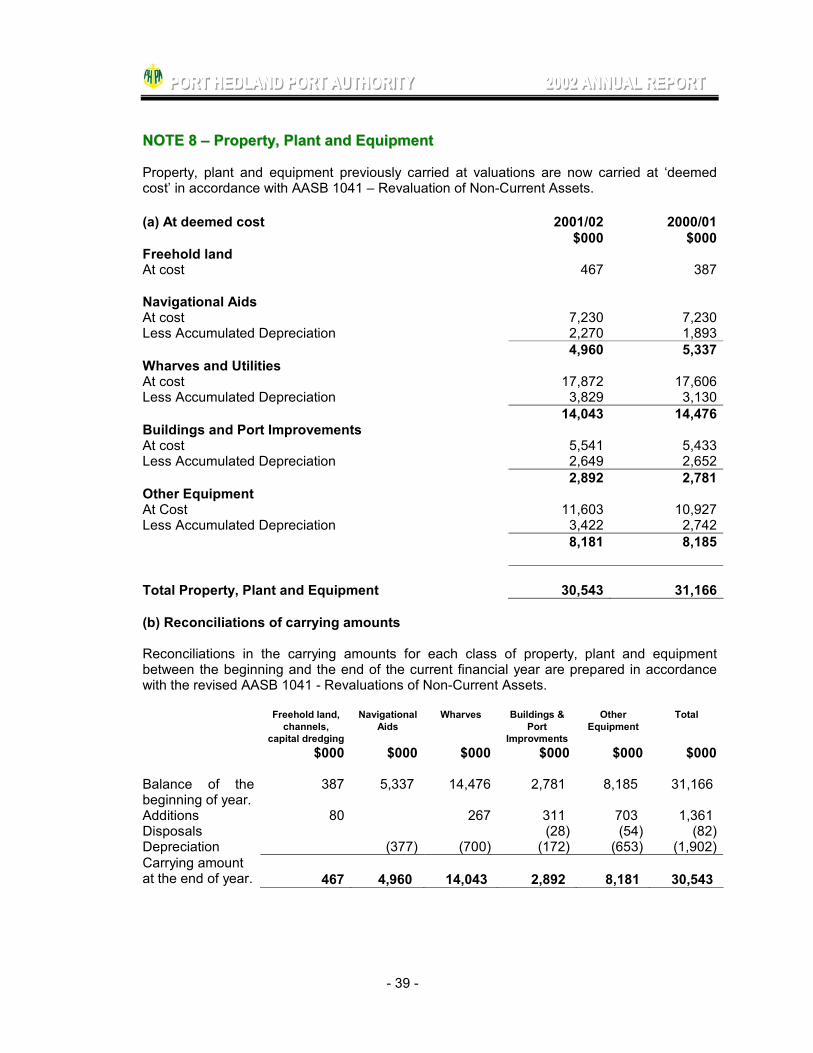
NNOOTTEE 88 –– PPrrooppeerrttyy,, PPllaanntt aanndd EEqquuiippmmeenntt Property, plant and equipment previously carried at valuations are now carried at ‘deemed cost’ in accordance with AASB 1041 – Revaluation of Non-Current Assets. (a) At deemed cost 2001/02 2000/01
$000 $000Freehold land At cost 467 387 Navigational Aids At cost 7,230 7,230Less Accumulated Depreciation 2,270 1,893 4,960 5,337Wharves and Utilities At cost 17,872 17,606Less Accumulated Depreciation 3,829 3,130 14,043 14,476Buildings and Port Improvements At cost 5,541 5,433Less Accumulated Depreciation 2,649 2,652 2,892 2,781Other Equipment At Cost 11,603 10,927Less Accumulated Depreciation 3,422 2,742 8,181 8,185 Total Property, Plant and Equipment 30,543 31,166 (b) Reconciliations of carrying amounts Reconciliations in the carrying amounts for each class of property, plant and equipment between the beginning and the end of the current financial year are prepared in accordance with the revised AASB 1041 - Revaluations of Non-Current Assets.
Freehold land, channels,
capital dredging
Navigational Aids
Wharves Buildings & Port
Improvments
Other Equipment
Total
$000 $000 $000 $000 $000 $000 Balance of the beginning of year.
387 5,337 14,476 2,781 8,185 31,166
Additions 80 267 311 703 1,361 Disposals (28) (54) (82)Depreciation (377) (700) (172) (653) (1,902)Carrying amount at the end of year. 467 4,960 14,043 2,892
8,181 30,543

PPPOOORRRTTT HHHEEEDDDLLLAAANNNDDD PPPOOORRRTTT AAAUUUTTTHHHOOORRRIIITTTYYY 222000000222 AAANNNNNNUUUAAALLL RRREEEPPPOOORRRTTT
- 40 -
NNOOTTEE 99 –– DDeeffeerrrreedd TTaaxx AAsssseettss
2001/02 2000/01$000 $000
Future income tax benefit 411 542 NNOOTTEE 1100 -- CCuurrrreenntt LLiiaabbiilliittiieess -- PPaayyaabblleess Trade Creditors 237 167Rental Received in Advance 287 303Other Creditors 349 321Accrued Expenses 795 1,982 Total 1,791 2,773 i) Significant Terms and Conditions
Trade creditors payable are settled within 30 days. ii) Net Fair Values
The Authority considers the carrying amount of trade creditors approximate their net fair value.
NNOOTTEE 1111 –– CCuurrrreenntt LLiiaabbiilliittiieess -- PPrroovviissiioonnss 2001/02 2000/01 $000 $000 Employee Entitlements 327 276 Provision for Dividend 1050 101 Total 1,254 377 The Authority provides for its future liability for Long Service Leave entitlements to staff. The provision represents Long Service Leave due within 12 months. For the 2000/01 financial year the Authority recommended to the Minister an efficiency dividend of $101,000 be declared. A provision for dividend of $101,000 has been provided for in respect of the year ending 30 June 2001. In addition to the above dividend, since the year and the Board have recommended to the Minister that a dividend of $949,000 be declared for the year ending 30th June 2002.

PPPOOORRRTTT HHHEEEDDDLLLAAANNNDDD PPPOOORRRTTT AAAUUUTTTHHHOOORRRIIITTTYYY 222000000222 AAANNNNNNUUUAAALLL RRREEEPPPOOORRRTTT
- 41 -
NNOOTTEE 1122 –– CCuurrrreenntt ttaaxx lliiaabbiilliittiieess 2001/02 2000/01 $000 $000 Provision for Income Tax 324 120 NNOOTTEE 1133 -- PPrroovviissiioonnss ((NNoonn CCuurrrreenntt LLiiaabbiilliittiieess))
2001/02 2000/01$000 $000
Employee entitlements 467 461 NNOOTTEE 1144 -- DDeeffeerrrreedd TTaaxx LLiiaabbiillttiieess 2001/02 2000/01
$000 $000
Deferred income tax 181 180
NNOOTTEE 1155 –– CCoonnttrriibbuutteedd EEqquuiittyy
2001/02 2000/01$000 $000
Equity Contributed by WA State Government 1,665 1,665 NNoottee 1166 -- RReettaaiinneedd PPrrooffiittss
2001/02 2000/01$000 $000
Retained profits at beginning of financial year 17,525 18,606Net profit/(loss) 1,899 (137,243)Dividends provided for or paid (949) (101)Aggregate amount transferred to catastrophe reserve - -Aggregate amount transferred from Developer Contribution Reserve
- 136,263
Retained profit at the end of financial year 18,475 17,525

PPPOOORRRTTT HHHEEEDDDLLLAAANNNDDD PPPOOORRRTTT AAAUUUTTTHHHOOORRRIIITTTYYY 222000000222 AAANNNNNNUUUAAALLL RRREEEPPPOOORRRTTT
- 42 -
NNOOTTEE 1177 -- RReesseerrvveess 2001/02 2000/01 $000 $000 Catastrophe Reserve 2,900 2,900Developers Contribution Reserve - -Asset Revaluation Reserve 16,512 16,512Asset Realisation Reserve 136 136 Total Reserves 19,548 19,548 Catastrophe Salvage Reserve This reserve was created at the inception of the Authority to provide funds to which expenses resulting from shipping mishaps, cyclones and the like could be applied. The reserve is particularly appropriate in the event of damage to navigational aids, as due to the high cost of premiums, the Authority chooses largely to self-insure these assets. There were no charges to the reserve this financial year. Developers’ Contributions Reserve This sum represents the amount originally invested in the port by Mount Newman Mining Joint Venture and Goldsworthy Mining Limited, now merged as BHP Billiton Iron Ore Ltd. The funds were used to provide capital dredging and navigational aids. This reserve has been transferred to Retained Profits following the write down of these assets.
2001/02 2000/01 Balance at the beginning of the year - 136,263Transfer to Retained Profits - (136,263) Balance at end of year - - Asset Revaluation Reserve The Asset revaluation reserve is used to record increments and decrements on the revaluation of non-current assets, as described in accounting policy note 1(j). Asset Realisation Reserve The asset realisation reserve records realised gains on sale of non-current assets that have been previously revalued.
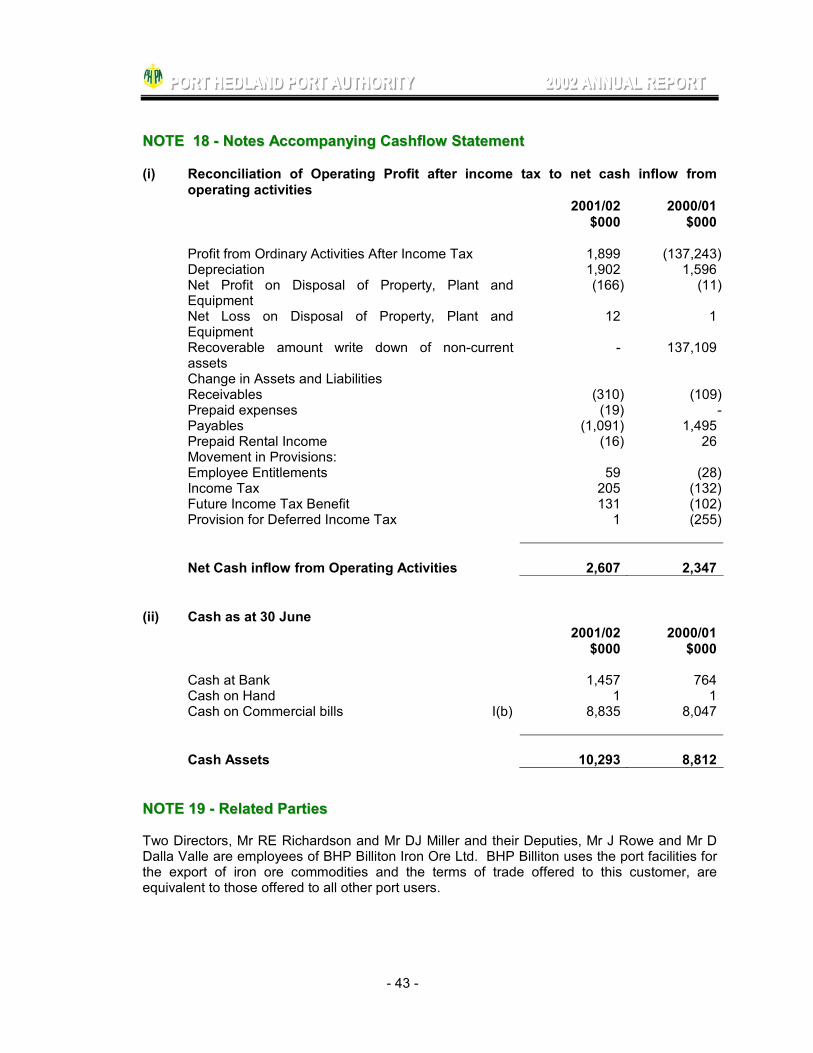
PPPOOORRRTTT HHHEEEDDDLLLAAANNNDDD PPPOOORRRTTT AAAUUUTTTHHHOOORRRIIITTTYYY 222000000222 AAANNNNNNUUUAAALLL RRREEEPPPOOORRRTTT
- 43 -
NNOOTTEE 1188 -- NNootteess AAccccoommppaannyyiinngg CCaasshhffllooww SSttaatteemmeenntt (i) Reconciliation of Operating Profit after income tax to net cash inflow from
operating activities 2001/02 2000/01 $000 $000 Profit from Ordinary Activities After Income Tax 1,899 (137,243) Depreciation 1,902 1,596 Net Profit on Disposal of Property, Plant and
Equipment (166) (11)
Net Loss on Disposal of Property, Plant and Equipment
12 1
Recoverable amount write down of non-current assets
- 137,109
Change in Assets and Liabilities Receivables (310) (109) Prepaid expenses (19) - Payables (1,091) 1,495 Prepaid Rental Income (16) 26 Movement in Provisions: Employee Entitlements 59 (28) Income Tax 205 (132) Future Income Tax Benefit 131 (102) Provision for Deferred Income Tax 1 (255) Net Cash inflow from Operating Activities 2,607 2,347 (ii) Cash as at 30 June
2001/02 2000/01$000 $000
Cash at Bank 1,457 764 Cash on Hand 1 1 Cash on Commercial bills I(b) 8,835 8,047 Cash Assets 10,293 8,812 NNOOTTEE 1199 -- RReellaatteedd PPaarrttiieess Two Directors, Mr RE Richardson and Mr DJ Miller and their Deputies, Mr J Rowe and Mr D Dalla Valle are employees of BHP Billiton Iron Ore Ltd. BHP Billiton uses the port facilities for the export of iron ore commodities and the terms of trade offered to this customer, are equivalent to those offered to all other port users.

PPPOOORRRTTT HHHEEEDDDLLLAAANNNDDD PPPOOORRRTTT AAAUUUTTTHHHOOORRRIIITTTYYY 222000000222 AAANNNNNNUUUAAALLL RRREEEPPPOOORRRTTT
- 44 -
NNOOTTEE 2200 –– EEvveennttss SSuubbsseeqquueenntt ttoo RReeppoorrttiinngg DDaattee There were no events subsequent to the reporting date that would significantly effect the information presented in the Financial Statements of the Authority for the year ending 30 June 2002. NNOOTTEE 2211 -- DDeebbttss aanndd AAsssseettss WWrriitttteenn OOffff No debts were written off in this financial year. Assets to the value of $11,958 were written off during the year with the approval of the Board. NNOOTTEE 2222 –– RReemmuunneerraattiioonn ooff DDiirreeccttoorrss
The total fees, salaries and benefits paid or due and receivable for the year to Directors of the Authority are disclosed as follows.
2001/02 2000/01 $000 $000 Directors fees 59 46
The number of Directors of the Authority whose total of fees, salaries and other benefits received or due and receivable for the financial year, fall within the following bands: Fee Range
2001/02 2000/01$000 $000
Director $0 - $10,000 6 6 $10,000 - $20,000 1 1

PPPOOORRRTTT HHHEEEDDDLLLAAANNNDDD PPPOOORRRTTT AAAUUUTTTHHHOOORRRIIITTTYYY 222000000222 AAANNNNNNUUUAAALLL RRREEEPPPOOORRRTTT
- 45 -
NNoottee 2233 –– RReemmuunneerraattiioonn ooff EExxeeccuuttiivveess The total fees, salaries and benefits paid or due for the year to executives whose remuneration is $100,000 or more are disclosed as follows: 2001/02 2000/01
$000 $000 Executives 261 355 The number of Executives whose total of salaries and other benefits received or due and receivable for the financial year, fall within the following bands. 2001/02 2000/01 $100,000 - $109,999 - -$110,000 - $119,999 1 -$120,000 - $129,999 - -$130,000 - $139,999 - 1$140,000 - $149,999 1 -$220,000 - $229,999 - 1*
*Note this annual figure included a lump sum payment for termination of contract. NNOOTTEE 2244 –– EEmmppllooyyeeee BBeenneeffiittss
2001/02 2000/01$000 $000
Employee Benefit and related on-costs liabilities Included in Other Creditors – current (Note 10) 123 88Provision for employee benefits – current (Note 11) 204 188Provision for employee benefits – non-current (Note 13)
467 461
Aggregate employee benefits and related on costs liabilities
794 737
Employee Numbers
Average number of employees during the year 17 17

PPPOOORRRTTT HHHEEEDDDLLLAAANNNDDD PPPOOORRRTTT AAAUUUTTTHHHOOORRRIIITTTYYY 222000000222 AAANNNNNNUUUAAALLL RRREEEPPPOOORRRTTT
- 46 -
NNOOTTEE 2255 -- FFiinnaanncciiaall IInnssttrruummeennttss Interest Rate Risk Exposures The Authority's exposure to interest rate risk showing the contractual repricing dates or maturity dates, whichever dates are earlier, for classes of financial assets and financial liabilities is set out below:
2001/02 Note Floating interest
rate
Fixed Interest Bearing Maturing in:
Non-Interest Bearing
1 year or less
1 to 5 years
Over 5 years
$000 $000 $000 $000 $000Financial Assets Cash Assets 5 1,457 8,835 - - 1 10,293Receivables 6 - - - - 2,307 2,307 - 10,292 - - 2,308 12,600Weighted Average Interest Rate
4.5%
Financial Liabilities Payables 10 - - - - 1,791 1,791 Net exposure - 10,292 - - 517 10,809 Cash Assets Cash Assets include Cash at Bank and Commercial Bills (with maturity varying between 30 days and 90 days), attract an interest rate which varies approximately from 4.2% to 5%. Last years comparative figure were as follows:
2000/01 Note Floating Interest
Rate
Fixed Interest Bearing Maturing in:
Non-Interest Bearing
1 year or less
1 to 5 years
Over 5 years
$000 $000 $000 $000 $000Financial Assets Cash Assets 5 764 8,048 - - - 8,812Receivables 6 - - - - 2,129 2,129 8,812 - - 2,129 10,941Weighted Average Interest Rate
5.7%
Financial Liabilities Payables 10 - - - - 2,773 2,773 Net exposure - 8,812 - - (644) 8,168

PPPOOORRRTTT HHHEEEDDDLLLAAANNNDDD PPPOOORRRTTT AAAUUUTTTHHHOOORRRIIITTTYYY 222000000222 AAANNNNNNUUUAAALLL RRREEEPPPOOORRRTTT
- 47 -
Net Fair Values - Aggregate Amounts The carrying amounts and net fair values of financial assets and liabilities as at 30 June 2002 are as follows:
2001/02 2000/01 Carrying
AmountNet Fair
Value Carrying Amount
Net Fair Value
$000 $000 $000 $000 Financial Assets Cash assets 10,393 10,393 8,812 8,812Debtors 2,385 2,385 2,129 2,129 Financial Liabilities Payables 1,791 1,791 2,773 2,773
Credit Risk Exposures Credit risk represents the loss that would be recognised if counterparties failed to perform as contracted. The credit risk on financial assets, which have been recognised on the Statement of Financial position, is the carrying amount. The Authority minimises concentration of credit risk by undertaking transactions with a number of customers. NNOOTTEE 2266 -- SSeeggmmeenntt IInnffoorrmmaattiioonn The mission statement of the Authority is “To facilitate trade through the Port of Port Hedland.” The Authority’s activities are directed towards achieving its mission and in this regard operates in one reportable business segment for the purpose of AASB 1025 “Segment Reporting”. The Authority operates predominantly in the one geographic segment, being Western Australia.

PPPOOORRRTTT HHHEEEDDDLLLAAANNNDDD PPPOOORRRTTT AAAUUUTTTHHHOOORRRIIITTTYYY 222000000222 AAANNNNNNUUUAAALLL RRREEEPPPOOORRRTTT
- 48 -

PPPOOORRRTTT HHHEEEDDDLLLAAANNNDDD PPPOOORRRTTT AAAUUUTTTHHHOOORRRIIITTTYYY 222000000222 AAANNNNNNUUUAAALLL RRREEEPPPOOORRRTTT
- 49 -
22000022//0033 FFiinnaanncciiaall EEssttiimmaatteess
OOPPEERRAATTIINNGG BBUUDDGGEETT (Not subject to Audit) In accordance with the Port Authorities Act 1999, the Authority is required to prepare and submit a Statement of Corporate Intent including annual estimates to the responsible Minister. The Port Hedland Port Authority's 2002/2003 budget was prepared in March 2002 and after endorsement by the Authority's Board it was subsequently submitted to the Minister for Planning and Infrastructure for approval. In framing the budget every effort is made to achieve the Port Authority's financial obligations, maintain a balance between Government requirements, the Port Authority's financial well being and the satisfaction of its customers. The summary of the Operating Budget, which appears below, is predicated on customers' forecast throughputs and estimated expenditure to service that activity and to maintain the fabric of the Authority's assets. The 2002/2003 Operating Budget achieves these aims and provides an estimated ROR of 10.6%, based on the deprival method of valuing assets, which is a change from the previous period where the written down current cost value of assets was used. The rate for the budget year is above the target ROR of 6.5% nominated by the Minister. Operating Budget 2002/03
2001/02 Actual
2002/03Estimate
$000 $000Revenue Account Pilotage Dues 3,182 3,978Tonnage Dues 3,478 4,096Harbour Maintenance Levy 168 146Wharfage 2,336 2,252Lease Rentals 1,513 1,592Berthage 336 408Other 2,041 2,366 Total Earnings 13,054 14,838 Expenses Salaries and Employee Related Costs 1,584 1,669Pilotage Contract 1,519 2,114Maintenance 2,091 2,215Helicopter, Hydrographic Survey and Pilot Boat 1,211 1,642Depreciation 1,902 2,453Employee entitlements 162 134Loss on sale of fixed assets 12 -Other 1,957 2,328 Total Expenses 10,438 12,555 Surplus/ (Deficit) 2,616 3,283

PPPOOORRRTTT HHHEEEDDDLLLAAANNNDDD PPPOOORRRTTT AAAUUUTTTHHHOOORRRIIITTTYYY 222000000222 AAANNNNNNUUUAAALLL RRREEEPPPOOORRRTTT
- 50 -
CCAAPPIITTAALL BBUUDDGGEETT (Not subject to Audit) The Authority's budget for new capital works for 2002/03 is $11,935,000. All projects will be funded internally and consequently, no borrowing will be required. The table below summarises the Authority's proposed capital works for 2002/03. Capital Works Programme 2002/03 2002/03
$000New Capital Works 2002/03 Motor Vehicle Replacements 115Housing Upgrades and replacements 380Office Extension 500Office Equipment and Computer Upgrade 150Fire and safety equipment 320DUKC/PVTS/SUKC upgrades 470Wharf Extension 7,000Capital Dredging 2,0002 x Tug Pens 750Contingency 250 Total for 2002/2003 11,935

PPPOOORRRTTT HHHEEEDDDLLLAAANNNDDD PPPOOORRRTTT AAAUUUTTTHHHOOORRRIIITTTYYY 222000000222 AAANNNNNNUUUAAALLL RRREEEPPPOOORRRTTT
- 51 -
PPPOOORRRTTT HHHEEEDDDLLLAAANNNDDD PPPOOORRRTTT AAAUUUTTTHHHOOORRRIIITTTYYY
SSSTTTAAATTTIIISSSTTTIIICCCAAALLL IIINNNFFFOOORRRMMMAAATTTIIIOOONNN
222000000222

PPPOOORRRTTT HHHEEEDDDLLLAAANNNDDD PPPOOORRRTTT AAAUUUTTTHHHOOORRRIIITTTYYY 222000000222 AAANNNNNNUUUAAALLL RRREEEPPPOOORRRTTT
- 52 -
PPeerrffoorrmmaannccee IInnddiiccaattoorrss OOPPEERRAATTIIOONNAALL The outcome is To provide expert marine pilotage to allow uninterrupted movement in and out of the port for shipping, including ultra large bulk carriers 01/02 00/01 99/00 98/99 97/98 Effectiveness No. of Piloted Movements 1231 1377 1200 1,222 1,256 Port Closure (Hours) 32.0 19.0 114.9 76.0 15.8 Efficiency Number of Accidents to Vessels and Port 0 2 0 0 0 Ratio of Accidents / Total Vessel Movements (a) .000 .003 .000 .000 .000 Comment Accident is defined as: “Any event involving the movement of a ship, which results in damage”. PPOORRTT SSEERRVVIICCEESS The objective is To provide wharves, storage facilities and services to meet customers' needs in a cost effective manner. Effectiveness
01/02 00/01 99/00 98/99 97/98 Berth Occupancy (per cent): (b) Nelson Point Berth 77% 86% 85% 85% 86% Finucane Island Berth 61% 66% 65% 49% 47% PHPA No. 1 Berth 33% 37% 28% 24% 34% PHPA No. 3 Berth 27% 39% 33% 36% 34% Average Ship Alongside Time: (c) Nelson Point Berth 34hrs 38hrs 42hrs 39hrs 38hrs Finucane Island Berth 52hrs 59hrs 68hrs 67hrs 58hrs PHPA No. 1 Berth 43hrs 39hrs 36hrs 37hrs 45hrs PHPA No. 3 Berth 32hrs 27hrs 28hrs 30hrs 31hrs

PPPOOORRRTTT HHHEEEDDDLLLAAANNNDDD PPPOOORRRTTT AAAUUUTTTHHHOOORRRIIITTTYYY 222000000222 AAANNNNNNUUUAAALLL RRREEEPPPOOORRRTTT
- 53 -
Average Cargo Tonnes Lifted per Vessel:
01/02 00/01 99/00 98/99 97/98
Iron Ore Vessels Nelson Point 154,555 152,586 150,250 148,335 147,210 Finucane Island 123,204 124,270 103,161 119,590 108,017
Salt Vessels 34,040 27,876 31,053 31,355 31,170 Fuel Tankers (inc. bitumen) 23,093 18,208 12,057 15,712 18,072 General Cargo 1,155 761 792 947 1,263 Bulk Cargo Vessels 27,008 18,811 17,554 9,844 12,415 Acid 7,636 0 0 0 0 Wharf Turnover In Tonnes per Linear Metre of Berthface Nelson Point Berths 92,310 91,357 79,219 85,439 89,713 Finucane Island Berth 40,687 41,169 37,044 34,246 34,860 PHPA Berths 6,776 9,454 8,818 8,780 7,910 Comment The higher this figure, the more productive the wharf. PHPA Wharves only:-
01/02 00/01 99/00 98/99 97/98 Wharf Utilisation (Gross) (e) 30% 38% 33% 24% 25% Wharf Utilisation (Net) (f) 21% 25% 29% 21% 20% Throughput in Tonnes per hour (g) Salt Gross 1,406 1,324 1,026 1,159 1,031 Net 1,647 1,598 1,104 1,281 1,219 Oil Gross 750 545 367 574 617 Net n/a 694 394 635 724 General Cargo Gross 48 46 27 27 19 (inc. l/s, scrap, cem, cont) Net 71 53 41 37 36 Misc Bulk Minerals Gross 391 411 219 266 261 Net 431 536 284 339 332 Comment The closer together the gross and net figures are, the greater the productive usage of facilities. Unit Cost:- Cents per tonne Total Cost per Cargo Tonne 14.4 19.5* 15.6 14.4 15.2 Total Cost per Gross Registered Tonnes 25.4 34.2* 27.5 25.3
26.8
* Includes maintenance dredging cost.

PPPOOORRRTTT HHHEEEDDDLLLAAANNNDDD PPPOOORRRTTT AAAUUUTTTHHHOOORRRIIITTTYYY 222000000222 AAANNNNNNUUUAAALLL RRREEEPPPOOORRRTTT
- 54 -
KEY: (a) Number of accidents to annual ship movements. (b) The total ship alongside hours for each berth expressed as a percentage of the total hours in the year. (c) The total ship alongside hours of each berth divided by the number of vessels using the berth throughout
the year. (d) The total number of hours each class is required to wait divided by the total port calls by each class of
vessel. (e) Total metre/hours of vessels alongside expressed as a percentage of the total available berth
metre/hours. Vessel metre/hours is a function of the length of the vessel and the hours, which it spent alongside. Berth metre/hours are a multiple of the length of the berth times the total hours available.
(f) Measures the productive usage of the wharf i.e. the proportion of metre/hours when vessels are involved in loading or discharging cargo.
(g) The Gross figure includes all time spent alongside by a vessel, whether cargo working or not. The Net figure relates to output achieved whilst work is in progress.

PPPOOORRRTTT HHHEEEDDDLLLAAANNNDDD PPPOOORRRTTT AAAUUUTTTHHHOOORRRIIITTTYYY 222000000222 AAANNNNNNUUUAAALLL RRREEEPPPOOORRRTTT
- 55 -
SSttaattiissttiiccaall IInnffoorrmmaattiioonn 22000022 Wharf Throughput in Tonnes 2001/02 2000/01 1999/00 1998/99 1997/98 Nelson Point Berth 60,740,039 60,112,992 53,789,719 56,219,058 59,031,373Finucane Island Berth 8,951,193 9,057,232 8,149,743 7,534,171 7,669,215PHPA Berths 2,683,194 3,743,325 3,491,775 3,476,851 3,132,451
Port Trade Imports (Tonnes) 01/02 00/01 99/00 98/99 97/98 Sulphuric Acid 61,084 62,192 29,367 13,684 7,879Cement 4,048 5,068 0 0 0Bentonite Clay 0 0 0 0 6,945Bitumen 8,964 3,093 5,877 0 0Containerised Cargo 5,419 2,888 3,298 1,120 966Fuel Oils 273,063 254,914 242,055 269,132 315,312General (inc. Scrap) 4,173 11,821 3,479 1,538 15,382 356,751 339,976 284,076 285,474 346,484Exports Iron Ore 68,625,123 68,469,377 61,535,621 63,705,916 66,700,588Hot Briquetted Iron 1,066,109 700,847 403,841 47,313 0Salt 1,702,018 2,787,599 2,825,827 3,041,446 2,524,755Bulk Cargo (inc. Mang, Feld, Copper, Nickel & Chromite)
594,176 577,367 364,507 127,977 241,362
Livestock 15,404 18,991 11,801 10,737 4,062General (inc. cont’s) 4,711 2,135 1,427 11,217 15,788Scrap 10,134 8,480 3,507 0 0Oil 0 8,777 0 0 0 72,017,675 72,573,573 65,146,531 66,944,606 69,486,555 Total Throughput 72,374,426 72,913,549 65,431,080 67,230,080 69,833,039

PPPOOORRRTTT HHHEEEDDDLLLAAANNNDDD PPPOOORRRTTT AAAUUUTTTHHHOOORRRIIITTTYYY 222000000222 AAANNNNNNUUUAAALLL RRREEEPPPOOORRRTTT
- 56 -
Main Cargo Distribution by Destination
IRON ORE SALT TOTAL
2001/02 2000/01 2001/02 2000/01 2001/02 2000/01 Tonnes
000’s
% Tonnes 000’s
% Tonnes
000’s
% Tonnes 000’s
% Tonnes 000’s
% Tonnes %
Japan 28,237 41.1 28,221 41.2 526 31 1,217 43.7 28,853 41.0 29,438 41.3 Korea 12,695 18.5 11,463 16.8 650 38 890 31.9 13,345 19.0 12,353 17.3 China 13,693 20.0 10,908 15.9 0 0 0 0 13,693 19.5 10,908 15.3 Interstate 4,116 6.0 4,319 6.3 0 0 0 0 4,116 5.9 4,319 6.1 Taiwan 4,978 7.3 5,511 8.0 358 21 169 6.0 5,336 7.6 5,680 8.0 Netherlands
1,198 1.8 1,428 2.1 0 0 0 0 1,198 1.7 1,428 2.0
France 0 0 1,085 1.6 0 0 0 0 0 0 1,085 1.5 Philippines 1,820 2.7 2,532 3.7 20 1 58 2.1 1,840 2.6 2,590 3.6 All other 1,798 2.6 3,002 4.4 148 9 454 16.3 1,946 2.7 3,456 4.9 Total 68,625 100 68,469 100 1702 100 2788 100 70,327 100 71,257 100
Containerised Cargo 2001/02 2000/01 1999/00 1998/99 1997/98 No. of TEU’s 253 103 128 208 1035 Gross Registered Tonnage of Vessels Entered Distributed by Cargo Type 2001/02 2000/01 1999/00 1998/99 1997/98 Iron Ore 37,977,894 38,020,866 34,151,919 35,641,004 37,202,899Hot Briquetted Iron 743,696 500,548 304,676 37,133 -Salt 1,074,269 1,790,724 1,762,513 1,959,836 1,593,922Bulk & General Cargo 816,723 780,773 459,258 303,057 431,217Fuel Tankers (inc. bitumen/acid)
324,796 390,103 453,913 364,022 447,783
Nil Cargo 84,739 133,363 28,796 20,662 8,816 41,022,117 41,616,377 37,161,075 38,325,714 39,684,637
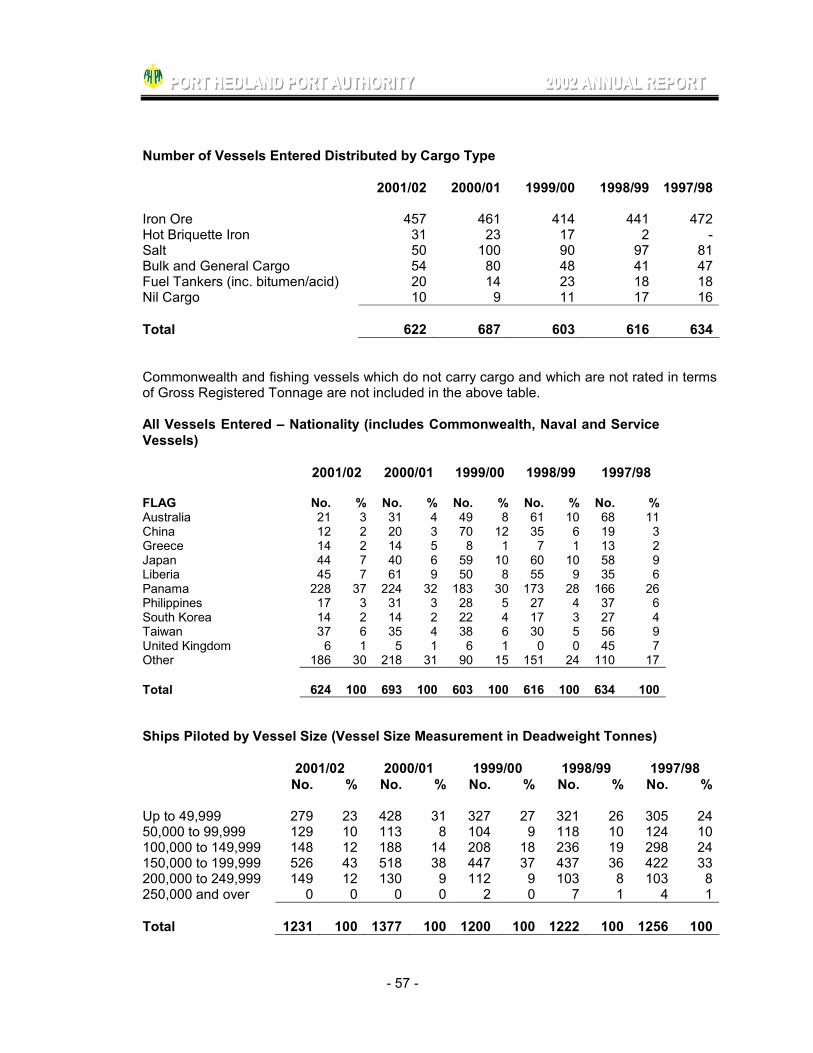
PPPOOORRRTTT HHHEEEDDDLLLAAANNNDDD PPPOOORRRTTT AAAUUUTTTHHHOOORRRIIITTTYYY 222000000222 AAANNNNNNUUUAAALLL RRREEEPPPOOORRRTTT
- 57 -
Number of Vessels Entered Distributed by Cargo Type 2001/02 2000/01 1999/00 1998/99 1997/98 Iron Ore 457 461 414 441 472Hot Briquette Iron 31 23 17 2 -Salt 50 100 90 97 81Bulk and General Cargo 54 80 48 41 47Fuel Tankers (inc. bitumen/acid) 20 14 23 18 18Nil Cargo 10 9 11 17 16 Total 622 687 603 616 634 Commonwealth and fishing vessels which do not carry cargo and which are not rated in terms of Gross Registered Tonnage are not included in the above table. All Vessels Entered – Nationality (includes Commonwealth, Naval and Service Vessels) 2001/02 2000/01 1999/00 1998/99 1997/98 FLAG No. % No. % No. % No. % No. %Australia 21 3 31 4 49 8 61 10 68 11China 12 2 20 3 70 12 35 6 19 3Greece 14 2 14 5 8 1 7 1 13 2Japan 44 7 40 6 59 10 60 10 58 9Liberia 45 7 61 9 50 8 55 9 35 6Panama 228 37 224 32 183 30 173 28 166 26Philippines 17 3 31 3 28 5 27 4 37 6South Korea 14 2 14 2 22 4 17 3 27 4Taiwan 37 6 35 4 38 6 30 5 56 9United Kingdom 6 1 5 1 6 1 0 0 45 7Other 186 30 218 31 90 15 151 24 110 17 Total 624 100 693 100 603 100 616 100 634 100
Ships Piloted by Vessel Size (Vessel Size Measurement in Deadweight Tonnes) 2001/02 2000/01 1999/00 1998/99 1997/98 No. % No. % No. % No. % No. % Up to 49,999 279 23 428 31 327 27 321 26 305 2450,000 to 99,999 129 10 113 8 104 9 118 10 124 10100,000 to 149,999 148 12 188 14 208 18 236 19 298 24150,000 to 199,999 526 43 518 38 447 37 437 36 422 33200,000 to 249,999 149 12 130 9 112 9 103 8 103 8250,000 and over 0 0 0 0 2 0 7 1 4 1 Total 1231 100 1377 100 1200 100 1222 100 1256 100

PPPOOORRRTTT HHHEEEDDDLLLAAANNNDDD PPPOOORRRTTT AAAUUUTTTHHHOOORRRIIITTTYYY 222000000222 AAANNNNNNUUUAAALLL RRREEEPPPOOORRRTTT
- 58 -
Pilot Transit Mode of Operation 2001/02 2000/01 1999/00 1998/99 1997/98 No. % No. % No. % No. % No. % Helicopter 1077 89 1125 82 1005 84 1047 86 1100 88Pilot Boat 137 11 252 18 186 16 168 14 153 14 *Total 1214 100 1377 100 1191 100 1215 100 1253 100 *Excludes in-port movements where the helicopter or pilot boat is not used.