ppoorrtt hheeddllaanndd ppoorrtt …
TRANSCRIPT

PPPOOORRRTTT HHHEEEDDDLLLAAANNNDDD PPPOOORRRTTT AAAUUUTTTHHHOOORRRIIITTTYYY
222000000444 AAANNNNNNUUUAAALLL RRREEEPPPOOORRRTTT
HHiissttoorryy The coast of Western Australia was visited by many exploring parties prior to the foundation of the colony in 1829. However, it was not until 1863 that the vessel ‘Mystery’ dropped anchor in a mangrove inlet, which was given the name of Port Hedland after the
aster of the ‘Mystery’, Captain Peter Hedlund. M Towards the end of the century it became apparent that the pastoral industry in the Eastern Pilbara needed a port, and in 1896 the first Port Hedland jetty was begun. With the discovery of gold in the Marble Bar area a few years later, the jetty was extended in
908, and a railway between Marble Bar and Port Hedland was completed in 1911. 1 From then until the late 1930s, the port was mainly used for the import of stores and producer items for the local industries, and the export of pearl shell, wool, livestock, gold, in and small amounts of copper. t
After the Second World War, the port continued to serve the pastoral industry, and began to export significant quantities of manganese. However, in 1965 the iron ore industry, as we know it today, began in the port, when Goldsworthy Mining Ltd (now BHP Billiton Iron Ore) dredged an approach channel and turning basin for ships of up to 65,000 Dead Weight Tonnes (DWT). At the same time the Leslie Salt Company (now Dampier Salt Ltd) commenced development of a solar salt industry. A new land backed wharf was built to cater for salt exports and to improve the acilities available for the import of fuel and producer items. f
Subsequently the Mt. Newman Mining Company (now BHP Billiton Iron Ore) chose Port Hedland as its export port, and further dredging and development took place to allow the use of the port by very large bulk carriers of up to 120,000 DWT. With experience, the size of vessels was increased, and vessels of up to 315m in length, and 185,000 DWT, were accepted. In 1975/76 further work was carried out when extensions to the turning basin and some hannel widening took place, allowing ships of up to 225,000 DWT to be handled. c
In 1986 major capital dredging was undertaken to deepen the channel by 2.5m. In conjunction with a computerised under keel clearance programme, (the first in an
ustralian port) this allowed the port to handle ships up to 330m, and 260,000 DWT. A The channel at Port Hedland is now 20 nautical miles in length for outward vessels, varying in both width and depth with minima of 183m and 14.2m respectively. Gated pairs of synchronised beacons, which are maintained and owned by the Port Authority mark the channel to Port limits 10 nautical miles offshore. The Outer Channel (beyond Port Limits) which varies in width from 250m to 470m is marked by 13 synchronised beacons owned and maintained by the Australian Maritime Safety Authority. More recently, the Port Authority commissioned its shiploader on No 1 Berth in June 2001 to serve a number of mineral export needs including manganese, chrome, feldspar and copper concentrates. The berthing pocket at No 1 Berth was deepened to 13.2m in 2003 to accommodate Panamax sized vessels to fully load. On February 12, 2004, BHP Billiton opened its upgraded port facilities project which included the construction of a econd berth on Finucane Island capable of handling large bulk ships. s
Today the Port continues to serve the mining and pastoral industries of the Pilbara. Iron ore continues to be the dominant export trade but also important to the regional economy are exports of salt, HBI, manganese, chromite, feldspar, copper concentrates and livestock.
1

HHiigghhlliigghhttss
30 June 2004 Record Annual Throughput 89,799,236 tonnes
30 June 2004 Record Annual Iron Ore Throughput 84,211,788 tonnes
30 June 2004 Record Annual Hot Briquetted Iron 1,827,072 tonnes
30 June 2004 Record Annual Bulk Minerals export 848,012 tonnes
SSttaattiissttiiccaall AAbbssttrraacctt SShhiippppiinngg 2003/04 2002/03 2001/02 2000/01 1999/00 Ratio of Accidents to Total Vessel Movements * .000 .000 .000 .002 .000 Number of Vessels 773 693 624 693 606 Gross Registered Tonnage 50.7 46.1 41.0 41.6 37.2 (millions) Port Throughput - Cargo 89.8 81.4 72.4 72.9 65.4 (millions) * Accident is defined as: “Any event involving the movement of a ship, which results in
damage”. FFiinnaannccee aanndd PPeerrffoorrmmaannccee 2003/04 2002/03 2001/02 2000/01 1999/00 $000 $000 $000 $000 $000 Total Revenue 17,027 15,505 13,054 14,027 12,395 Charges Against Revenue 13,719 12,553 10,438 151,354 10,126 Cumulative Profit (Loss) 23,538 22,419 19,411 17,525 18,606 Working Capital 8,064 8,859 10,318 7,821 14,116 Fixed Assets at Book Value 34,001 31,999 30,543 31,166 162,286 Return on Assets 6.3% 6.7% 10.5% (324%) 4.8% Debt Ratio 1:8 1:8 1:10 1:10 1:57 Total Revenue per 19.0 19.0 18.0 19.2 18.8 cargo tonne (in cents) CChhaannggee iinn CChhaarrggeess 2003/04 2002/03 2001/02 2000/01 1999/00 Annual CPI Change 2.5% 2.1% 2.4% 6.0% 2.6% PHPA Charge Increase * - 7.9% - - - Real Change in Port Charges -0.7% 5.8% -2.4% -6.0% -2.6% Cumulative Total ** -24.0% -20.8% -26.0% -23.0% -16.1% * Equals percentage increase of Pilotage and Tonnage over total budgeted ship and
cargo revenue. ** This represents the compounded total change over the last 10 years.
2

CChhaaiirrmmaann aanndd CCEEOO’’ss RReeppoorrtt The buoyant trade over the last year has created a wonderful result for the Port Authority and it is with pleasure that I submit this report. The strong growth in the world demand for iron ore that we recognised last year has only accelerated. Iron ore exports from Port Hedland took the Port Authority to another new record for trade levels, a result that sees the port move to become Australia’s biggest tonnage throughput port. A number of trade records were set during the year. Most significant were the record annual total throughput of 89,799,236 tonnes representing an increase of almost 10% over the previous year; record annual iron ore exports of 84,211,788 tonnes and record annual HBI exports of 1,827,072 tonnes. Salt exports continue to rebound steadily from the low of a few years ago and manganese and chromite exports have again led the increase in the total quantities loaded over the Authority’s shiploader on No 1 Berth. There was also a comparable increase in the number of shipping movements to carry the record cargo volumes. This has placed additional demands on our Pilots and other marine service providers who have all met the challenge professionally and efficiently. We were pleased to be able to hold charges steady again in 2003/04 and no increase is proposed in 2004/05. However, we do recognise some factors that will create upward pressure on pricing in the next couple of years. The financial performance of the Port Authority was very good with a net operating profit of $3,307,528. Of this, a total of $2,188,533 or approximately 66% of net operating profit will be paid to the State in the form of dividends and taxes. The drive for improvements in operations and maintenance activity to support the increase in shipping and trade continued. BHP Billiton purchased and put into operation two new tugs rated at 65 tonne bollard pull. Stevedoring services on the Authority’s berths were much improved and, with the support of our maintenance contractor, Cervan Marine, port maintenance planning and execution continued to show benefits. In addition, the Authority’s increasing effort on environmental management in collaboration with shippers has seen improvements in key areas such as dust levels. Dredging maintenance was carried out in 2004 yielding much improved depths and restoring the capacity for larger shipments. The Authority’s Ultimate Development Plan was released for public comment in August 2003. The purpose of the Plan is to provide a strategic framework and to protect the future opportunities for the long term development of the port. Following release a number of submissions were received, primarily expressing concerns about potential impact on nearby residents and the environment. Most concerns were expressed by those living in the caretaker residences in the Wedgefield Industrial Estate which under the Plan lies within an area that is likely to be impacted by future port development activity. The process of investigating and preparing a comprehensive response to the submissions is almost complete. Following feedback to those that made submissions, the plan will be finalised and presented to the
3
Environmental Protection Authority and the Western Australian Planning Commission for consideration. The Authority has now launched a further planning study, this one focussed on the capacity of the port to handle the projected growth in shipping movements. This study is the corollary of the Ultimate Development Plan, which is focussed on protecting opportunities for land development. The capacity study is a significant initiative and will not be complete until the end of 2005. The dynamic growth in demand for iron ore exports and other trades is driving port development. BHP Billiton’s PACE Project was completed during the year and the new port facilities were opened in February 2004. Extension of the Port Authority’s No 1 Berth commenced but will not be complete until early 2005. Preliminary site assessment work on Newcrest’s new port storage shed for its copper concentrates was conducted and, after a lengthy environmental approval process, construction will commence in July 2004. Work on the Hope Downs project has continued quietly and steadily. The Authority is hopeful that the company will submit a development proposal to Government at the end of 2004 that will lead to the development of further iron ore export facilities in the port. In addition, a new company, Fortescue Metals Group (FMG) has emerged as the proponent of an ambitious iron ore project. If both of these projects are developed, they will lead to a massive increase in trade through the port. The challenges and opportunities for the port are substantial and exciting. With the support of the Board and the efforts of our staff we are responding to these challenges and opportunities. Our appreciation is extended to the Directors for their ideas and diligence and to the Authority’s staff and our contractors for their dedication. Ian Williams Ian Hutton CHAIRMAN CHIEF EXECUTIVE OFFICER
4

CCoorrppoorraattee PPllaann The Authority’s Vision, Mission and Broad Objectives provide guidance in its decision making. These were first adopted in 1999 and are still seen as being relevant and helpful. V Viissiioonn To be recognised by customers and other stakeholders as providing the best mix of facilities and services at the Port of Port Hedland. MMiissssiioonn To facilitate trade through the Port of Port Hedland. BBrrooaadd OObbjjeeccttiivveess S Seerrvviiccee PPrroovviissiioonn The provision of reliable, competitive and efficient port and marine services that meet and are responsive to the needs of users. P Poorrtt FFaacciilliittiieess The provision and maintenance of suitable, reliable and competitive port facilities to meet user needs. PPllaannnniinngg aanndd DDeevveellooppmmeenntt Through forward planning, ensure that future development is not unreasonably constrained by external restrictions, effectively meets the needs of expected trades, is coordinated, and efficiently uses the port area. TTrraaddee FFaacciilliittaattiioonn Facilitate trade and business opportunities within and through the Port. F Fiinnaanncciiaall To establish pricing for users of port services and facilities commensurate with the achievement of the required return on Government investment and consistent with the Authority’s trade facilitation objective. H Huummaann RReessoouurrcceess To provide a safe, healthy and supportive environment that encourages employees to work with commitment and enthusiasm to achieve corporate objectives. EEnnvviirroonnmmeenntt,, CCoommmmuunniittyy SSaaffeettyy aanndd HHeeaalltthh Ensure the impact of development and operational activities within, and adjacent to, the port meet recognised standards for the environment and for community safety and health. C Coommmmuunniittyy SSuuppppoorrtt Establish and maintain a close relationship with the Port Hedland community in order to win support for current port operations and future developments.
5

AAcchhiieeveemmeennttss AAggaaiinnsstt SSttaatteedd MMaajjoorr GGooaallss PPllaannnneedd FFoorr 22000033//22000044 v
The Authority set a number of major goals for itself for 2003/2004 in its Statement of Corporate Intent submitted to the Minister for Planning and Infrastructure. Those goals and the achievements in respect of those goals are detailed below:
GGooaallss AAcchhiieevveemmeennttss
SSeerrvviiccee PPrroovviissiioonn Establish new licensing arrangements with better defined KPIs and introduce a tighter performance monitoring system to promote the high quality stevedoring services sought by customers and the Port Authority.
New KPIs have been agreed and introduced into a new licence document which is ready for execution.
Work with service providers and customers to resolve concerns about the costs of some privately provided services.
Significant improvements have been achieved in the area of stevedoring services.
Review and update the Authority’s Pilotage Standards in consultation with the Marine Pilots.
This work was not completed. A program for upgrading various documents in 2004/05 is to be implemented.
Update the Authority’s suite of emergency response plans.
This work was not completed. A Program for upgrading various documents in 2004/05 is to be implemented.
Investigate the optimum mix of tugs, their number and power, to handle future shipping requirements.
Simulation in Launceston in 2003 was used to determine the required power of tugs for future operations.
PPoorrtt FFaacciilliittiieess Complete extension of the No 1 Berth to allow smaller vessels to be stevedored simultaneously with bulk ore loading.
A design and construct contract was awarded early in 2004 and on site work had begun during June. The extension will not be complete until early 2005.
Carry out improvements to the shiploading facility to minimise the cost of operation and spillage of product. The specific aim is to develop a zero spillage shiploader prior to the export of copper concentrate in March 2004.
Considerable work was completed during the year. However, with the delay to the start of copper concentrate shipments, work is continuing beyond the end of the year.
Provide purpose built and user friendly races for the loading of livestock including cattle and goats.
Privately constructed facilities were tested. The stevedore is to redesign these to overcome some limitations.
In conjunction with planned mineral stockpiling changes, review the location and style of office accommodation for port tenants that will be dislocated. Facilitate the provision of appropriate accommodation and the relocation of tenants if necessary.
This has been deferred until the company seeking to occupy the area now occupied by tenants has resolved its future plans.
Establish a single manned entry point for access to the Port areas to meet new security requirements consistent with IMO and national standards.
The entry point has been designed but will be constructed in 2004/05.
Upgrade VHF and HF equipment as part of a longer term plan to establish a full range of modern radio communication equipment.
The preferred equipment is still under investigation.
6

Upgrade the radar to AIS capability to meet the IMO 2004 deadline as part of the port’s safety and security enhancement.
Options of upgrading the existing system and replacement have been investigated but a decision is still to be made on the preferred option.
Complete the upgrade of tide and sea state monitoring equipment to ensure the accuracy of data for hydrographic surveys and for input to the Dynamic Under Keel Clearance (DUKC) system.
Completed
Obtain an offshore dredge spoil disposal permit to facilitate dredging planned for July 2004.
This and the dredging itself were completed during this reporting year.
Investigate the feasibility of providing a limited number of moorings suitable for small commercial craft and, if feasible at an acceptable cost, provide those moorings.
This project has not been completed due to constraints on the availability of capital funds.
PPllaannnniinngg aanndd DDeevveellooppmmeenntt Plan and support the development of improved storage and handling of bulk mineral products such as copper concentrates, manganese and chrome.
• Planning for the consolidation of stockpiles and improved handling methods was completed but is under review by the company in an effort to reduce the project’s cost.
• Planning, design and construction of a
new storage facility for copper concentrates connected to the shiploading system is well advanced. The Authority has invested in parts of the project and has actively supported the development process.
Support and assist BHP Billiton with the completion of its PACE Project development.
The project was successfully completed with support and assistance from the Authority.
TTrraaddee FFaacciilliittaattiioonn It is not proposed to increase general charges during 2003/04. Projections of increasing trade volumes will yield revenue increases and profit increases that satisfy the Authority’s commercial objectives. Holding charges at 2002/03 levels will yield some real benefit to port users.
Charges were held at 2002/03 levels.
Achieve improvements in the efficiency and effectiveness of port and marine services and facilities as indicated above.
Achievements are indicated above.
FFiinnaanncciiaall The Authority has budgeted to achieve a net profit before tax of $2,151,247 which represents a return of 13% of turnover. This result is marginally below the average over the previous six years. In 2002/03 Pilotage and Tonnage charges were increased by 12% due to increases in the cost of providing those services, which was the first significant charge
The net profit before tax was $3,370,528 representing 19% of turnover. A ROR of 6.3% was achieved which was marginally below the long term target of 6.5%.
7

increase since 1987. The Authority is cognisant of meeting the Government’s Rate of Return requirements and will achieve this without further increases in Port charges in 2003/04. The estimated ROR on the deprival value of assets for the budget year is 6.5%. HHuummaann RReessoouurrcceess Continue the program of replacing older staff housing with new construction to assist the Authority to recruit and retain high calibre staff.
Redevelopment of one property to provide a modern staff residence commenced during the year.
EEnnvviirroonnmmeenntt,, CCoommmmuunniittyy SSaaffeettyy aanndd HHeeaalltthh
Develop and implement a Port Security Plan consistent with the IMO guidelines and the DOTARS requirements for Ports.
The plan was submitted and approved by DOTARS before the required date.
Review and update the Port’s Marine Pollution Response Plan.
This work was not completed. A program for upgrading various documents in 2004/05 is to be implemented.
Respond promptly and effectively to oil spill/contamination incidents within the port. Maintain staff skills through regular exercises and training.
Minor spills were responded to promptly and effectively. Staff skills were exercised and enhanced through training.
Minimise contamination of the harbour sediments from product spillage.
Continuous improvements to the shiploader are reducing opportunities for product spillage to the marine environment.
Monitor dust levels within the port and seek continual improvement in accordance with the Environmental Management Plan.
A dust monitoring program was implemented in an effort to measure dust emissions from port operations. Results to date have been encouraging and management initiatives have been put in place where problems have been identified.
Adopt all practicable initiatives in the reduction of energy usage and improved material recycling.
The Authority participated in the Water Corporations Water Achiever Program which culminated in a Water Management Report. Additional budgeted items have been included for next financial year including the installation of a waste oil reception facility and funds to undertake a waste, energy and water audit of port operations.
CCoommmmuunniittyy SSuuppppoorrtt Continue regular meetings of the Port Community Consultative Committee.
Meetings held every two months.
8

MMaajjoorr GGooaallss PPllaannnneedd FFoorr 22000044//22000055 SSeerrvviiccee PPrroovviissiioonn Establish new licensing arrangements with better defined KPIs and introduce a tighter performance monitoring system to promote the high quality stevedoring services sought
y customers and the Port Authority. b Work with service providers and customers to resolve concerns about the costs of some
rivately owned services. p Review and update the Authority’s Pilotage Standards in consultation with the Marine Pilots. Investigate the optimum mix of tugs, their number and power, to handle future shipping equirements. r
Update the Authority’s suite of emergency response plans. PPoorrtt FFaacciilliittiieess Complete the extension of No 1 Berth to allow smaller vessels to be stevedored imultaneously with bulk ore loading. s
Carry out improvements to the shiploading facility to minimise the cost of operation and spillage of product. The specific aim is to develop a zero spillage shiploader prior to the
xport of copper concentrates in December 2004. e Provide purpose built and user friendly races for the loading of livestock including cattle
nd goats. a In conjunction with planned mineral stockpiling changes, review the location and style of office accommodation for port tenants that will be dislocated. Facilitate the provision of appropriate accommodation and the relocation of tenants if necessary. Establish a single manned entry point for access to the port areas to meet new security equirements consistent with International Maritime Organisation and national standards. r
Upgrade VHF and HF equipment as a part of a longer term plan to establish a full range
f modern radio communication equipment. o Upgrade the radar to AIS capability to meet the IMO 2004 deadline as part of the port’s safety and security enhancement. Complete the upgrade of tide and sea state monitoring equipment to ensure the accuracy of data for hydrographic surveys and for input to the Dynamic Underkeel Clearance DUKC) system. (
Development off two new tug pens in tug haven. Investigate the feasibility of providing a limited number of moorings suitable for small commercial craft and, if feasible at an acceptable cost provide those moorings. PP
llaannnniinngg aanndd DDeevveellooppmmeenntt Plan and support the development of improved storage and handling of bulk mineral
roducts such as copper concentrates, manganese and chromite. p
9

TTrraaddee FFaacciilliittaattiioonn It is not proposed to increase general charges during 2004/05. Projections of increasing trade volumes will yield revenue increases and profit increases that satisfy the Authority’s commercial objectives. Holding charges at 2002/03 levels will yield some real benefit to
ort users. p Achieve improvements in the efficiency and effectiveness of port and marine services and facilities as indicated above.
FFiinnaanncciiaall The Authority has budgeted to achieve a net profit before tax of $2,151,247 which represents a return of 13% of turnover. This result is marginally below the average over the previous six years, due to an expected 19% increase in operating expenses. Expected borrowings in excess of $3m during the year will be required to assist with the financing of a $15m capital works program. The Authority is cognisant of meeting the Government’s Rate of Return requirements and will achieve this without further increases in Port charges in 2003/04. The estimated ROR on the deprival value of assets for the budget year is 6.5%. HHuummaann RReessoouurrcceess Continue the program of replacing older staff housing with new construction to assist the Authority to recruit and retain high caliber staff. E Ennvviirroonnmmeenntt,, CCoommmmuunniittyy SSaaffeettyy aanndd HHeeaalltthh Develop and implement a Port Security Plan consistent with the IMO guidelines and the
OTARS requirements for ports. D R
eview and update the port’s Marine Pollution Response Plan.
Respond promptly and effectively to oil spill/contamination incidents within the port. aintain staff skills through regular exercises and training. M
M
inimise contamination of the harbour sediments from product spillage.
Monitor dust levels within the port and seek continual improvement in accordance with the nvironmental Management Plan. E
Adopt all practicable initiatives in the reduction of energy usage and improved material recycling.
10

PPeerrssoonnnneell
Organisational chart
BOARD
CHIEF EXECUTIVE OFFICER Ian Hutton
EXECUTIVE SECRETARYAdele Ewen
MANAGER, FINANCE & ADMIN HARBOUR MASTER MANAGER, TECHNICAL SERVICES Lindsay Copeman Graham Gardner
Lyle Stanley
ACCOUNTANT SENIOR MARINE OFFICER Rick PochrojENVIRONMENTAL ENGINEER
Gary Duscher Craig Wilson HUMAN RESOURCES
/ADMINISTRATION OFFICER LEADING HAND
SECURITY OFFICER Neville Diver Annette Christie Michael Garvey
SYSTEMS ADMIN OFFICERPORT MARINE OFFICERS Allen Trigg Geoff Tremenheere
Ilse Gosper Peter O’Loughlin
Matt Reid ACCOUNTS OFFICER James Forbes Claire Coleman
CLERICAL OFFICER Vicki Denton
11

PPoolliiccyy SSttaatteemmeennttss EEmmppllooyymmeenntt It is the committed policy of Port Hedland Port Authority to ensure that the talents and resources of employees are utilised to the full and that no job applicant or employee receives less favourable treatment on the grounds of age, sex, marital status, pregnancy, race, family, religious or political conviction, or impairment. In addition, this organisation is committed to promoting equal employment opportunity for all of its employees. The overall responsibility for monitoring the effectiveness of this policy, and for implementing an on-going program of action to make the policy fully operative, is vested
the Chief Executive Officer. in It is the responsibility of all employees to accept their personal involvement in the practical application of this policy. O Occccuuppaattiioonnaall HHeeaalltthh aanndd SSaaffeettyy This policy recognises that the safety and health of all employees within this Authority is the responsibility of Authority management. In fulfilling this responsibility, management has a duty to provide and maintain so far as is practicable a working environment that is afe and without risks. s
The Chief Executive Officer is responsible for the implementation and monitoring of this policy. The safety and health duties of management at all levels are documented, and Authority procedures for training and back-up support are followed. In fulfilling the objectives of this policy, management is committed to regular consultation with employees to ensure that the policy operates effectively, and that safety and health issues are regularly reviewed. In this respect, the Authority has established a Safety and Health Committee comprising of representatives from each section and of representatives of key contractors. Management seeks co-operation from all employees in realising our safety and health objectives and creating a safe work environment. All employees will be advised, in writing, of agreed changes and arrangements for their implementation.
12

Workplace injuries performance indicators
Notes 2003/04 2002/03 2001/02 2000/01 1999/00 No of lost time injuries 0 0 0 0 0 Lost time injury frequency (1) 0 0 0 0 0 Rate Estimated cost of claims (2) 0 0 0 0 0.045 Incurred/$100 wages roll Premium rate (3) 1.87 2.90 2.84 2.98 3.11 Rehabilitation success rate (4) - - - - - Notes: These indicators have been prepared from information provided by the underwriters, Riskcover: (1) The Lost Time Injury Frequency Rate is the number of lost time injuries/diseases where one
day or more was lost multiplied by 1,000,000, divided by the total hours worked. (2) Estimated Cost of Claims incurred per $100 wages is the actuarially estimated cost of claims
incurred in the renewal period, adjusted to their present day value, multiplied by 100, divided by total wages.
(3) Premium Rate is the total premium paid, multiplied by 100 and divided by total wages. (4) Rehabilitation Success Rate is the number of rehabilitated employees, multiplied by 100 and
divided by the number of eligible employees.
SSttaaffffiinngg New appointments Ms Claire Coleman – Accounts Officer Ms Helen Russell – Executive Secretary Ms Adele Ewen – Executive Secretary Mr Allen Trigg–Records & Systems Administrator Resignations Ms Jennifer Duscher – Executive Secretary Ms Helen Russell – Executive Secretary FFuuttuurree DDiirreeccttiioonn –– HHuummaann RReessoouurrcceess The level of staff turnover has reduced compared to recent years and the Port Authority has now established a stable team within the Authority to continue to improve the
fficiency of Port operations. e It is proposed to develop the Performance Enhancement system which will identify training needs and allow for a focussed training program for all staff members. A review of Human Resource policies and procedures is to continue during the year, along with the
egotiation of a new Certified Agreement to be implemented in December of 2004. n The overall aim of all of the above objectives is to retain valuable staff by making the Port Authority an attractive and supportive environment in which to work.
13

OOvveerrvviieeww ooff PPoorrtt OOppeerraattiioonnss IInnttrroodduuccttiioonn The Town of Port Hedland is located in the Pilbara Region of North Western Australia and
some 1,650 kilometres by road from Perth, the state capital. is The Port of Port Hedland includes all waters within a radius of 10 nautical miles of Hunt Point at the Harbour entrance, and incorporates an extensive land area above the HW mark in the area around the port proper for Port related activities and future development. Under the terms of the Port Authorities Act 1999, the Authority has the exclusive control of
e Port and is charged with the maintenance and preservation of all property vested in it. th The Authority maintains navigational channel markers and aids, wharves, cargo sheds, roads and all ancillary facilities necessary for the effective operation of the Port. TTrraaddee aanndd SShhiippppiinngg Cargo throughput for the financial year 03/04 lifted Port Hedland into position as Australia’s largest tonnage port with a throughput of almost 90,000,000 tonnes. Iron Ore exports were just above 84,000,000 tonnes for the year and HBI exports rose to 1,758,866 tonnes. Bulk mineral exports increased to 848,012 tonnes and Salt exports of 2,450,553 tonnes all contributed to this impressive record breaking result. Other exports included Scrap Metal, General Cargo and Containers. Imports include cargo such as
iquid Petroleum Products, Bitumen, Sulphuric Acid, General Cargo and Containers. L The number of ships visiting the port was 773 compared to the 693 ship visits during
002/2003. 2 Future growth in commodity exports is expected to boost the annual throughput to over 105,000,000 tonnes by the end of this financial year. PP
oorrtt OOppeerraattiioonnss The ports bulk shiploader has performed well, design and operating improvements resulted in a gross loading rate of 652 tonnes/hour together with a net loading rate of 758 tonnes/hour averaged across the years 30 shipments of Manganese, Chrome and
eldspar. F Recent shiploader design improvements together with improvements in ore management and loading procedures have paid particular attention to spillage and cleaning of the loader and conveyor system with positive results and a consequent reduction in environmental incidents. Copper Concentrate shipments are expected to resume in the
st quarter of 2004. la Maintenance Dredging was brought forward due to a number of identified high spots within the dredged channel and siltation of the inner harbour and berths was affecting loading drafts and sailing windows. A contract to remove 600,000 cubic metres of silt was awarded to Dredeco utilising the very large trailer suction dredge, Pearl River. The dredging campaign commenced in June to run for three weeks Post dredge survey results reveal that depth in all sections of the channel exceed design grade.
14

P Poorrtt SSeeccuurriittyy Following the terrorist attacks on New Yorks twin towers on 11/09/01 the International Maritime Organisation moved an amendment to the Safety Of Life At Sea convention in the form of the International Ship and Port Security Code (ISPS) to reduce the risk of a hip or port being used for or to support terrorist activities. s
The Federal Government enacted the Maritime Security Act (2003) and Regulations (2004) to give effect to the code in Australian Ports and Ships. All Ports engaged in foreign trade are required to conform to the Act and ISPS code. The principal aspect of the code is the requirement of a port or port facility to have and to maintain a Security Plan designed to achieve certain security outcomes. The Port’s Maritime Security Plan was approved in the second quarter of 2004 which will
corporate a significant number of changes to the Port and its environs. in Delineated landside and waterside secure areas, an increased surveillance capability and stricter access control procedures are some of the measures adopted under the Security Plan. TTeecchhnnoollooggiiccaall IImmpprroovveemmeennttss D Dyynnaammiicc UUnnddeerr KKeeeell CClleeaarraannccee SSyysstteemm ((DDUUKKCC)) OMC International Pty Ltd has been pressing forward with work on the DUKC Series IV system. Series IV will incorporate several enhancements to Series III and it is hoped to have all elements completed by the end of the 2004 calendar year. Commissioning of the AWAC and Vega wave and tide data delivery system installed during the year is nearing completion. This new equipment will improve the quality and reliability of wave and tide data for the DUKC. P Poorrtt CClloossuurreess Although five cyclones formed off the North West coast during the 2003/2004 cyclone season there was limited activity around the Port Hedland area with only two coastal crossings in the Pilbara. The Port experienced some delays due to swell and wind conditions in February when cyclone Monty passed offshore as a category 4 system. Monty crossed the coast at
ardie Station west of Dampier as a category 3 on the 2 of March. M Inbound shipping was delayed on the 25 March and the Port was closed for 28 hours from noon on the 26 March as cyclone Fay threatened the Port as a category 4 cyclone. Fay crossed the coast on the 27 March as a category 3 some 90 nautical miles east of the port. Other than for the delay she had little impact on the port. P Pllaannnniinngg aanndd DDeevveellooppmmeenntt The Port Hedland Port Planning Study was released for public comment during the first quarter of 2004. Planning approvals were granted for the Copper Concentrate storage acility, building should commence in the third quarter of 2004. f
Funding and approvals for the extension to No1 wharf have been received and work should commence on the project during the early part of the third quarter of 2004. OOccccuuppaattiioonnaall SSaaffeettyy aanndd HHeeaalltthh The Port Hedland Port Authority is committed to the provision of a safe and healthy work environment. A complete re-write of the Occupational Health and Safety Management
15

Plan is nearing completion. An accident and incident database is now in use which is proving to be a useful tool for establishing trends and identifying problem areas. P Piilloott TTrraannssffeerrss The majority of Marine Pilot transfers from ships entering or leaving Port Hedland harbour
re carried out by Helicopter transfer. a The pilot launch continues to be used for those vessels where ship design or cargo precludes transfer by air e.g. Petroleum Tankers, or when prevailing weather conditions prevent the use of the aircraft. In over 30 years of operation the use of Helicopters in Marine Pilot transfers has risen rom approximately 47% in 1974/75 to in excess of 90% during the year 2003/2004. f
There were 1525 piloting movements in 03/04, an increase of 12% compared to 02/03. PPoorrtt FFaacciilliittiieess PPoorrtt AArreeaa The Port area vested in the Authority comprises the water mass of the Inner harbour with all of the adjacent shore except for the BHP Billiton Iron Ore leaseholds at Finucane Island and Nelson Point. To seaward, the port’s boundary is delineated by an arc of 10 nautical miles radius centred upon Hunt Point (at the entrance to the Inner Harbour) and erminating at the high water mark at the shore line to the east and west of the port. t
A Pilotage Area, which lies beyond the boundaries of the port to seaward within an arc of 20 nautical miles radius from Hunt Point, has been defined by the Port Authorities Act 1999. This allows the Authority to control the movement of piloted ships within this extended area. P Poorrtt HHeeddllaanndd PPoorrtt AAuutthhoorriittyy BBeerrtthhss No 1 Berth is a land backed berth which lies in a 347o-167o direction and has a length of 213 metres with a depth alongside of 13.4 metres LAT (lowest astronomical tide). The
erth apron is 22 metres wide and is floodlit for security and working of cargo. b The 131 metre extension to No 1 berth is under construction and work should be completed during the first quarter of 2005. Once work has been completed the extension will formally be known as No 2 berth. No 3 berth is situated to the south of No1 & 2 berth and runs in a 117o-297o direction with a length of 183 metres. The wharf has a mechanical bulk loading system owned by
ampier Salt Pty Ltd with a loading capacity of 1,900 tonnes per hour. D On this wharf is a cargo shed with an area of 1,600 m2 supported by an open hard standing area of 4,300 m2 situated immediately behind the shed. P Prriivvaattee BBeerrtthhss The BHP Billton wharf consists of two adjacent berths known as A and B berths which form a continuous line in an 117o-297o direction. The wharf has a berth pocket 65m wide is 679 metres long and is dredged to 19 metres below chart datum. The two shiploaders
re fully retractable and have an average loading capacity of 6.500 tonnes per hour each. a Finucane Island berths C and D berth are situated on the western side of the harbour. Although the berths are not connected the alignment of both berths is 017o-197o , C berth is 325 metres in length and D berth is 340 metres in length both berths have been
16

dredged to a depth of 19.2 metres. C Berth berth pocket is 61 metres wide and D Berth erth pocket is 65m wide. b
D Berth was constructed and commissioned in 2003/04 as a part of the BHP Billiton Port
nd Capacity Expansion project. a Both Finucane Island shiploaders are retractable with the C berth loader having a load rate of 4,500 tonnes per hour and the shiploader on D berth has a load rate of 10,000 tonne per hour. T Tuugg HHaavveenn The Tug Haven is leased to BHP Billiton Freight Pty Ltd and is operated by Teekay Shipping who is responsible for the day to day management and scheduling of the Tug fleet. Two new tugs have been ordered with the first, Indee, arriving in Port Hedland during May. Procurement and Fleet Planning has this new Tug replacing the ageing vessel De Grey which will be disposed of during the latter half of 2004. A design for an additional two tug pens has been prepared and dredging works for the new facility is underway. It is planned to have the new pens available prior to the start of the 2004/05 cyclone season. PPoorrtt CCoonnttrrooll TToowweerr The Port Hedland Port Authority shipping control tower is a 24 hour per day manned acility providing a vital communications link for the shipping and boating fraternity. f
The Shipping Control Tower also fills an important role in managing Port and Marine emergencies by supporting the WA Police with an initial contact point incorporating the provision of suitably trained personnel and modern state of the art communication facilities. NNaavviiggaattiioonnaall AAiiddss The Port Hedland Port Authority owns and is responsible for the maintenance of 45 channel buoys, markers and beacons that are situated within port limits. The Australian Maritime safety Authority owns and is charged with the maintenance with those channel
arkers outside port limits. m The recommended approach channel is marked by two Sarus Towers, all channel
arkers and beacons are solar powered and fully synchronised. m A section of channel beacons have been fitted with new LED style lights with synchronisation by satellite. The trial has been successful so far. S Seerrvviicceess Towage – Teekay Shipping provide towage services to the Port with a fleet of 7 Tugs,
wned by BHP Billiton, with a bollard pull range from 50 to 65 tonnes. o There is a Launch and Workboat company operating within the Port in addition to the two Lines Boat services. S Shhiipp RReeppaaiirrss aanndd GGeenneerraall SSeerrvviicceess A number of highly diversified companies experienced in minor ship repair work are readily available in Port Hedland. Their experience includes but is not limited to welding, electrical, air-conditioning, refrigeration and electronic repairs. The town of Port Hedland
17
is also able to provide additional services such as providing, light engineering and diving services. L Leeaasseehhoolldd LLaanndd The Authority has approximately 47 hectares of land in the port area, of which 35 hectares are currently leased to the following: Adsteam Offshore Newcrest Mining Limited Caltex Australial Ltd Norwest Shipping BHP Billiton Iron Ore Ltd P&O Ports Limited BHP Billiton Freight Pty Ltd Pilbara Manganese Pty Ltd BGC Contracting Pilbara Chromite Pty Ltd BP Australia Pty Ltd Port Hedland Pilots Brown’s Auto Repairs Pty Ltd Portside Fabrications Pty Ltd Cervan Marine & Maintenance Pty Ltd Seafarers Centre Cockburn Cement Limited Sealanes (1985) Pty Ltd Coogee Chemicals Pty Ltd Shell Company of Australia Ltd Dampier Salt Ltd Total Corrosion Control Pty Ltd Intertek Testing Services (Australia) Pty Ltd
Town of Port Hedland
Le Mer Marketing Consultants Pty Ltd Tribridge Holdings Pty Ltd Unimin Australia Limited
18
DDiirreeccttoorrss’’ RReeppoorrtt In accordance with Schedule 5 of the Port Authorities Act 1999, the Directors submit their report for the year ended 30 June 2004. D Diirreeccttoorrss The names and details of the Directors of the Port Hedland Port Authority during the inancial year and until the date of this report are: f
IIAANN WWIILLLLIIAAMMSS CChhaaiirrmmaann Mr Williams was appointed Chairman on the 1 September 2003 for a term expiring 30 June 2006. Ian is a widely experienced executive who has occupied a number of very senior positions within the mining and processing industries in Australian and overseas. Ian is an Adjunct Professor of the University of Queensland’s Sustainable Mineral Institute
nd was previously a Chairman of the Karratha College Council and State Training Board. a BBRREENNTT RRUUDDLLEERR DDeeppuuttyy CChhaaiirrmmaann Mr Rudler was first appointed to the Board on 1 July 2000. He was reappointed as a Director on 1 July 2001 for a two year term to expire on 30 June 2003 and has since been reappointed until 30 June 2006. Mr Rudler is a local businessman and was the Town of Port Hedland’s Mayor for most of the year. Mr Rudler has been involved in the development and support of the community since 1994, he is Deputy Chairman of the Pilbara Development Commission and is also a Board Member of the Small Business
evelopment Corporation. D BBAARRRRYY RRAALLSSTTOONN DDiirreeccttoorr Mr Ralston, who has 40 years experience in management and shipping, was first appointed to the Board on 1 July 2000 and was reappointed in 2002 for a term expiring 31 December 2004. Mr Ralston is Managing Director of FJ Sherborne (WA) Pty Ltd, customs brokers and Sherborne ACA Cargo Services Ltd, freight forwarders, and a Director of
rade Facilitators International Pty Ltd and Pakenham Pty Ltd. T MMAARRYY RRUUSSSSEELLLL DDiirreeccttoorr Mrs Russell was first appointed to the Board on 1 July 2001 for a three year term to expire on 30 June 2004. She was subsequently reappointed for a 1 year term that expired on 30 June 2004. Mrs Russell has been a Director of Golden Eagle Airlines since 1990. She holds an Arts Degree from the University of Western Australia and her experience prior to the formation of Golden Eagle Airlines was in human resource management. TTEERRRRYY BBUUCCKK DDiirreeccttoorr Mr Buck was appointed to the Board on 17 February 2003 for a one year term. Mr Buck has been reappointed for a term to expire on 31 December 2006. Mr Buck retired from the Maritime Union of Australia in 2002 where he held the positions of WA Branch Secretary, Member of the National Executive and National Deputy Presiding Officer.
19

MMIICCKK EEVVAANNSS DDiirreeccttoorr Mr Evans was appointed as a Director with effect from 27 May 2004. Mr Evans holds a Bachelor of Applied Science, Metallurgy and has extensive experience in the mining
dustry in Australia and overseas. in RROOGGEERR RRIICCHHAARRDDSSOONN DDiirreeccttoorr Mr Richardson was reappointed to the Board on the nomination of BHP Billiton in 2001. Mr Richardson is Superintendent Shipping for BHP Billiton Iron Ore Pty Ltd and a former Town Councillor. Mr Richardson is also Chairman of the Tropical Cyclone Industrial
iaison Committee. L PPHHIILL PPYYLLEE AAlltteerrnnaattee DDiirreeccttoorr Mr Pyle was appointed an Alternate Director with effect from 3 September 2003. He is Mr
van’s Alternate. E MMAARRCCEELL KKAAMMPPEERRMMAANN AAlltteerrnnaattee DDiirreeccttoorr Mr Kamperman was appointed Alternate Director to Roger Richardson with effect from November 2003. R Reettiirreemmeennttss,, AAppppooiinnttmmeennttss aanndd CCoonnttiinnuuaattiioonn iinn OOffffiiccee ooff DDiirreeccttoorrss Chairman Mr Hardie retired in August 2003 and Mr Williams was appointed to fill the acancy. v
M
r Dalla Valle retired as Director and Mr Evans was appointed Director to fill the vacancy.
Mr Price retired as Alternate Director on 30 June 2003 and Mr Pyle was appointed to fill he vacancy. t
Mr Rowe retired as Alternate Director and Mr Kamperman was appointed to fill the acancy. v
M
rs Russell was reappointed for a one year term expiring on 30 June 2004.
Mr Buck was reappointed 16 February 2004 for a term that expires on 31 December 2006. PPrriinncciippaall AAccttiivviittiieess Port Hedland Port Authority: • Provides and maintains essential port facilities including the channel and turning
basin, navigation aids, berths, shiploader, storage areas and utilities. • Provides services for the safe movement of ships within the port including
scheduling and movement control, pilotage, and under keel clearance optimisation. • Controls services provided by others in the port including stevedoring, towage, and
line boats. • Controls the activities of others in the port including the planning and construction of
dedicated private facilities. • Leases industrial land for port related activities. • Plans for the future growth and development of the port. There have been no significant changes in the nature of the principal activities during the financial year.
20

OOppeerraattiinngg RReessuullttss The operating profit after providing for income tax for the financial year was $2,237,987 DDiivviiddeennddss PPaaiidd oorr RReeccoommmmeennddeedd Dividends paid or declared for payment are as follows:
Ordinary dividend of $1,043,561 was paid in June 2004, as recommended in the 2003 report.
Final dividend of 50% of 2003/04 operating profit after tax as recommended by the Directors is $1,118,994, to be paid out of retained profits at 30 June, 2004.
An Efficiency Dividend has not been recommended for 2002/03, as the final dividend amount significantly exceeds the target set in the 2003/04 budget. RReevviieeww ooff OOppeerraattiioonnss aanndd EExxppeecctteedd RReessuullttss A review of the operations of the Port Authority during the financial year, the result of those operations and the likely developments are contained in the Chairman’s and Chief Executive Officer’s Information Statement and Overview of Port Operations. SSiiggnniiffiiccaanntt CChhaannggeess IInn TThhee SSttaattee ooff AAffffaaiirrss There have been no significant changes in the state of affairs of the Authority since the previous Directors’ Report. EEvveennttss SSuubbsseeqquueenntt TToo BBaallaannccee DDaattee The Directors are not aware of any matter or circumstances that have arisen since the end of the year that has significantly affected the operations of the Port. LLiikkeellyy DDeevveellooppmmeennttss In the opinion of the Directors, no developments have occurred since 30 June 2004 which is likely to affect the operations of the Port Authority known at the date of this Report.
21

EEnnvviirroonnmmeennttaall RReegguullaattiioonn Port Hedland Port Authority is required to conform to a range of both State and Commonwealth environmental legislation and policy. During the 2003-04 financial year, Port Hedland Port Authority implemented a number of measures to ensure best practice environmental management. EE nnvviirroonnmmeennttaall MMaannaaggeemmeenntt PPllaann RReevviieeww
A comprehensive review and update of the Authority’s Environmental Management Plan was undertaken to better define the Authority’s environmental management goals and objectives. The Plan now focuses on better environmental management outcomes and includes a number of initiatives to be adopted during the 2004-05 financial year. DDuusstt MMoonniittoorriinngg A dust monitoring program was developed in an effort to determine the levels of dust generated at the Port of Port Hedland. The program was deigned to focus primarily on dust sourced from major port activities and included the use of both a DustTrak monitor or particulate matter monitoring and dust deposition gauges for deposited dust. f
Results of monitoring to date are quite pleasing and a number of measures have been put in place to minimise dust emissions from port activities. S Seeaa DDuummpp PPeerrmmiitt The Port Authority undertook its major maintenance dredging program during 2004. As no suitable alternative was available, all dredge material was disposed at sea. This activity subsequently required a Sea Dump Permit from the Commonwealth Department of the
nvironment and Heritage. E In order to obtain a Sea Dump Permit a comprehensive Sampling and Analysis Plan (SAP) was developed and implemented in an effort to determine the quality of the sediments to be dredged. The SAP included the collection of 63 sediment samples from shipping channel, inner harbour and berth pockets. The samples were analysed for a variety of parameters including heavy metals, hydrocarbons, organic pollutants and particle size. Some small areas of the inner harbour were found to contain elevated levels of tributyltin (an anti-foulant coating used on ships to prevent marine growth). Special management measures were adopted to ensure this material could be placed at sea which involved dumping this material within a naturally deeper area of the spoil ground and capping it
ith clean material. w A Sea Dump Permit was issued to the Port Authority in June 2004. DD
rreeddggiinngg In order to ensure the dredging and disposal activities were undertaken with minimal impact on the environment, a comprehensive dredging Environmental Management Plan
as developed. w The Plan included specific management provisions for the dredging and disposal activities ranging from hydrocarbon and waste management through to marine mammal
anagement. m
22

Also included in the Plan was the commitment to undertake a comprehensive environmental monitoring program which included an effects monitoring program that involved a detailed survey of corals both before and after dredging. CC
ooppppeerr SShheedd WWoorrkkss AApppprroovvaall
A works approval was obtained from the Department of Environment for the construction of the new Newcrest copper concentrate storage shed. NN oo..11 WWhhaarrff EExxtteennssiioonn EEnnvviirroonnmmeennttaall AApppprroovvaallss
Environmental approval was obtained from the Department of Environment for the No.1 Wharf extension. EEnnvviirroonnmmeennttaall IInncciiddeennttss DDaattaabbaassee An environmental incidents recording database was developed to record all environmental incidents and complaints at the Port of Port Hedland. The database is used to identify potential problem areas so that management efforts can be focussed on these areas. A Abbrraassiivvee BBllaassttiinngg PPeerrmmiittttiinngg SSyysstteemm
A system for permitting abrasive blasting and spray painting activities was developed to ensure sound environmental management of this activity. In order to obtain a permit, applicant’s area required to consider dust control methods and clean-up initiatives. E Ennvviirroonnmmeennttaall AAwwaarreenneessss TTrraaiinniinngg
An environmental awareness training program has been developed and included within the port induction process. The Authority’s Environmental Policy commits to the education of all port personnel on the importance of environmental awareness and this training fulfils this commitment. To date, over 500 port personnel have received environmental awareness training. CCoonnssttrruuccttiioonn EEnnvviirroonnmmeennttaall MMaannaaggeemmeenntt PPllaann GGuuiiddeelliinneess To ensure better management of construction activities in Port surrounds, the Authority has implemented a requirement to submit a Construction Environmental Management Plan (CEMP) before commencing any construction works. The CEMP must identify environmental aspects associated with the activity and specific management goals for these aspects. To assist contractors in developing a CEMP, the Authority has developed CEMP Guidelines. These Guidelines spell out what the CEMP should contain and those issues that need to be considered. N Noo..11 WWhhaarrff SSppiillllaaggee CCoonnttrrooll
In an effort to better manage spillage from the No.1 Wharf shiploading and conveyor system, an audit of the system was undertaken. Subsequently spillage control efforts were focused on problem areas. A number of upgrades were implemented and to date spillage levels have been significantly reduced.
NNoo..11 WWhhaarrff NNooiissee SSuurrvveeyy
At the request of the Department of Industry and Resources, a noise survey of the No.1 shiploader was undertaken. Results indicated that in some areas of the system, noise levels have the potential to cause health impacts. A number of management initiatives
23

have since been implemented including the provision of hearing protection, installation of hearing protection signs and modifications to the port safety induction.
DDiirreeccttoorr’’ss MMeeeettiinnggss During the financial year, 12 Directors meetings and 1 special Directors meeting were held. The number of meetings in which the Directors were in attendance is shown in the table below. DDiirreeccttoorrss’’ MMeeeettiinnggss SSppeecciiaall DDiirreeccttoorrss’’
MMeeeettiinnggss No. of meetings
held while in office
Meetings attended
Number of meetings held while in office
Meetings attended
I Williams 10 10 0 0 B Rudler 12 10 1 1 Roger Richardson 12 11 1 1 B Ralston 12 10 1 1 M Russell 12 7 1 1 T Buck 12 9 1 1 P Hardie 2 2 1 1 D Dalla Valle 11 2 1 1 P Pyle 10 6 0 0 M Kamperman 7 1 0 0 M Evans 1 1 0 0
DD
iirreeccttoorrss’’ IInntteerreesstt iinn CCoonnttrraaccttss During or since the previous financial year, no Director has received or become entitled to receive a benefit (other than a benefit included in the aggregate amount of emoluments received, or due and receivable in the accounts or the fixed salary of a full time employee) by reason of a contract made by the Port Authority with the Director or with a firm of which the Director is a member or an entity in which the Director has a substantial financial interest. II nnssuurraannccee ooff OOffffiicceerrss
The Authority paid a premium of $25,700 to insure the Directors and officers against liabilities for costs and expenses incurred by them in defending any civil or criminal proceedings arising out of their conduct while acting in the capacity of director or officer of the Authority, other than conduct involving a wilful breach of duty in relation to their employment with the Authority. R Roouunnddiinngg ooff AAmmoouunnttss The authority is of a kind referred to in Class Order 98/0100, issued by the Australian Securities and Investments Commission, relating to the “rounding off” of amounts in the directors’ report. Amounts in the directors’ report have been rounded off in accordance with that Class Order to the nearest thousand dollars, or in certain cases, to the nearest dollar.
D Diirreeccttoorrss EEmmoolluummeennttss The emoluments of each Director of the Authority are as follows:
24
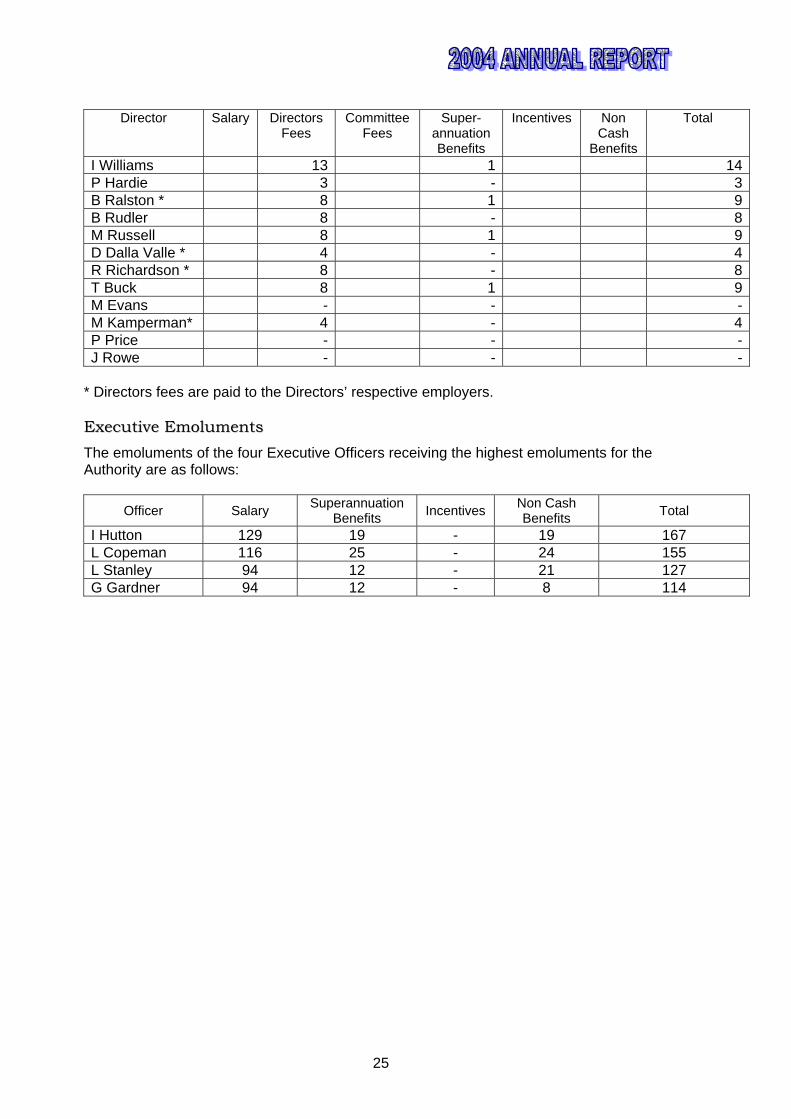
Director Salary Directors
Fees Committee
Fees Super-
annuation Benefits
Incentives Non Cash
Benefits
Total
I Williams 13 1 14P Hardie 3 - 3B Ralston * 8 1 9B Rudler 8 - 8M Russell 8 1 9D Dalla Valle * 4 - 4R Richardson * 8 - 8T Buck 8 1 9M Evans - - -M Kamperman* 4 - 4P Price - - -J Rowe - - -
* Directors fees are paid to the Directors’ respective employers. EExxeeccuuttiivvee EEmmoolluummeennttss The emoluments of the four Executive Officers receiving the highest emoluments for the Authority are as follows:
Officer Salary Superannuation Benefits Incentives Non Cash
Benefits Total
I Hutton 129 19 - 19 167 L Copeman 116 25 - 24 155 L Stanley 94 12 - 21 127 G Gardner 94 12 - 8 114
25

CCoorrppoorraattee GGoovveerrnnaannccee SSttaatteemmeenntt Port Hedland Port Authority and the board are committed to achieving and demonstrating he highest standard of corporate governance. t
The relationship between the board and senior management is critical to the Authority’s long term success. The board has adopted the following corporate governance principles to enhance the interests of the government shareholder and other key stakeholders. T Thhee BBooaarrdd ooff DDiirreeccttoorrss The responsibilities of the board include;
Providing strategic guidance to the Authority including contribution to the development of and approving the corporate strategy.
Reviewing and approving business plans, annual budgets and financial plans including available resources and major capital expenditure initiatives.
Overseeing and monitoring; − Organisational performance and the achievement of the Authority’s strategic
goals and objectives − Compliance with the Authority’s Code Of Conduct
− Progress of major capital expenditures and other significant corporate projects
including any acquisitions or divestments
Monitoring financial performance including approval of the annual and half year financial reports and liaison with the Authority’s auditors.
Appointment, performance assessment and, if necessary, removal of the Chief Executive Officer.
Ratifying the appointment and/or removal and contributing to the performance assessment for the members of the senior management team.
Ensuring there are effective management processes in place and approving major corporate initiatives.
Enhancing and protecting the reputation of the Authority. Overseeing the operation of the Authority’s system for compliance and risk
management. C Coommppoossiittiioonn ooff tthhee BBooaarrdd The Authority has seven non executive directors including the Chairman. The Board generally meet once a month and as required during the year when special meetings may be called. A Appppooiinnttmmeennttss aanndd RReettiirreemmeennttss ooff DDiirreeccttoorrss The appointment of a director is by the Minister in accordance with Section 7 (1) of the Port Authorities Act 1999. Retirement age for directors is 72, although annual extensions are available with Ministerial approval. Directors are appointed for periods of up to three years and are eligible for reappointment. The Minister may at any time remove a director from office and is not required to give any reason for doing so. The Minister appoints a director as Chairman and another as Deputy Chairman.
26

I Innddeeppeennddeenntt PPrrooffeessssiioonnaall AAddvviiccee The Authority will permit any director to seek external professional advice as considered necessary in the performance of their responsibility as a director at the Authority’s expense, with the approval of the chairman. C Coonnfflliicctt ooff IInntteerreesstt In the event that a potential conflict of interest may arise, involved directors must withdraw from all deliberations concerning the matter. They are not permitted to exercise any influence over other board members and to make improper use of information or their
osition. p Fees for directors are determined in accordance with Section 10 of the Port Authorities Act 1999. EE
tthhiiccaall SSttaannddaarrddss The board recognises that the Authority’s corporate governance, safety, occupational health, environmental and ethical standards must reflect best Australian and international practices. The Board therefore keeps these practices under review. All directors and employees are required to meet high standards of ethical business practice and must abide by a code of conduct which is part of the Port Authority policy. RReemmuunneerraattiioonn CCoommmmiitttteeee The Remuneration Committee of the board consists of all directors. The remuneration committee evaluates the performance and reviews the remuneration of the Chief Executive and employees of the Authority. A comprehensive annual review includes performance evaluation, having regard to comparative remuneration and independent advice as necessary. A Auuddiitt CCoommmmiitttteeee The Audit Committee of the board consists of all the directors and performs the following functions;
− Ensures compliance with statutory responsibilities relating to accounting policy and disclosure.
− Appoints, liaises with, assesses the quality and reviews the scope of work and reports of the external and internal auditors;
− Assesses the adequacy of accounting, financial and operating controls; − Reviews proposed reported financial information and recommends its
approval or otherwise to the board; − Monitors the identification, management and control of risk.
IInntteerrnnaall CCoonnttrroollss aanndd RRiisskk MMaannaaggeemmeenntt Procedures have been established at the Executive and Board level that are designed to afeguard the assets and interests of the Authority and to ensure the integrity of reporting. s
T
hese include accounting, financial reporting and internal control policies and procedures.
27

The Authority has in place the following arrangements to monitor;
− Approval and review by the board of the annual budget, statement of corporate intent and strategic development plan, these are to be agreed between the Minister and the Board with the concurrence of the Treasurer;
− Authorisation of major capital and contract commitments by the board; − Guidelines, limits and controls on all financial exposure; − A comprehensive annual insurance program operated with the assistance of
professional outside advisors; − Compliance with equal opportunity covering affirmative action, sexual
harassment, discrimination and the environment; − A regulatory compliance program to cover Corporations law requirements.
The Board reviews actual financial results against budget each month. The Authority prepares six monthly financial statements and performance reports which are submitted to the Minister. Risk management is discussed at monthly senior manager’s meetings where operational and business risks are assessed and appropriate action implemented. An independent review of risk exposure is generally carried out every two years with the next review due in 2005. E Exxppeennddiittuurree GGuuiiddeelliinneess The Authority has clearly defined guidelines for operating and capital expenditure. These include monthly reports against budget for the major business units as well as formally approved levels of delegated financial authority endorsed by the Board. The Authority is required to obtain the approval of the Minister for major capital works expenditure that exceeds one million dollars. The Board also reviews capital expenditure and cash flows on a monthly basis. Signed in accordance with a resolution of the Directors. DIRECTOR DIRECTOR September 2004 PORT HEDLAND, WA
28

PPPOOORRRTTT HHHEEEDDDLLLAAANNNDDD PPPOOORRRTTT AAAUUUTTTHHHOOORRRIIITTTYYY
FFFIIINNNAAANNNCCCIIIAAALLL SSSTTTAAATTTEEEMMMEEENNNTTTSSS
22000044
29
PPOORRTT HHEEDDLLAANNDD PPOORRTT AAUUTTHHOORRIITTYY FFiinnaanncciiaall RReeppoorrtt –– 3300 JJuunnee 22000044
TTAABBLLEE OOFF CCOONNTTEENNTTSS –– FFIINNAANNCCIIAALL RREEPPOORRTTSS
FINANCIAL OVERVIEW STATEMENTS OF FINANCIAL PERFORMANCE FOR THE YEAR ENDING 30, JUNE, 2004 33 STATEMENTS OF FINANCIAL POSITION AS AT 30 JUNE, 2004 34 STATEMENTS OF CASH FLOWS FOR THE YEAR ENDED 30 JUNE, 2004 35 NOTES TO AND FORMING PART OF THE ACCOUNTS NOTE 1 SUMMARY OF SIGNIFICANT ACCOUNTING POLICIES 36 NOTE 2 REVENUE FROM ORDINARY ACTIVITIES 40 NOTE 3 PROFIT/(LOSS) FROM ORDINARY ACTIVITIES BEFORE INCOME TAX 40 NOTE 4 INCOME TAX 41 NOTE 5 CURRENT ASSETS 41 NOTE 6 RECEIVABLES 42 NOTE 7 INVENTORY 42 NOTE 8 PROPERTY, PLANT AND EQUIPMENT 42 NOTE 9 DEFERRED TAX ASSETS 43 NOTE 10 CURRENT LIABILITIES – PAYABLES 44 NOTE 11 CURRENT LIABILITIES – PROVISIONS 44 NOTE 12 CURRENT TAX LIABILITIES 44 NOTE 13 PROVISIONS (NON-CURRENT LIABILITIES) 45 NOTE 14 DEFERRED TAX LIABILITIES 45 NOTE 15 CONTRIBUTED EQUITY 45 NOTE 16 RETAINED PROFITS 46 NOTE 17 RESERVES 46 NOTE 18 DIVIDENDS 46 NOTE 19 FINANCIAL INSTRUMENTS 46 NOTE 20 DIRECTOR AND EXECUTIVE DISCLOSURES 48 NOTE 21 REMUNERATION OF AUDITORS 52 NOTE 22 CONTINGENT LIABILITIES AND CONTINGENT ASSETS 52 NOTE 23 EMPLOYEE BENEFITS 52 NOTE 24 RELATED PARTIES 53 NOTE 25 EVENTS OCCURRING AFTER REPORTING DATE 53 NOTE 26 RECONCILIATION OF PROFIT FROM ORDINARY ACTIVITIES AFTER INCOME TAX 54 DIRECTORS DECLARATION 55 AUDITOR GENERAL 56 2003/04 FINANCIAL ESTIMATES OPERATING BUDGET 57 CAPITAL BUDGET 58
The Port Hedland Port Authority was established through the Port Authorities Act 1999.
Its principal place of business is The Esplanade Port Hedland. Financial reports and other information are available on our Website: www.phpa.com.au
30

FFiinnaanncciiaall OOvveerrvviieeww
ANALYSIS OF REVENUE BY SOURCE
2003/04 2002/03 VARIATION
$000 % $000 % $000 % Charges on ships 9,265 54 8,070 52 1,195 79Charges on cargo 5,044 30 4,627 30 417 28Lease rental 1,868 11 1,601 10 267 17Other revenue 842 5 1,207 8 (366) (24) Total 17,019 100 15,505 100 1,513 100 PRINCIPAL ITEMS OF REVENUE AND EXPENDITURE
2003/04 2002/03 2001/02 2000/0
1 1999/0
0 $000 % $000 % $000 % $000 % $000 %
REVENUE Pilotage and tonnage 9,222 54 8,066 52 6,660 51 6,895 49 6,144 50Wharfage and berthage 3,367 20 3,024 20 2,672 20 4,055 29 3,171 25Other 4,430 26 4,415 28 3,722 29 3,077 22 3,080 25 Total 17,019 100 15,505 100 13,054 100 14,027 100 12,395 100 CHARGES AGAINST REVENUE 2003/04 2002/03 2001/02 2000/01 1999/00 $000 % $000 % $000 % $000 % $000 % Maintenance 3,073 22 2,048 16 2,091 20 6,471 4 1,814 18Salaries 1,541 11 1,215 10 1,144 11 1,188 1 1,089 11Depreciation 1,812 13 1,832 15 1,902 18 1,596 1 1,715 17Pilot transit service and hydro survey
4,199 31 3,842 31 2,730 26 3,209 2 2,998 30
Other charges 3,086 23 3,616 28 2,571 25 138,890 92 2,589 24 Total 13,711 100 12,553 100 10,438 100 151,354 100 10,205 100 APPROPRIATION STATEMENT 2003/04 2002/03 2001/02 2000/01 1999/00 $000 $000 $000 $000 $000 Operating net profit / (loss) 3,308 2,952 2,616 (137,327) 2,190 Income tax expense (1,070) (865) (717) 84 (803)Prior period tax adjustments - - 136,263 - Transfer catastrophe reserve 2,900 - - - - Accumulated profit 19,519 18,475 17,525 18,606 17,836 Total 24,657 20,562 19,424 17,626 19,223
31

LESS APPROPRIATIONS 2003/04 2002/03 2001/02 2000/01 1999/00 $000 $000 $000 Catastrophe Salvage Reserve - - - - (200)Adjustment for Prior Periods - - - - -Accumulated Profits - - - - -Tax Effect - - - - -Increase in Prior Year Dividend - - - - (1)Proposed Dividend (1,119) (1,043) (949) (101) (416) Accumulated Profit as at 30 June 23,538 19,519 18,475 17,525 18,606
Figure 1 - PHPA REVENUE & EXPENDITURE
0
2000
4000
6000
8000
10000
12000
14000
16000
18000
03/04 02/03 01/02 00/01 99/00
REVENUE EXPENDITURE
32

SSttaatteemmeenntt ooff FFiinnaanncciiaall PPeerrffoorrmmaannccee aass aatt 3300 JJuunnee 22000044
Notes 2004 2003
$'000 $'000
Revenue from ordinary activities 2
17,027 15,505
Port Operations Expense (11,757) (10,615)Management Operations Expense (1,955) (1,913)
Carrying Value of Assets Sold (7) (25)
Profit from ordinary activities before relatedincome tax expense 3
3,308 2,952
Income tax expense 4 (1,070) (865)
Net Profit 16(b)
2,238 2,087
The above Statement of Financial Performance should be read in conjunction with the accompanying notes.
33

SSttaatteemmeenntt ooff FFiinnaanncciiaall PPoossiittiioonn aass aatt 3300 JJuunnee 22000044
Notes 2004 2003 $'000 $'000
Current assets Cash assets 5,19 10,372 10,844 Receivables 6,19 2,699 2,661 Inventories 7 133 124
Total current assets 13,204 13,629
Non-current assets Property, plant and equipment 8 34,001 31,999 Deferred tax assets 9 392 480
Total non-current assets 34,393 32,479
Total assets 47,597 46,108
Current liabilities Payables 10,19 3,363 2,617 Current tax liabilities 11 167 681 Provisions 12 1,610 1,472
Total current liabilities 5,140 4,770
Non-current liabilities Deferred tax liabilities 13 177 154 Provisions 14 429 452
Total non-current liabilities 606 606
Total liabilities 5,746 5,376
Net assets 41,851 40,732
Equity Contributed equity 15 1,665 1,665 Reserves 16(a) 16,648 16,648 Retained profits 16(b) 23,538 22,419
Total equity 17 41,851 40,732 The above Statement of Financial Position should be read in conjunction with the accompanying notes.
34

Statement of Cash Flows for the year ended 30 June 2004 Notes 2004 2003 $'000 $'000
Cash flows from operating activities Receipts from customers (inclusive of goods and services tax) 15,711 14,380 Payments to suppliers and employees (inclusive of goods and services tax)
(11,194) (10,190)
4,517 4,190Interest received 562 554Other revenue 788 648
Income taxes paid (1,472) (603)Net cash inflow (outflow) from operating activities 26 4,395 4,789
Cash flows from investing activities
Payments for property, plant and equipment (3,827) (3,424)Proceeds from sale of property, plant and equipment 4 236Net cash inflow (outflow) from investing activities (3,823) (3,188)
Cash flows from financing activities
Dividends paid 18 (1,044) (1,050)Net cash inflow (outflow) from financing activities (1,044) (1,050)
Net increase (decrease) in cash held (472) 551
Cash at the beginning of the financial year
10,844 10,293
Cash at the end of the financial year 5
10,372 10,844 The above Statement of Cash Flows should be read in conjunction with the accompanying Notes.
35

NNootteess ttoo aanndd ffoorrmmiinngg ppaarrtt ooff tthhee aaccccoouunnttss ffoorr tthhee yyeeaarr eennddeedd 3300 JJuunnee 22000044 NNoottee 11.. SSuummmmaarryy ooff SSiiggnniiffiiccaanntt AAccccoouunnttiinngg PPoolliicciieess This general purpose financial report has been prepared in accordance with Accounting Standards, other authoritative pronouncements of the Australian Accounting Standards Board, Urgent Issues Group Consensus Views and the Port Authorities Act 1999 which generally reflects the Corporations Act 2001.
It is prepared in accordance with the historical cost convention. Unless otherwise stated, the accounting policies adopted are consistent with those of the previous year.
The Australian Accounting Standards Board (AASB) is adopting International Financial Reporting Standards (IFRS) for application to reporting periods beginning on or after 1 January 2005. The AASB will issue Australian equivalents to IFRS, and the Urgent Issues Group will issue abstracts corresponding to IASB interpretations originated by the International Financial Reporting Interpretations Committee or the former Standing Interpretations Committee. The adoption of Australian equivalents to IFRS will be first reflected in the consolidated entity’s financial statements for the half-year ending 31 December 2005 and the year ending 30 June 2006. Information about how the transition to Australian equivalents to IFRS is being managed, and the key differences in accounting policies that are expected to arise, is set out in note 1(n). ((aa)) IInnccoommee TTaaxx
Tax effect accounting procedures are followed whereby the income tax expense in the statementof financial performance is matched with the accounting profit after allowing for permanentdifferences. The future tax benefit relating to tax losses is not carried forward as an asset unlessthe benefit is virtually certain of realisation. Income tax on cumulative timing differences is setaside to the deferred income tax or the future income tax benefit accounts at the rates which are expected to apply when those timing differences reverse. From July 2001 the authority is subjectto taxation under the National Tax Equilivant Regime ("NTER"). Under NTER the authority isrequired to implement full tax effect accounting and paid to the State Government the equilivanttax that would be paid to the Federal Government under Federal Tax Legislation.
((bb)) AAccqquuiissiittiioonn ooff AAsssseettss
The purchase method of accounting is used for all acquisitions of assets regardless of whether equity instruments or other assets are acquired. Cost is determined as the fair value of the assetsgiven up undertaken at the date of acquisition plus incidental costs directly attributable to theacquisition.
Where settlement of any part of cash consideration is deferred, the amounts payable in the futureare discounted to their present value as at the date of the acquisition. The discount rate used isthe incremental borrowing rate, being the rate at which a similar borrowing could be obtained from an independent financier under comparable terms and conditions.
((cc)) RReevveennuuee RReeccooggnniittiioonn
Revenue from ordinary activities is net of returns and taxes, for services to entities outside theAuthority and is recognised as revenue when the services have been provided. Miscellaneous Revenue is derived predominantly from house rentals and is recognised when accrued. InterestRevenue includes interest on short term investments and is recognised when accrued.
((dd)) RReecceeiivvaabblleess
All trade debtors are recognised at the amounts receivable as they are due for settlementgenerally within 30 days from the date of recognition, except for property rentals, which are
36

governed by individual lease agreements.
Collectibility of trade debtors is reviewed on an ongoing basis. Debts which are known to be uncollectible are written off. A provision for doubtful debts is raised when some doubt as tocollection exists and in any event when the debt is more than 90 days overdue.
((ee)) IInnvveennttoorriieess
Inventories are measured at the lower of cost and net realisable value, costs are assigned on thebasic of weighted average cost.
ff)) RReeccoovveerraabbllee aammoouunntt ooff PPrrooppeerrttyy,, PPllaanntt aanndd EEqquuiippmmeenntt
The recoverable amount of an asset is the net amount expected to be recovered through the cash inflows and outflows arising from its continued use and subsequent disposal.
Where the carrying amount of a non-current asset is greater than its recoverable amount, theasset is written down to its recoverable amount. Where net cash inflows are derived from a group of assets working together, recoverable amount is determined on the basis of the relevant groupof assets. The decrement in the carrying amount is recognised as an expense in net profit or lossin the reporting period in which the recoverable amount write-down occurs.
The expected net cash flows included in determining recoverable amounts of non-current assets are discounted to their present values using a market-determined, risk-adjusted discount rate. The discount rates used was 8%.
((gg)) IInnvveessttmmeennttss
Investments are stated at cost and interest revenue is recognised when accrued.
((hh)) PPrrooppeerrttyy,, PPllaanntt aanndd EEqquuiippmmeenntt aanndd DDeepprreecciiaattiioonn
Until 30 June 2000 the Authority's fixed assets where carried at cost or independent valuation. In complying with the requirements of Australian Accounting Standard AASB1041, the Authority haselected to revert to the cost basic of measuring all property, plant and equipment. In changingfrom a revaluation to cost policy, the carrying amounts of property, plant and equipment previously carried at revalued amounts, are the deemed cost of those assets. Depreciation iscalculated on a straight line basis to write off the net cost or revalued amount of each item ofproperty, plant and equipment (excluding land) over its expected useful life to the consolidatedentity. Estimates of remaining useful lives are made on a regular basis for all assets, with annualreassessments for major items. The expected useful lives are as follows:
Buildings and Improvements 8 - 40 years straight line Other equipment 3 - 20 years straight line Wharves 5 - 100 years straight line Navigational Aids 6 - 33 years straight line
Expenditure in respect of assets with a value greater than $300.00 are capitalised and included as assets in the Statement of Financial Position. Physical control is maintained over all assetsregardless of cost.
((ii)) PPaayyaabblleess
These amounts represent liabilities for goods and services provided to the Authority prior to theend of the financial year and which are unpaid. Payables including trade creditors and accruedexpenses are recognised when the Authority becomes obliged to make future payments as aresult of a purchase for goods or services. The amounts are unsecured and are usually paid within 30 days of recognition.
37

((jj)) DDiivviiddeennddss
A dividend based on the dividend formula agreed to between the Minister and the Treasurer, andis publicly stated in the current Statement of Corporate Intent, is to be recommended by thedirectors to the Minister for Planning and Infrastructure.
((kk)) GGooooddss aanndd SSeerrvviicceess TTaaxx
Revenue, expenses and assets are recognised net of the amount of GST, except where theamount of GST incurred is not recoverable from the Australian Taxation Office. In these circumstances the GST is recognised as part of the cost of acquisition of the asset or as part ofthe item of expense. Receivables and payables in the statement of financial position are showninclusive of GST.
((ll)) EEmmppllooyyeeee BBeenneeffiittss
The following accounting policies for employee benefits are based on the requirements of AASB1028 Employee Benefits.
((ii)) S
alaries and annual leave
Liabilities for wages and salaries, including non-monetary benefits and annual leave expected to be settled within 12 months of the reporting date are recognised inemployees benefits in respect of employees' services up to the reporting date and aremeasured at the amounts expected to be paid when the liabilities are settled.
((iiii)) LL oonngg sseerrvviiccee lleeaavvee The liability for long service leave expected to be settled within 12 months of the
reporting date is recognised in the provision for employee benefits and is measured inaccordance with (i) above. The liability for long service leave expected to be settledmore than 12 months from the reporting date is recognised in the provision for employeebenefits and measured as the present value of expected future payments to be made inrespect of services provided by employees up to the reporting date. Consideration is given to expected future wage and salary levels, experience of employee departures andperiods of service. Expected future payments are discounted using market yields at thereporting date on national government bonds with terms to maturity and currency that
atch, as closely as possible, the estimated future cash outflows. m
((iiiiii)) SS iicckk LLeeaavvee Experience indicates that no liability for sick leave exists as on average, sick leave taken
in each financial year is less than entitlements accruing in that period and this experience is expected to recur in future periods. Liabilities for non-accumulating sick leave are recognised when the leave is taken and measured at the rates paid or payable.
((iivv)) SSuuppeerraannnnuuaattiioonn
The Authority contributes to an accumulation superannuation scheme for most of its staff and also to the Gold State Superannuation Scheme. The accumulation scheme is fullyfunded and operates through a Perpetual Trustees master trust with representatives fromthe Authority's Directors and staff on the investment committee. The Gold StateSuperannuation Scheme, is a defined benefit lump sum scheme, and theSuperannuation and Family Benefits Act Scheme, a defined benefit pension scheme arenow closed to new members. The Authority is responsible for superannuation benefits for past year's service of members of the Superannuation and Family Benefit ActScheme who elected to transfer to the Gold State Superannuation Scheme. TheAuthority also accrues for superannuation benefits to the pension scheme for those members who elected not to transfer from that scheme. They liability for superannuationcharges under the Gold State Super Scheme and West State Super Scheme areextinguished by payment of the employer contributions to the Government Employees
38

Superannuation Board. The note disclosure required by paragraph 14(e) of AASB1028 (beingthe employer's share of the difference between employee's accrued superannuation benefits andthe attributable net market value of plan assets) has not been provided. State scheme deficiencies are recognised by the state on its whole of government reporting. The GovernmentEmployees Superannuation Board's records are not structured to provide the information for theAuthority. Accordingly, deriving the information for the Authority is impractical under currentarrangements, and thus any benefits thereof would be exceeded by the cost of obtaining theinformation.
((mm)) RRoouunnddiinngg ooff AAmmoouunnttss
The Authority is of a kind referred to in Class Order 98/0100, issued by the Australian Securities and Investments Commission, relating to the 'rounding off' of amounts in the financial report.Amounts in the financial report have been rounded off in accordance with that Class Order to thenearest thousand dollars.
((nn)) IInntteerrnnaattiioonnaall FFiinnaanncciiaall RReeppoorrttiinngg SSttaannddaarrddss ((IIFFRRSS))
The Australian Accounting Standards Board (AASB) is adopting IFRS for application to reportingperiods beginning on or after 1 January 2005. The AASB will issue Australian equivalents toIFRS, and the Urgent Issues Group will issue abstracts corresponding to IASB interpretationsoriginated by the International Financial Reporting Interpretations Committee or the formerStanding Interpretations Committee. The adoption of Australian equilivants to IFRS will be first reflected in the Authority's financial statements for the half-year ending 31 December 2005 and the year ending 30 June 2006.
Entities complying with Australian equivalents to IFRS for the first time will be required to restatetheir comparative financial statements to amounts reflecting the application of IFRS to thatcomparative period. Most adjustments required on transition to IFRS will be made,retrospectively, against opening retained earnings as at 1 July 2004.
The Authority has established a project team to manage the transition to Australian equivalents toIFRS, including training of staff and system and internal control changes necessary to gather allthe required financial information. The project team is chaired by the Manager Finance & Administration and reports to the Board. The project team has prepared a detailed timetable formanaging the transition and is currently on schedule. To date the project team has analysedmost of the Australian equivalents to IFRS and has identified a number of accounting policy changes that will be required. In some cases choices of accounting policies are available,including elective exemptions under AASB 1 First-time Adoption of Australian International Financial Reporting Pronouncements. Some of these choices are still being analysed to determine the most appropriate accounting policy for the consolidated entity.
Major changes identified to date that will be required to the Authority’s existing accountingpolicies include the following:
IInnccoommee ttaaxx
Under the Australian equivalent to IAS 12 Income Taxes, deferred tax balances are determinedusing the balance sheet method which calculates temporary differences based on the carryingamounts of an entity's assets and liabilities in the statement of financial position and their associated tax bases. In addition, current and deferred taxes attributable to amounts recogniseddirectly in equity are also recognised directly in equity.
This will result in a change to the current accounting policy, under which deferred tax balances are determined using the income statement method, items are only tax-effected if they are included in the determination of pre-tax accounting profit or loss and/or taxable income or lossand current and deferred taxes cannot be recognised directly in equity.
39

NNOOTTEE 22 -- RReevveennuuee ffrroomm OOrrddiinnaarryy AAccttiivviittiieess RReevveennuuee ffrroomm oorrddiinnaarryy aaccttiivviittiieess ccoonnssiissttss ooff tthhee ffoolllloowwiinngg iitteemmss:: 2004 2003 $'000 $'000
Revenue from operating activities Charges on Cargo 5,044 4,627Charges on Ships 9,251 8,070Utilities and Lease Rentals 1,957 1,975
16,252 14,672
Revenue from outside the operating activities Interest 562 544Other Income 184 164Sale Proceeds 29 125 775 833
Revenue from ordinary activities 17,027 15,505
Other Income is predominately made up of revenue earned from house rentals.
NNOOTTEE 33 -- PPrrooffiitt // ((LLoossss)) ffrroomm OOrrddiinnaarryy AAccttiivviittiieess bbeeffoorree IInnccoommee TTaaxx
(a) Net gains and expenses Profit from ordinary activities before income tax expense includes the following specific net gains and expenses: Net Gains Net (loss)/gain on disposal
Property, plant and equipment. (10) 100
Interest 562 544
Expenses
Depreciation Buildings and Port Improvements 217 173 Other Equipment 704 607 Navigational Aids 360 354 Wharves and Utilities 530 698
Total Depreciation 1,811 1,832
Other Provisions Employee Entitlements 39 177
(a) Net gains and expenses Profit from ordinary activities before income tax expense includes the following specific net gains and expenses:
40

NNOOTTEE 44 –– IInnccoommee TTaaxx 2004 2003
$'000 $'000
Income Tax Expense
The income tax expense for the financial year differs from the amount calculated on the profit. The differences are reconciled as follows:
Profit from ordinary activities before income tax expense 3,308 2,952
Income tax calculated @ 30% (2003 - 30%) 992 886 Total income tax 992 886
Tax effect of permanent differences Capital profit on sale of freehold land - (36) Sundry items 7 3
Income tax adjusted for permanent differences 999 853 Under (over) provision in prior year 71 12 Tax effect of permanent differences: Income tax expense attributable to profit from ordinary activities 1,070 865
Aggregate income tax expense comprises: Current taxation provision 955 929 Deferred income tax provision 21 (18) Future income tax benefit 23 (58) Under (over) provision in prior year 71 12
1,070 865 NNOOTTEE 55 –– CCuurrrreenntt AAsssseettss
Cash Assets Cash on hand 1 1 Cash at bank 2,252 1,024 Cash on deposit 8,119 9,819
10,372 10,844 Significant terms and conditions
Interest on cash at bank and commercial bills varied approximately between 4.63% and 5.47%(2003 4.2% and 4.95%) during the year. Commercial bills are normally invested for periods ofbetween 30 and 90 days.
The above figures are reconciled to cash at the end of the financial year as shown in the statement of cash flows as follows:
Balances as above 10,372 10,844
Balances as per statement of cash flows 10,372 10,844
41

NNOOTTEE 66 -- RReecceeiivvaabblleess 2003/04 2002/03
$000 $000 Trade debtors 2,207 2,624 Prepayments 16 11 Interest receivable 26 26 Other 450 - 2,699 2,661
NNOOTTEE 77 –– IInnvveennttoorryy Spares 133 124
NNOOTTEE 88 –– PPrrooppeerrttyy,, PPllaanntt aanndd EEqquuiippmmeenntt Land & buildings
Freehold land At cost 455 455
Buildings At cost 6,747 6,448 Less: Accumulated depreciation (2,966) (2,747) 3,781 3,701
Capital dredging (work in progress) At cost * 1,964 1,863 1,964 1,863
Total land and buildings 6,200 6,019
Plant and Equipment
Navigational aids At cost 7,412 7,263 Less: Accumulated depreciation (2,974) (2,614) 4,438 4,649 Wharves and utilities At cost 20,994 18,004 Less: Accumulated depreciation (5,043) (4,508) 15,951 13,496 Other equipment At cost 9,799 11,627 Less: Accumulated depreciation (2,387) (3,792) 7,412 7,835
Total property plant and equipment 34,001 31,999 Dredging of the No.1 berth pocket is an integral part of the No.1 wharf extension project. Depreciation charges will commence during 2004/05, continuing over the expected life of the asset.
Valuations of land and buildings An independent valuation of freehold land was undertaken by Valuation Services in June
42

2003.The valuation method was based on the market valuation method.
$'000
Freehold land At independent valuation - 2003 1,066
Freehold buildings At independent valuation - 2003 1,174
Crown reserves Crown reserves independent valuation - 2003 1,325Buildings on crown reserves at independent valuation - 2003 1,637
An independent valuation of crown reserves was undertaken by Fudali Waterhouse Pty Ltd. The valuation methodology was based on the current use of assets. These balances have not been recognised in the financial statements.
Reconciliations
Reconciliations of the carrying amounts of each class of property, plant and equipment at the beginning and end of the current and previous financial year are set out below:
Freehold
land
Buildings and Port
ImprovementsCapital
DredgingNavigation
Aids
Wharves and
Utilities Other
Equipment Total $'000 $'000 $'000 $'000 $'000 $'000 $'000
Carrying amount at 1 July2003 455 3,701 1,863 4,650 13,496 7,834 31,999Additions - 297 101 148 2,985 297 3,828Disposals - - - - - (15) (15)Depreciation/amortisation expense (note 3(a)) - (217) - (360)
(530) (704) (1,811)
Carrying amount at 30June 2004 455 3,781 1,964 4,438 15,951 7,412 34,001
NNOOTTEE 99 –– DDeeffeerrrreedd TTaaxx AAsssseettss
2004 2003
$'000 $'000
Future income tax benefits - timing differences
392 480
43

NNOOTTEE 1100 -- CCuurrrreenntt LLiiaabbiilliittiieess –– PPaayyaabblleess 2003/04 2002/03 $000 $000 Trade creditors 2,382 1,110 Rental Received in Advance 268 272 Other Creditors 527 537 Accrued Expenses 186 698
3,363 2,617 Significant terms and conditions
Trade creditors payable are settled within 30 days.
Net Fair Values
The Authority considers the carrying amount of trade creditors approximate their net fair value.
NNOOTTEE 1111 –– CCuurrrreenntt LLiiaabbiilliittiieess –– PPrroovviissiioonnss Provision for taxation 167 681 NNOOTTEE 1122 –– CCuurrrreenntt TTaaxx LLiiaabbiilliittiieess Provision - dividends payable 1,119 1,043Provision - annual leave 260 184 Provision - long service leave 201 216 Provision - other employee entitlements 30 29
1,610 1,472
Movements in provisions Movements in each class of provision during the financial year, other than employee benefits, are set out below.
Provisions – dividends
payable parent shareholders
Provisions - annual leave Total
$'000 $'000 $'000
Carrying amount at start of year 1,043 184 1,227 Additional provisions recognised 1,119 188 1,307
Payments/other sacrifices of economic benefits (1,043) (112) (1,155)Carrying amount at end of year 1,119 260 1,379
44

Provisions - long service
leave
Provisions - other
employee entitlements Total
$'000 $'000 $'000
Carrying amount at start of year 216 29 245Provisions acquired 13 30 43Payments/other sacrifices of economic benefits (28) (29) (57)Carrying amount at end of year 201 30 231 NNOOTTEE 1133 -- PPrroovviissiioonnss ((NNoonn CCuurrrreenntt LLiiaabbiilliittiieess)) 2004 2003 $'000 $'000
Provision for deferred income tax 177 154 NNOOTTEE 1144 -- DDeeffeerrrreedd TTaaxx LLiiaabbiilliittiieess Provisions - long service leave 11 28Provisions - other employee entitlements 418 424
429 452
Provisions - long
service leave
Provisions - other
employee entitlements Total
$'000 $'000 $'000
Carrying amount at 1 July 2003 28 424 452
Reductions from remeasurement or settlement without cost (17) (6) (23)Carrying amount at 30 June 2004 11 418 429 NNOOTTEE 1155 –– CCoonnttrriibbuutteedd EEqquuiittyy
Equity contributed by WA State Government 1,665 1,665
45

NNOOTTEE 1166 -- RReettaaiinneedd PPrrooffiittss 2004 2003 $'000 $'000
(a) Reserves Asset revaluation reserve 16,512 16,512 Capital profits reserve 5 5 Catastrophe salvage reserve 0 0Asset realisation reserve 131 131
16,648 16,648 (b) Retained profits
Retained profits at the beginning of the financial year 22,419 18,475 Adjustment resulting from change in accounting policy for providingfor Catastrophe Salvage Reserve - 2,900
Net Profit/(Loss) Port Hedland Port Authority 2,238 2,087
Dividends provided for or paid 18 (1,119) (1,043)
Retained profits at the end of the financial year 23,538 22,419 NNOOTTEE 1177 -- RReesseerrvveess
Total equity at the beginning of the financial year 40,732 39,688 Total changes in equity recognised in the statement of financialperformance 2,238 2,087 Transactions with owners as owners:
Dividends provided for or paid 18 (1,119) (1,043)Total equity at the end of the financial year 41,851 40,732 NNOOTTEE 1188 –– DDiivviiddeennddss
Total dividends provided for the years ended 30 June 2004 and 2003 1,119 1,043
Dividends paid in cash during the years ended 30 June 2004 and 2003. 1,044 1,050 NNOOTTEE 1199 –– FFiinnaanncciiaall IInnssttrruummeennttss (a) Credit risk exposures
The credit risk on financial assets of the Authority which have been recognised on the statement of financial position, other than investments in shares, is generally the carrying amount, net of any provisions for doubtful debts.
(b) Interest rate risk exposures
The Authority's exposure to interest rate risk and the effective weighted average interest rate by maturity periods is set out in the following table. For interest rates applicable to each class of asset or liability refer to individual notes to the financial statements.
46
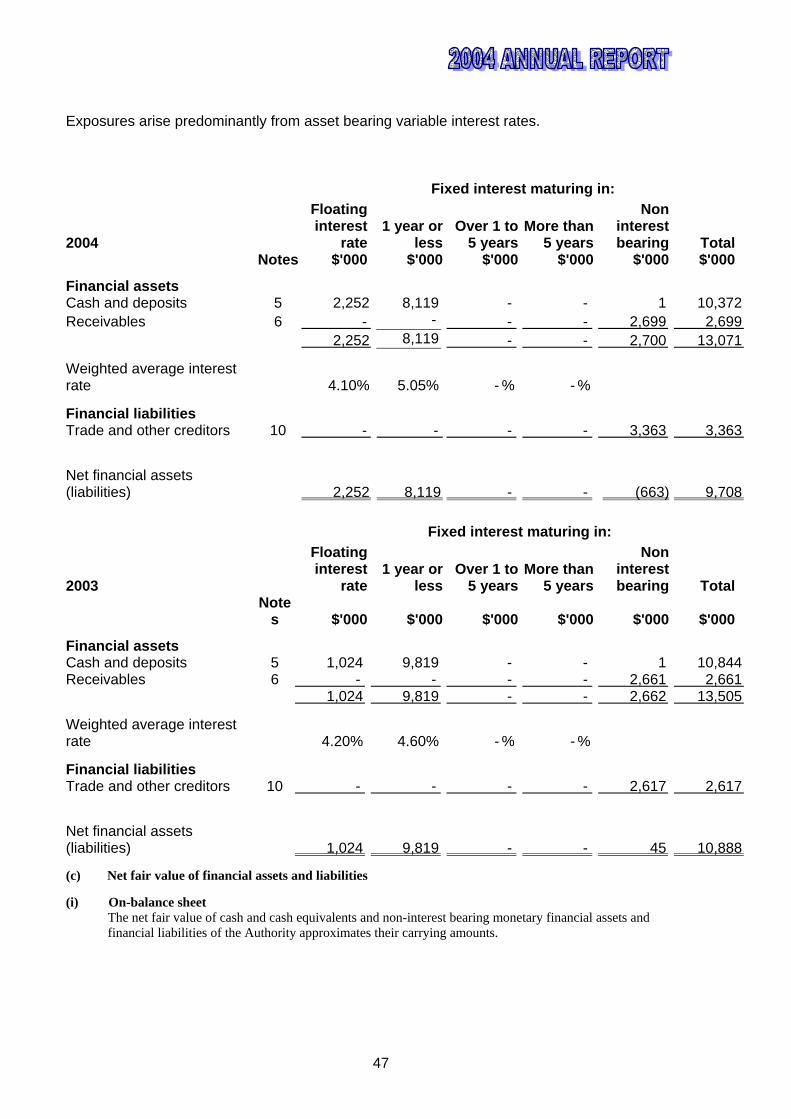
Exposures arise predominantly from asset bearing variable interest rates.
Fixed interest maturing in:
2004
Floating interest
rate1 year or
lessOver 1 to
5 yearsMore than
5 years
Non interest bearing Total
Notes $'000 $'000 $'000 $'000 $'000 $'000
Financial assets Cash and deposits 5 2,252 8,119 - - 1 10,372 Receivables 6 - - - - 2,699 2,699 2,252 8,119 - - 2,700 13,071
Weighted average interest rate 4.10% 5.05% - % - %
Financial liabilities Trade and other creditors 10 - - - - 3,363 3,363
Net financial assets (liabilities) 2,252 8,119 - - (663) 9,708
Fixed interest maturing in:
2003
Floating interest
rate1 year or
lessOver 1 to
5 yearsMore than
5 years
Non interest bearing Total
Note
s $'000 $'000 $'000 $'000 $'000 $'000
Financial assets Cash and deposits 5 1,024 9,819 - - 1 10,844 Receivables 6 - - - - 2,661 2,661 1,024 9,819 - - 2,662 13,505
Weighted average interest rate 4.20% 4.60% - % - %
Financial liabilities Trade and other creditors 10 - - - - 2,617 2,617
Net financial assets (liabilities) 1,024 9,819 - - 45 10,888
(c) Net fair value of financial assets and liabilities
(i) On-balance sheet The net fair value of cash and cash equivalents and non-interest bearing monetary financial assets and financial liabilities of the Authority approximates their carrying amounts.
47

The carrying amounts and net fair values of financial assets and liabilities at balance date are:
2004 2003 Carrying Net fair Carrying Net fair amount value amount value $'000 $'000 $'000 $'000
On-balance financial instruments Financial assets Cash 2,253 2,253 1,025 1,025 Deposits 8,119 8,119 9,819 9,819 Trade debtors 2,699 2,699 2,661 2,661 Non-traded financial assets 13,071 13,071 13,505 13,505
Financial liabilities Trade creditors 3,363 3,363 2,617 2,617 NNOOTTEE 2200 –– DDiirreeccttoorr aanndd EExxeeccuuttiivvee DDiisscclloossuurreess
D
irectors The following persons were Directors of Port Hedland Port Authority during the financial year: Chairman - non executive I Williams P Hardie Non-executive Directors B Rudler B Ralston M Russell T Buck R Richardson M Evans D Dalla Valle Alternate Directors P Price M Kamperman P Pyle J Rowe
Mr Hardie retired from the position of Chairman of the Board in August 2003, Mr Williams was appointed Chairman of the Board in September 2003. Other Board appointments were Mr Evans, 27 May 2004, Mr Pyle, 3 September 2003 and Mr Kamperman, November 2003. Board resignations included Mr Dalla Valle, resigned September 2003, Mr Price, resigned, 30 June 2003. Mr Rowe, resigned, November 2003.
48

Executives (other than Directors) with the greatest authority for strategic direction and management The following persons were the four executives with the greatest authority for the strategic direction and management of the Authority (“specified executives”) during the financial year: Name Position Employer I Hutton Chief Executive Officer Port Hedland Port Authority L Copeman Harbour Master Port Hedland Port Authority G Gardner Manager Finance and Administration Port Hedland Port Authority L Stanley Manager Technical Services Port Hedland Port Authority
All of the above persons were also specified executives during the year ended 30 June 2003. RReemmuunneerraattiioonn rreeppoorrtt P
rinciples used to determine the nature and amount of remuneration
The objective of the Authority’s executive reward framework is to ensure reward for performance is competitive and appropriate for the results delivered. The framework aligns executive reward with achievement of strategic objectives and the creation of value for the Government, and conforms to market best practice for delivery of reward. The Board ensures that executive reward satisfies the following key criteria for good reward governance practices:
• Competitiveness and reasonableness • performance linkage / alignment of executive compensation • transparency
In consultation with external remuneration consultants, the Authority has structured an executive remuneration framework that is market competitive and complimentary to the reward strategy of the organisation. AAlliiggnnmmeenntt ttoo oowwnneerrss'' iinntteerreessttss:: Focuses on sustained growth in the facilitation of trade through the Port and delivering constant
• return on assets as well as focusing the executive on key non-financial drivers of value
• attracts and retains high calibre executives.
Alignment to program participants’ interests: • rewards capability and experience • provides a clear structure for earning rewards • provides recognition for contribution
N Noonn--eexxeeccuuttiivvee DDiirreeccttoorrss Fees and payments to the non-executive chairman and directors are set by the W A Government and determined in accordance with Section 10 of the Port Authorities Act 1999. Non-executive directors’ fees and payments are reviewed annually by the Minister for Planning and Infrastructure. The Chairman and Directors of the Authority are not present at any discussions relating to determination of their remuneration.
49

D Diirreeccttoorrss’’ ffeeeess The current base remuneration was last reviewed with effect from 1 January 2003. EExxeeccuuttiivvee ppaayy The executive pay and reward framework has two components:
• base pay and benefits • other remuneration such as superannuation.
The combination of these comprises the executive’s total remuneration. BBaassee ppaayy Structured as a total employment cost package which may be delivered as a mix of cash and prescribed non-financial benefits at the executives’ discretion. R Reettiirreemmeenntt bbeenneeffiittss Retirement benefits are delivered under an accumulation superannuation scheme for all executives managed by Perpetual Trustees except for the Chief Executive Officer where these benefits are delivered through the Government Employees’ Superannuation Board. This fund provides defined lump sum benefits based on years of service and final average salary. DDeettaaiillss ooff rreemmuunneerraattiioonn Details of the nature and amount of each element of the emoluments of each Director of the Port Hedland Port Authority and each of the 4 officers of the Authority receiving the highest emoluments for the year ended 30 June 2004 are set out in the following tables DDiirreeccttoorrss ooff PPoorrtt HHeeddllaanndd PPoorrtt AAuutthhoorriittyy
2004 Primary Post-employment
Name Cash salary and fees
Non-monetary benefits
Super-annuation Total
$ “000” $ “000” $ “000” $ “000”
I Williams Chairman 13 - 1 14
B Rudler Deputy Chairman 8 - 1 9
P Hardie Chairman 3 - - 3
T Buck Director 8 - 1 9
B Ralston * Director 8 - - 8
M Russell Director 8 - 1 9
R Richardson * Director 8 - - 8
D Dalla Valle * Director 4 - - 4
M Kamperman * Director 4 - - 4
P Price Director - - - -
50

M Evans Director - - - -
J Rowe Director - - - -
P Pyle Director - - - -
Total Director & Executive Remuneration 64 - 4 68
* Directors fees are paid to the Directors' respective employers.
Total remuneration of Directors of Port Hedland Port Authority for the year ended 30 June 2003 is set out below. Information for individual Directors is not shown as this is the first financial report prepared since the issue of AASB 1046 Director and Executive Disclosures by Disclosing Entities
2003 Primary Post-employment Equity
Name Cash salary and fees
Cash bonus Non-monetary benefits
Super-annuation Retirement benefits
Options Total
$ “000” $ “000” $ “000” $ “000” $ “000” $ “000” $ “000”
Total 60 - - 5 - - 65 SSppeecciiffiieedd eexxeeccuuttiivveess ooff tthhee AAuutthhoorriittyy
2004 Primary Post-employment
Name Cash salary and fees
Non-monetary benefits
Super-annuation Total
$ “000” $ “000” $ “000” $ “000”
I Hutton 129 19 19 167 L Copeman 116 24 15 155 G Gardner 94 8 12 114 L Stanley 94 21 12 127
Total description 433 72 58 563
Total remuneration of specified executives for the year ended 30 June 2003 is set out below. Information for individual specified executives is not shown as this is the first financial report prepared since the issue of AASB 1046 Director and Executive Disclosures by Disclosing Entities. 54(b),56,57 In some cases, different individuals are included than those specified in the year ended 30 June 2004.
2003 Primary Post-employment Equity
Name Cash salary and fees
Cash bonus Non-monetary benefits
Super-annuation Retirement benefits
Options Total
$ “000” $ “000” $ “000” $ “000” $ “000” $ “000” $ “000”
Total 426 - 63 42 - - 531
51

NNOOTTEE 2211 –– RReemmuunneerraattiioonn ooff AAuuddiittoorrss The total fees, salaries and benefits paid or due and receivable for the year to Directors of he Authority are disclosed as follows: t
During the year the following services were paid to the auditor of the Authority. 2004 2003 $'000 $'000
Assurance services 1. Audit services
Fees paid to the Auditor General: Audit and review of financial reports and other audit work under the Port Authorities Act 1999. 26 24
Total remuneration for audit services 26 24 NOTE 22 – Contingent Liabilities and Contingent Assets
CCoonnttiinnggeenntt lliiaabbiilliittiieess T
he Authority had contingent liabilities at 30 June 2004 in respect of:
CCaappiittaall CCoommmmiittmmeennttss Contracts were entered into by the Authority during the 2003/04 financial year for capital works projects that commenced during that year, where a significant amount of the project work and consideration isexpected to be completed during the following financial period. The projects include the No.1 WharfExtension $9,500,000 Channel Dredging $3,500,000 Housing $350,000 and Copper Shed Construction$600,000 NNOOTTEE 2233 –– EEmmppllooyyeeee BBeenneeffiittss
EEmmppllooyyeeee bbeenneeffiitt aanndd rreellaatteedd oonn--ccoossttss lliiaabbiilliittiieess Provision for employee entitlements - current (note 12) 491 429 Provision for employee entitlements - non-current (note 14) 429 452
Aggregate employee benefit and related on-costs liabilities 920 881
Number
EEmmppllooyyeeee nnuummbbeerrss
Average number of employees during the financial year 20 18 As explained in notes 1(l)(ii) and (iv), the amounts for long service leave and termination benefits that are expected to be settled more than 12 months from the reporting date and superannuation are measured at their present values. The following assumptions were adopted in measuring present values:
Long Service Leave Weighted average rates of increase in annual employee entitlementsto settlement of the liabilities 5% 7%Weighted average discount rates 7% 9%
Weighted average terms to settlement of the liabilities 7 years 7.5 years
52

NNOOTTEE 2244 –– RReellaatteedd PPaarrttiieess The names of persons who were Directors of Port Hedland Port Authority at any time during the financial year are as follows: I Williams P Hardie B Rudler B Ralston M Russell T Buck R Richardson M Evans D Dalla Valle Alternate Directors J Row P Pyle M Kampermam P
Price
Of these persons Mr Hardie, Mr Rudler, Mr Ralson, Mrs Russell, Mr Buck, Mr Richardson, Mr Dalla Valle, Mr Price, Mr Rowe, Mr Evans and Mr Kamperman were also directors during the year ended 30 June 2003. Mr Dalla Valle held office as a director until his resignation on the 2nd September 2003. Two Directors, Mr Richardson and Mr Evans along with their alternate directors Mr Price and Mr Kamperman are employees of BHP Billiton Iron Ore Pty Ltd. BHP Billiton uses the port facilities for the export of iron ore commodities and the terms of trade offered to this customer are equivalent to those offered to all other port users. Transactions with
HP Billiton Iron Ore Pty Ltd totalled $8,414,000 for the year. B Mr Rudler is owner of North West Liquor Supplies and was also the owner of Pilbara Party Hire for part of the year. Transactions with Mr Rudler’s businesses totalled $3,000 for the year. R Reemmuunneerraattiioonn BBeenneeffiittss Information on remuneration of Directors is disclosed in note 20. NNOOTTEE 2255 –– EEvveennttss OOccccuurrrriinngg aafftteerr RReeppoorrttiinngg DDaattee There were no events subsequent to the reporting date that would significantly effect the information presented in the Financial Statements of the Authority for the year ending 30 June 2004.
53

NNOOTTEE 2266 –– RReeccoonncciilliiaattiioonn ooff PPrrooffiitt ffrroomm OOrrddiinnaarryy AAccttiivviittiieess aafftteerr IInnccoommee TTaaxx ttoo NNeett CCaasshh IInnffllooww ffrroomm OOppeerraattiinngg AAccttiivviittiieess 2004 2003 $'000 $'000
Profit from ordinary activities after income tax 2,238 2,952 Depreciation and amortisation 1,811 1,832Net gain on sale of non-current assets 10 (100)
Change in operating assets and liabilities Decrease (increase) in trade debtors and bills of exchange 416 (344)Decrease (increase) in inventories (458) (50)Decrease(increase) in prepayments - 67Decrease(increase) rental received in advance (5) (15)Decrease (increase) in future income tax benefit 88 (69)Increase (decrease) in trade creditors 1,318 965Increase (decrease) in other operating liabilities (573) - Increase (decrease) in provision for income taxes payable (512) (357)Increase (decrease) in provision for deferred income tax 23 (27)Increase (decrease in other provisions) 39 (65)
Net cash inflow from operating activities 4,395 4,789
54

DDiirreeccttoorr’’ss DDeeccllaarraattiioonn In the opinion of the Directors of the Port Hedland Port Authority:
(a) The Statement of Financial Performance gives a true and fair view of the Port Authority’s profit for the financial year 1 July 2003 to 30 June 2004;
(b) The Statement of Financial Position gives a true and fair view of the Port
Authority’s state of affairs as at 30 June 2004;
(c) At the date of this declaration there are reasonable grounds to believe that the Port Hedland Port Authority will be able to pay it’s debts as and when they fall due.
The financial statements as set out on the previous pages have been prepared in accordance with applicable Accounting Standards, other mandatory professional reporting requirements and the financial reporting provisions of the Port Authorities Act 1999.
This declaration is made in accordance with a resolution of the Directors.
I Williams Chairman B Rudler Director
Declaration Location Date:
55

56

22000044//0055 FFiinnaanncciiaall EEssttiimmaatteess OOppeerraattiinngg BBuuddggeett ((NNoott ssuubbjjeecctt ttoo AAuuddiitt)) In accordance with the Port Authorities Act 1999, the Authority is required to prepare and submit a Statement of Corporate Intent including annual estimates to the responsible Minister. The Port Hedland Port Authority's 2004/2005 budget was prepared in and after endorsement by the Authority's Board it was subsequently submitted to the Minister for Planning and Infrastructure for approval. In framing the budget every effort is made to achieve the Port Authority's financial obligations, maintain a balance between Government requirements, the Port Authority's financial well being
nd the satisfaction of its customers. a The summary of the Operating Budget, which appears below, is predicated on customers forecast throughputs and estimated expenditure to service that activity and to maintain the fabric of the Authority's assets. The 2003/2004 Operating Budget achieves these aims and provides an estimated ROR of 6.5%, based on the deprival method of valuing assets, which is a change from the previous period where the written down current cost value of assets was used. The rate for the budget year is equal to the long term target ROR of 6.5% nominated by the Minister. OOppeerraattiinngg BBuuddggeett 22000044//0055
2003/04 Actual
2004/05Estimate
$000 $000Revenue Account Pilotage Dues 4,417 5,126Tonnage Dues 4,805 5,715Harbour Maintenance Levy 235 244Wharfage 2,972 3,051Lease Rentals 1,868 1,920Berthage 395 406Other 2,327 2,212 17,019 18,674Total Earnings Expenses Salaries and Employee Related Costs 2,002 2,345Pilotage Contract 2,747 3,303Maintenance 3,073 3,390Helicopter, Hydrographic Survey and Pilot Boat 1,452 1,709Depreciation 1,812 3,226Employee Entitlements 90 169Other 2,535 3,311 13,711 17,453Total Expenses Surplus / (Deficit) 3,308 1,221
57

Capital Budget ((NNoott ssuubbjjeecctt ttoo AAuuddiitt)) The Authority's budget for new capital works for 2004/05 is $15,009,000. Internal funding and
nticipated borrowings of $4,500,000 will be required to fund these projects. a The table below summarises the Authority's proposed capital works for 2004/05.
CCaappiittaall WWoorrkkss PPrrooggrraammmmee 22000044//0055 2004/05
$000Carry Over Capital Works 2003/04 Wharf Extension 6,525Other 2,514 New Capital Works 2004/05 Motor Vehicle Replacements 109Housing Upgrades and Replacements 54Safety Equipment 40DUKC/PVTS/SUKC Upgrades 70Radar Replacement 350Periodical Dredging 4,000Shiploader - minor projects 75Wash Down Bay 45Deep Sewerage 500Tug Pens and Cyclone Moorings 140Contingency 587Shiploading Facilities Total for 2004/2005 15,009
58

PPPOOORRRTTT HHHEEEDDDLLLAAANNNDDD PPPOOORRRTTT AAAUUUTTTHHHOOORRRIIITTTYYY
SSSTTTAAATTTIIISSSTTTIIICCCAAALLL IIINNNFFFOOORRRMMMAAATTTIIIOOONNN
222000000444
59

PP eerrffoorrmmaannccee IInnddiiccaattoorrss
OOppeerraattiioonnaall The outcome is to provide expert marine pilotage to allow uninterrupted movement in and out of the port for shipping, including ultra large bulk carriers 03/04 02/03 01/02 00/01 99/00 EEffffeeccttiivveenneessss No of Piloted Movements 1,525 1,353 1,231 1,377 1,200 Port Closure (Hours) 28.0 6.5 32.0 19.0 114.9 EE ffffiicciieennccyy Number of Accidents to Vessels and Port 0 1 3 2 0 Ratio of Accidents / Total Vessel Movements (a) .000 .001 .000 .003 .000 CCoommmmeenntt Accident is defined as: “Any event involving the movement of a ship, which results in damage”. P Poorrtt SSeerrvviicceess The objective is to provide wharves, storage facilities and services to meet customers' needs in a cost effective manner. Effectiveness
03/04 02/03 01/02 00/01 99/00 Berth Occupancy (per cent): (b)
Nelson Point Berth 86% 85% 77% 86% 85% Finucane Island Berth 65% 65% 61% 66% 65% PHPA No 1 Berth 35% 28% 33% 37% 28% PHPA No 3 Berth 34% 29% 27% 39% 33% Nelson Point Berth 35hrs 35hrs 34hrs 38hrs 42hrs Finucane Island Berth 49hrs 48hrs 52hrs 59hrs 68hrs PHPA No 1 Berth 35hrs 40hrs 43hrs 39hrs 36hrs PHPA No 3 Berth 30hrs 30hrs 32hrs 27hrs 28hrs Efficiency Average Cargo Tonnes Lifted per Vessel:
03/04 02/03 01/02 00/01 99/00
Iron Ore Vessels Nelson Point 158,572 155,841 154,555 152,586 150,250 Finucane Island 121,356 87,284 123,204 124,270 103,161
Salt Vessels 35,515 42,196 34,040 27,876 31,053 Fuel Tankers (inc Bitumen) 16,492 19,497 23,093 18,208 12,057 General Cargo 1,059 957 1,155 761 792 Bulk Cargo Vessels 28,267 31,401 27,008 18,811 17,554 Acid 7,988 8,733 7,636 0 0 Comment The larger the lift the greater the economies of scale and thus containment or
60

actual reduction of cost. PHPA has no control over selection of vessels but does control some of the facilities, which they use. Our aim, therefore, is to make these latter compatible with the needs of larger vessels. Wharf Turnover 03/04 02/03 01/02 00/01 99/00 In Tonnes per Linear Metre of Berthface Nelson Point Berths 103,809 103,973 92,310 91,357 79,219 Finucane Island Berth 81,841 48,403 40,687 41,169 37,044 PHPA Berths 9,493 8,825 6,776 9,454 8,818 Comment The higher this figure, the more productive the wharf. PHPA Wharves only:-
03/04 02/03 01/02 00/01 99/00 Wharf Utilisation (Gross) (e) 34% 28% 30% 38% 33% Wharf Utilisation (Net) (f) N/A N/A 21% 25% 29% Comment The higher this percentage, the greater the effective or productive use of wharves. Throughput in Tonnes per hour (g)
Salt Gross 2,035 1,350 1,406 1,324 1,026 Net N/A 1,504 1,647 1,598 1,104 Oil Gross 496 430 750 545 367 Net N/A N/A N/A 694 394 General Cargo Gross 41 66 48 46 27 (inc. l/s, scrap, cem, cont) Net N/A N/A 71 53 41 Misc Bulk Minerals Gross 528 532 391 411 219 Net 758 631 431 536 284 Comment The closer together the gross and net figures are, the greater the productive usage of facilities. Total Cost per Cargo Tonne 15.2 15.0 14.4 19.5* 15.6 Total Cost per Gross Registered Tonnes 26.5 26.8 25.4 34.2*
27.5
* Includes maintenance dredging cost.
61

KEY: (a) Number of accidents to annual ship movements. (b) The total ship alongside hours for each berth expressed as a percentage of the total hours in the
year. (c) The total ship alongside hours of each berth divided by the number of vessels using the berth
throughout the year. (d) The total number of hours each class is required to wait divided by the total port calls by each class
of vessel. (e) Total metre/hours of vessels alongside expressed as a percentage of the total available berth
metre/hours. Vessel metre/hours is a function of the length of the vessel and the hours, which it spent alongside. Berth metre/hours are a multiple of the length of the berth times the total hours available.
(f) Measures the productive usage of the wharf i.e. the proportion of metre/hours when vessels are involved in loading or discharging cargo.
(g) The Gross figure includes all time spent alongside by a vessel, whether cargo working or not. The Net figure relates to output achieved whilst work is in progress.
62

SSttaattiissttiiccaall IInnffoorrmmaattiioonn 22000044 Wharf Throughput in Tonnes 2003/04 2002/03 2001/02 2000/01 1999/00 Nelson Point Berth 68,186,061 68,145,189 60,740,039 60,112,992 53,789,719Finucane Island Berth 17,853,699 10,157,644 8,951,193 9,057,232 8,149,743PHPA Berths 3,759,476 3,494,571 2,683,194 3,743,325 3,491,775
Port Trade Imports (Tonnes) 03/04 02/03 01/02 00/01 99/00 Sulphuric Acid 71,896 69,867 61,084 62,192 29,367Cement 0 684 4,048 5,068 0Bitumen 2,744 4,701 8,964 3,093 5,877Containerised Cargo 18,602 14,806 5,419 2,888 3,298Fuel Oils 327,103 268,252 273,063 254,914 242,055General 26,289 7,869 4,173 11,821 3,479 446,634 366,179 356,751 339,976 284,076Exports Iron Ore 84,211,788 76,578,527 68,625,123 68,469,377 61,535,621Hot Briquetted Iron 1,827,072 1,724,306 1,066,109 700,847 403,841Salt 2,450,553 2,278,567 1,702,018 2,787,599 2,825,827Bulk Cargo * 848,012 785,035 594,176 577,367 364,507Livestock 7,699 5,333 15,404 18,991 11,801General /Containers 2,760 10,419 4,711 2,135 1,427Scrap Iron 3,804 9,685 10,134 8,480 3,507Oil 0 0 0 8,777 0 89,350,786 81,391,872 72,017,675 72,573,573 65,146,531 Total Throughput 89,799,236 81,758,051 72,374,426 72,913,549 65,431,080 • Includes manganese, feldspar, copper and chromite
63

Figure 2 - TOTAL TONNES THROUGHPUT ($000's)
0
20000
40000
60000
80000
100000
03/04 02/03 01/02 00/01 99/00
Main Cargo Distribution by Destination
IRON ORE SALT TOTAL
2003/04 2002/03 2003/04 2002/03 2003/04 2002/03 Tonnes
000’s
% Tonnes 000’s
% Tonnes
000’s
% Tonnes 000’s
% Tonnes 000’s
% Tonnes %
Japan 36,575 43 30,514 40 698 28 594 26 37,273 43 31,108 39 South Korea 15,026 18 11,911 15 765 31 510 22 15,791 18 12,421 16 China 19,504 23 15,827 21 38 2 0 0 19,542 22 15,827 20 Interstate 3,996 5 4,185 5 0 0 0 0 3,996 5 4,185 5 Taiwan 6,006 7 5,303 7 530 22 587 26 6,536 8 5,890 8 Netherlands 662 1 670 1 0 0 0 0 662 1 670 1 Philippines 338 1 486 1 0 0 0 0 338 0 486 1 All Other 2,105 3 7,682 10 420 17 588 26 2,525 3 8270 10 Total 84,212 100 76,578 100 2,451 100 2,279 100 86,663 100 78,857 100
Figure 3 - MAIN CARGO DISTRIBUTION BY DESTINATION
Japan
Korea
China
Interstate
Taiwan
Netherlands
Philippines
Other
64

Containerised Cargo 2003/04 2002/03 2001/02 2000/01 1999/00 No. of TEU’s 727 629 253 103 128
Gross Registered Tonnage of Vessels Entered Distributed by Cargo Type 2003/04 2002/03 2001/02 2000/01 1999/00 Iron Ore 46,507,901 42,374,115 37,977,894 38,020,866 34,151,919Hot Briquetted Iron 1,305,795 1,213,875 743,696 500,548 304,676Salt 1,521,305 1,405,065 1,074,269 1,790,724 1,762,513Bulk and General Cargo 827,953 967,331 816,723 780,773 459,258Fuel Tankers (inc Bitumen / Acid)
515,366 371,231 324,796 390,103 453,913
Nil Cargo 14,074 27,488 84,739 133,363 28,796 Total 50,692,394 46,359,105 41,022,117 41,616,377 38,325,714 Number of Vessels Entered Distributed by Cargo Type 2003/04 2002/03 2001/02 2000/01 1999/00 Iron Ore 544 504 457 461 414Hot Briquette Iron 49 43 31 23 17Salt 67 54 50 100 90Bulk and General Cargo 70 59 54 80 48Fuel Tankers (inc Bitumen/Acid)
29 22 20 14 23
Nil Cargo 14 11 10 9 11 Total 773 693 622 687 603
Commonwealth and fishing vessels which do not carry cargo and which are not rated in terms of Gross Registered Tonnage are not included in the above table.
65

All Vessels Entered – Nationality (includes Commonwealth, Naval and Service Vessels) 2003/04 2002/03 2001/02 2000/01 1999/00 FLAG No. % No. % No. % No. % No. % Antigua & Barbuda 12 1 23 3 13 2 0 0 0 0 Australia 14 2 16 2 21 3 31 4 49 8 China 19 2 17 2 12 2 20 3 70 12 Cyprus 25 3 22 3 11 2 12 2 14 2 Greece 30 4 20 3 14 2 14 5 8 1 Hong Kong 53 7 47 7 41 7 40 6 45 7 Japan 19 2 28 4 44 7 40 6 59 10 Liberia 50 6 52 8 45 7 61 9 50 8 Malta 14 2 21 3 8 1 25 4 7 1 Panama 301 41 245 35 228 37 224 32 183 30 Singapore 27 3 31 4 26 4 47 7 25 4 Taiwan 32 4 40 6 37 6 35 4 38 6 Other 177 23 131 20 124 20 144 18 55 11 Total 733 100 693 100 624 100 693 100 603 100 Ships Piloted by Vessel Size (Vessel Size Measurement in Deadweight Tonnes) 2003/04 2002/03 2001/02 2000/01 1999/00 No. % No. % No. % No. % No. % Up to 49,999 365 24 282 20 279 23 428 31 327 2750,000 to 99,999 162 10 173 13 129 10 113 8 104 9100,000 to 149,999 140 9 126 9 148 12 188 14 208 18150,000 to 199,999 705 45 616 45 526 43 518 38 447 37200,000 to 249,999 182 12 172 13 149 12 130 9 112 9250,000 and over 0 0 0 0 0 0 0 0 2 0 Total 1,554 100 1,369 100 1,231 100 1,377 100 1,200 100
Figure 4 – NUMBER OF SHIPS PILOTED
1000
1100
1200
1300
1400
1500
1600
03/04 02/03 01/02 00/01 99/00
66

Pilot Transit Mode of Operation 2003/04 2002/03 2001/02 2000/01 1999/00 No. % No. % No. % No. % No. % Helicopter 1,366 91 1,220 91 1,077 89 1,125 82 1,005 84Pilot Boat 141 9 119 9 137 11 252 18 186 16 * Total 1,507 100 1,339 100 1,214 100 1,377 100 1,191 100 * Excludes inport movements where the helicopter or pilot boat is not used.
67