p2687-r002 - adms report - draft · p2687/r002 may2016 airqualityassessmentofemissions ......
TRANSCRIPT

P2687/R002May 2016
AIR QUALITY ASSESSMENT OF EMISSIONSFROM THE PROPOSED CREMATORIUM,
MAGOR ROAD, LLANMARTIN
THE WESTERLEIGH GROUP
Report Reference Number: P2687/R002
Report Issue: DRAFT FOR COMMENT
Report Prepared by: Report Reviewed & Approved by:
Name: Sarah Burley Name: Howard Ling
Signature: Signature:
Date: May 2016 Date: May 2016
This report is not to be used for contractual or engineering purposes unless this approval sheet is signed whereindicated by both the originator of the report and the approver and the report is designated "FINAL”.
This report has been prepared by Environmental Compliance Limited (ECL) in their professional capacity asEnvironmental Consultants. The contents of the report reflect the conditions that prevailed and the information
available or supplied at the time if its preparation. The report, and the information contained therein, isprovided by ECL solely for use and reliance by the Client in performance of ECL’s duties and liabilities under itscontract with the Client. The contents of the report do not, in any way, purport to include any manner of legal
advice or opinion.
P2687/R002May 2016
AIR QUALITY ASSESSMENT OF EMISSIONSFROM THE PROPOSED CREMATORIUM,
MAGOR ROAD, LLANMARTIN
THE WESTERLEIGH GROUP
TABLE OF CONTENTS
Section Page
1. INTRODUCTION 1
1.1. THE STUDY 11.2. OBJECTIVES OF STUDY 11.3. SCOPE OF THE STUDY 2
2. METHOD STATEMENT 3
2.1. CHOICE OFMODEL 32.2. KEY ASSUMPTIONS 32.3. SENSITIVE RECEPTORS 42.4. AIR QUALITY STANDARDS FOR THE PROTECTION OF HUMAN HEALTH 52.5. ASSESSMENT CRITERIA FOR THE PROTECTION OF SENSITIVE HABITAT SITES AND
ECOSYSTEMS 62.6. BACKGROUND AIR QUALITY ERROR! BOOKMARK NOT DEFINED.2.7. HABITAT SITE SPECIFIC BASELINE CONCENTRATIONS AND DEPOSITION RATES 102.8. STACK EMISSION PARAMETERS 122.9. METEOROLOGICAL (MET) DATA 132.10. BUILDING PARAMETERS 132.11. TERRAIN DATA 142.12. ROUGHNESS LENGTH 142.13. DEPOSITION PARAMETERS - SENSITIVE HABITATS 142.14. MODEL OUTPUT PARAMETERS 152.15. SCENARIOSMODELLED 152.16. ASSESSMENT OF SIGNIFICANCE OF IMPACT GUIDELINES 16
3. ASSESSMENT OF AIR QUALITY IMPACTS - EMISSIONS AT EMISSION LIMIT VALUES17
3.1. HUMAN HEALTH IMPACTS 17
4. ASSESSMENT OF AIR QUALITY IMPACTS - SENSITIVE HUMAN RECEPTORLOCATIONS, EMISSIONS EMISSION LIMIT VALUES 214.1. HUMAN HEALTH IMPACTS 21
P2687/R002May 2016
AIR QUALITY ASSESSMENT OF EMISSIONSFROM THE PROPOSED CREMATORIUM,
MAGOR ROAD, LLANMARTIN
THE WESTERLEIGH GROUP
TABLE OF CONTENTS (cont)
Section Page
5. ASSESSMENT OF AIR QUALITY IMPACTS - IMPACT ON HABITAT SITES, EMISSIONSAT EMISSION LIMIT VALUES 22
5.1. COMPARISON OFMAXIMUM PREDICTED POLLUTANT GROUND LEVELCONCENTRATIONS WITH CRITICAL LEVELS FOR THE PROTECTION OF VEGETATION ANDECOSYSTEMS - OXIDES OF NITROGEN 22
5.2. COMPARISON OFMAXIMUM PREDICTED POLLUTANT GROUND LEVELCONCENTRATIONS WITH CRITICAL LEVELS FOR THE PROTECTION OF VEGETATION ANDECOSYSTEMS - SULPHUR DIOXIDE 24
6. ASSESSMENT OF AIR QUALITY IMPACTS - IMPACT ON HABITAT SITES -DEPOSITION, EMISSIONS AT IED EMISSION LIMIT VALUES 26
6.1. COMPARISON OFMAXIMUM PREDICTED NUTRIENT NITROGEN DEPOSITION RATESWITH CRITICAL LOADS 26
6.2. COMPARISON OFMAXIMUM PREDICTED ACID DEPOSITION RATES WITH CRITICALLOADS 30
7. CONCLUSIONS 33
APPENDICESAPPENDIX A Figures
APPENDIX B Isopleths
APPENDIX C Sentive Receptor Locations Process Contributions
P2687/R002May 2016
ACRONYMS / TERMS USED IN THIS REPORT
ADMS Atmospheric Dispersion Modelling SystemAQDD 4th Air Quality Daughter DirectiveAQLV Air Quality Limit ValueAQO Air Quality ObjectiveAQMA Air Quality Management AreaAQS Air Quality StandardCERC Cambridge Environmental Research ConsultantsCHP Combined Heat and PowerEA Environment AgencyEAL Environmental Assessment LevelECL Environmental Compliance LtdELV Emission Limit ValueEPAQS Expert Panel on Air Quality StandardsGLC Ground Level ConcentrationIED Industrial Emissions DirectiveNCC Newport City CouncilNRW Natural Resources WalesPC Process ContributionPEC Predicted Environmental ConcentrationPM Particulate MatterRamsar International Wetland Conservation SiteSAC Special Area of ConservationSPA Special Protection AreaSSSI Site of Special Scientific InterestVOC Volatile Organic Compounds

P2687/R002May 2016
1
AIR QUALITY ASSESSMENT OF EMISSIONSFROM THE PROPOSED CREMATORIUM,
MAGOR ROAD, LLANMARTIN
THE WESTERLEIGH GROUP
1. INTRODUCTION
1.1. The Study
1.1.1. Environmental Compliance Ltd (“ECL”) was commissioned by the Westerleigh Group toundertake an air quality assessment of emissions from the proposed Crematorium at MagorRoad, Llanmartin. The scope of the assessment was finalised after consultation with NewportCity Council (“NCC”) and Natural Resources Wales (“NRW”).
1.1.2. The study was conducted to determine the impact of emissions to air from the proposedCrematoria on both human health and local environmentally sensitive sites.
1.1.3. The study was undertaken using the ADMS modelling package, which is one of the modelsrecognised by NRW and NCC as being suitable for this type of study.
1.1.4. The location of the facility is indicated on the Site Location Map, which is presented as FigureWG/F1 in Appendix A of this report.
1.2. Objectives of Study
1.2.1. The objectives of this study are as follows:to determine the maximum ground level concentrations (“GLCs”) arising from theemission of pollutants from the Crematorium discharge stack; the pollutants areassumed to be released from the Crematorium at the Emission Limit Values (“ELVs”)defined in Process Guidance Note 5/2(12), or, where ELVs have not been assigned - asis the case for sulphur dioxide and nitrogen oxides - have been based on dataprovided by the plant designer;to assess the impact of emissions from the facility on existing local air quality inrelation to human health at a range of potentially sensitive receptors by comparisonwith relevant air quality standards (“AQSs”); andto predict deposition rates of acids and nutrient nitrogen from the modelledemissions and compare these with relevant Critical Loads and Critical Levels at theLangstone-Llanmartin SSSI.

P2687/R002May 2016
2
1.3. Scope of the Study
1.3.1. Further to the planning application, a stack height of 8.1m was derived based on a D1 Stackheight calculation. This was considered suitable at the planning application stage andconsequently was used in this modelling study.
1.3.2. The study determined the maximum predicted GLCs of the following pollutants:nitrogen oxides (NOx as NO2);total fine particles (PM10 and PM2.5);carbon monoxide;gaseous and vaporous organic substances (“VOCs”), expressed as total organic carbonand assumed to comprise entirely of benzene, as indicated in Environment Agency(“EA”) Horizontal Guidance Note H1, Annex F Air Emissions;
sulphur dioxide;hydrogen chloride;mercury and its compounds; anddioxins and furans.
1.3.3. Modelling was carried out using the appropriate ELVs as specified in Process Guidance Note5/2(12) or as specified by the plant designer (no ELVs are provided for NO2 and SO2).
1.3.4. The effects of prevailing meteorological conditions, building downwash, local terrain andexisting ambient air quality were taken into account.
1.3.5. The maximum predicted pollutant ground level concentrations (“GLCs”) - also known as theprocess contributions (“PCs”) - for each of the releases were compared with the relevant AirQuality Standards (“AQSs”).
1.3.6. The predicted environmental concentrations (“PECs”) - the sum of the pollutant PC and theexisting pollutant background concentration from other sources - were also compared to therelevant standards. Results are presented as the maximum predicted GLC and the maximumsensitive receptor GLC.
1.3.7. The maximum predicted annual mean GLCs for NOx and sulphur dioxide (“SO2”), werecompared with the Critical Levels for the Protection of Ecosystems or Vegetation detailed inAnnex F of H1,for all ecologically sensitive receptors.
1.3.8. The maximum predicted pollutant GLCs at ten human receptors and nine environmentalreceptors were also compared to the relevant AQSs.
1.3.9. The rates of deposition for acids (nitrogen and sulphur) and nutrient nitrogen were predictedfor the adjacent Langstone-Llanmartin SSSI. These rates were then compared to theappropriate Critical Loads for the type and location of each habitat.
P2687/R002May 2016
3
2. METHOD STATEMENT
2.1. Choice of Model
2.1.1. The UK-ADMS model was developed jointly by Cambridge Environmental ResearchConsultants (“CERC”), Her Majesty’s Inspectorate of Pollution (the EA’s predecessor body),the Meteorological Office and National Power, with sponsorship from the UK Governmentand a number of commercial organisations. UK-ADMS is a computer based model ofdispersion from both point and non-point sources in the atmosphere, and is one of themodelling packages that are suitable for this type of study. The current version is ADMS 5.1.
2.1.2. ADMS 5.1 has been validated against a number of data sets in order to assess variousconfigurations of the model such as flat or complex terrain, line/area/volume sources,buildings, dry deposition fluctuations and visible plumes. The model results have beencompared to observational data or other model results if available.
2.1.3. ADMS 5.1 is a new generation Gaussian plume air dispersion model, which means that theatmospheric boundary layer properties are characterised by two parameters:
the boundary layer depth, andthe Monin-Obukhov length,
rather than in terms of the single parameter Pasquill-Gifford class.
2.1.4. Dispersion under convective meteorological conditions uses a skewed Gaussianconcentration distribution (shown by validation studies to be a better representation than asymmetrical Gaussian expression).
2.1.5. ADMS 5.1 is therefore considered to be suitable for use in this assessment.
2.2. Key Assumptions
The study has been undertaken on the basis of a worst case scenario. Consequently, thefollowing assumptions have been made:
the release concentrations of the pollutants will be at the maximum ELVs, or whereELVs have not been assigned in PG5/2(12) as specified by the plant designer (seeSection 1.3.3. of this report), on a 24-hourly basis, 365 days of the year; in practice,when the Crematorium is operating, the release concentrations will be below theELVs, and, for most pollutants, considerably so; furthermore, the crematorium willonly operate Monday – Friday with funerals commencing around 10.30am, with thelast service finishing around 4.30pm.the highest predicted pollutant GLCs for the five years of meteorological data foreach averaging period (annual mean, hourly, 24-hourly etc.) have been used;all of the particulate releases will be present as PM10 and also as PM2.5; this enablesdirect comparison with the respective particulates AQSs, which are expressed interms of PM10 and PM2.5; in practice, this will not be the case as some of the particlespresent will be larger than PM10;concentrations of NO2 in the emissions have been calculated assuming a long-term70% NO to NO2 conversion rate, and a short-term 35% NO to NO2 (ref: Guidance on

P2687/R002May 2016
4
NOx and NO2 Conversion Ratios as referenced in AQTAG06 Technical guidance ondetailed modelling approach for an appropriate assessment (April 2010)); andmaximum predicted GLCs at any location, irrespective of whether a sensitive receptoris characteristic of public exposure, are compared against the relevant AQSs for eachpollutant; in addition, the predicted maximum sensitive receptor GLC has also beenassessed.
2.3. Sensitive Receptors
2.3.1. Sensitive Human Receptors
In addition to predicting concentrations over the 10km by 10km grid (see Section 2.11.2. ofthis report), there are ten specified locations that are the nearest receptors to the proposedCrematorium with the potential for human exposure. Details of the specific receptors areprovided in Table 1 and the location of each is provided in Figure WG/F2 in Appendix A.
Table 1 Specific Sensitive Human Receptors Considered for the Assessment
Ref Location Easting Northing
DistancefromSource(m)
Heading(degrees)
R1 House off Ford Farm Lane 338715 189915 266 341
R2 Court Farm Stables 339152 189573 362 104
R3 Waltwood Park Drive 338744 189252 415 188
R4 Carpenter Close 338478 190238 660 331
R5 Pencoed Lane 339762 189396 997 106
R6 The Nurseries 337733 189889 1092 282
R7 Llanmartin Primary School 338150 188752 1120 216
R8 Langstone Primary School 338273 190776 1232 335
R9 Holly Lane 340014 190184 1320 67
R10 Allotments off Waltwood Park Road 339171 189148 634 144
2.3.2. Sensitive Environmental Receptors
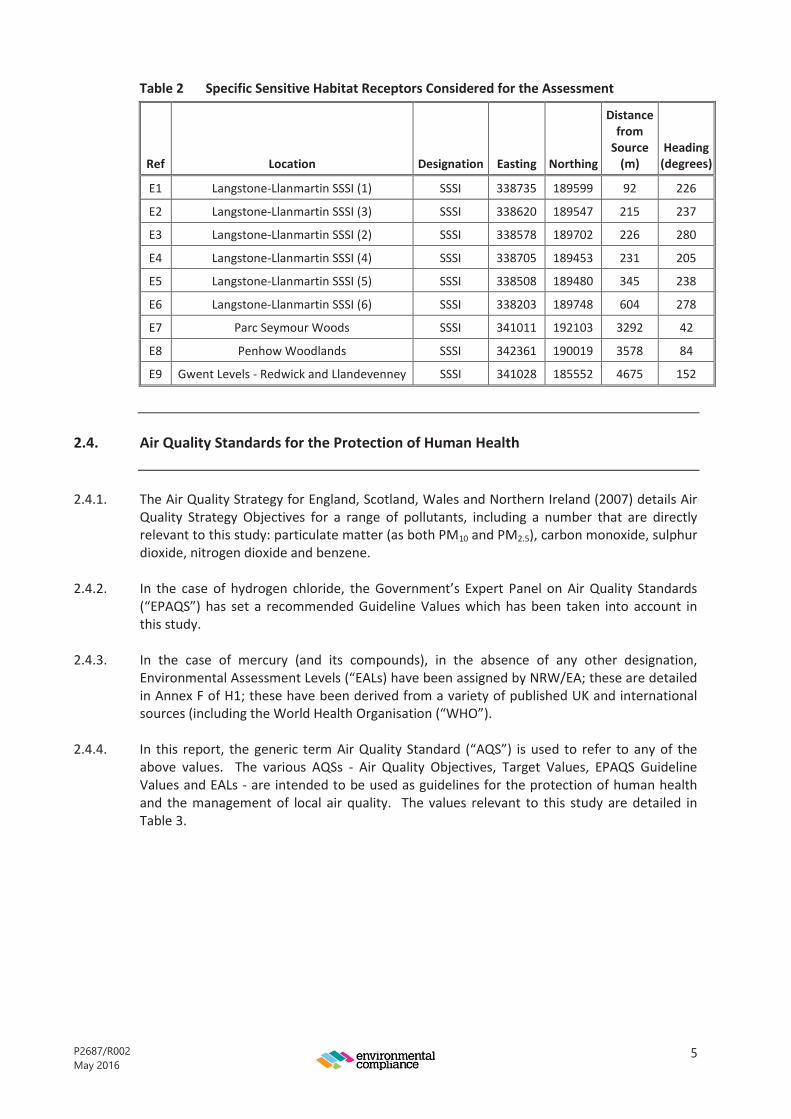
2.3.2.1. The impact of emissions to air on vegetation and ecosystems from the proposed facility hasbeen assessed for the following sensitive environmental receptors within 5km of theproposed crematorium discharge stack.
2.3.2.2. Habitat receptor designations that have been identified within this distance detailed aboveare presented in Table 2, and are shown on Figure WG/F2 in Appendix A; the Langstone-Llanmartin SSSI is outlined in blue. It should be noted that, given that NRW has expressedconcerns with regard to deposition from the proposed crematorium on the Langstone-Llanmartin SSSI, it was considered prudent that more than one location within the SSSIshould be assessed. Accordingly, six specific locations have been considered in theassessment.
P2687/R002May 2016
5
Table 2 Specific Sensitive Habitat Receptors Considered for the Assessment
Ref Location Designation Easting Northing
DistancefromSource(m)
Heading(degrees)
E1 Langstone-Llanmartin SSSI (1) SSSI 338735 189599 92 226
E2 Langstone-Llanmartin SSSI (3) SSSI 338620 189547 215 237
E3 Langstone-Llanmartin SSSI (2) SSSI 338578 189702 226 280
E4 Langstone-Llanmartin SSSI (4) SSSI 338705 189453 231 205
E5 Langstone-Llanmartin SSSI (5) SSSI 338508 189480 345 238
E6 Langstone-Llanmartin SSSI (6) SSSI 338203 189748 604 278
E7 Parc Seymour Woods SSSI 341011 192103 3292 42
E8 PenhowWoodlands SSSI 342361 190019 3578 84
E9 Gwent Levels - Redwick and Llandevenney SSSI 341028 185552 4675 152
2.4. Air Quality Standards for the Protection of Human Health
2.4.1. The Air Quality Strategy for England, Scotland, Wales and Northern Ireland (2007) details AirQuality Strategy Objectives for a range of pollutants, including a number that are directlyrelevant to this study: particulate matter (as both PM10 and PM2.5), carbon monoxide, sulphurdioxide, nitrogen dioxide and benzene.
2.4.2. In the case of hydrogen chloride, the Government’s Expert Panel on Air Quality Standards(“EPAQS”) has set a recommended Guideline Values which has been taken into account inthis study.
2.4.3. In the case of mercury (and its compounds), in the absence of any other designation,Environmental Assessment Levels (“EALs) have been assigned by NRW/EA; these are detailedin Annex F of H1; these have been derived from a variety of published UK and internationalsources (including the World Health Organisation (“WHO”).
2.4.4. In this report, the generic term Air Quality Standard (“AQS”) is used to refer to any of theabove values. The various AQSs - Air Quality Objectives, Target Values, EPAQS GuidelineValues and EALs - are intended to be used as guidelines for the protection of human healthand the management of local air quality. The values relevant to this study are detailed inTable 3.

P2687/R002May 2016
6
Table 3 Air Quality Standards for the Protection of Human Health
PollutantAveragingPeriod
AQS( g/m3) Comments
Nitrogen Dioxide(NO2)
annual 40 UK AQO
1-hour 200UK AQO, not to be exceeded more than 18 timesper annum, equivalent to the 99.8th percentile of
1-hour means
Sulphur Dioxide(SO2)
24-hour 125UK AQO, not to be exceeded more than 3 times
per annum, equivalent to the 99.2nd percentile of24-hour means
1-hour 350UK AQO, not to be exceeded more than 24 timesper annum, equivalent to the 99.7th percentile of
1-hour means
15-minute 266
UK AQO, not to be exceeded more than 35 timesper annum, equivalent to the 99.9th percentile of
15-minute means
Particulate Matter,as PM10
annual 40 UK AQO
24-hour 50UK AQO, not to be exceeded more than 35 timesper annum, equivalent to the 90.41th percentile
of 24 hour means
Particulate Matter,as PM2.5
annual 25 EU Limit Value
Carbon Monoxide(CO) 8-hour 10,000 UK AQO
VOC (as benzene) annual 5 EU Limit Value
Hydrogen Chloride(HCl) 1-hour 750 EPAQS Guideline Value
Mercury (Hg)annual 0.25 EAL derived from long-term occupational
exposure limits
1-hour 7.5 EAL derived from long-term occupationalexposure limits as no short-term limit exists
Dioxins and Furans No Standard Applies
2.5. Assessment Criteria for the Protection of Sensitive Habitat Sites and Ecosystems
2.5.1. For dispersion modelling purposes, the specified habitat co-ordinates are a precautionaryapproach, and are those located at the boundary of the protected site closest to theproposed Crematorium, with the exception of the Langstone-Llanmartin SSSI where anumber of locations within the SSSI have been considered due to its close proximity to thesite. The maximum predicted impact for each of the habitat sites has been identified forcomparison with relevant assessment criteria.
2.5.2. Critical Levels
2.5.2.1. Critical levels are thresholds of airborne pollutant concentrations above which damage maybe sustained to sensitive plants and animals. High concentrations of pollutants in ambient air

P2687/R002May 2016
7
directly cause harm to leaves and needles of forests and other plant communities. Oxidisednitrogen can have both a toxic effect on vegetation and an impact on nutrient nitrogen.
2.5.2.2. Table B4 of Annex F of H1 details Critical Levels for the Protection of Vegetation andEcosystems for sulphur dioxide and nitrogen oxides (as NO2); the current values aresummarised in Table 4.
Table 4 Assessment Criteria for the Protection of Sensitive Habitats and Ecosystems
Pollutant
CriticalLevel
( g/m3) Measured as:
Nitrogen Oxides(as NO2)
30 Annual Mean
75 Daily Mean
Sulphur Dioxide(SO2)
10
Annual Meanfor sensitive lichen communities & bryophytes and ecosystems
where lichens & bryophytes are an important part of theecosystem’s integrity
20Annual Mean
For all higher plants (all other ecosystems)
2.5.3. Critical Loads
2.5.3.1. Critical Loads are defined as:"a quantitative estimate of exposure to one or more pollutants below which significantharmful effects on specified sensitive elements of the environment do not occuraccording to present knowledge"(1).
2.5.3.2. Critical loads for nutrient nitrogen are set under the Convention on Long-RangeTransboundary Air Pollution based on empirical evidence, mainly observations fromexperiments and gradient studies. Critical loads(2) are assigned to habitat classes of theEuropean Nature Information System(3) in units of kgN/ha/yr.
2.5.3.3. Predicted NOx deposition rates in units of μg m-2 s-1 are converted to units of kg/ha/yr asnitrogen for direct comparison with critical loads as follows:
kgN/ha/yr = μg/m2/s (14/46)(4) 315.36(5)
2.5.3.4. Exceedance of critical loads for nitrogen deposition can result in significant terrestrial andfreshwater impacts due to changes in species composition, reduction in species richness,increase in nitrate leaching, increases in plant production, changes in algal productivity andincreases in the rate of succession(6).
2.5.3.5. In the UK, an empirical approach is applied to critical loads for acidity for non-woodlandhabitats; and the simple mass balance equation is applied to both managed and unmanagedwoodland habitats. For freshwater ecosystems, national critical load maps are currentlybased on the First-order Acidity Balance model. All of these methods provide critical loadsfor systems at steady-state(2) in units of keq/ha/yr.
2.5.3.6. The unit kiloequivalent (keq) is the molar equivalent of potential acidity resulting from
(1) From http://www.unece.org/env/lrtap/WorkingGroups/wge/definitions.htm(2) From http://www.apis.ac.uk/overview/issues/overview_Cloadslevels.htm(3) See http://eunis.eea.europa.eu/ for details(4) Ratio of atomic weight( of nitrogen to molecular weight of nitrogen dioxide(5) Conversion factor from g/m2 to kg/ha.(6) From http://www.apis.ac.uk/overview/issues/overview_Cloadslevels.htm#_Toc279788052

P2687/R002May 2016
8
sulphur or oxidised and reduced nitrogen. Predicted acid deposition rates in units of μg/m2/sare converted to units of keq/ha/yr) as hydrogen for direct comparison with critical loads asfollows:
nitrogen from NOx (keq) =([NOx]μg/m2/s (14/46) 315.36 ) 14(1)
sulphur (keq) =([SO2]μg/m2/s (32/64) 315.36) 16(2.
2.5.3.7. Emissions of hydrogen chloride (HCl) from the facility will also contribute to the totalacidification rate.
2.5.3.8. Exceedance of the critical loads for acid deposition can result in significant terrestrial andfreshwater impacts due to leaching and subsequent increase in availability of potentially toxicmetal ions.
2.5.3.9. Tables 5 and 6 list the site-specific critical loads for nutrient nitrogen deposition and aciddeposition respectively. Features are as indicated on the Air Pollution Information System(“APIS”) website (for SACs) or directly from the SSSI citation. Where a primary featureidentified in the SSSI citation was not listed on the APIS website, an equivalent feature wasused to derive critical loads as indicated in the Habitats Table on the APIS website(3).
Table 5 Critical Loads for Nutrient Nitrogen Deposition
Ref Site Habitat InterestHabitatFeature
LowerCritical Load
UpperCritical Load
(kgN/ha/yr) (kgN/ha/yr)
E1 - E6 Langstone-Llanmartin SSSI Marshy grassland Molinia 15 25
Table 6 Critical Loads for Acid Deposition
Ref Site Habitat InterestHabitatFeature
Maximum Critical Load(a)
(kgeq/ha/yr)
E1 - E6 Langstone-Llanmartin SSSI Marshy grassland Molinia 8.56
Note to Table 6(a) The maximum Critical Load is the sum of the maximum critical load for nitrogen and sulphur.
2.6. Background Air Quality
2.6.1. Background air quality data has been obtained for all pollutants considered in this study sothat the PECs for all pollutants - both short-term and long-term - can be calculated. Thesections below indicate what the background concentration for each pollutant is and fromwhere the data has been sourced.
2.6.2. In the assessment of pollutant ground level concentrations prepared for the planningapplication, background air quality data was sourced from DEFRA’s air quality mappingsystem. However for certain pollutants, actual monitoring data has been sourced and hasbeen used in preference to the DEFRA mapped data. The source of the background data isindicated in the sections below.
(1)14kg nitrogen/ha/yr = 1keq nitrogen/ha/yr(2)16kg sulphur/ha/yr= 1keq sulphur/ha/yr(3) http://www.apis.ac.uk/habitat_table.html
P2687/R002May 2016
9
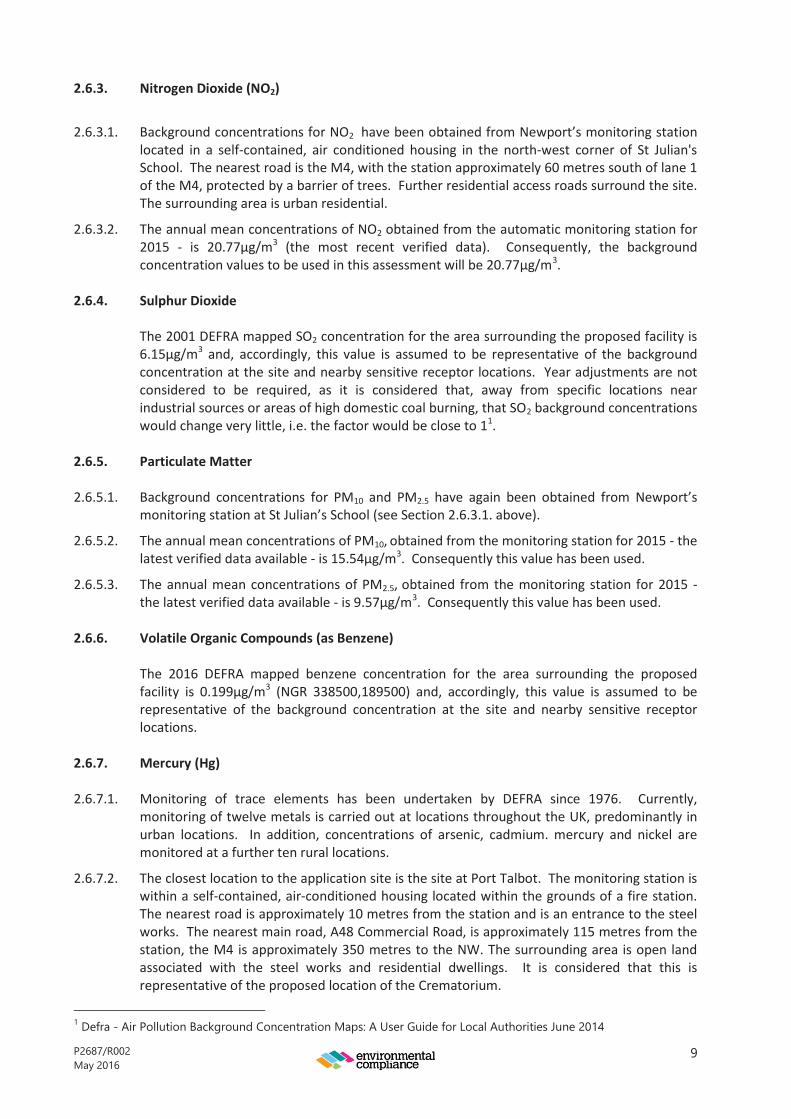
2.6.3. Nitrogen Dioxide (NO2)
2.6.3.1. Background concentrations for NO2 have been obtained from Newport’s monitoring stationlocated in a self-contained, air conditioned housing in the north-west corner of St Julian'sSchool. The nearest road is the M4, with the station approximately 60 metres south of lane 1of the M4, protected by a barrier of trees. Further residential access roads surround the site.The surrounding area is urban residential.
2.6.3.2. The annual mean concentrations of NO2 obtained from the automatic monitoring station for2015 - is 20.77μg/m3 (the most recent verified data). Consequently, the backgroundconcentration values to be used in this assessment will be 20.77μg/m3.
2.6.4. Sulphur Dioxide
The 2001 DEFRA mapped SO2 concentration for the area surrounding the proposed facility is6.15μg/m3 and, accordingly, this value is assumed to be representative of the backgroundconcentration at the site and nearby sensitive receptor locations. Year adjustments are notconsidered to be required, as it is considered that, away from specific locations nearindustrial sources or areas of high domestic coal burning, that SO2 background concentrationswould change very little, i.e. the factor would be close to 11.
2.6.5. Particulate Matter
2.6.5.1. Background concentrations for PM10 and PM2.5 have again been obtained from Newport’smonitoring station at St Julian’s School (see Section 2.6.3.1. above).
2.6.5.2. The annual mean concentrations of PM10, obtained from the monitoring station for 2015 - thelatest verified data available - is 15.54μg/m3. Consequently this value has been used.
2.6.5.3. The annual mean concentrations of PM2.5, obtained from the monitoring station for 2015 -the latest verified data available - is 9.57μg/m3. Consequently this value has been used.
2.6.6. Volatile Organic Compounds (as Benzene)
The 2016 DEFRA mapped benzene concentration for the area surrounding the proposedfacility is 0.199μg/m3 (NGR 338500,189500) and, accordingly, this value is assumed to berepresentative of the background concentration at the site and nearby sensitive receptorlocations.
2.6.7. Mercury (Hg)
2.6.7.1. Monitoring of trace elements has been undertaken by DEFRA since 1976. Currently,monitoring of twelve metals is carried out at locations throughout the UK, predominantly inurban locations. In addition, concentrations of arsenic, cadmium. mercury and nickel aremonitored at a further ten rural locations.
2.6.7.2. The closest location to the application site is the site at Port Talbot. The monitoring station iswithin a self-contained, air-conditioned housing located within the grounds of a fire station.The nearest road is approximately 10 metres from the station and is an entrance to the steelworks. The nearest main road, A48 Commercial Road, is approximately 115 metres from thestation, the M4 is approximately 350 metres to the NW. The surrounding area is open landassociated with the steel works and residential dwellings. It is considered that this isrepresentative of the proposed location of the Crematorium.
1 Defra - Air Pollution Background Concentration Maps: A User Guide for Local Authorities June 2014

P2687/R002May 2016
10
2.6.7.3. The annual mean concentrations of Hg, obtained from the monitoring station for 2013 - thelatest verified data available - is 2.16ng/m3. Consequently this value has been used.
2.6.8. Carbon Monoxide (CO)
The 2001 DEFRA mapped CO concentrations for the area surrounding the proposed facility(338500, 189500) is 0.253mg/m3. The year adjustment factor for 2016 is 0.431.Consequently a background concentration of 0.109mg/m3 has been used in the assessments.
2.6.9. Hydrogen Chloride (HCl)
2.6.9.1. Ambient monitoring of HCl is carried out as part of UK Acid Gases and Aerosols MonitoringNetwork (AGANet) at a number of locations around the UK. There are no sites in the vicinityof the proposed Crematorium, the nearest sites are Narbeth, Rosemaund and Harwell. Theaverage annual mean HCl concentrations measured in 2014 were 0.252μg/m3, 0.281μg/m3
and 0.286μg/m3 respectively.
2.6.9.2. To ensure a worst case scenario, a value of 0.286μg/m3 has been assumed to provide areasonable estimate of the background concentration at the proposed Crematorium.
2.6.10. Dioxins and Furans (PCDD/Fs)
2.6.10.1. Monitoring of PCDD/Fs is currently carried out by DEFRA at six locations in the UK (Hazelrigg,High Muffles, London, Manchester, Weybourne and Auchencorth Moss). None of theselocations are close to the site, however, the site at Hazelrigg is located in a rural area,adjacent to the M6 Motorway, therefore could be considered a comparable location.
2.6.10.2. The annual mean concentrations of dioxins and furans, obtained from the monitoring stationfor 2010 - the latest verified data available - is 2.76fgTEQ/m3. Consequently this value hasbeen used.
2.7. Habitat Site Specific Baseline Concentrations and Deposition Rates
2.7.1. Airborne NOx, SO2 and NH3 Concentrations
A summary of site specific baseline concentrations of NOx and SO2 as provided by APIS, ispresented in Table 7.

P2687/R002May 2016
11
Table 7 Baseline Concentrations of NOx, SO2, HF, and NH3
ReceptorReference Description
Background Concentration(a)
NOx(μg/m3)
SO2(μg/m3)
AnnualMean
24 Hour(b)
MeanAnnualMean
E1 Langstone-Llanmartin SSSI (1) 22.5 26.55 2.14
E2 Langstone-Llanmartin SSSI (3) 22.5 26.55 2.14
E3 Langstone-Llanmartin SSSI (2) 22.5 26.55 2.14
E4 Langstone-Llanmartin SSSI (4) 22.5 26.55 2.14
E5 Langstone-Llanmartin SSSI (5) 22.5 26.55 2.14
E6 Langstone-Llanmartin SSSI (6) 22.5 26.55 2.14
E7 Parc Seymour Woods 14.14 16.69 1.37
E8 PenhowWoodlands 14.14 16.69 1.37
E9Gwent Levels - Redwick and
Llandevenney 19.75 23.31 1.52
Notes to Table 7(a) Background concentrations for the relevant ecological habitats have been taken from the APIS
website for the closest grid square to the site.(b) The 24-hour mean baseline concentration is twice the annual mean multiplied by a factor of 0.59,
in accordance with the H1 guidance.
2.7.2. Nutrient Nitrogen and Acid Deposition
2.7.2.1. A summary of site-specific baseline nutrient nitrogen and acid deposition rates, as providedby APIS, is presented in Table 8. Only the Langstone-Llanmartin SSSI has been considered fornutrient nitrogen and acid deposition (see Section 2.3.2.2.).
Table 8 Background Nutrient Nitrogen and Acid Deposition
ReceptorReference Description
Nutrient NitrogenBackground(kgN/ha/yr)
Acid DepositionBackground(keq/ha/yr)
E1 Langstone-Llanmartin SSSI (1) 15.4 1.28
E2 Langstone-Llanmartin SSSI (2) 15.4 1.28
E3 Langstone-Llanmartin SSSI (3) 15.4 1.28
E4 Langstone-Llanmartin SSSI (4) 15.4 1.28
E5 Langstone-Llanmartin SSSI (5) 15.4 1.28
E6 Langstone-Llanmartin SSSI (6) 15.4 1.28
P2687/R002May 2016
12
2.8. Stack Emission Parameters
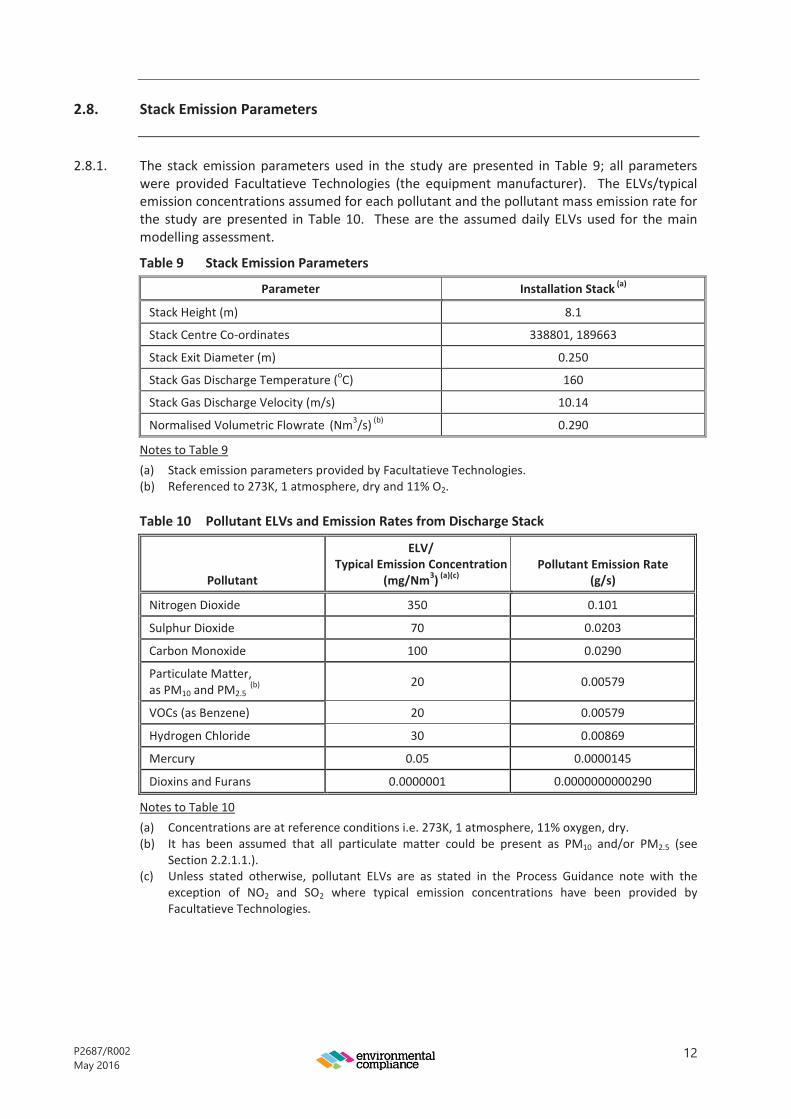
2.8.1. The stack emission parameters used in the study are presented in Table 9; all parameterswere provided Facultatieve Technologies (the equipment manufacturer). The ELVs/typicalemission concentrations assumed for each pollutant and the pollutant mass emission rate forthe study are presented in Table 10. These are the assumed daily ELVs used for the mainmodelling assessment.
Table 9 Stack Emission Parameters
Parameter Installation Stack (a)
Stack Height (m) 8.1
Stack Centre Co-ordinates 338801, 189663
Stack Exit Diameter (m) 0.250
Stack Gas Discharge Temperature (oC) 160
Stack Gas Discharge Velocity (m/s) 10.14
Normalised Volumetric Flowrate (Nm3/s) (b) 0.290
Notes to Table 9(a) Stack emission parameters provided by Facultatieve Technologies.(b) Referenced to 273K, 1 atmosphere, dry and 11% O2.
Table 10 Pollutant ELVs and Emission Rates from Discharge Stack
Pollutant
ELV/Typical Emission Concentration
(mg/Nm3) (a)(c)Pollutant Emission Rate
(g/s)
Nitrogen Dioxide 350 0.101
Sulphur Dioxide 70 0.0203
Carbon Monoxide 100 0.0290
Particulate Matter,as PM10 and PM2.5
(b) 20 0.00579
VOCs (as Benzene) 20 0.00579
Hydrogen Chloride 30 0.00869
Mercury 0.05 0.0000145
Dioxins and Furans 0.0000001 0.0000000000290
Notes to Table 10(a) Concentrations are at reference conditions i.e. 273K, 1 atmosphere, 11% oxygen, dry.(b) It has been assumed that all particulate matter could be present as PM10 and/or PM2.5 (see
Section 2.2.1.1.).(c) Unless stated otherwise, pollutant ELVs are as stated in the Process Guidance note with the
exception of NO2 and SO2 where typical emission concentrations have been provided byFacultatieve Technologies.

P2687/R002May 2016
13
2.9. Meteorological (Met) Data
2.9.1. ADMS has a meteorological pre-processing capability, which calculates the required boundarylayer parameters from a variety of data. Meteorological data (“met data”) can be utilised inits sequentially analysed form, which estimates the pattern of dispersion through 10 degreesectors from the source or as raw data.
2.9.2. The nearest suitable met data available from the Meteorological Office (“Met Office”) is fromFilton, 14.5miles to the south-west of the site. The topography between Filton and theCrematorium is relatively flat and both locations have similar characteristics.
2.9.3. Other met stations in the area were considered and discounted as follows:Usk Number 2 can only provide data for air temperature, rainfall and relativehumidity but only from around 2012;
Cardiff Bute Park can only provide data for air temp, rainfall and relative humidity;Ross-on-Wye is approximately 25 miles away and cannot provide hourly data forADMS purposes at all;
St Athan can provide full ADMS but is it about 27.5 miles away and is more of acoastal station;
Avonmouth is a wind only station.
2.9.4. Further to discussion with the Met Office, Filton data was considered to be the mostrepresentative of the meteorological conditions of the site, NCC also confirmed that FiltonData was suitable. The assessment utilises five years (2011 - 2015) of hourly sequentiallyanalysed data in sectors of 10 degrees. Wind roses for the data are presented in FigureWG/F3 in Appendix A; these show that the prevailing winds are predominantly west-south-west.
2.9.5. Over the five years of meteorological data used (43,824 hours), ADMS reported that 554hours contained inadequate data, 185 hours were calm and 1,335 hours were non-calm metdata lines with a wind speed less than the minimum value (0.75 m/s). These represent0.42%, 1.3% and 3.0% of the data respectively.
2.10. Building Parameters
2.10.1. The building parameters utilised for the study have been provided by the Westerleigh Groupand are detailed in Table 11.
Table 11 Site Building Parameters
Building X (a) Y (a) Angle (o)( b)Height(m) (c)
Length/Diameter(m) (c)
Width(m) (c)
Combined Building(d)(f) 338793 189661 15.8 7.9(e) 31.378(f) 21.090(f)
Notes to Table 11(a) X(m), Y(m) denote the grid reference co-ordinates of the centre of the building.(b) Angle denotes the angle between north and the side designated as length in the ADMS model.(c) Building dimensions provided by the Westerleigh Group..
P2687/R002May 2016
14
(d) Designated as the main building.(e) The building is not of uniform height, the highest point of the building is therefore provided.(f) As the Crematorium is made up of a two buildings, the maximum extents of the buildings have used in
the model as for each wind direction, all buildings are reduced to a single, cuboidal effective, windaligned building, whose height is a function of the height of the main building.
2.11. Terrain Data
2.11.1. ADMS has a terrain pre-processing capability, which calculates the required boundary layerparameters from a variety of data.
2.11.2. Terrain data was used for an area of 200km2 (20 km by 20 km), which is larger than theoutput grid area. This was created by compiling the data from the relevant Ordnance Surveytiles. The terrain data file was created using an ADMS terrain gird resolution of 64 x 64 wasused. The terrain data used was of sufficient size to ensure that it would be suitable for usein the modelling study, i.e. it would encompass all sensitive human and ecological receptors.This approach will therefore ensure consistency in results.
2.12. Roughness Length
2.12.1. The surface nature of the terrain is defined in terms of Roughness Length (Zo). The roughnesslength is dependent on the type of terrain and its physical properties. The ADMS5.1 modelgives values to various types of terrain, for example, agricultural areas are classed as 0.3m,parkland and open suburbia is classed as 0.5m and cities and woodlands are classed as 1.0m.
2.12.2. The dispersion site can be classed as open grassland, thus a figure of 0.02m has been used.The meteorological site is located within a mixture of commercial and residentialdevelopment, therefore a figure of 1m has been used.
2.13. Deposition Parameters - Sensitive Habitats
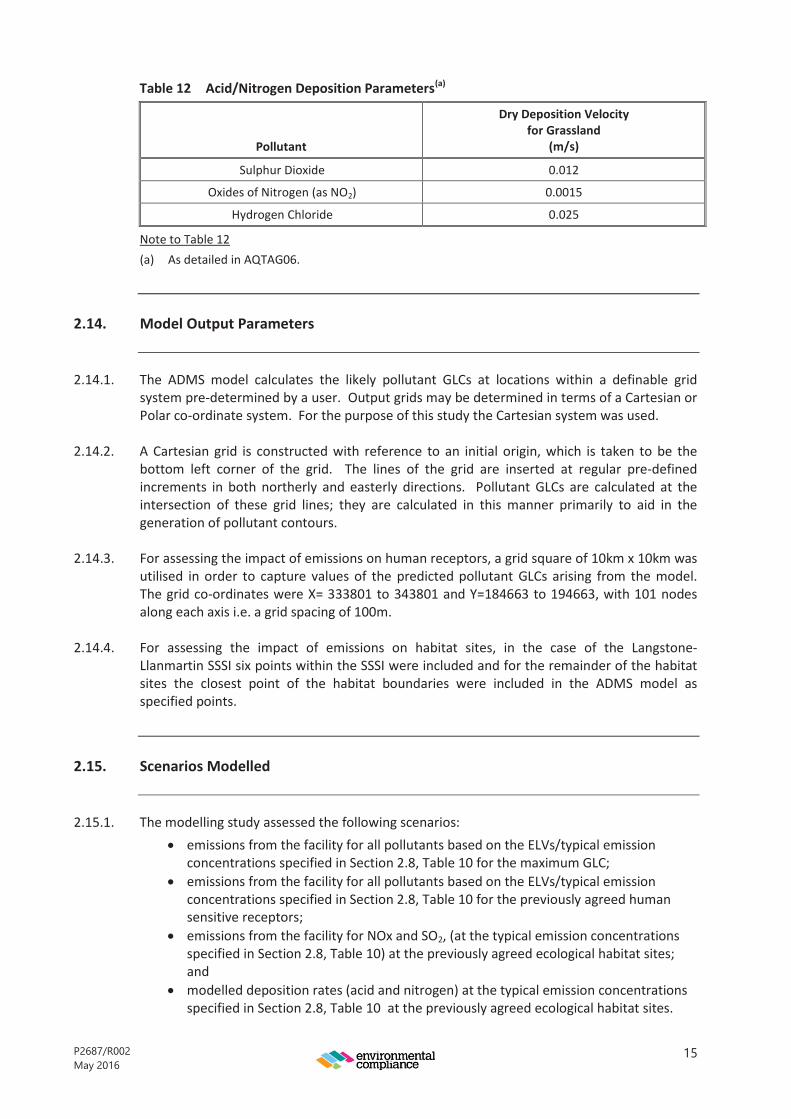
2.13.1. Deposition of nitrogen and acids at designated habitats sites was also included in theassessment. This focused on the Langstone-LLanmartin SSSI located adjacent to theCrematorium. The pollutant deposition rates are presented in Table 12. These parametersare detailed in AQTAG06 (see Section 2.2.1. of this document).
2.13.2. For acidification impacts, the deposition of oxides of nitrogen, sulphur dioxide and hydrogenchloride are considered. For nutrient nitrogen, the deposition of the oxides of nitrogen areincluded.
P2687/R002May 2016
15
Table 12 Acid/Nitrogen Deposition Parameters(a)
Pollutant
Dry Deposition Velocityfor Grassland
(m/s)
Sulphur Dioxide 0.012
Oxides of Nitrogen (as NO2) 0.0015
Hydrogen Chloride 0.025
Note to Table 12(a) As detailed in AQTAG06.
2.14. Model Output Parameters
2.14.1. The ADMS model calculates the likely pollutant GLCs at locations within a definable gridsystem pre-determined by a user. Output grids may be determined in terms of a Cartesian orPolar co-ordinate system. For the purpose of this study the Cartesian system was used.
2.14.2. A Cartesian grid is constructed with reference to an initial origin, which is taken to be thebottom left corner of the grid. The lines of the grid are inserted at regular pre-definedincrements in both northerly and easterly directions. Pollutant GLCs are calculated at theintersection of these grid lines; they are calculated in this manner primarily to aid in thegeneration of pollutant contours.
2.14.3. For assessing the impact of emissions on human receptors, a grid square of 10km x 10km wasutilised in order to capture values of the predicted pollutant GLCs arising from the model.The grid co-ordinates were X= 333801 to 343801 and Y=184663 to 194663, with 101 nodesalong each axis i.e. a grid spacing of 100m.
2.14.4. For assessing the impact of emissions on habitat sites, in the case of the Langstone-Llanmartin SSSI six points within the SSSI were included and for the remainder of the habitatsites the closest point of the habitat boundaries were included in the ADMS model asspecified points.
2.15. Scenarios Modelled
2.15.1. The modelling study assessed the following scenarios:emissions from the facility for all pollutants based on the ELVs/typical emissionconcentrations specified in Section 2.8, Table 10 for the maximum GLC;emissions from the facility for all pollutants based on the ELVs/typical emissionconcentrations specified in Section 2.8, Table 10 for the previously agreed humansensitive receptors;emissions from the facility for NOx and SO2, (at the typical emission concentrationsspecified in Section 2.8, Table 10) at the previously agreed ecological habitat sites;andmodelled deposition rates (acid and nitrogen) at the typical emission concentrationsspecified in Section 2.8, Table 10 at the previously agreed ecological habitat sites.
P2687/R002May 2016
16
2.16. Assessment of Significance of Impact Guidelines
2.16.1. Annex F of H1 details the guidelines upon which the assessment of the significance of impactcan be established. In the first instance, it indicates that process contributions (“PCs”) can beconsidered insignificant if :
the long-term PC is <1% of the long-term environmental standard; andthe short-term PC is <10% of the short-term environmental standard.
2.16.2. Where a PC exceeds the above criteria then the impact is deemed ‘potentially significant’,and further assessment has to be undertaken. The next step of the assessment takes accountof the existing background concentrations of the pollutant of interest, and H1 indicates thatenvironmental standards are unlikely to be exceeded provided:
the long-term PEC is <70% of the long-term environmental standard; andthe short-term PC is <20% (short-term standard – 2 x long-term background).
(where the long-term PEC - predicted environmental concentration - is the sum of the long-term PC and the long-term pollutant background concentration).
P2687/R002May 2016
17
3. ASSESSMENT OF AIR QUALITY IMPACTS - EMISSIONS AT EMISSION LIMITVALUES/TYPICAL EMISSION CONCENTRATIONS
3.1. Human Health Impacts
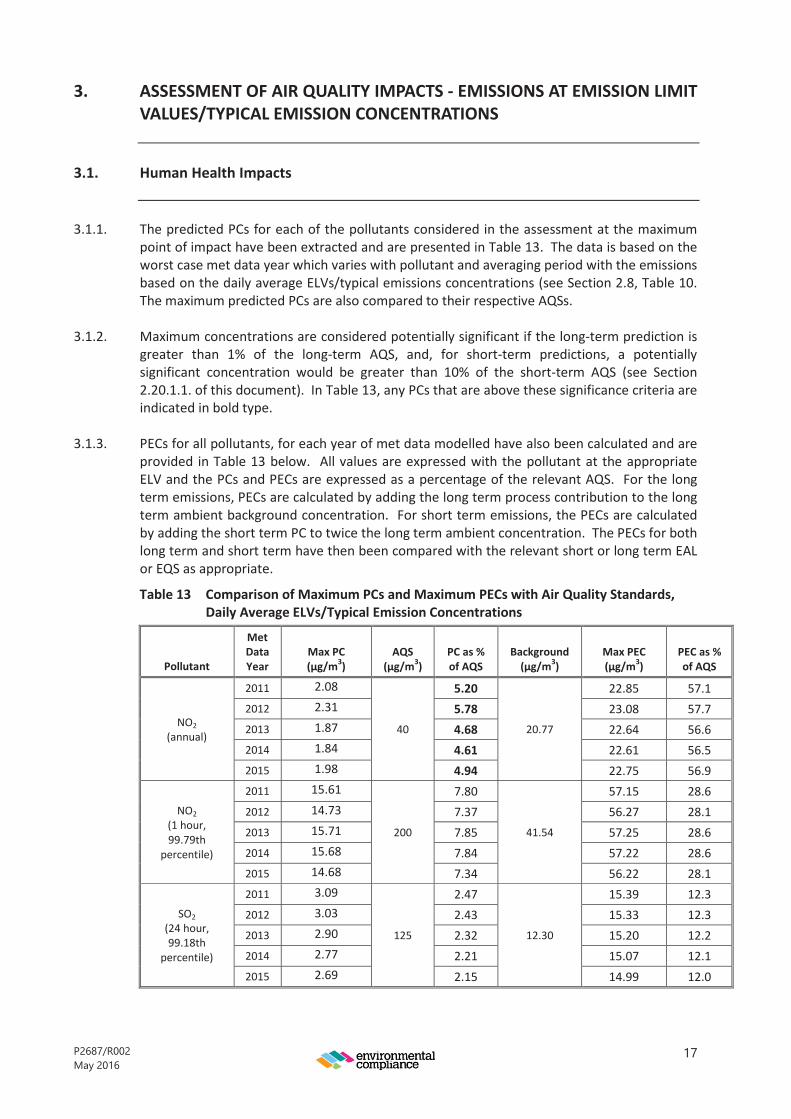
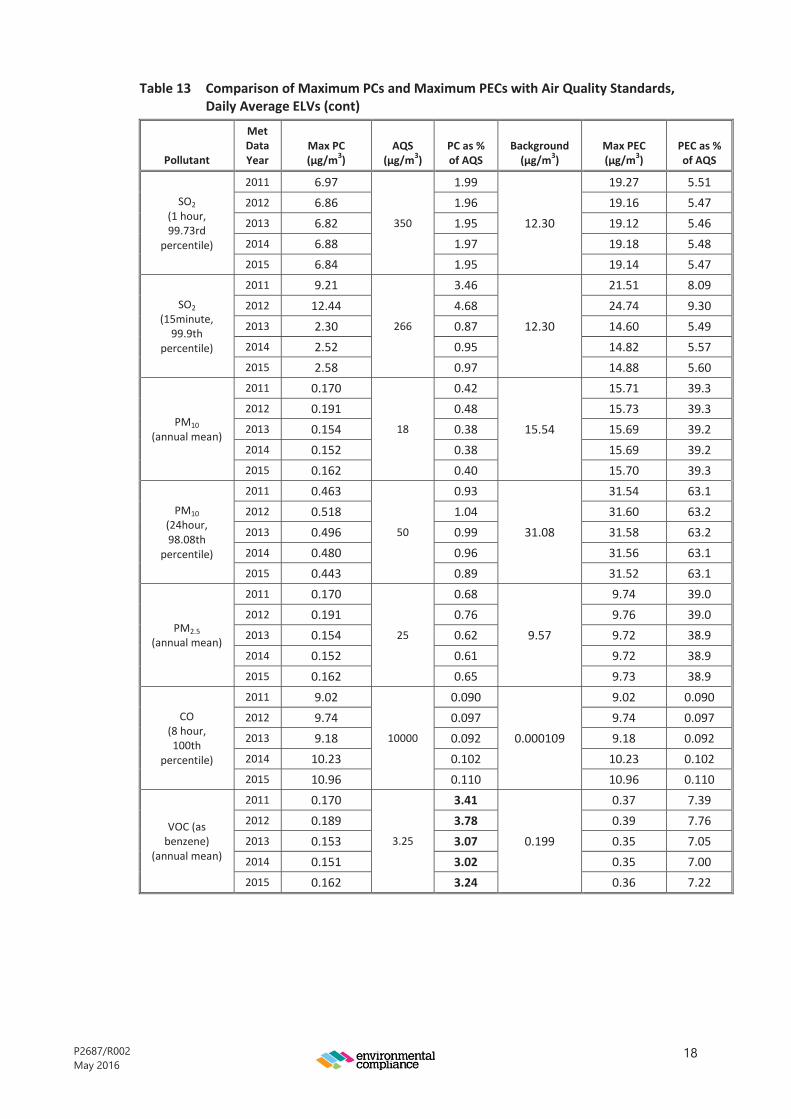
3.1.1. The predicted PCs for each of the pollutants considered in the assessment at the maximumpoint of impact have been extracted and are presented in Table 13. The data is based on theworst case met data year which varies with pollutant and averaging period with the emissionsbased on the daily average ELVs/typical emissions concentrations (see Section 2.8, Table 10.The maximum predicted PCs are also compared to their respective AQSs.
3.1.2. Maximum concentrations are considered potentially significant if the long-term prediction isgreater than 1% of the long-term AQS, and, for short-term predictions, a potentiallysignificant concentration would be greater than 10% of the short-term AQS (see Section2.20.1.1. of this document). In Table 13, any PCs that are above these significance criteria areindicated in bold type.
3.1.3. PECs for all pollutants, for each year of met data modelled have also been calculated and areprovided in Table 13 below. All values are expressed with the pollutant at the appropriateELV and the PCs and PECs are expressed as a percentage of the relevant AQS. For the longterm emissions, PECs are calculated by adding the long term process contribution to the longterm ambient background concentration. For short term emissions, the PECs are calculatedby adding the short term PC to twice the long term ambient concentration. The PECs for bothlong term and short term have then been compared with the relevant short or long term EALor EQS as appropriate.
Table 13 Comparison of Maximum PCs and Maximum PECs with Air Quality Standards,Daily Average ELVs/Typical Emission Concentrations
Pollutant
MetDataYear
Max PC(μg/m3)
AQS(μg/m3)
PC as %of AQS
Background(μg/m3)
Max PEC(μg/m3)
PEC as %of AQS
NO2(annual)
2011 2.08
40
5.20
20.77
22.85 57.12012 2.31 5.78 23.08 57.72013 1.87 4.68 22.64 56.62014 1.84 4.61 22.61 56.52015 1.98 4.94 22.75 56.9
NO2(1 hour,99.79th
percentile)
2011 15.61
200
7.80
41.54
57.15 28.62012 14.73 7.37 56.27 28.12013 15.71 7.85 57.25 28.62014 15.68 7.84 57.22 28.62015 14.68 7.34 56.22 28.1
SO2(24 hour,99.18th
percentile)
2011 3.09
125
2.47
12.30
15.39 12.32012 3.03 2.43 15.33 12.32013 2.90 2.32 15.20 12.22014 2.77 2.21 15.07 12.12015 2.69 2.15 14.99 12.0
P2687/R002May 2016
18
Table 13 Comparison of Maximum PCs and Maximum PECs with Air Quality Standards,Daily Average ELVs (cont)
Pollutant
MetDataYear
Max PC(μg/m3)
AQS(μg/m3)
PC as %of AQS
Background(μg/m3)
Max PEC(μg/m3)
PEC as %of AQS
SO2(1 hour,99.73rd
percentile)
2011 6.97
350
1.99
12.30
19.27 5.512012 6.86 1.96 19.16 5.472013 6.82 1.95 19.12 5.462014 6.88 1.97 19.18 5.482015 6.84 1.95 19.14 5.47
SO2(15minute,99.9th
percentile)
2011 9.21
266
3.46
12.30
21.51 8.092012 12.44 4.68 24.74 9.302013 2.30 0.87 14.60 5.492014 2.52 0.95 14.82 5.572015 2.58 0.97 14.88 5.60
PM10(annual mean)
2011 0.170
18
0.42
15.54
15.71 39.32012 0.191 0.48 15.73 39.32013 0.154 0.38 15.69 39.22014 0.152 0.38 15.69 39.22015 0.162 0.40 15.70 39.3
PM10(24hour,98.08th
percentile)
2011 0.463
50
0.93
31.08
31.54 63.12012 0.518 1.04 31.60 63.22013 0.496 0.99 31.58 63.22014 0.480 0.96 31.56 63.12015 0.443 0.89 31.52 63.1
PM2.5(annual mean)
2011 0.170
25
0.68
9.57
9.74 39.02012 0.191 0.76 9.76 39.02013 0.154 0.62 9.72 38.92014 0.152 0.61 9.72 38.92015 0.162 0.65 9.73 38.9
CO(8 hour,100th
percentile)
2011 9.02
10000
0.090
0.000109
9.02 0.0902012 9.74 0.097 9.74 0.0972013 9.18 0.092 9.18 0.0922014 10.23 0.102 10.23 0.1022015 10.96 0.110 10.96 0.110
VOC (asbenzene)
(annual mean)
2011 0.170
3.25
3.41
0.199
0.37 7.392012 0.189 3.78 0.39 7.762013 0.153 3.07 0.35 7.052014 0.151 3.02 0.35 7.002015 0.162 3.24 0.36 7.22

P2687/R002May 2016
19
Table 13 Comparison of Maximum PCs and Maximum PECs with Air Quality Standards,Daily Average ELVs (cont)
Pollutant
MetDataYear
Max PC(μg/m3)
AQS(μg/m3)
PC as %of AQS
Background(μg/m3)
Max PEC(μg/m3)
PEC as %of AQS
HydrogenChloride(1-hour,100th
percentile)
2011 3.837
750
0.51
0.286
4.123 0.552012 3.621 0.48 3.907 0.522013 3.862 0.51 4.148 0.552014 3.854 0.51 4.140 0.552015 3.609 0.48 3.895 0.52
Mercury(annual mean)
2011 0.00043
0.25
0.17
0.00216
0.00259 0.0652012 0.00047 0.19 0.00263 0.0662013 0.00038 0.15 0.00254 0.0642014 0.00038 0.15 0.00254 0.0632015 0.00041 0.16 0.00257 0.064
Mercury(1-hour,100th
percentile)
2011 0.0064
7.5
0.085
0.00432
0.0107 0.142012 0.0060 0.081 0.0104 0.142013 0.0064 0.086 0.0108 0.142014 0.0064 0.086 0.0108 0.142015 0.0060 0.080 0.0103 0.14
Dioxins/Furans(annual mean)
2011 0.0000000009
No standard applies 0.0000028
0.0000028
n/a2012 0.0000000009 0.00000282013 0.0000000008 0.00000282014 0.0000000008 0.00000282015 0.0000000008 0.0000028
3.1.4. It can be seen from the data in Table 13, that, for the majority of pollutants assessed, theimpact of the proposed facility with emissions at the ELVs/typical emission concentrationsspecified in Section 2.8, Table 10 are below the respective significance criteria and, therefore,can be classed as not significant. Accordingly, these have not been considered further in theassessment.
3.1.5. The potentially significant impacts are for long-term nitrogen dioxide and VOCs (as benzene),For the short-term impacts all pollutants can be classed as not significant.
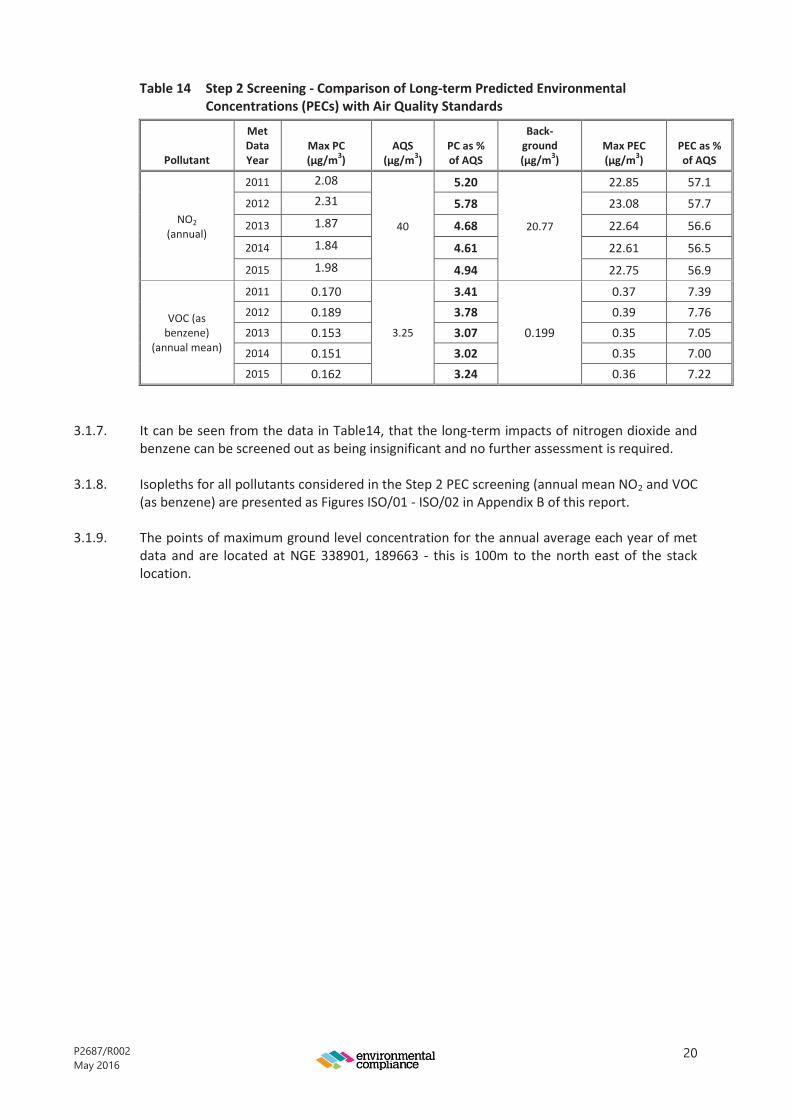
3.1.6. The next stage of the Step 2 impact significance screening process is to compare the long-term pollutant PECs (see Section 2.1.2.1. of this document) which have not be screened outas being insignificant with their respective AQSs. This comparison is presented in Table 14 (itis also shown in Table 13, however, is reproduced in Table 14 for clarity). Any PECs that areabove the significance criteria detailed above are indicated in bold type.
P2687/R002May 2016
20
Table 14 Step 2 Screening - Comparison of Long-term Predicted EnvironmentalConcentrations (PECs) with Air Quality Standards
Pollutant
MetDataYear
Max PC(μg/m3)
AQS(μg/m3)
PC as %of AQS
Back-ground(μg/m3)
Max PEC(μg/m3)
PEC as %of AQS
NO2(annual)
2011 2.08
40
5.20
20.77
22.85 57.12012 2.31 5.78 23.08 57.72013 1.87 4.68 22.64 56.62014 1.84 4.61 22.61 56.52015 1.98 4.94 22.75 56.9
VOC (asbenzene)
(annual mean)
2011 0.170
3.25
3.41
0.199
0.37 7.392012 0.189 3.78 0.39 7.762013 0.153 3.07 0.35 7.052014 0.151 3.02 0.35 7.002015 0.162 3.24 0.36 7.22
3.1.7. It can be seen from the data in Table14, that the long-term impacts of nitrogen dioxide andbenzene can be screened out as being insignificant and no further assessment is required.
3.1.8. Isopleths for all pollutants considered in the Step 2 PEC screening (annual mean NO2 and VOC(as benzene) are presented as Figures ISO/01 - ISO/02 in Appendix B of this report.
3.1.9. The points of maximum ground level concentration for the annual average each year of metdata and are located at NGE 338901, 189663 - this is 100m to the north east of the stacklocation.
P2687/R002May 2016
21
4. ASSESSMENT OF AIR QUALITY IMPACTS - SENSITIVE HUMAN RECEPTORLOCATIONS, EMISSIONS EMISSION LIMIT VALUES/TYPICAL EMISSIONCONCENTRATIONS
4.1. Human Health Impacts
4.1.1. The PCs from the proposed facility for each sensitive receptor considered, for each year ofmet data modelled are presented in Appendix B of this document.
4.1.2. Section 3 of this report demonstrates that releases from the proposed facility are consideredunlikely to result in a breach of current AQSs or have a detrimental effect on local humanhealth at the maximum point of predicted ground level receptor concentration for eachstatistic (averaging period and percentile). Consequently, the same conclusion can bereached for all sensitive receptor locations considered in this assessment.
P2687/R002May 2016
22
5. ASSESSMENT OF AIR QUALITY IMPACTS - IMPACT ON HABITAT SITES,EMISSIONS AT TYPICAL EMISSION CONCENTRATIONS
5.1. Comparison of Maximum Predicted Pollutant Ground Level Concentrations withCritical Levels for the Protection of Vegetation and Ecosystems - Oxides of Nitrogen
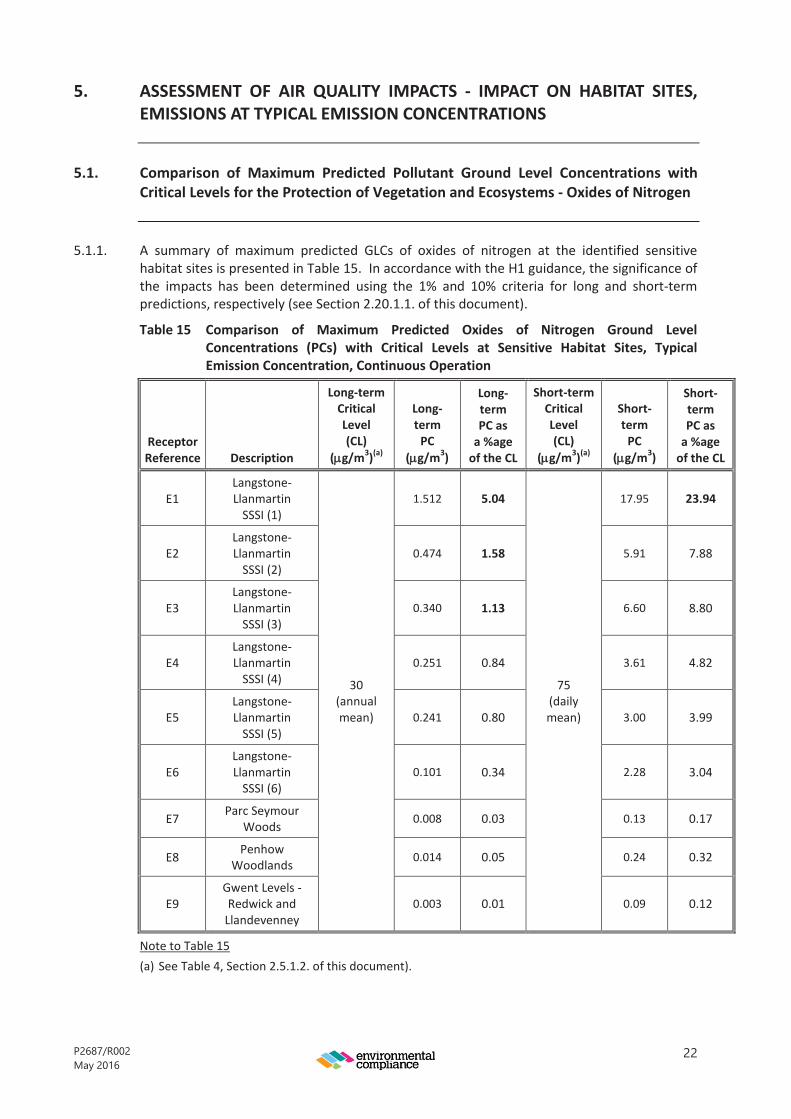
5.1.1. A summary of maximum predicted GLCs of oxides of nitrogen at the identified sensitivehabitat sites is presented in Table 15. In accordance with the H1 guidance, the significance ofthe impacts has been determined using the 1% and 10% criteria for long and short-termpredictions, respectively (see Section 2.20.1.1. of this document).
Table 15 Comparison of Maximum Predicted Oxides of Nitrogen Ground LevelConcentrations (PCs) with Critical Levels at Sensitive Habitat Sites, TypicalEmission Concentration, Continuous Operation
ReceptorReference Description
Long-termCriticalLevel(CL)
( g/m3)(a)
Long-termPC
( g/m3)
Long-termPC asa %ageof the CL
Short-termCriticalLevel(CL)
( g/m3)(a)
Short-termPC
( g/m3)
Short-termPC asa %ageof the CL
E1Langstone-LlanmartinSSSI (1)
30(annualmean)
1.512 5.04
75(dailymean)
17.95 23.94
E2Langstone-LlanmartinSSSI (2)
0.474 1.58 5.91 7.88
E3Langstone-LlanmartinSSSI (3)
0.340 1.13 6.60 8.80
E4Langstone-LlanmartinSSSI (4)
0.251 0.84 3.61 4.82
E5Langstone-LlanmartinSSSI (5)
0.241 0.80 3.00 3.99
E6Langstone-LlanmartinSSSI (6)
0.101 0.34 2.28 3.04
E7 Parc SeymourWoods 0.008 0.03 0.13 0.17
E8 PenhowWoodlands 0.014 0.05 0.24 0.32
E9Gwent Levels -Redwick andLlandevenney
0.003 0.01 0.09 0.12
Note to Table 15(a) See Table 4, Section 2.5.1.2. of this document).
P2687/R002May 2016
23
5.1.2. It can be seen from the data in Table 15, that the annual mean oxides of nitrogen PCs are lessthan 1% of the long term critical level in six of the nine ecological receptor locations, andtherefore not significant.
5.1.3. Daily mean oxides of nitrogen PCs are all less than 10% of the short term critical level at allsites, and therefore not significant at all habitat sites with the exception of receptor E1 withinthe Langstone-Llanmartin SSSI.
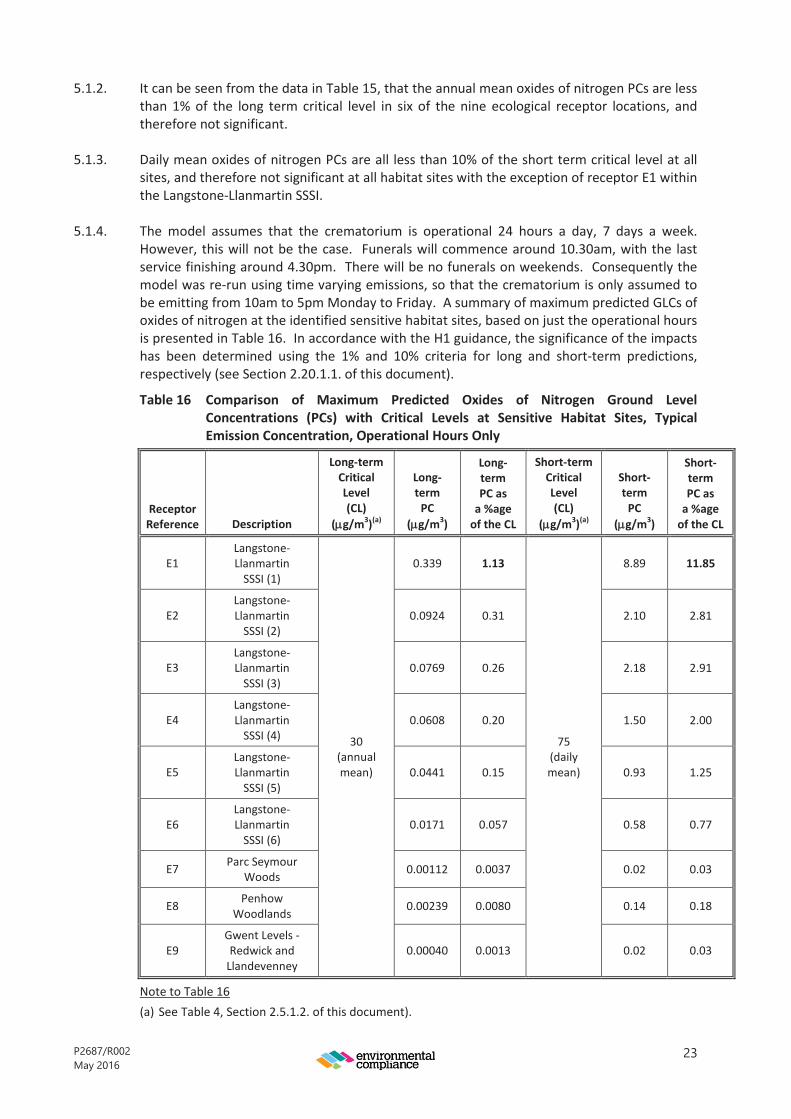
5.1.4. The model assumes that the crematorium is operational 24 hours a day, 7 days a week.However, this will not be the case. Funerals will commence around 10.30am, with the lastservice finishing around 4.30pm. There will be no funerals on weekends. Consequently themodel was re-run using time varying emissions, so that the crematorium is only assumed tobe emitting from 10am to 5pm Monday to Friday. A summary of maximum predicted GLCs ofoxides of nitrogen at the identified sensitive habitat sites, based on just the operational hoursis presented in Table 16. In accordance with the H1 guidance, the significance of the impactshas been determined using the 1% and 10% criteria for long and short-term predictions,respectively (see Section 2.20.1.1. of this document).
Table 16 Comparison of Maximum Predicted Oxides of Nitrogen Ground LevelConcentrations (PCs) with Critical Levels at Sensitive Habitat Sites, TypicalEmission Concentration, Operational Hours Only
ReceptorReference Description
Long-termCriticalLevel(CL)
( g/m3)(a)
Long-termPC
( g/m3)
Long-termPC asa %ageof the CL
Short-termCriticalLevel(CL)
( g/m3)(a)
Short-termPC
( g/m3)
Short-termPC asa %ageof the CL
E1Langstone-LlanmartinSSSI (1)
30(annualmean)
0.339 1.13
75(dailymean)
8.89 11.85
E2Langstone-LlanmartinSSSI (2)
0.0924 0.31 2.10 2.81
E3Langstone-LlanmartinSSSI (3)
0.0769 0.26 2.18 2.91
E4Langstone-LlanmartinSSSI (4)
0.0608 0.20 1.50 2.00
E5Langstone-LlanmartinSSSI (5)
0.0441 0.15 0.93 1.25
E6Langstone-LlanmartinSSSI (6)
0.0171 0.057 0.58 0.77
E7 Parc SeymourWoods 0.00112 0.0037 0.02 0.03
E8 PenhowWoodlands 0.00239 0.0080 0.14 0.18
E9Gwent Levels -Redwick andLlandevenney
0.00040 0.0013 0.02 0.03
Note to Table 16(a) See Table 4, Section 2.5.1.2. of this document).

P2687/R002May 2016
24
5.1.5. It can be seen from the data in Table 16, that, for the operational hours only scenario, theannual mean oxides of nitrogen PCs are less than 1% of the long term critical level in eight ofthe nine ecological receptor locations, and therefore not significant. The long term PC at E1 isonly just over 1% of the long term critical level and is therefore not considered to have asignificant detrimental effect on the SSSI. Even using just the operational hours, the modelstill represents a conservative assessment of the impact since the actual emissions from thecrematorium are likely to be lower that those modelled.
5.1.6. It can also be seen that, for the operational hours only scenario, daily mean oxides ofnitrogen PCs are all less than 10% of the critical level at all sites, and therefore not significantat all habitat sites with the exception of receptor E1 within the Langstone-Llanmartin SSSI.The short term PC is only just over 10% of the short term critical level and is therefore notconsidered to have a significant detrimental effect on the SSSI. As mentioned in Section5.1.5., even using just the operational hours, the model still represents a conservativeassessment of the impact since the actual emissions from the crematorium are likely to belower that those modelled.
5.2. Comparison of Maximum Predicted Pollutant Ground Level Concentrations withCritical Levels for the Protection of Vegetation and Ecosystems - Sulphur Dioxide
5.2.1. A summary of maximum predicted annual mean GLCs of sulphur dioxide at the identifiedsensitive habitat sites is presented in Table 17. In accordance with the EA’s H1 guidance, thesignificance of the impacts has been determined using the 1% criterion for long termpredictions (see Section 2.20.1.1. of this document).
Table 17 Comparison of Maximum Predicted Sulphur Dioxide Ground LevelConcentrations (PCs) with Critical Levels at Sensitive Habitat Sites, TypicalEmission Concentration, Continuous Operation
ReceptorReference Description
Long-termCritical Level
(CL)( g/m3)(a)
Long-termPC
( g/m3)
Long-termPC as a%age
of the CL
E1 Langstone-Llanmartin SSSI (1)
20
0.281 1.40
E2 Langstone-Llanmartin SSSI (3) 0.088 0.44
E3 Langstone-Llanmartin SSSI (2) 0.062 0.31
E4 Langstone-Llanmartin SSSI (4) 0.047 0.23
E5 Langstone-Llanmartin SSSI (5) 0.045 0.22
E6 Langstone-Llanmartin SSSI (6) 0.018 0.09
E7 Parc Seymour Woods 0.001 0.01
E8 PenhowWoodlands 0.002 0.01
E9 Gwent Levels - Redwick andLlandevenney 0.0004 0.002
Note to Table 17(a) See Table 4, Section 2.5.1.2. of this document).
P2687/R002May 2016
25
5.2.2. It can be seen from the data in Table 17, that the annual mean sulphur dioxide PCs are all lessthan 1% of the critical level, and therefore not significant, at all of the habitat sites consideredwith the exception of location E1 within the Langstone-Llanmartin SSSI.
5.2.3. As described in Section 5.1.4., the model assumes that the crematorium is operational 24hours a day, 7 days a week. However, this will not be the case. Funerals will commencearound 10.30am, with the last service finishing around 4.30pm. There will be no funerals onweekends. Consequently the model was re-run using time varying emissions, so that thecrematorium is only assumed to be emitting from 10am to 5pmMonday to Friday.
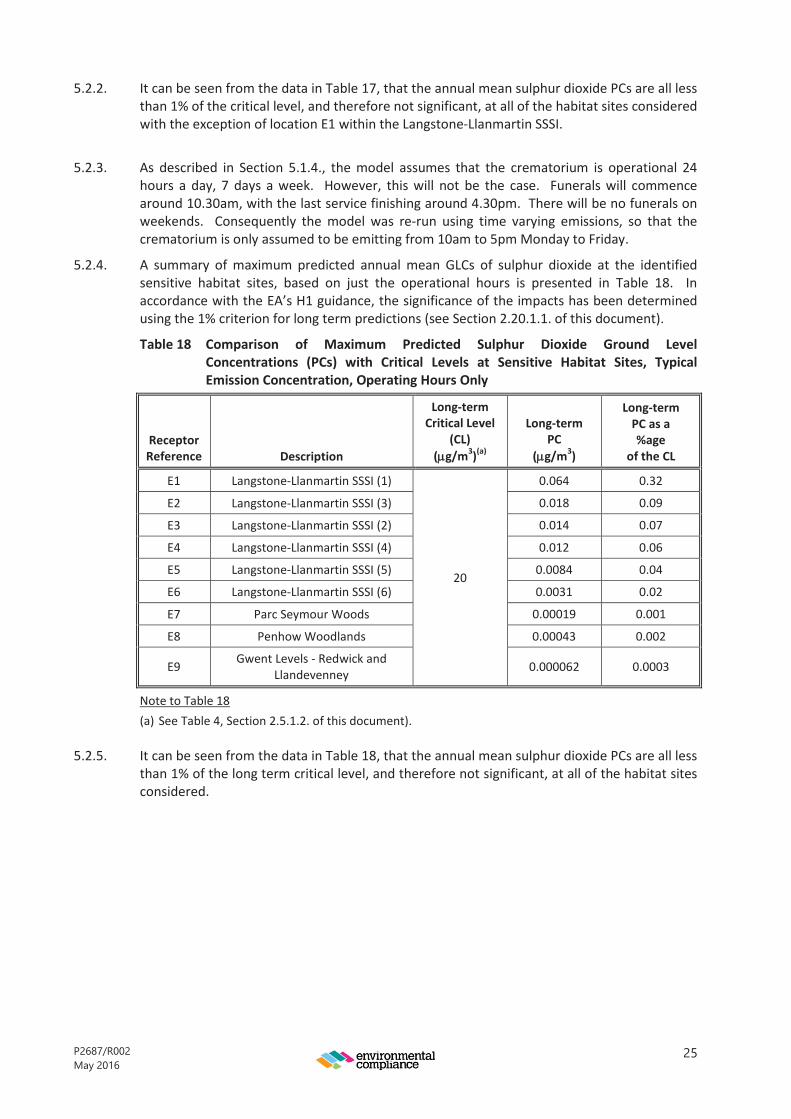
5.2.4. A summary of maximum predicted annual mean GLCs of sulphur dioxide at the identifiedsensitive habitat sites, based on just the operational hours is presented in Table 18. Inaccordance with the EA’s H1 guidance, the significance of the impacts has been determinedusing the 1% criterion for long term predictions (see Section 2.20.1.1. of this document).
Table 18 Comparison of Maximum Predicted Sulphur Dioxide Ground LevelConcentrations (PCs) with Critical Levels at Sensitive Habitat Sites, TypicalEmission Concentration, Operating Hours Only
ReceptorReference Description
Long-termCritical Level
(CL)( g/m3)(a)
Long-termPC
( g/m3)
Long-termPC as a%age
of the CL
E1 Langstone-Llanmartin SSSI (1)
20
0.064 0.32
E2 Langstone-Llanmartin SSSI (3) 0.018 0.09
E3 Langstone-Llanmartin SSSI (2) 0.014 0.07
E4 Langstone-Llanmartin SSSI (4) 0.012 0.06
E5 Langstone-Llanmartin SSSI (5) 0.0084 0.04
E6 Langstone-Llanmartin SSSI (6) 0.0031 0.02
E7 Parc Seymour Woods 0.00019 0.001
E8 PenhowWoodlands 0.00043 0.002
E9 Gwent Levels - Redwick andLlandevenney 0.000062 0.0003
Note to Table 18(a) See Table 4, Section 2.5.1.2. of this document).
5.2.5. It can be seen from the data in Table 18, that the annual mean sulphur dioxide PCs are all lessthan 1% of the long term critical level, and therefore not significant, at all of the habitat sitesconsidered.
P2687/R002May 2016
26
6. ASSESSMENT OF AIR QUALITY IMPACTS - IMPACT ON HABITAT SITES -DEPOSITION, EMISSIONS AT EMISSION LIMIT VALUES/TYPICALEMISSION CONCENTRATIONS
6.1. Comparison of Maximum Predicted Nutrient Nitrogen Deposition Rates with CriticalLoads
6.1.1. A summary of maximum predicted nutrient nitrogen deposition rates at the specified pointswithin the Langstone-Llanmartin SSSI are presented in Table 19.
6.1.2. Where the nitrogen deposition rate is significant - i.e. greater than 1% of the maximumcritical load (see Section 2.20.1.1. of this document) - it is highlighted in bold.

P2687/R002
May2016
27
Table19
Compa
rison
ofMaxim
umPred
ictedNutrie
ntNitrog
enDe
posit
ionRa
tesw
ithCriticalLoa
ds,T
ypicalEm
issionCo
ncen
tration,
Continuo
usOpe
ratio
n
Habitat
Reference
Descrip
tion
HabitatT
ype
Depo
sition
Rate
Used
Grid
Reference
CriticalLoa
d(kgN
/Ha/yr)(a
)
Nutrie
ntNitrog
enDe
posit
ion
Rate
(kgN
/Ha/yr)
Percen
tage
ofCriticalLoa
d(%
)
XY
Lower
Uppe
rLower
Uppe
r
E1Lang
ston
e-Lla
nmartin
SSSI(1)
MarshyGr
assla
ndGr
assla
nd
3387
3518
9599
1525
0.21
781.45
0.87
E2Lang
ston
e-Lla
nmartin
SSSI(3)
3386
2018
9547
0.06
830.46
0.27
E3Lang
ston
e-Lla
nmartin
SSSI(2)
3385
7818
9702
0.04
890.33
0.20
E4Lang
ston
e-Lla
nmartin
SSSI(4)
3387
0518
9453
0.03
610.24
0.14
E5Lang
ston
e-Lla
nmartin
SSSI(5)
3385
0818
9480
0.03
470.23
0.14
E6Lang
ston
e-Lla
nmartin
SSSI(6)
3382
0318
9748
0.01
450.10
0.06
Note
toTable19
(a)SeeTable5,
Section2.5.2.9.
ofthisdo
cumen
t.
P2687/R002May 2016
28
6.1.3. It can be seen from the data in Table 19, that the maximum nutrient nitrogen depositionrates due to process emissions less than 1% of both the upper and lower critical loads andare, therefore, not significant at all but the E1 location within the SSSI.
6.1.4. As described in Section 5.1.4., the model assumes that the crematorium is operational 24hours a day, 7 days a week. However, this will not be the case. Funerals will commencearound 10.30am, with the last service finishing around 4.30pm. There will be no funerals onweekends. Consequently the model was re-run using time varying emissions, so that thecrematorium is only assumed to be emitting from 10am to 5pmMonday to Friday.
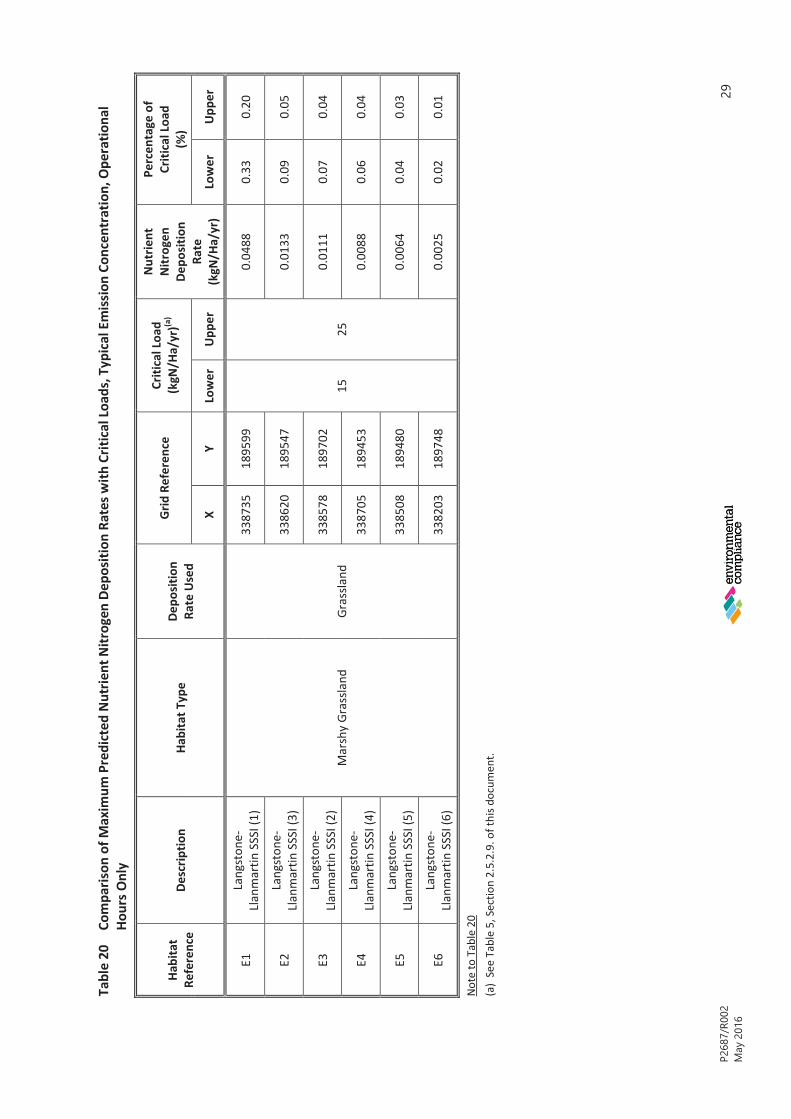
6.1.5. A summary of maximum predicted nutrient nitrogen deposition rates at the specified pointswithin the Langstone-Llanmartin SSSI, based on just the operational hours are presented inTable 20.
P2687/R002
May2016
29
Table20
Compa
rison
ofMaxim
umPred
ictedNutrie
ntNitrog
enDe
posit
ionRa
tesw
ithCriticalLoa
ds,T
ypicalEm
issionCo
ncen
tration,
Ope
ratio
nal
HoursO
nly
Habitat
Reference
Descrip
tion
HabitatT
ype
Depo
sition
Rate
Used
Grid
Reference
CriticalLoa
d(kgN
/Ha/yr)(a
)
Nutrie
ntNitrog
enDe
posit
ion
Rate
(kgN
/Ha/yr)
Percen
tage
ofCriticalLoa
d(%
)
XY
Lower
Uppe
rLower
Uppe
r
E1Lang
ston
e-Lla
nmartin
SSSI(1)
MarshyGr
assla
ndGr
assla
nd
3387
3518
9599
1525
0.04
880.33
0.20
E2Lang
ston
e-Lla
nmartin
SSSI(3)
3386
2018
9547
0.01
330.09
0.05
E3Lang
ston
e-Lla
nmartin
SSSI(2)
3385
7818
9702
0.01
110.07
0.04
E4Lang
ston
e-Lla
nmartin
SSSI(4)
3387
0518
9453
0.00
880.06
0.04
E5Lang
ston
e-Lla
nmartin
SSSI(5)
3385
0818
9480
0.00
640.04
0.03
E6Lang
ston
e-Lla
nmartin
SSSI(6)
3382
0318
9748
0.00
250.02
0.01
Note
toTable20
(a)SeeTable5,
Section2.5.2.9.
ofthisdo
cumen
t.
P2687/R002May 2016
30
6.1.6. It can be seen from the data in Table 20, that the maximum nutrient nitrogen depositionrates due to process emissions less than 1% of both the upper and lower critical loads andare, therefore, not significant at all receptor locations within the SSSI.
6.2. Comparison of Maximum Predicted Acid Deposition Rates with Critical Loads
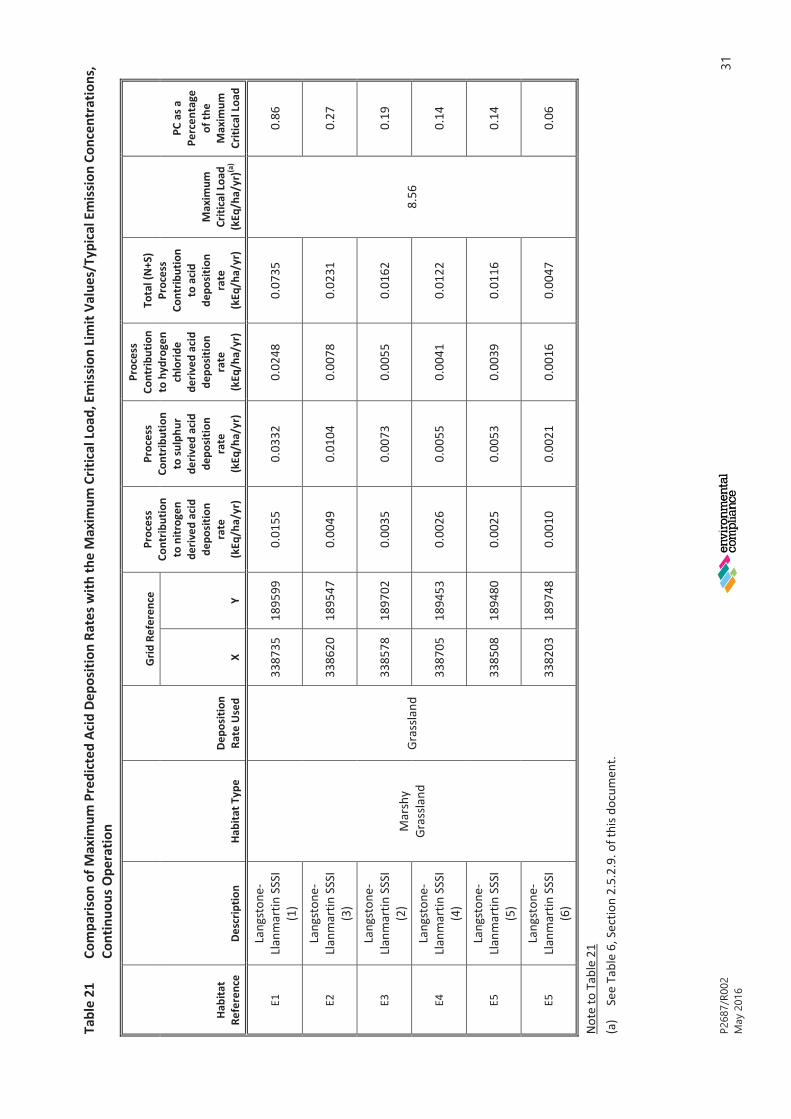
6.2.1. A summary of maximum predicted acid deposition rates at the specified points within theLangstone-Llanmartin SSSI are presented in Table 21.
P2687/R002
May2016
31
Table21
Compa
rison
ofMaxim
umPred
ictedAc
idDe
posit
ionRa
tesw
iththeMaxim
umCriticalLoa
d,Em
issionLimitVa
lues/Typ
icalEm
issionCo
ncen
trations,
Continuo
usOpe
ratio
n
Habitat
Reference
Descrip
tion
HabitatT
ype
Depo
sition
Rate
Used
Grid
Reference
Process
Contrib
ution
tonitrog
ende
rived
acid
depo
sition
rate
(kEq
/ha/yr)
Process
Contrib
ution
tosulphu
rde
rived
acid
depo
sition
rate
(kEq
/ha/yr)
Process
Contrib
ution
tohy
drog
enchlorid
ede
rived
acid
depo
sition
rate
(kEq
/ha/yr)
Total(N+
S)Process
Contrib
ution
toacid
depo
sition
rate
(kEq
/ha/yr)
Maxim
umCriticalLoa
d(kEq
/ha/yr)(a
)
PCas
aPe
rcen
tage
ofthe
Maxim
umCriticalLoa
dX
Y
E1Lang
ston
e-Lla
nmartin
SSSI
(1)
Marshy
Grassla
ndGrassla
nd
3387
3518
9599
0.01
550.03
320.02
480.07
35
8.56
0.86
E2Lang
ston
e-Lla
nmartin
SSSI
(3)
3386
2018
9547
0.00
490.01
040.00
780.02
310.27
E3Lang
ston
e-Lla
nmartin
SSSI
(2)
3385
7818
9702
0.00
350.00
730.00
550.01
620.19
E4Lang
ston
e-Lla
nmartin
SSSI
(4)
3387
0518
9453
0.00
260.00
550.00
410.01
220.14
E5Lang
ston
e-Lla
nmartin
SSSI
(5)
3385
0818
9480
0.00
250.00
530.00
390.01
160.14
E5Lang
ston
e-Lla
nmartin
SSSI
(6)
3382
0318
9748
0.00
100.00
210.00
160.00
470.06
Note
toTable21
(a)
SeeTable6,
Section2.5.2.9.
ofthisdo
cumen
t.
P2687/R002May 2016
32
6.2.2. It can be seen from the data in Table 21, that, the maximum predicted acid deposition rate asa result of emissions from the proposed facility is less than 1% of the critical load at alllocations within the SSSI and, therefore, insignificant.

P2687/R002May 2016
33
7. CONCLUSIONS
7.1. An assessment has been carried out to determine the impacts associated with the emissionsfrom the proposed crematorium at Magor Road, Llanmartin in relation to local air quality,human health and the environment.
7.2. Detailed air quality modelling using the ADMS dispersion model has been undertaken topredict the impacts associated with stack emissions from the crematorium. As a worst-case,emissions from the crematorium stack have been assumed to be at the ELV/typical emissionconcentrations (as appropriate). This represents a conservative assessment of the impactsince the actual emissions from the site are likely to be significantly lower.
7.3. Predicted maximum GLCs (“PCs”) are within the short and long term air quality objectives andare assessed as not significant (less than 1% of the AQS/EAL) for most pollutants assessed,and for those are potentially significant, further screening has demonstrated that it is unlikelythat any AQSs will be exceeded as a result of emissions from the proposed facility at anylocation.
7.4. For the sensitive habitat sites, it has again been demonstrated that the impact from theproposed facility is unlikely to result in a breach of the relevant Critical Loads or Critical Levelsor have a detrimental effect on local habitat sites.
7.5. In summary, therefore, it can be concluded that the impact on air quality for the proposedcrematorium will not have a significant impact on local air quality, human health or sensitivehabitat sites.

P2687/R002May 2016
APPENDIX A
Drawings/Figures:Site Location Plan
Sensitive Receptor Map
Windroses

UnitG1
,MainAv
enue
,TreforestIndu
stria
lEstate
Pontyprid
dCF
375Y
LT(014
43)8
4176
0F(014
43)8
4176
1Einfo@en
virocompli.com
Wwww.enviro
compli.com
JobRe
ferenceNo
:P2
687
Client:
TheWesterle
ighGr
oup
ProjectT
itle
AirQ
ualityAs
sessmen
tofE
miss
ions
from
the
Prop
osed
Crem
atorium,M
agor
Road
,Llanm
artin
Figu
reTitle
Site
Locatio
nPlan
Figu
reRe
ference
WG/
F1
Scale
NTS
Date
May
2016

2013
0 0
3 1.5
6 3.1
10 5.1
16 8.2
(knots)
(m/s)Windspeed
0°10°
20°
30°
40°
50°
60° 70° 80°
90°
100°
110°
120°
130°
140°
150°
160°
170°
180°
190°
200°
210°
220°
230°
240°
250°
260°
270°
280°290°300°
310°
320°
330°
340°
350°
200
400
600
800
2015
0 0
3 1.5
6 3.1
10 5.1
16 8.2
(knots)
(m/s)Windspeed
0°10°
20°
30°
40°
50°
60° 70° 80°
90°
100°
110°
120°
130°
140°
150°
160°
170°
180°
190°
200°
210°
220°
230°
240°
250°
260°
270°
280°290°300°
310°
320°
330°
340°
350°
200
400
600
800
1000
2014
0 0
3 1.5
6 3.1
10 5.1
16 8.2
(knots)
(m/s)Windspeed
0°10°
20°
30°
40°
50°
60° 70° 80°
90°
100°
110°
120°
130°
140°
150°
160°
170°
180°
190°
200°
210°
220°
230°
240°
250°
260°
270°
280°290°300°
310°
320°
330°
340°
350°
200
400
600
800
UnitG1
,MainAv
enue
,TreforestIndu
stria
lEstate
Pontyprid
dCF
375Y
LT(014
43)8
4176
0F(014
43)8
4176
1Einfo@en
virocompli.com
Wwww.enviro
compli.com
JobRe
ferenceNo
:P2
687
Client:
TheWesterle
ighGr
oup
ProjectT
itle
AirQ
ualityAs
sessmen
tofE
miss
ions
from
the
Prop
osed
Crem
atorium,M
agor
Road
,Llanm
artin
Figu
reTitle
Windroses
Figu
reRe
ference
WG/
F3
Scale
NTS
Date
May
2016
2012
0 0
3 1.5
6 3.1
10 5.1
16 8.2
(knots)
(m/s)Windspeed
0°10°
20°
30°
40°
50°
60° 70° 80°
90°
100°
110°
120°
130°
140°
150°
160°
170°
180°
190°
200°
210°
220°
230°
240°
250°
260°
270°
280°290°300°
310°
320°
330°
340°
350°
200
400
600
800
1000
2011
0 0
3 1.5
6 3.1
10 5.1
16 8.2
(knots)
(m/s)Windspeed
0°10°
20°
30°
40°
50°
60° 70° 80°
90°
100°
110°
120°
130°
140°
150°
160°
170°
180°
190°
200°
210°
220°
230°
240°
250°
260°
270°
280°290°300°
310°
320°
330°
340°
350°
300
600
900
1200

P2687/R002May 2016
APPENDIX B
Isopleths
UnitG1
,MainAv
enue
,TreforestIndu
stria
lEstate
Pontyprid
dCF
375Y
LT(014
43)8
4176
0F(014
43)8
4176
1Einfo@en
virocompli.com
Wwww.env
irocompli.com
JobRe
ferenceNo
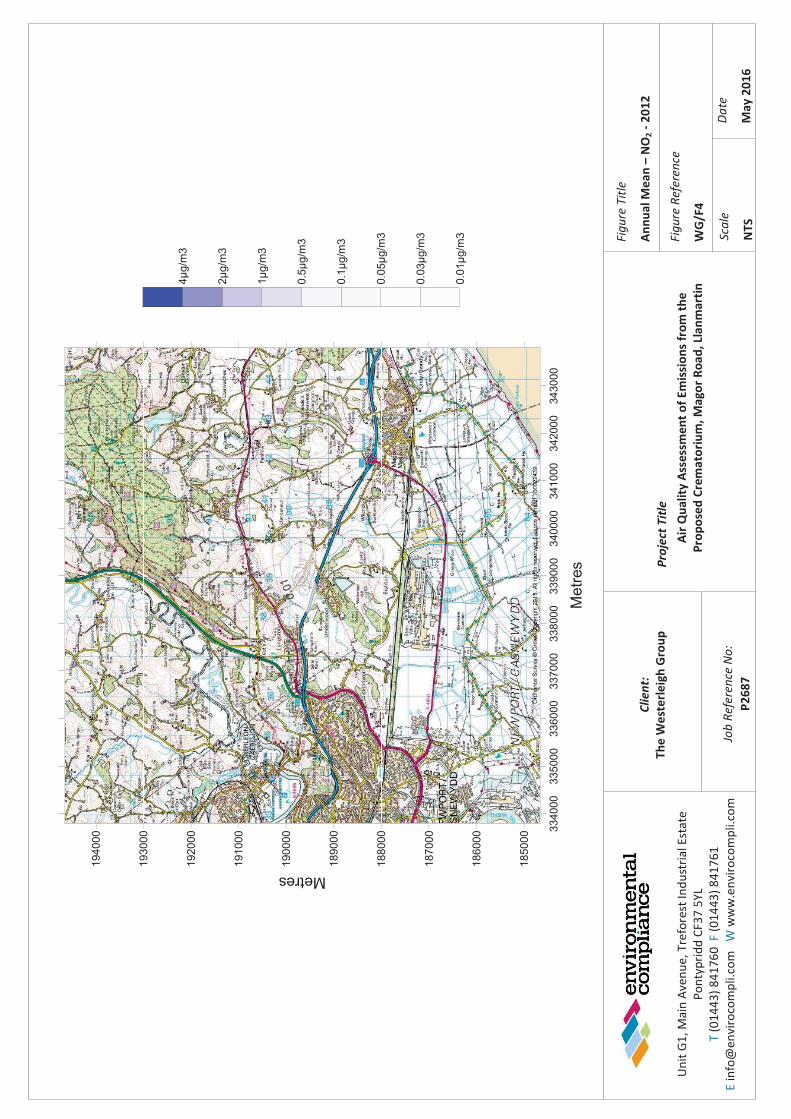
:P2
687
Client:
TheWesterle
ighGr
oup
ProjectT
itle
AirQ
ualityAs
sessmen
tofE
miss
ions
from
the
Prop
osed
Crem
atorium,M
agor
Road
,Llanm
artin
Figu
reTitle
Annu
alMea
n–NO
2-2
012
Figu
reRe
ference
WG/
F4
Scale
NTS
Date
May
2016
334000
335000
336000
337000
338000
339000
340000
341000
342000
343000
Metres
185000
186000
187000
188000
189000
190000
191000
192000
193000
194000
Metres
0.01μg/m3
0.03μg/m3
0.05μg/m3
0.1μg/m3
0.5μg/m3
1μg/m3
2μg/m3
4μg/m3

UnitG1
,MainAv
enue
,TreforestIndu
stria
lEstate
Pontyprid
dCF
375Y
LT(014
43)8
4176
0F(014
43)8
4176
1Einfo@en
virocompli.com
Wwww.env
irocompli.com
JobRe
ferenceNo
:P2
687
Client:
TheWesterle
ighGr
oup
ProjectT
itle
AirQ
ualityAs
sessmen
tofE
miss
ions
from
the
Prop
osed
Crem
atorium,M
agor
Road
,Llanm
artin
Figu
reTitle
Annu
alMea
n–VO
C-2
012
Figu
reRe
ference
WG/
F5
Scale
NTS
Date
May
2016
334000
335000
336000
337000
338000
339000
340000
341000
342000
343000
Metres
185000
186000
187000
188000
189000
190000
191000
192000
193000
194000
Metres
0.01μg/m3
0.02μg/m3
0.03μg/m3
0.04μg/m3
0.05μg/m3
0.1μg/m3
0.5μg/m3
1μg/m3
4μg/m3
P2687/R002May 2016
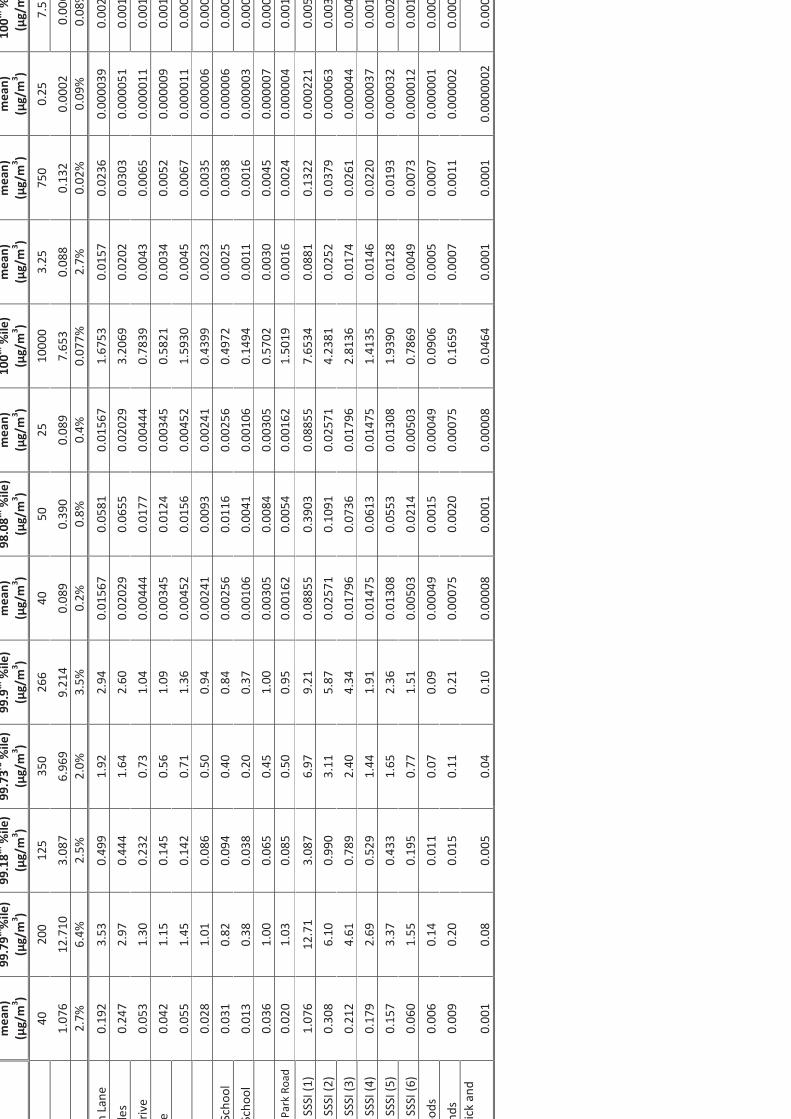
APPENDIX C
Sentive Receptor Locations Process Contributions
mea
n)(μg/m
3 )99
.79t
h %ile
)(μg/m
3 )99
.18t
h%ile
)(μg/m
3 )99
.73r
d%ile
)(μg/m
3 )99
.9th%ile
)(μg/m
3 )mea
n)(μg/m
3 )98
.08t
h%ile
)(μg/m
3 )mea
n)(μg/m
3 )10
0th%ile
)(μg/m
3 )mea
n)(μg/m
3 )mea
n)(μg/m
3 )mea
n)(μg/m
3 )10
0th%
(μg/m
4020
012
535
026
640
5025
1000
03.25
750
0.25
7.5
1.07
612
.710
3.08
76.96
99.21
40.08
90.39
00.08
97.65
30.08
80.13
20.00
020.00
62.7%
6.4%
2.5%
2.0%
3.5%
0.2%
0.8%
0.4%
0.07
7%2.7%
0.02
%0.09
%0.08
%
mLane
0.19
23.53
0.49
91.92
2.94
0.01
567
0.05
810.01
567
1.67
530.01
570.02
360.00
0039
0.00
2les
0.24
72.97
0.44
41.64
2.60
0.02
029
0.06
550.02
029
3.20
690.02
020.03
030.00
0051
0.00
1riv
e0.05
31.30
0.23
20.73
1.04
0.00
444
0.01
770.00
444
0.78
390.00
430.00
650.00
0011
0.00
1e
0.04
21.15
0.14
50.56
1.09
0.00
345
0.01
240.00
345
0.58
210.00
340.00
520.00
0009
0.00
10.05
51.45
0.14
20.71
1.36
0.00
452
0.01
560.00
452
1.59
300.00
450.00
670.00
0011
0.00
00.02
81.01
0.08
60.50
0.94
0.00
241
0.00
930.00
241
0.43
990.00
230.00
350.00
0006
0.00
0Scho
ol0.03
10.82
0.09
40.40
0.84
0.00
256
0.01
160.00
256
0.49
720.00
250.00
380.00
0006
0.00
0Scho
ol0.01
30.38
0.03
80.20
0.37
0.00
106
0.00
410.00
106
0.14
940.00
110.00
160.00
0003
0.00
00.03
61.00
0.06
50.45
1.00
0.00
305
0.00
840.00
305
0.57
020.00
300.00
450.00
0007
0.00
0Pa
rkRo
ad0.02
01.03
0.08
50.50
0.95
0.00
162
0.00
540.00
162
1.50
190.00
160.00
240.00
0004
0.00
1
SSSI(1)
1.07
612
.71
3.08
76.97
9.21
0.08
855
0.39
030.08
855
7.65
340.08
810.13
220.00
0221
0.00
5SSSI(2)
0.30
86.10
0.99
03.11
5.87
0.02
571
0.10
910.02
571
4.23
810.02
520.03
790.00
0063
0.00
3SSSI(3)
0.21
24.61
0.78
92.40
4.34
0.01
796
0.07
360.01
796
2.81
360.01
740.02
610.00
0044
0.00
4SSSI(4)
0.17
92.69
0.52
91.44
1.91
0.01
475
0.06
130.01
475
1.41
350.01
460.02
200.00
0037
0.00
1SSSI(5)
0.15
73.37
0.43
31.65
2.36
0.01
308
0.05
530.01
308
1.93
900.01
280.01
930.00
0032
0.00
2SSSI(6)
0.06
01.55
0.19
50.77
1.51
0.00
503
0.02
140.00
503
0.78
690.00
490.00
730.00
0012
0.00
1oo
ds0.00
60.14
0.01
10.07
0.09
0.00
049
0.00
150.00
049
0.09
060.00
050.00
070.00
0001
0.00
0nd
s0.00
90.20
0.01
50.11
0.21
0.00
075
0.00
200.00
075
0.16
590.00
070.00
110.00
0002
0.00
0ick
and
0.00
10.08
0.00
50.04
0.10
0.00
008
0.00
010.00
008
0.04
640.00
010.00
010.00
0000
20.00
0
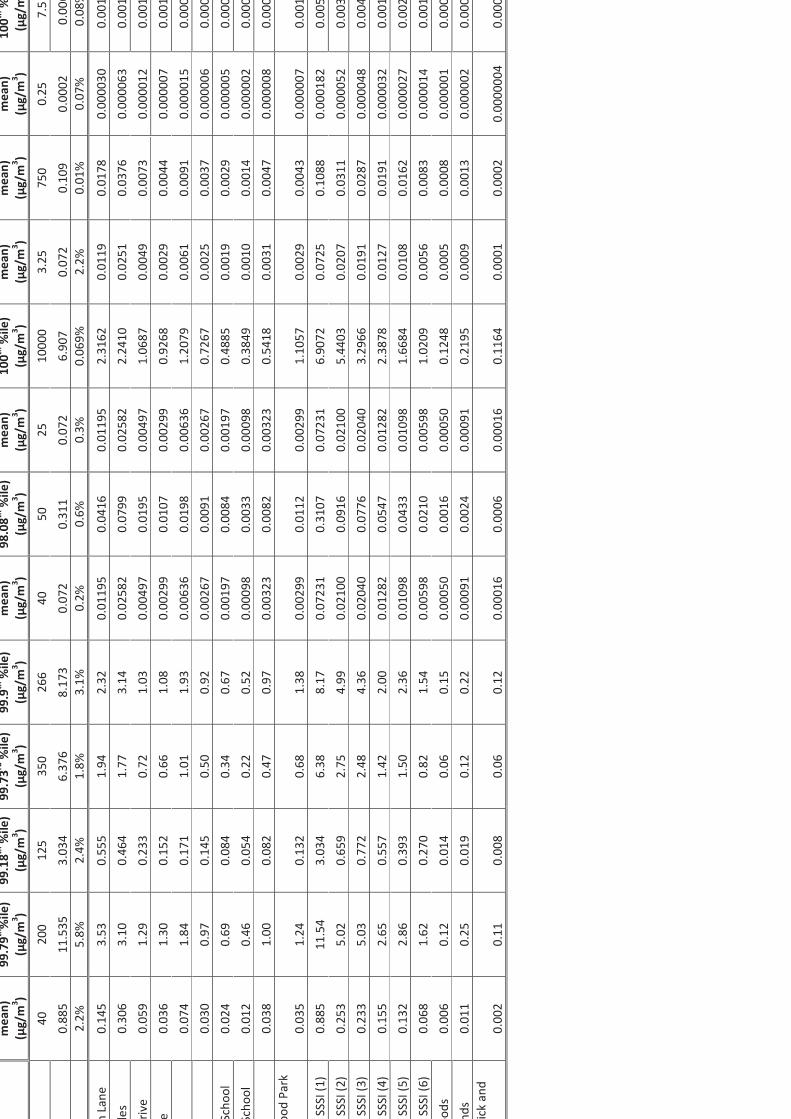
mea
n)(μg/m
3 )99
.79t
h %ile
)(μg/m
3 )99
.18t
h%ile
)(μg/m
3 )99
.73r
d%ile
)(μg/m
3 )99
.9th%ile
)(μg/m
3 )mea
n)(μg/m
3 )98
.08t
h%ile
)(μg/m
3 )mea
n)(μg/m
3 )10
0th%ile
)(μg/m
3 )mea
n)(μg/m
3 )mea
n)(μg/m
3 )mea
n)(μg/m
3 )10
0th%
(μg/m
4020
012
535
026
640
5025
1000
03.25
750
0.25
7.5
0.88
511
.535
3.03
46.37
68.17
30.07
20.31
10.07
26.90
70.07
20.10
90.00
020.00
62.2%
5.8%
2.4%
1.8%
3.1%
0.2%
0.6%
0.3%
0.06
9%2.2%
0.01
%0.07
%0.08
%
mLane
0.14
53.53
0.55
51.94
2.32
0.01
195
0.04
160.01
195
2.31
620.01
190.01
780.00
0030
0.00
1les
0.30
63.10
0.46
41.77
3.14
0.02
582
0.07
990.02
582
2.24
100.02
510.03
760.00
0063
0.00
1riv
e0.05
91.29
0.23
30.72
1.03
0.00
497
0.01
950.00
497
1.06
870.00
490.00
730.00
0012
0.00
1e
0.03
61.30
0.15
20.66
1.08
0.00
299
0.01
070.00
299
0.92
680.00
290.00
440.00
0007
0.00
10.07
41.84
0.17
11.01
1.93
0.00
636
0.01
980.00
636
1.20
790.00
610.00
910.00
0015
0.00
00.03
00.97
0.14
50.50
0.92
0.00
267
0.00
910.00
267
0.72
670.00
250.00
370.00
0006
0.00
0Scho
ol0.02
40.69
0.08
40.34
0.67
0.00
197
0.00
840.00
197
0.48
850.00
190.00
290.00
0005
0.00
0Scho
ol0.01
20.46
0.05
40.22
0.52
0.00
098
0.00
330.00
098
0.38
490.00
100.00
140.00
0002
0.00
00.03
81.00
0.08
20.47
0.97
0.00
323
0.00
820.00
323
0.54
180.00
310.00
470.00
0008
0.00
0oo
dPa
rk0.03
51.24
0.13
20.68
1.38
0.00
299
0.01
120.00
299
1.10
570.00
290.00
430.00
0007
0.00
1SSSI(1)
0.88
511
.54
3.03
46.38
8.17
0.07
231
0.31
070.07
231
6.90
720.07
250.10
880.00
0182
0.00
5SSSI(2)
0.25
35.02
0.65
92.75
4.99
0.02
100
0.09
160.02
100
5.44
030.02
070.03
110.00
0052
0.00
3SSSI(3)
0.23
35.03
0.77
22.48
4.36
0.02
040
0.07
760.02
040
3.29
660.01
910.02
870.00
0048
0.00
4SSSI(4)
0.15
52.65
0.55
71.42
2.00
0.01
282
0.05
470.01
282
2.38
780.01
270.01
910.00
0032
0.00
1SSSI(5)
0.13
22.86
0.39
31.50
2.36
0.01
098
0.04
330.01
098
1.66
840.01
080.01
620.00
0027
0.00
2SSSI(6)
0.06
81.62
0.27
00.82
1.54
0.00
598
0.02
100.00
598
1.02
090.00
560.00
830.00
0014
0.00
1oo
ds0.00
60.12
0.01
40.06
0.15
0.00
050
0.00
160.00
050
0.12
480.00
050.00
080.00
0001
0.00
0nd
s0.01
10.25
0.01
90.12
0.22
0.00
091
0.00
240.00
091
0.21
950.00
090.00
130.00
0002
0.00
0ick
and
0.00
20.11
0.00
80.06
0.12
0.00
016
0.00
060.00
016
0.11
640.00
010.00
020.00
0000
40.00
0

mea
n)(μg/m
3 )99
.79t
h %ile
)(μg/m
3 )99
.18t
h%ile
)(μg/m
3 )99
.73r
d%ile
)(μg/m
3 )99
.9th%ile
)(μg/m
3 )mea
n)(μg/m
3 )98
.08t
h%ile
)(μg/m
3 )mea
n)(μg/m
3 )10
0th%ile
)(μg/m
3 )mea
n)(μg/m
3 )mea
n)(μg/m
3 )mea
n)(μg/m
3 )10
0th%
(μg/m
4020
012
535
026
640
5025
1000
03.25
750
0.25
7.5
1.01
811
.022
2.61
86.15
57.93
40.08
80.38
30.08
87.93
00.08
30.12
50.00
020.00
62.5%
5.5%
2.1%
1.8%
3.0%
0.5%
0.8%
0.2%
0.07
9%2.6%
0.02
%0.08
%0.08
%
mLane
0.14
03.35
0.49
81.86
2.37
0.01
148
0.03
870.01
148
1.87
360.01
140.01
720.00
0029
0.00
2les
0.27
43.07
0.50
61.69
3.00
0.02
282
0.07
070.02
282
2.25
070.02
250.03
370.00
0056
0.00
1riv
e0.07
01.43
0.28
20.80
1.06
0.00
564
0.02
380.00
564
0.82
200.00
570.00
850.00
0014
0.00
1e
0.03
41.12
0.14
50.59
1.25
0.00
284
0.01
110.00
284
0.69
340.00
280.00
420.00
0007
0.00
10.07
11.93
0.17
41.04
1.86
0.00
598
0.02
090.00
598
1.21
460.00
580.00
870.00
0015
0.00
00.03
31.04
0.13
00.57
0.91
0.00
288
0.01
090.00
288
0.85
550.00
270.00
400.00
0007
0.00
0Scho
ol0.02
20.57
0.07
50.27
0.57
0.00
190
0.00
740.00
190
0.28
480.00
180.00
270.00
0004
0.00
0Scho
ol0.01
10.37
0.04
10.19
0.34
0.00
090
0.00
290.00
090
0.34
940.00
090.00
130.00
0002
0.00
00.03
41.00
0.09
10.48
0.95
0.00
294
0.00
880.00
294
0.71
840.00
280.00
420.00
0007
0.00
0oo
dPa
rk0.05
11.27
0.18
70.72
1.32
0.00
416
0.01
410.00
416
0.99
310.00
420.00
630.00
0011
0.00
1SSSI(1)
1.01
811
.02
2.61
86.15
7.93
0.08
751
0.38
330.08
751
7.92
970.08
340.12
520.00
0209
0.00
5SSSI(2)
0.34
25.01
0.79
42.71
4.46
0.02
858
0.11
930.02
858
3.24
870.02
800.04
200.00
0070
0.00
3SSSI(3)
0.23
74.07
0.73
62.28
4.08
0.01
995
0.07
360.01
995
4.54
760.01
940.02
910.00
0049
0.00
4SSSI(4)
0.15
52.69
0.47
81.41
1.96
0.01
308
0.05
570.01
308
1.67
070.01
270.01
910.00
0032
0.00
1SSSI(5)
0.17
42.64
0.41
41.43
2.32
0.01
457
0.06
040.01
457
1.46
560.01
430.02
140.00
0036
0.00
2SSSI(6)
0.07
01.37
0.22
40.75
1.39
0.00
599
0.02
200.00
599
1.35
780.00
570.00
860.00
0014
0.00
1oo
ds0.00
50.15
0.01
40.09
0.14
0.00
045
0.00
160.00
045
0.09
650.00
040.00
070.00
0001
0.00
0nd
s0.00
90.20
0.01
80.11
0.22
0.00
072
0.00
210.00
072
0.15
260.00
070.00
110.00
0002
0.00
0ick
and
0.00
30.13
0.00
70.07
0.15
0.00
022
0.00
090.00
022
0.06
550.00
020.00
030.00
0001
0.00
0

mea
n)(μg/m
3 )99
.79t
h %ile
)(μg/m
3 )99
.18t
h%ile
)(μg/m
3 )99
.73r
d%ile
)(μg/m
3 )99
.9th%ile
)(μg/m
3 )mea
n)(μg/m
3 )98
.08t
h%ile
)(μg/m
3 )mea
n)(μg/m
3 )10
0th%ile
)(μg/m
3 )mea
n)(μg/m
3 )mea
n)(μg/m
3 )mea
n)(μg/m
3 )10
0th%
(μg/m
4020
012
535
026
640
5025
1000
03.25
750
0.25
7.5
1.05
612
.392
2.76
66.80
58.82
70.08
70.36
00.08
77.10
10.08
60.13
00.00
020.00
62.6%
6.2%
2.2%
1.9%
3.3%
0.2%
0.7%
0.3%
0.07
1%2.7%
0.02
%0.09
%0.08
%
mLane
0.18
13.53
0.45
71.84
2.72
0.01
488
0.05
850.01
488
2.43
410.01
490.02
230.00
0037
0.00
2les
0.26
73.12
0.45
71.76
3.08
0.02
213
0.07
210.02
213
2.17
490.02
190.03
290.00
0055
0.00
1riv
e0.06
41.44
0.22
70.78
1.27
0.00
536
0.02
060.00
536
0.90
930.00
530.00
790.00
0013
0.00
1e
0.04
01.02
0.12
30.51
0.86
0.00
332
0.01
250.00
332
0.79
390.00
330.00
500.00
0008
0.00
10.06
81.93
0.16
81.04
1.86
0.00
565
0.01
750.00
565
1.15
810.00
560.00
830.00
0014
0.00
00.03
51.01
0.10
80.56
0.93
0.00
305
0.01
110.00
305
0.88
810.00
290.00
430.00
0007
0.00
0Scho
ol0.02
60.67
0.07
30.34
0.86
0.00
215
0.00
900.00
215
0.37
340.00
210.00
320.00
0005
0.00
0Scho
ol0.01
30.35
0.03
90.18
0.33
0.00
107
0.00
430.00
107
0.33
610.00
110.00
160.00
0003
0.00
00.03
20.83
0.07
50.46
0.77
0.00
274
0.00
860.00
274
0.57
730.00
260.00
400.00
0007
0.00
0oo
dPa
rk0.03
51.28
0.13
70.71
1.32
0.00
300
0.01
160.00
300
1.42
840.00
290.00
430.00
0007
0.00
1SSSI(1)
1.05
612
.39
2.76
66.81
8.83
0.08
727
0.35
980.08
727
7.10
130.08
650.12
980.00
0217
0.00
5SSSI(2)
0.33
95.70
0.79
13.10
4.99
0.02
840
0.11
150.02
840
4.98
140.02
780.04
170.00
0070
0.00
3SSSI(3)
0.24
64.33
0.76
72.36
3.69
0.02
054
0.07
890.02
054
2.47
880.02
020.03
030.00
0051
0.00
3SSSI(4)
0.16
32.70
0.56
11.52
2.01
0.01
349
0.06
070.01
349
1.52
180.01
340.02
010.00
0033
0.00
1SSSI(5)
0.17
33.26
0.42
71.66
2.39
0.01
438
0.05
630.01
438
1.60
790.01
410.02
120.00
0035
0.00
2SSSI(6)
0.07
61.58
0.23
90.81
1.55
0.00
653
0.02
320.00
653
1.51
300.00
620.00
940.00
0016
0.00
1oo
ds0.00
60.16
0.02
40.09
0.16
0.00
051
0.00
150.00
051
0.13
320.00
050.00
080.00
0001
0.00
0nd
s0.00
90.19
0.01
90.10
0.22
0.00
072
0.00
210.00
072
0.12
340.00
070.00
110.00
0002
0.00
0ick
and
0.00
20.11
0.01
10.05
0.12
0.00
016
0.00
040.00
016
0.07
240.00
010.00
020.00
0000
40.00
0

mea
n)(μg/m
3 )99
.79t
h %ile
)(μg/m
3 )99
.18t
h%ile
)(μg/m
3 )99
.73r
d%ile
)(μg/m
3 )99
.9th%ile
)(μg/m
3 )mea
n)(μg/m
3 )98
.08t
h%ile
)(μg/m
3 )mea
n)(μg/m
3 )10
0th%ile
)(μg/m
3 )mea
n)(μg/m
3 )mea
n)(μg/m
3 )mea
n)(μg/m
3 )10
0th%
(μg/m
4020
012
535
026
640
5025
1000
03.25
750
0.25
7.5
0.91
811
.106
2.69
36.04
39.05
80.07
60.33
20.07
67.40
30.07
50.11
30.00
020.00
62.3%
5.6%
2.2%
1.7%
3.4%
0.2%
0.66
%0.3%
0.07
4%2.3%
0.02
%0.08
%0.08
%
mLane
0.14
13.42
0.42
81.92
2.43
0.01
170
0.04
900.01
170
1.94
150.01
160.01
740.00
0029
0.00
2les
0.27
73.10
0.54
71.75
2.99
0.02
294
0.06
680.02
294
2.54
190.02
270.03
410.00
0057
0.00
1riv
e0.06
41.38
0.25
90.74
1.22
0.00
534
0.02
000.00
534
0.84
050.00
520.00
780.00
0013
0.00
1e
0.03
51.20
0.12
20.62
1.35
0.00
293
0.01
080.00
293
0.69
240.00
290.00
430.00
0007
0.00
10.06
71.81
0.16
30.97
1.85
0.00
563
0.01
740.00
563
1.50
130.00
550.00
820.00
0014
0.00
00.02
91.00
0.12
60.52
0.92
0.00
247
0.00
790.00
247
0.83
370.00
240.00
360.00
0006
0.00
0Scho
ol0.02
30.60
0.07
20.33
0.64
0.00
192
0.00
800.00
192
0.44
010.00
190.00
280.00
0005
0.00
0Scho
ol0.01
10.31
0.03
90.17
0.36
0.00
089
0.00
300.00
089
0.32
360.00
090.00
130.00
0002
0.00
00.03
10.68
0.07
10.34
0.96
0.00
259
0.00
630.00
259
0.64
360.00
250.00
380.00
0006
0.00
0oo
dPa
rk0.03
81.26
0.18
30.67
1.84
0.00
307
0.01
040.00
307
0.82
620.00
310.00
460.00
0008
0.00
1SSSI(1)
0.91
811
.11
2.69
36.04
9.06
0.07
575
0.33
190.07
575
7.06
830.07
510.11
280.00
0188
0.00
5SSSI(2)
0.29
65.14
0.86
22.87
5.76
0.02
496
0.10
240.02
496
7.40
310.02
420.03
630.00
0061
0.00
3SSSI(3)
0.19
34.48
0.61
12.22
3.68
0.01
633
0.06
160.01
633
2.19
880.01
580.02
370.00
0040
0.00
3SSSI(4)
0.16
62.69
0.52
41.48
1.86
0.01
363
0.05
640.01
363
1.36
350.01
360.02
040.00
0034
0.00
1SSSI(5)
0.15
12.70
0.47
91.50
2.26
0.01
275
0.05
000.01
275
2.14
970.01
240.01
860.00
0031
0.00
2SSSI(6)
0.05
91.65
0.18
50.82
1.43
0.00
502
0.01
970.00
502
0.99
960.00
480.00
720.00
0012
0.00
1oo
ds0.00
70.21
0.01
40.09
0.23
0.00
054
0.00
180.00
054
0.08
950.00
050.00
080.00
0001
0.00
0nd
s0.00
80.19
0.01
50.10
0.18
0.00
067
0.00
170.00
067
0.16
660.00
070.00
100.00
0002
0.00
0ick
and
0.00
20.10
0.00
80.05
0.12
0.00
013
0.00
040.00
013
0.04
920.00
010.00
020.00
0000
30.00
0