p424 chapter tenchpro/chem/chap10.pdfthe electron sea model p441 p442 the band model for magnesium...
TRANSCRIPT

Chapter Ten:
p424
Liquids and Solids

Contents p424

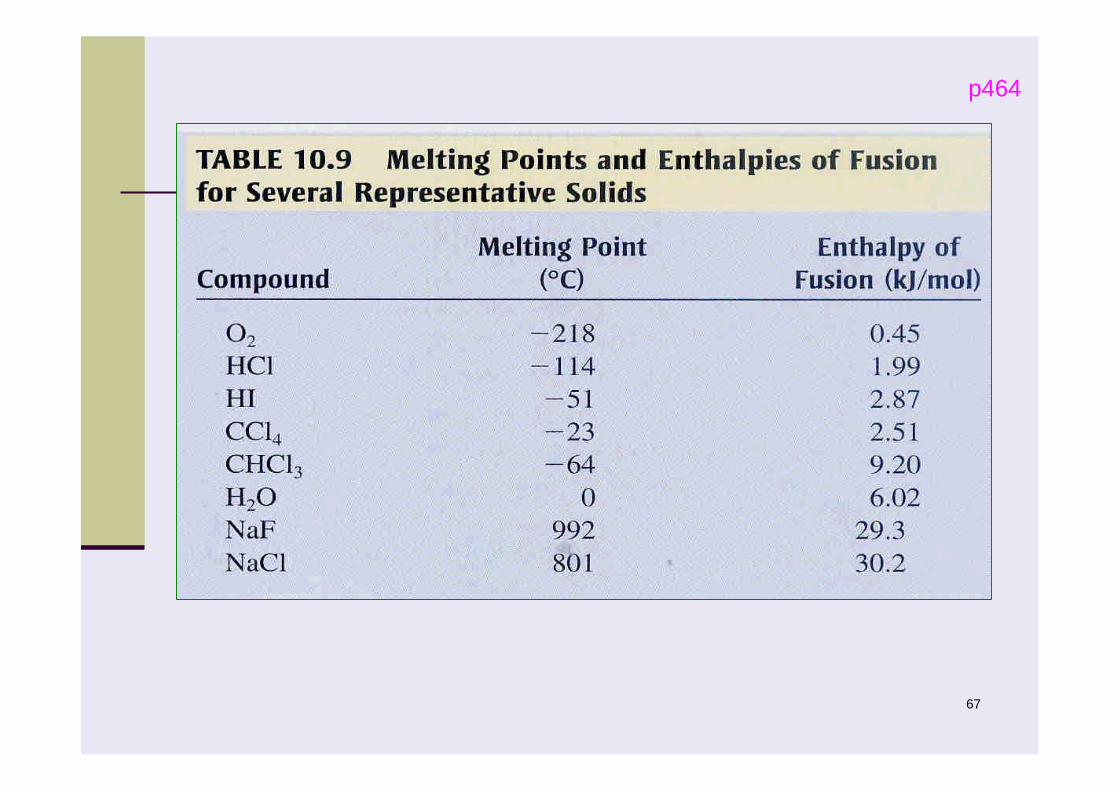
molkJHlOHsOH fus /02.6)()( 022
molkJHgOHlOH vap /7.40)()( 022
p426
4
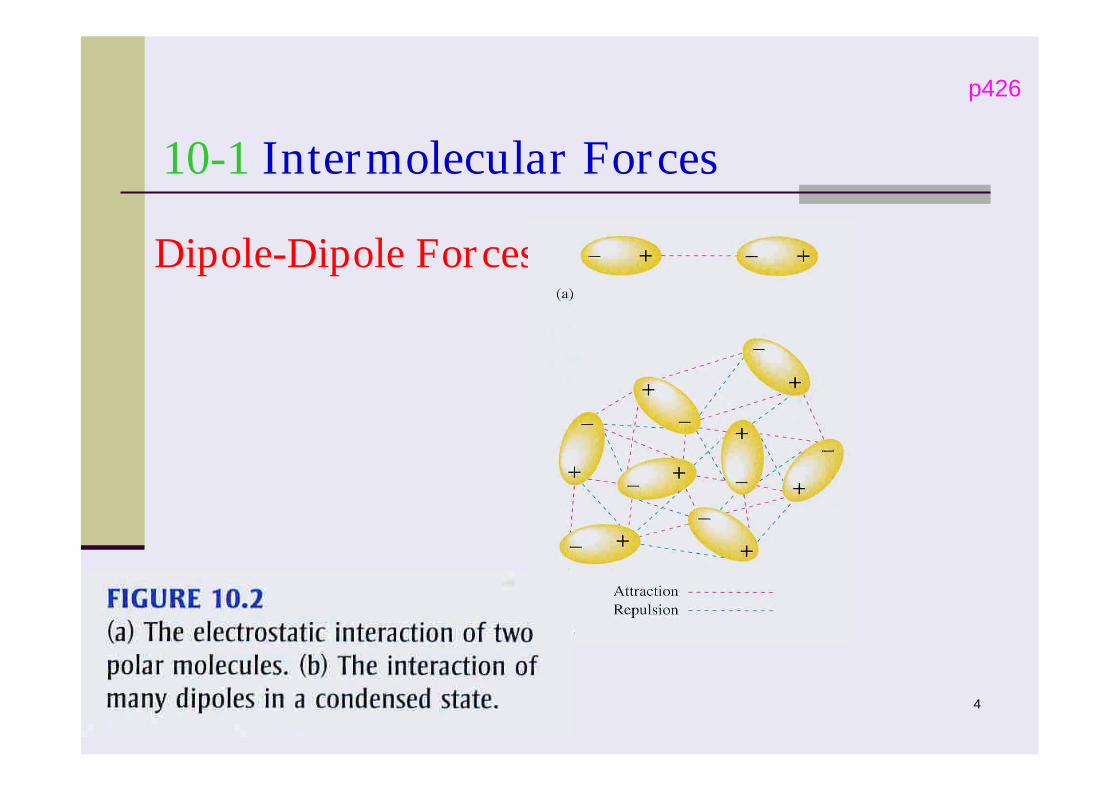
10-1 Intermolecular Forces
Dipole-Dipole Forces
p426

5
Hydrogen Bonding in Water. To distinguish betweenintramolecular bonds and intermolecular forces.
p427

6
Dipole-Dipole Forces

7
Hydrogen Bonding

Figure 10.4 The Boiling Points of the Covalent Hydrides ofthe Elements in Groups 4A, 5A, 6A, and 7A.
p427
9
London Dispersion Forcesp428

p428
11
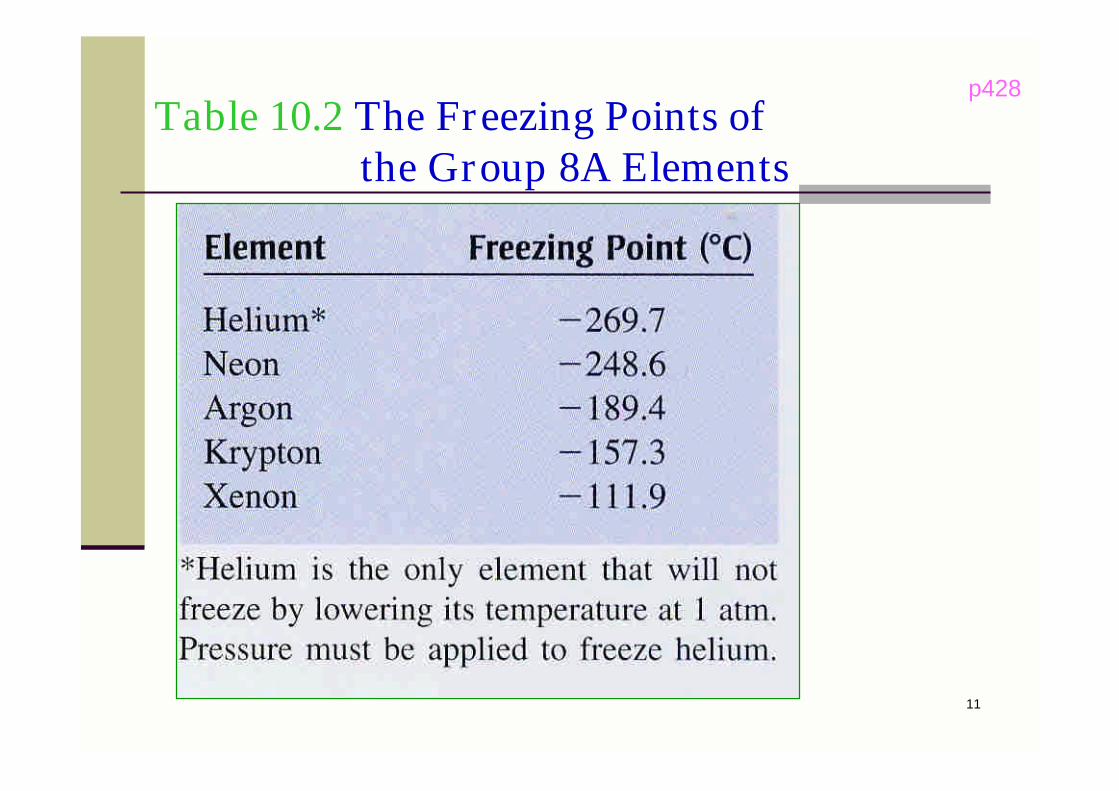
Table 10.2 The Freezing Points ofthe Group 8A Elements
p428
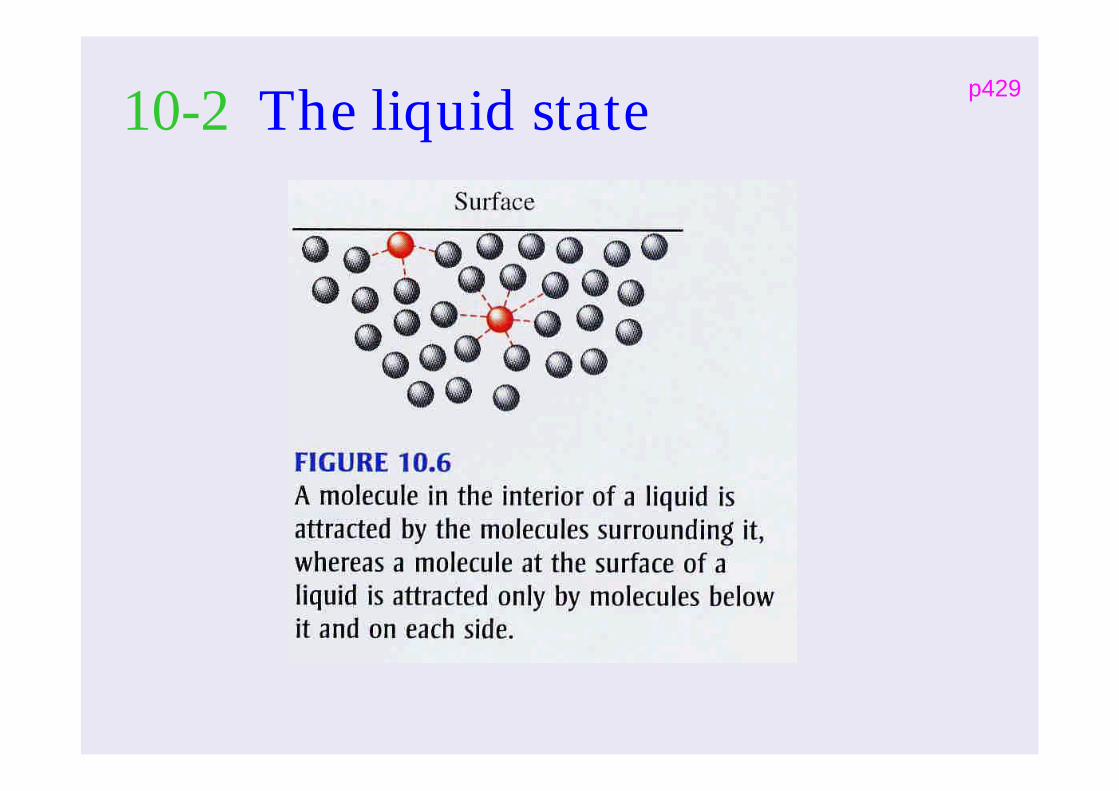
10-2 The liquid state p429

Beads of water on a waxed car finish. Thenonpolar component of the wax causes thewater to form approximately spherical droplets.
p430

As intermolecular forces increase, what
happens to each of the following? Why?
Boiling point
Viscosity
Surface tension
Enthalpy of fusion
Freezing point
Vapor pressure
Heat of vaporization
React
15
Amorphous Solids
Disorder in the structures
Glass
Crystalline Solids
Ordered Structures
Unit Cells
10-3 An Introduction to Structuresand Types of Solids
p430
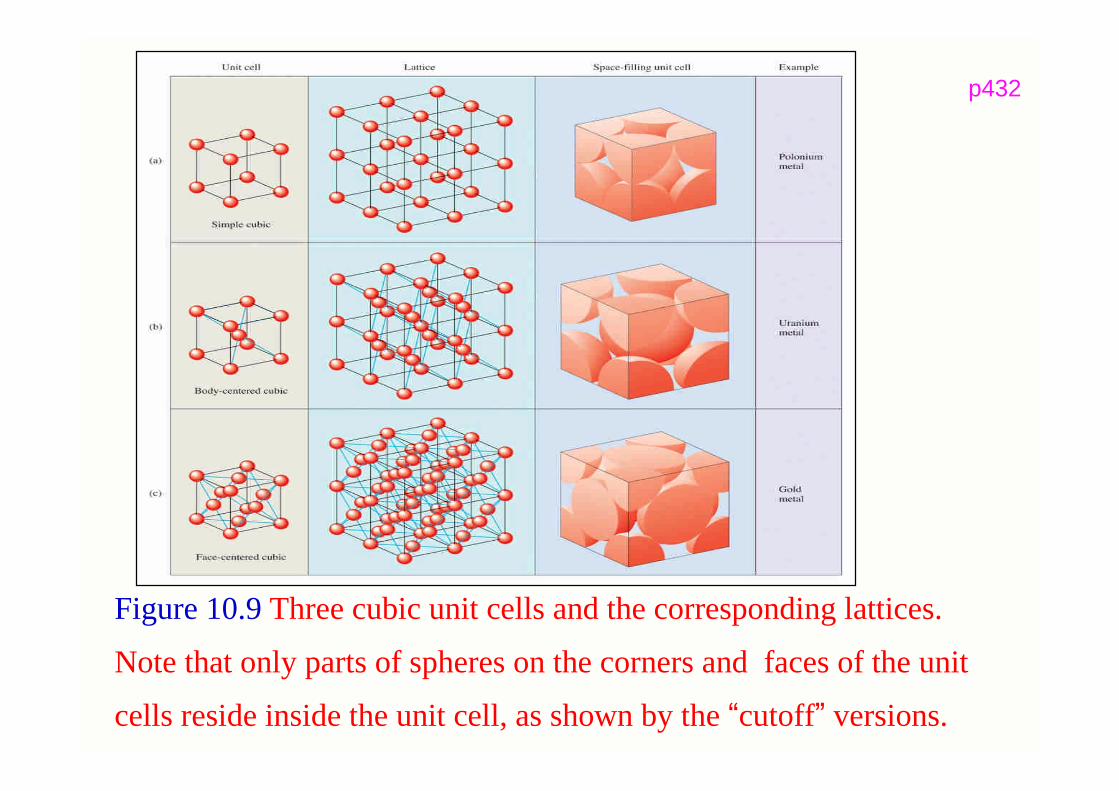
Figure 10.9 Three cubic unit cells and the corresponding lattices.
Note that only parts of spheres on the corners and faces of the unit
cells reside inside the unit cell, as shown by the “cutoff”versions.
p432

Figure 10.10 X rays scattered from two different atoms mayreinforce (constructive) or cancel (destructive interference)one another. (a) Both the incident rays and the reflected raysare also in phase. In this case, d1 is such that the differencein the distances traveled by the two rays is a whole number ofwavelengths. (b) The incident rays are in phase but thereflected rays are out of phase. In this case d2 is such that thedifference in distances traveled by the two rays is an oddnumber of half wavelengths.
p433X-Ray Analysis of Solids

18
nd sin2
P433
Ex 10.1 Using the Bragg Equation
X rays of wavelength 1.54 were used to analyze an
aluminum crystal. Assuming n = 1, calculate the
distance d between the planes of atoms producing this
reflection.Solution:
pmpmn
d 233)3305.0)(2()154)(1(
sin2
To determine the distance between the planes,

Types of Crystalline Solids
Figure 10.12 Examples of Three Types of Crystalline Solids.
(a) An atomic solid. (b) An ionic solid. (c) A molecular solid.
The dotted lines show the hydrogen bonding interactions
among the polar water molecules.
p435

Table 10.3 Classification of Solids
p436

Figure 10.13 The closest packing arrangement ofuniform spheres.
10-4 Structure and Bonding in Metals p437

Hexagonal Closest Packing
Figure 10.14 When spheres are closed packed so that the
spheres in the third layer are directly over those in the first
layer (aba), thee nit cell is the hexagonal prism illustrated
here in red.
p437

23
Cubic ClosestPacking
Figure 10.15 When spheres are packed in the abcarrangement, the unit cell is face-centered cubic.To make the cubic arrangement easier to see, thevertical axis has been tilted as shown.

24
The indicated sphere has 12 nearestneighbors
Figure 10.16
p439

Figure 16.17 The net number of spheres in a face-centered cubic unit cell.
4)21
6()81
8(
p439
The net number of spheres in a face-centered cubicunit cell is

26
P439
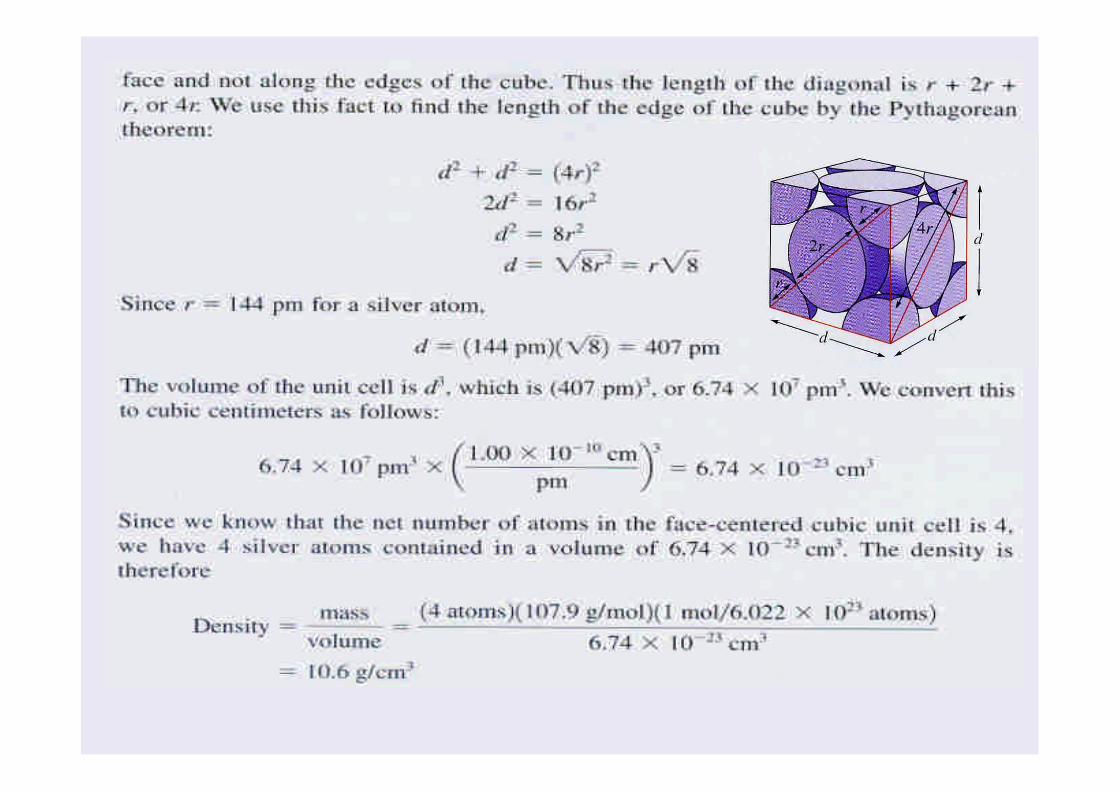
Ex 10.2 Calculating the Density of aClosest Packed Solid
Silver crystallizes in a cubic closest packed
structure. The radius of a silver atom is 144 pm.
Calculate the density of solid silver.
,
28
Bonding Models for Metals
Electron sea model
Band model (MO model)
P440
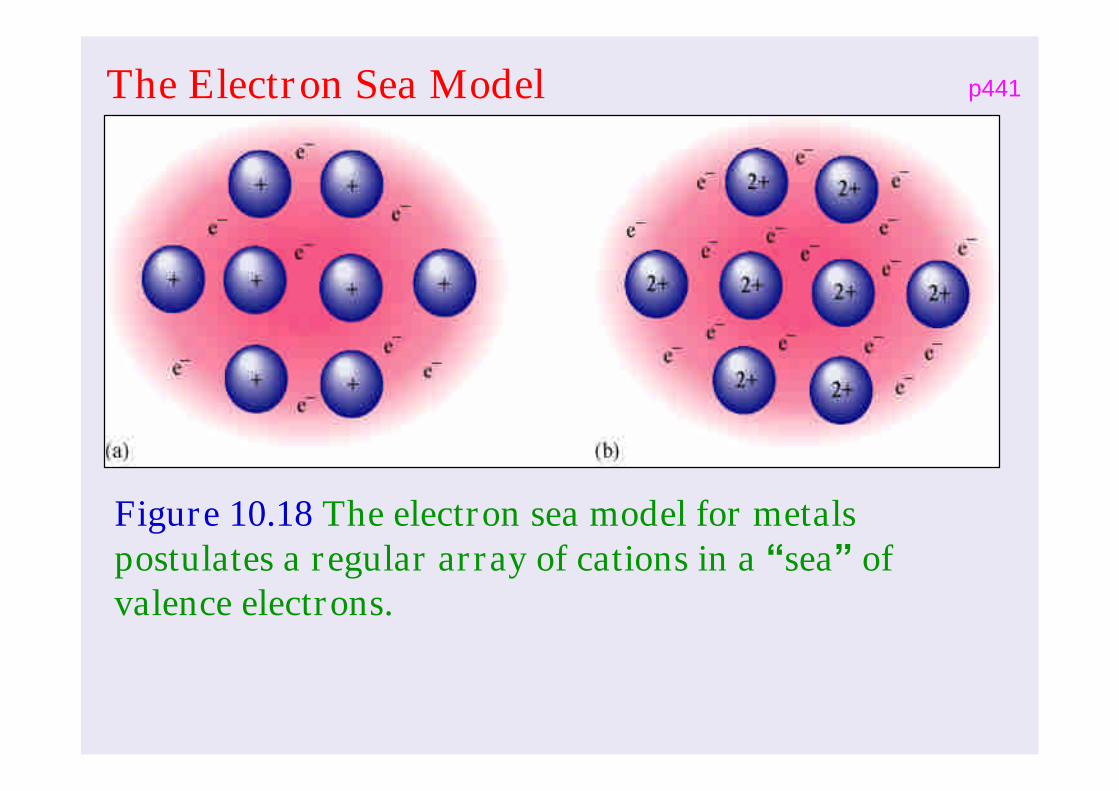
Figure 10.18 The electron sea model for metalspostulates a regular array of cations in a “sea”ofvalence electrons.
p441The Electron Sea Model
P442

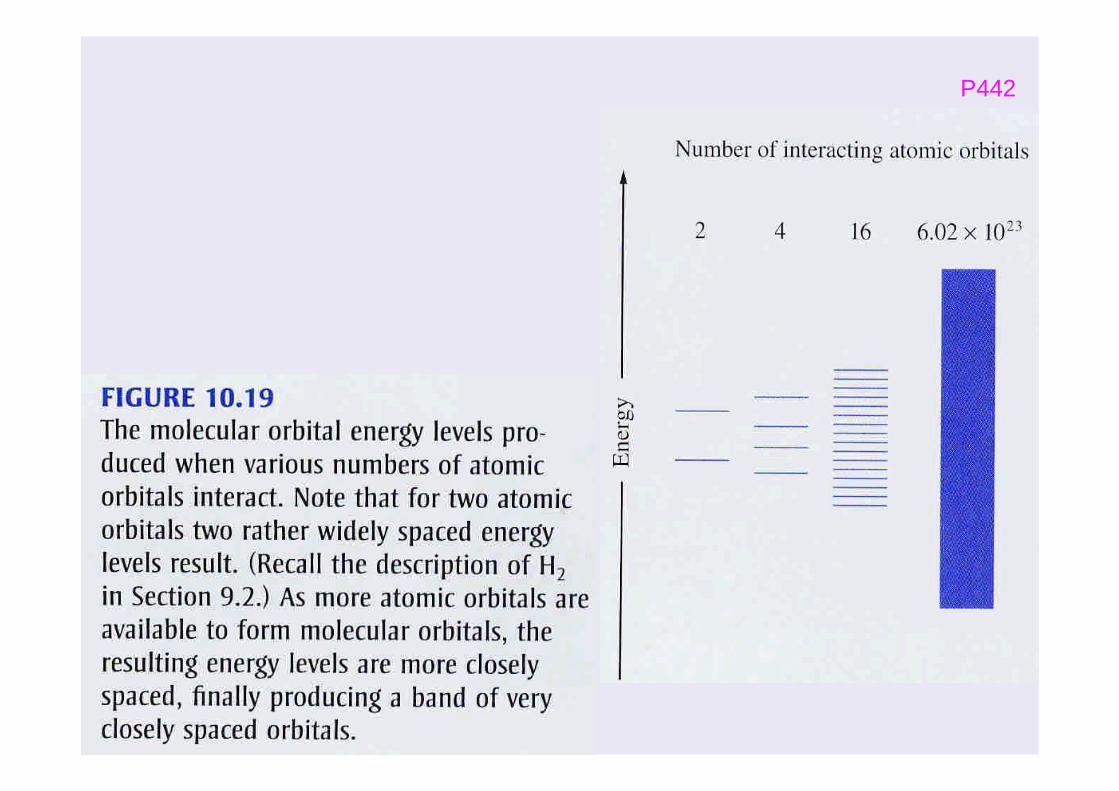
The Band Model for Magnesium
Figure 10.20 (left) A representation of the energy levels (bands) inmagnesium crystal. The electrons in the 1s, 2s, and2p orbitals are closeto the nuclei and thus localized on each magnesium atom as shown.However, the 3s and 3p valence orbitals overlap and mix to formmolecular orbitals. Electrons in these energy levels can travelthroughout the crystal. (right) Crystal of magnesium grown from a vapor.
p442
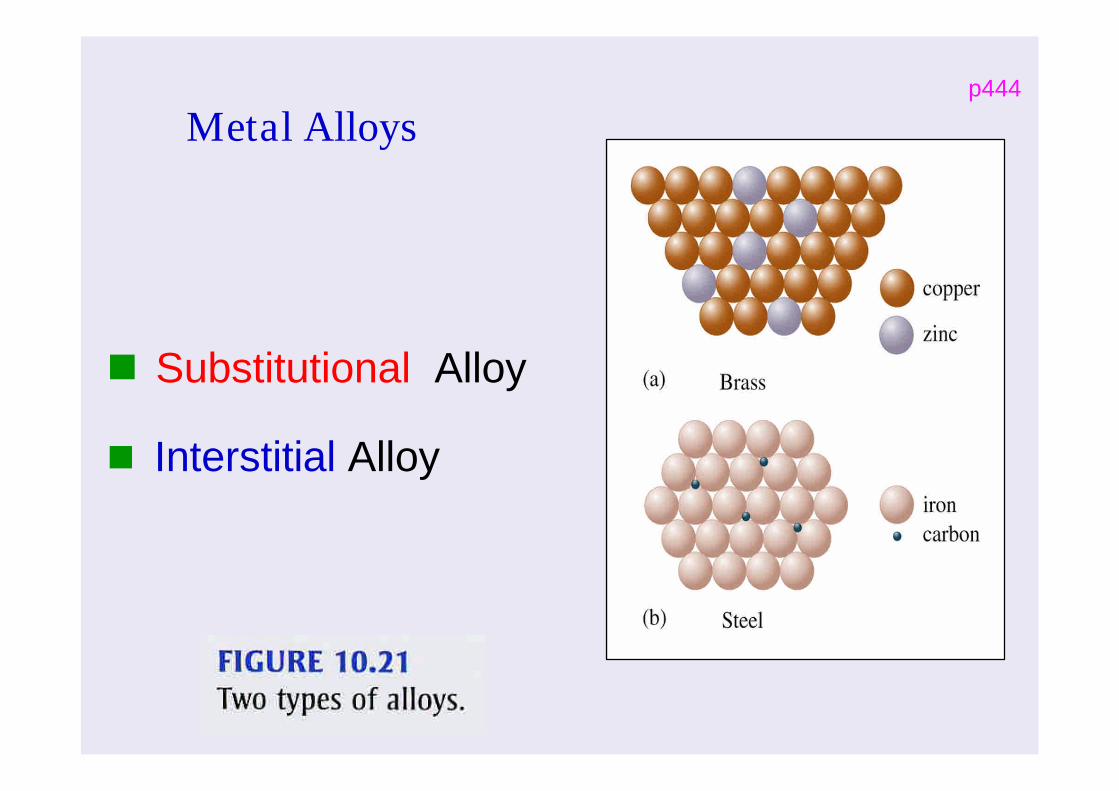
Metal Alloys
Substitutional Alloy
Interstitial Alloy
p444

10-5 Carbon and Silicon:Network Atomic Solids
Figure 10.22 The structures of diamond and graphite. In eachcase only a small part of the entire structure is shown.
Network solids
p444
34
Network Solids

Figure 10.23 Partial representation of the molecularorbital energies in (a) diamond and (b) a typical metal.
p445

36
The p Orbitals
Figure 10.24 The p orbitals (a) perpendicular to theplane of the carbon ring system in the graphite cancombine to form (b) an extensive π-bonding network.
p445
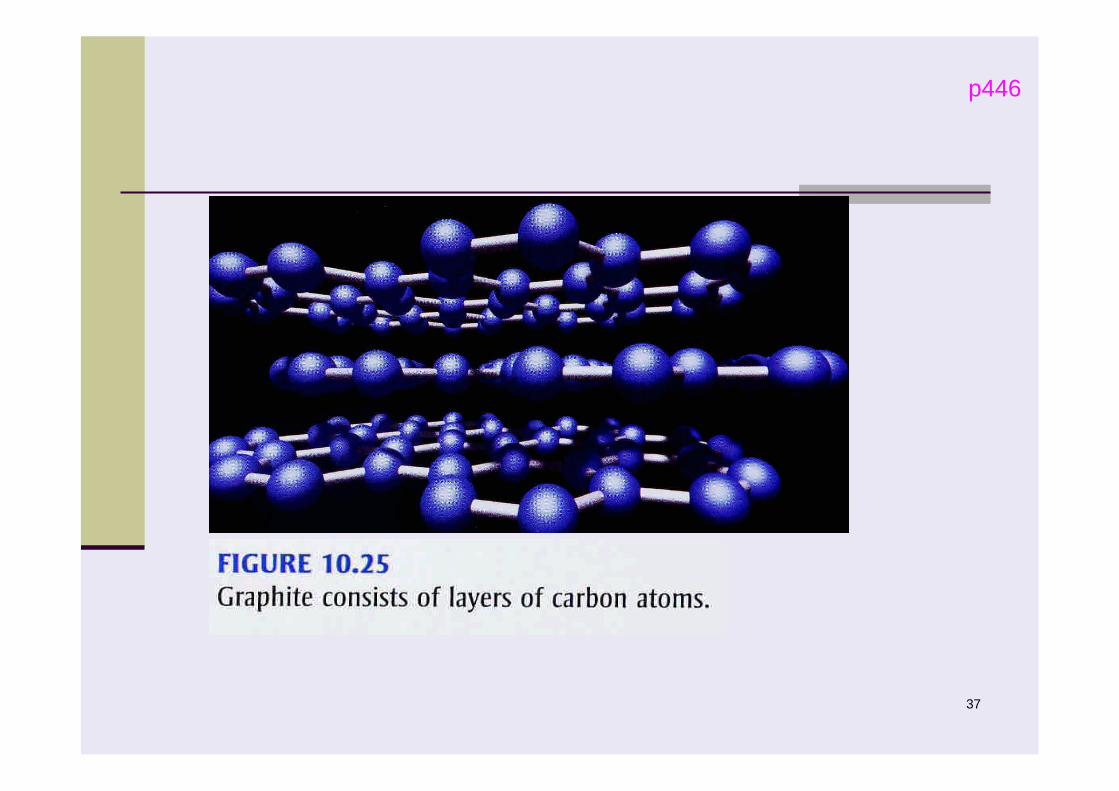
37
p446
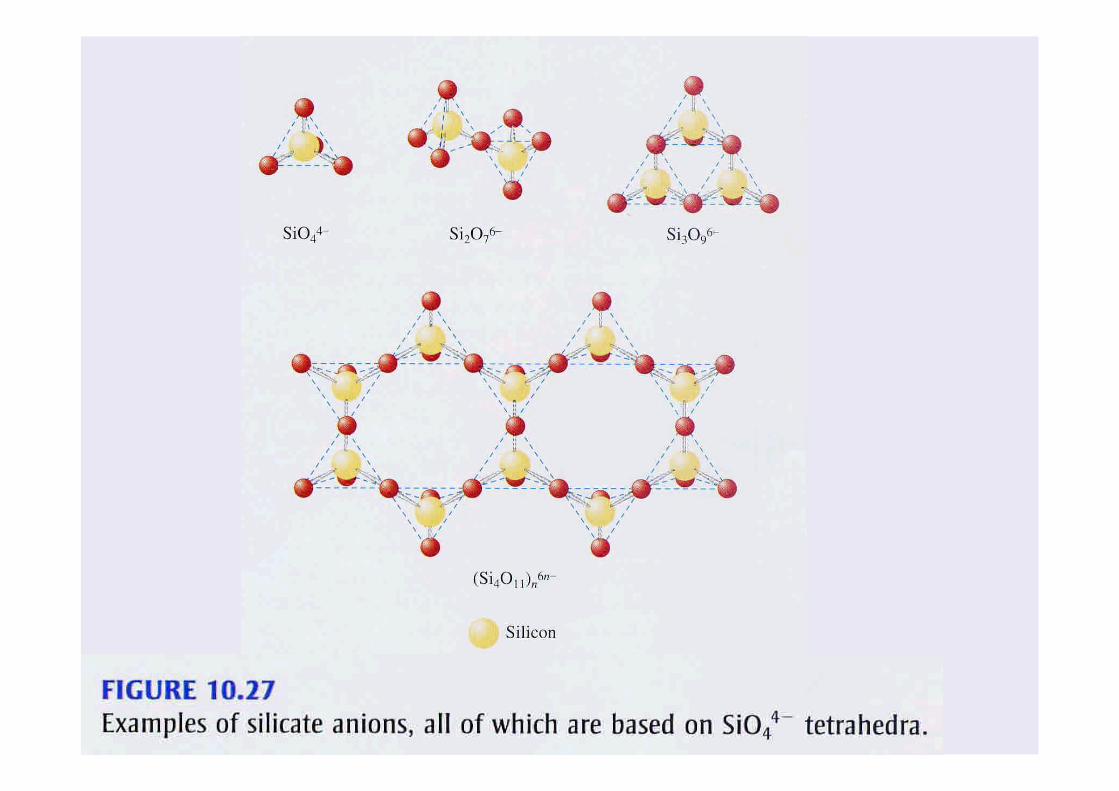

p447

p447
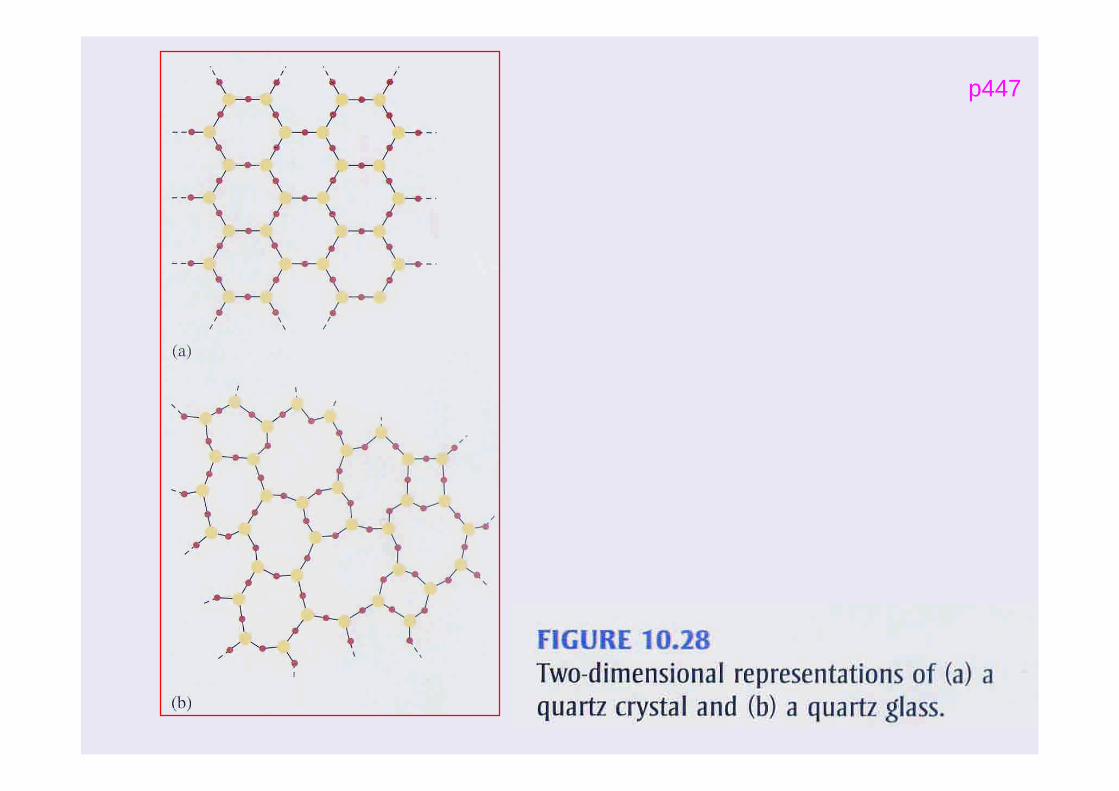
p447

p448
Table 10.5 Compositions of some common typesof glass

Ceramics p448

Silicon Crystal Dopedwith (a) Arsenic and (b)Boron.
Semiconductors p450

Figure 10.30 Energy level diagrams for (a) an n-typesemiconductor and (b) a p-type semiconductor.
p450
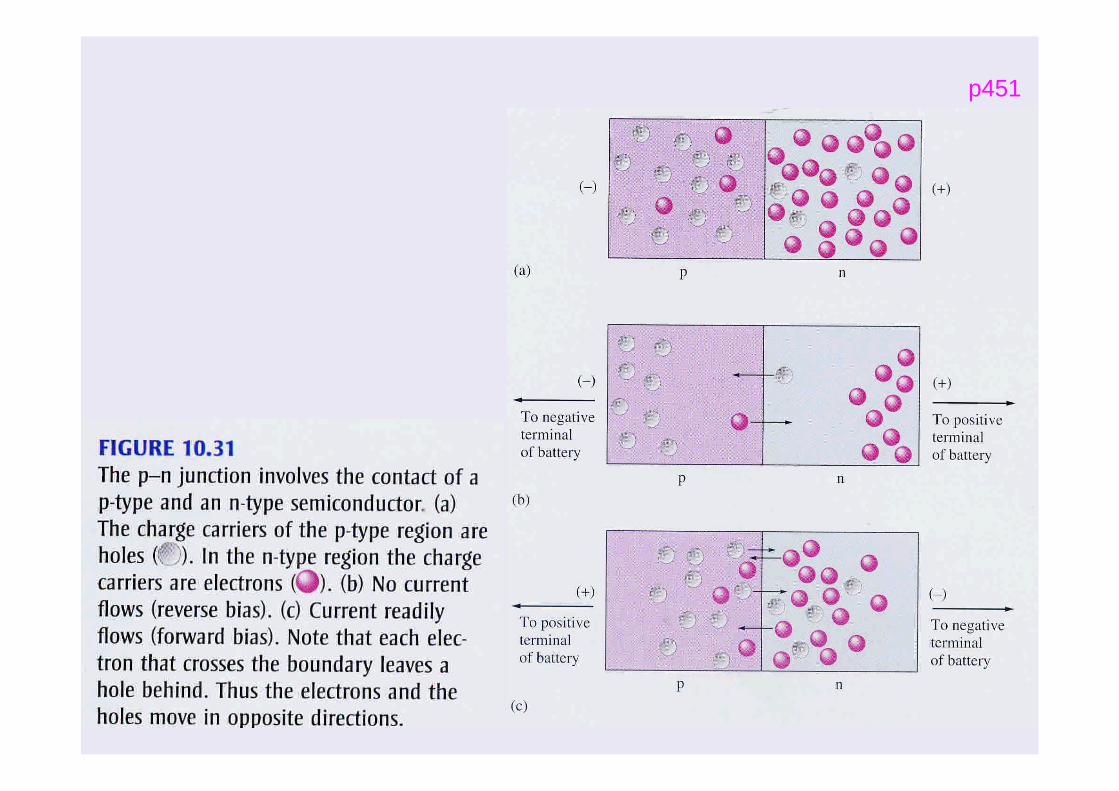
p451

47
Magnetic Levitation By a Superconductor
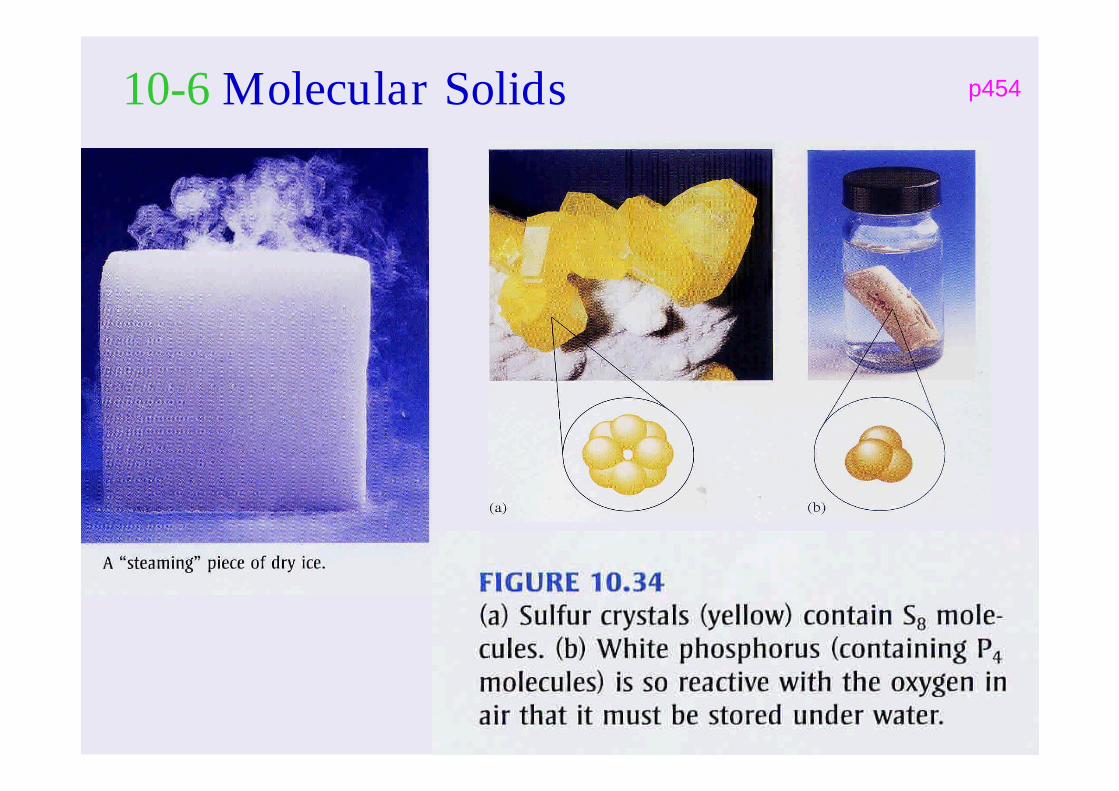
10-6 Molecular Solids p454
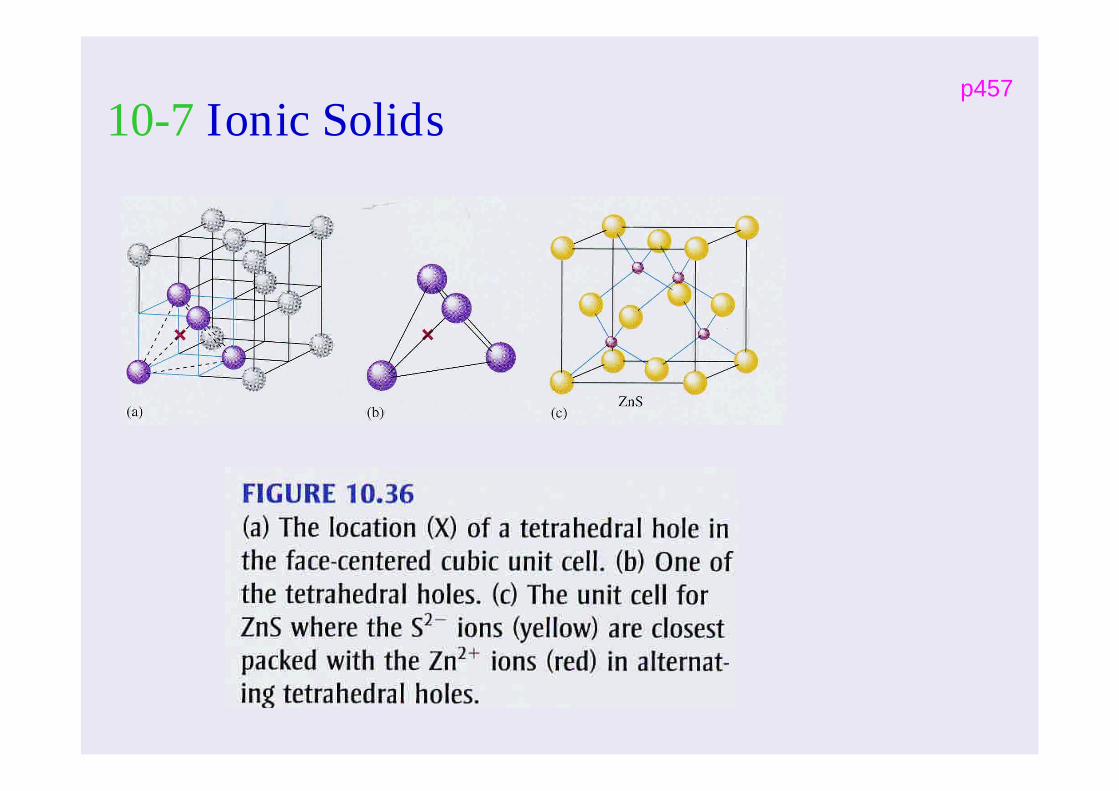
10-7 Ionic Solidsp457
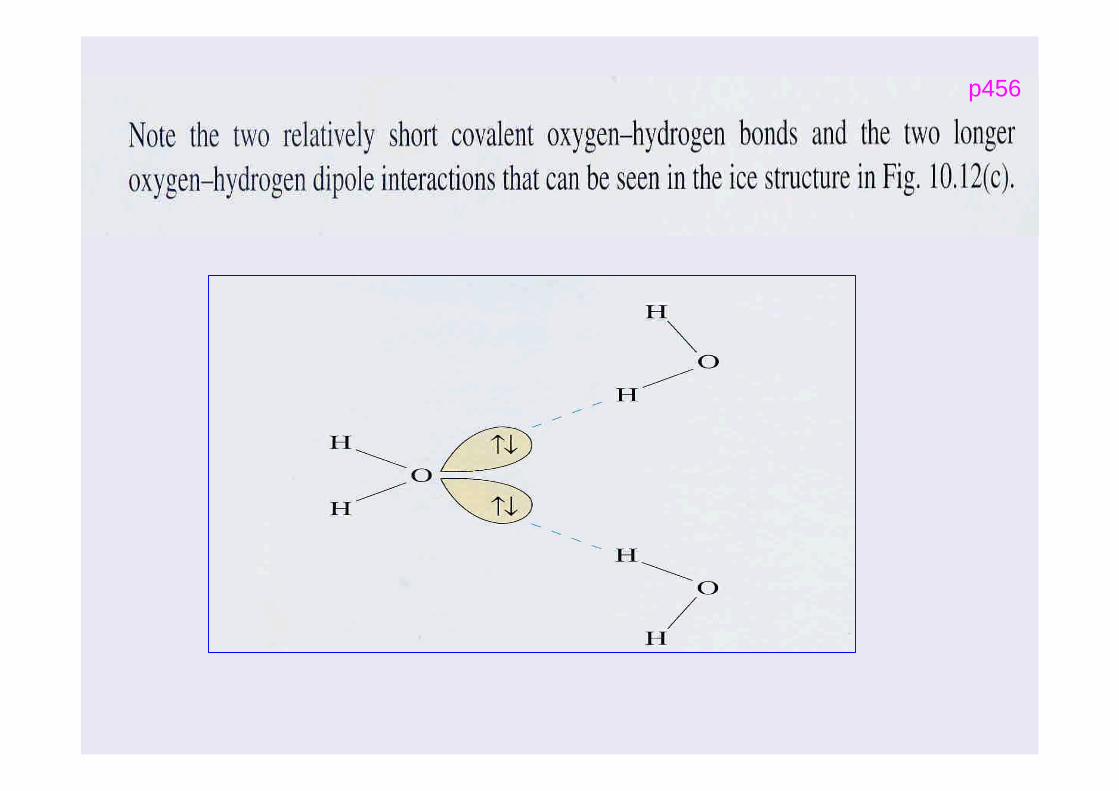
p456

Ex 10.3 Determining the Number of Ions in aUnit Cell
P457
Determining the number of Na+ and Cl- ions in the sodium
chloride unit cell.
Figure 10.37

p458

53
Molecular Solids
p456

55
Ionic Solids

p458
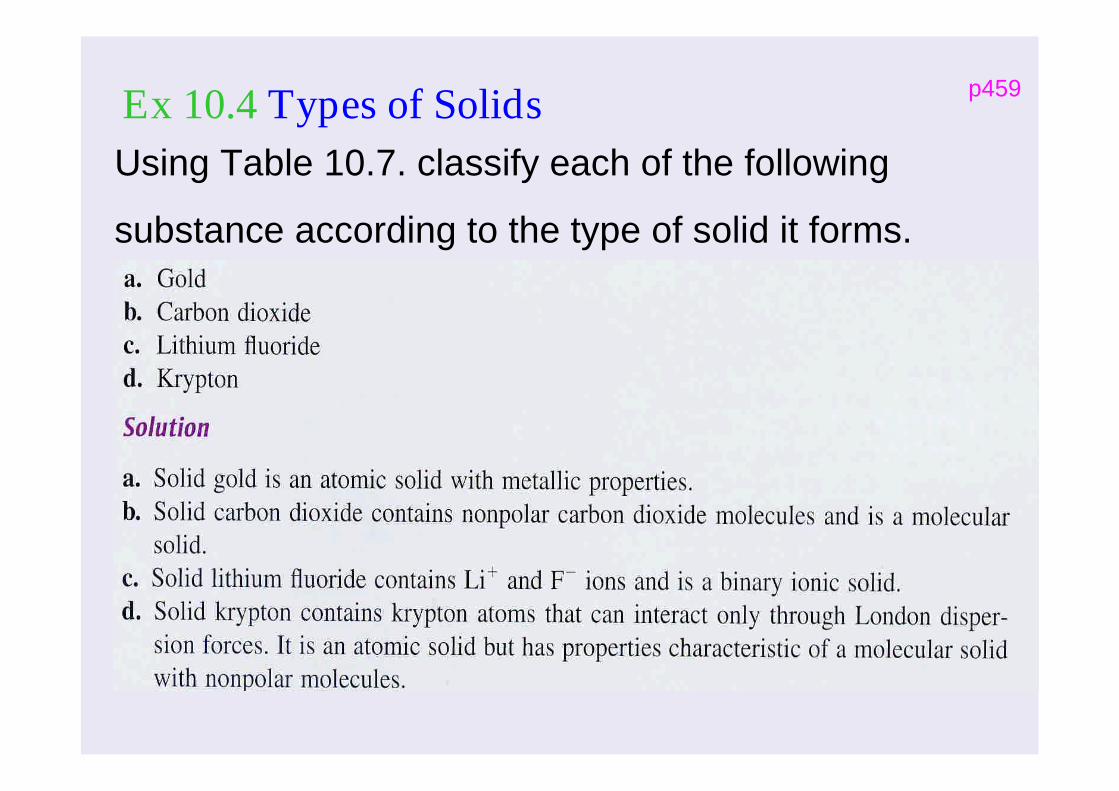
Ex 10.4 Types of SolidsUsing Table 10.7. classify each of the following
substance according to the type of solid it forms.
p459

58
10.8 Vapor Pressure and Changes ofState
p459
Vaporization or evaporation
The enthalpy of vaporization is symbolized as
Heat of vaporization
The rate of condensationThe rate of evaporationHighly dynamic on the molecularlevel
Figure 10.38 Behavior of aliquid in a closed container.
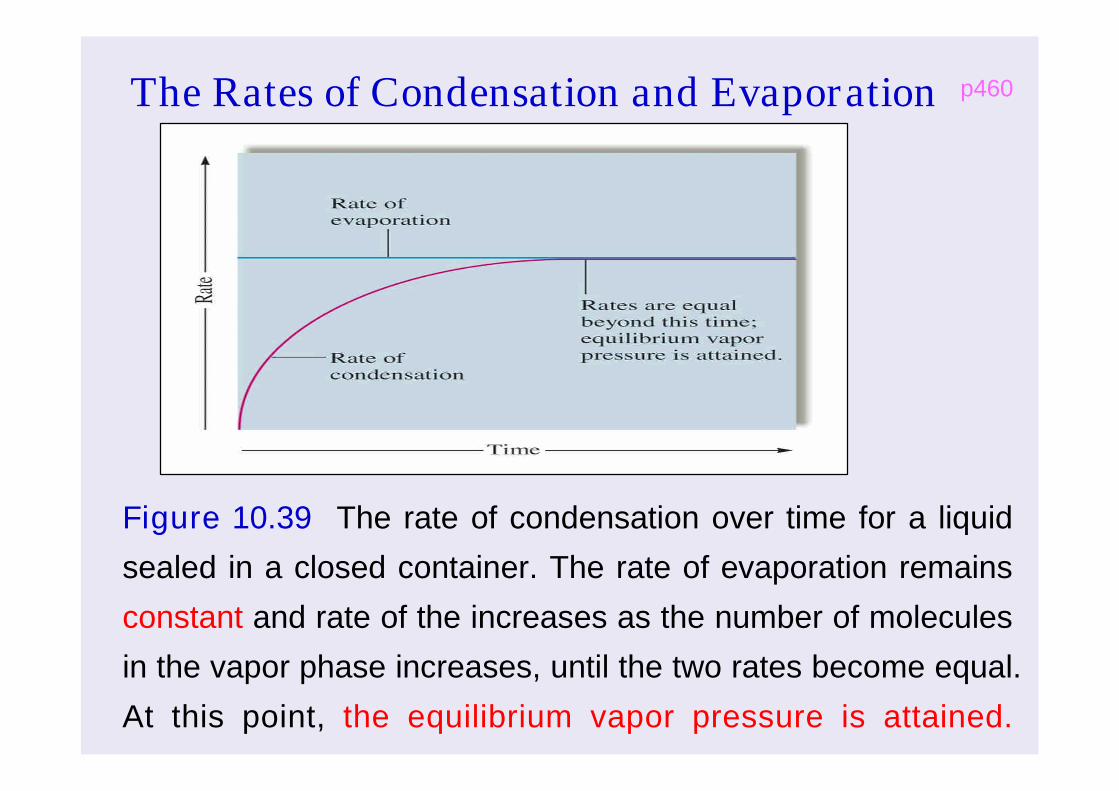
The Rates of Condensation and Evaporation
Figure 10.39 The rate of condensation over time for a liquid
sealed in a closed container. The rate of evaporation remains
constant and rate of the increases as the number of molecules
in the vapor phase increases, until the two rates become equal.
At this point, the equilibrium vapor pressure is attained..
p460

VaporPressure
p460
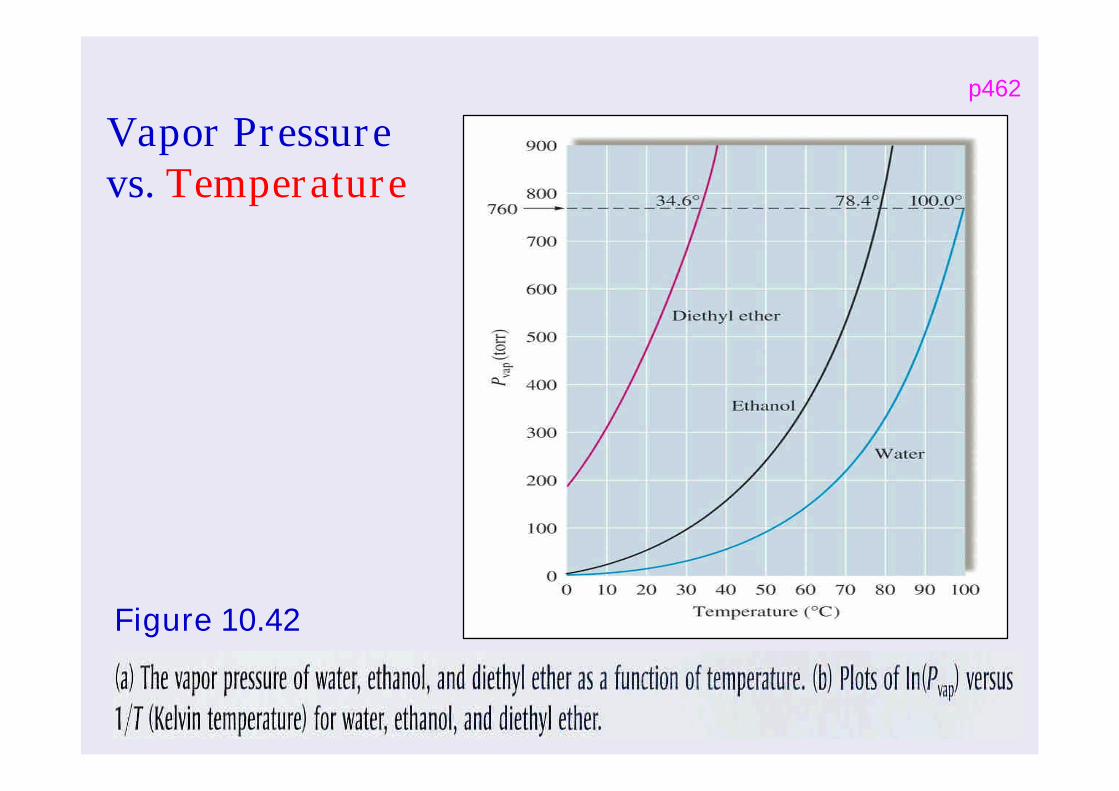
Vapor Pressurevs. Temperature
Figure 10.42
p462

Hpvap
)ln(
CTR
Hp vap
vap
)1
()ln( 10.4
p461
Figure 10.42 (b)

P461Ex 10.5 Determining Enthalpies ofVaporization
Using the plots in Fig. 10.42(b), determine whether water
or diethyl ether has the larger enthalpy of vaporization.
P463
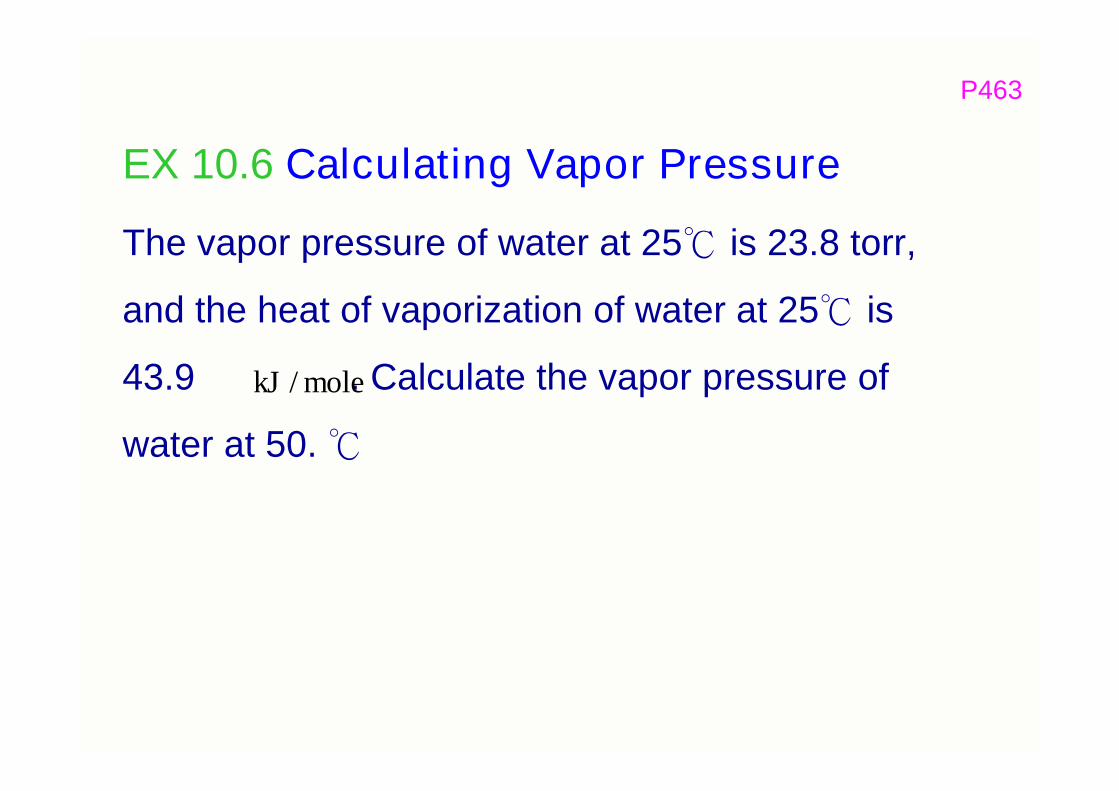
EX 10.6 Calculating Vapor Pressure
The vapor pressure of water at 25℃ is 23.8 torr,
and the heat of vaporization of water at 25℃ is
43.9 . Calculate the vapor pressure of
water at 50. ℃
molekJ /

Solution: p463
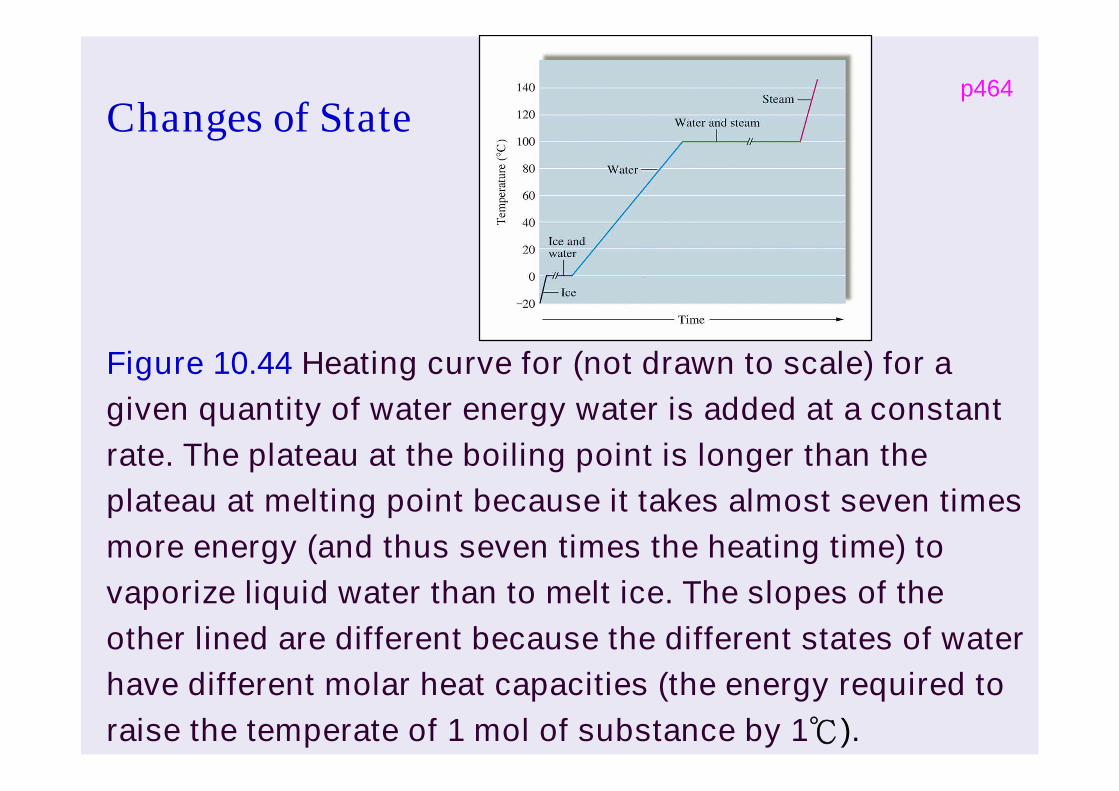
Figure 10.44 Heating curve for (not drawn to scale) for agiven quantity of water energy water is added at a constantrate. The plateau at the boiling point is longer than theplateau at melting point because it takes almost seven timesmore energy (and thus seven times the heating time) tovaporize liquid water than to melt ice. The slopes of theother lined are different because the different states of waterhave different molar heat capacities (the energy required toraise the temperate of 1 mol of substance by 1℃).
Changes of Statep464
67
p464

p465

69
Boiling Water with Ice
70
Changes of State

p466

p466

73
10-9 Phase Diagramsp467

p468
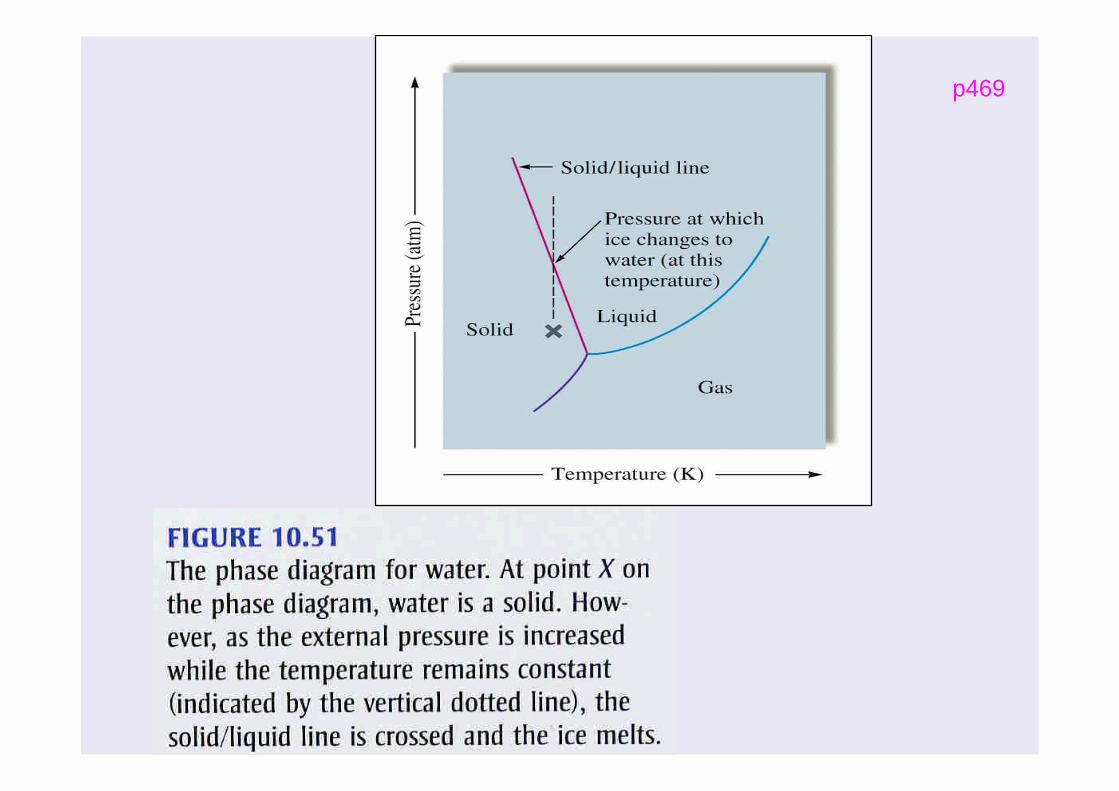
p469
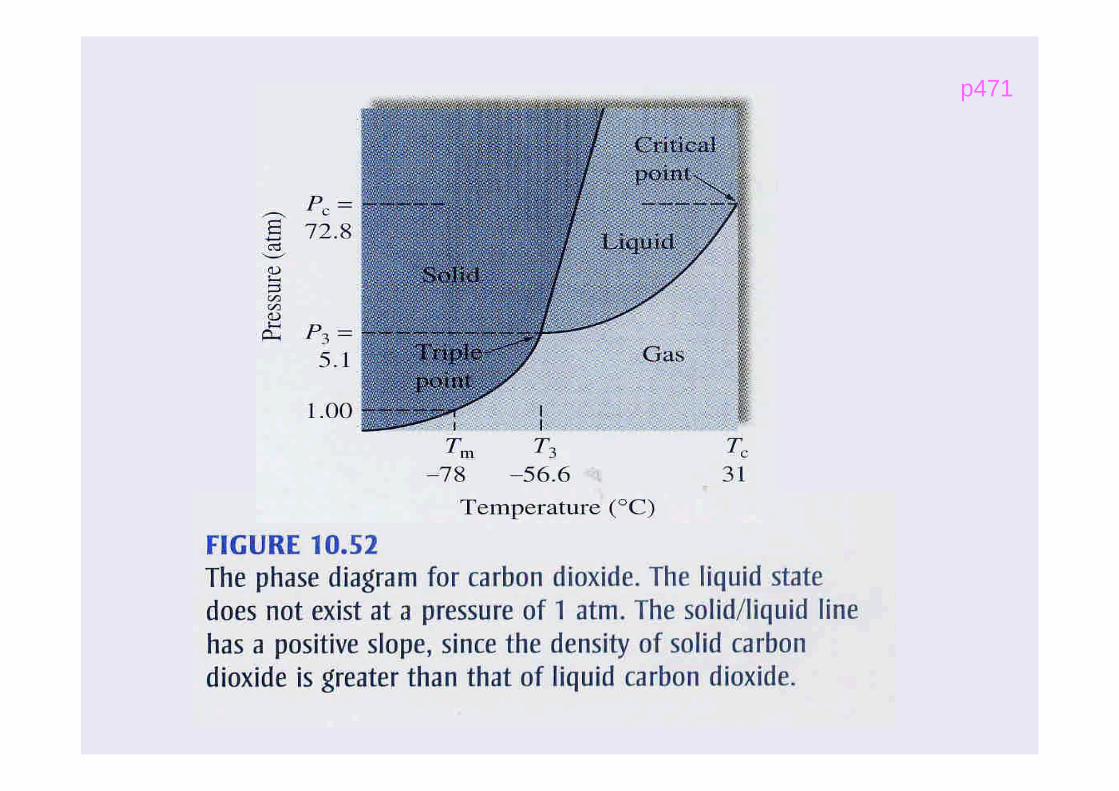
p471

77
Explain the differences in the phase diagrams
of water and carbon dioxide.
React

p470