package ‘aylmer’
TRANSCRIPT
Package ‘aylmer’February 19, 2015
Type Package
Title A generalization of Fisher's exact test
Version 1.0-11
Date 2008-10-11
Author Robin K. S. Hankin (R) and Luke J. West (C++)
Depends R (>= 2.10), methods, Brobdingnag
Suggests partitions
Maintainer Robin K. S. Hankin <[email protected]>
Description A generalization of Fisher's exact test that allows forstructural zeros.
License GPL-2
Repository CRAN
Date/Publication 2013-12-10 07:46:46
NeedsCompilation yes
R topics documented:aylmer-package . . . . . . . . . . . . . . . . . . . . . . . . . . . . . . . . . . . . . . . 2allboards . . . . . . . . . . . . . . . . . . . . . . . . . . . . . . . . . . . . . . . . . . . 3as.pairwise . . . . . . . . . . . . . . . . . . . . . . . . . . . . . . . . . . . . . . . . . 4aylmer.test . . . . . . . . . . . . . . . . . . . . . . . . . . . . . . . . . . . . . . . . . . 5best . . . . . . . . . . . . . . . . . . . . . . . . . . . . . . . . . . . . . . . . . . . . . 8chess . . . . . . . . . . . . . . . . . . . . . . . . . . . . . . . . . . . . . . . . . . . . . 9frogs . . . . . . . . . . . . . . . . . . . . . . . . . . . . . . . . . . . . . . . . . . . . . 10gear . . . . . . . . . . . . . . . . . . . . . . . . . . . . . . . . . . . . . . . . . . . . . 11glass . . . . . . . . . . . . . . . . . . . . . . . . . . . . . . . . . . . . . . . . . . . . . 11good . . . . . . . . . . . . . . . . . . . . . . . . . . . . . . . . . . . . . . . . . . . . . 13icons . . . . . . . . . . . . . . . . . . . . . . . . . . . . . . . . . . . . . . . . . . . . . 14iqd . . . . . . . . . . . . . . . . . . . . . . . . . . . . . . . . . . . . . . . . . . . . . . 15marginals . . . . . . . . . . . . . . . . . . . . . . . . . . . . . . . . . . . . . . . . . . 16odds.ratio . . . . . . . . . . . . . . . . . . . . . . . . . . . . . . . . . . . . . . . . . . 17purum . . . . . . . . . . . . . . . . . . . . . . . . . . . . . . . . . . . . . . . . . . . . 18
1
2 aylmer-package
randomprobs . . . . . . . . . . . . . . . . . . . . . . . . . . . . . . . . . . . . . . . . 18rps . . . . . . . . . . . . . . . . . . . . . . . . . . . . . . . . . . . . . . . . . . . . . . 20
Index 21
aylmer-package A Generalization of Fisher’s exact test
Description
A Generalization of Fisher’s exact test
Details
Package: aylmerType: PackageVersion: 1.0Date: 2007-10-11License: GPL-2
Author(s)
Robin K. S. Hankin (R) and Luke G. West (C++)
Maintainer: <[email protected]>
References
• Ronald Aylmer Fisher 1955. Statistical methods for research workers, Oliver and Boyd
• G. H. Freeman and J. H. Halton 1951. Note on an Exact Treatment of Contingency, Goodnessof Fit and Other Problems of Significance. Biometrika, 38(1-2):141-149
• A. W. Ghent 1972. A Method for Exact Testing of 2× 2, 2× 3, 3× 3, and Other ContingencyTables, Employing Binomial Coefficients. American Midland Naturalist, 88(1):15-27
• R. K. S. Hankin 2007. Very Large Numbers in R: Introducing Package Brobdingnag. R News3(3):15-16
Examples
data(chess)aylmer.test(chess)
allboards 3
allboards Various board functionality
Description
A board is a matrix with non-negative integer elements; an object of class board. It representsa contingency table; NA entries specify structural zeros. Function allboards() takes a matrix x,coerces it to a board, then enumerates all boards with identical marginal totals, and zeros at thesame locations as the structural zeros of x.
Usage
no.of.boards(x, n = 1e5)allboards(x, n = 1e5, func=NULL)allprobs(x, n = 1e5, normalize=TRUE, give.log=FALSE, use.C=TRUE)is.1dof(x)maxlike(x)
Arguments
x Matrix, coerced to integer. Usually with one or more NA entries
n Integer specifying how many boards to return. See details section
use.C In function allprobs(), Boolean with default TRUE meaning to use the C rou-tine, and FALSE meaning to use an R routine
func In function allboards(), argument to specify the function returned; defaultNULL means to return the whole board
normalize In function allprobs(), Boolean with default TRUE meaning to normalize thereturned values so they sum to one (and thus correspond to probabilities condi-tional on the marginal totals and structural zeros)
give.log Boolean specifying whether to return the log of the probabilities
Details
Function no.of.boards(x) returns the number of boards with non-negative entries that have thesame marginal totals as x and structural zeros where x has NA entries (that is, permissible boards).Function allboards() enumerates such boards.
Function prob(x) returns a number proportional to the probability of observing x, given the struc-tural zeros and marginal total.
Function is.1dof(x) returns TRUE if and only if x is of the same form as gear, and thus has onlyone degree of freedom. Note that there exist other configurations which have only one degree offreedom (such as any permutation of the rows and columns of gear).
Function maxlike(x) returns the entry of allboards() that has the highest probability of occur-ring. Compare best().
4 as.pairwise
In functions no.of.boards() and allboards(), argument n is the maximum number of boards (ormaximum count) returned, except for special value 0, which means to return (or count) all possibleboards.
(Actually, if there are more than n permissible boards, the first n+1 boards are returned by allboards(),and n+1 is returned by no.of.boards(). This is because the C code checks for the last board havinga successor).
Warning Many frequently-encountered boards have a very large number of possible configurations,and if called with n=0, these functions will iterate for a very long time before stopping.
Author(s)
Robin K. S. Hankin (R); Luke G. West (C++)
See Also
marginals,aylmer.test,best
Examples
data(chess)allboards(chess)maxlike(chess)
data(frogs)
x <- matrix(c(28,2,9,7,3,1,14,34,9,8,6,2),ncol=2)## Not run: no.of.boards(x) # Should be 339314 according to Gail and Mantel
data(iqd)f <- function(x){x[1,1]}table(allboards(iqd,1000,f))
as.pairwise Convert a results matrix to a board
Description
Given a square matrix giving the results of pairwise comparisons, return a board object whose rowsshow the results of the comparisons.
Usage
as.pairwise(x)
Arguments
x A square matrix
aylmer.test 5
Details
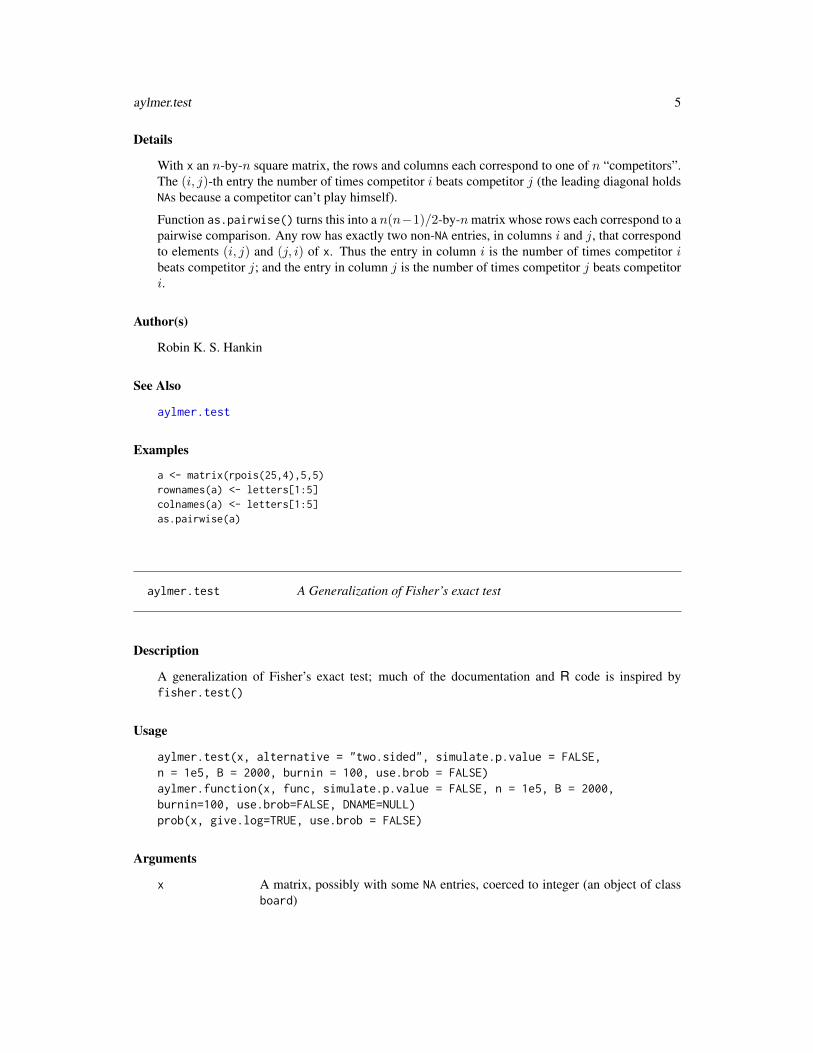
With x an n-by-n square matrix, the rows and columns each correspond to one of n “competitors”.The (i, j)-th entry the number of times competitor i beats competitor j (the leading diagonal holdsNAs because a competitor can’t play himself).
Function as.pairwise() turns this into a n(n−1)/2-by-n matrix whose rows each correspond to apairwise comparison. Any row has exactly two non-NA entries, in columns i and j, that correspondto elements (i, j) and (j, i) of x. Thus the entry in column i is the number of times competitor ibeats competitor j; and the entry in column j is the number of times competitor j beats competitori.
Author(s)
Robin K. S. Hankin
See Also
aylmer.test
Examples
a <- matrix(rpois(25,4),5,5)rownames(a) <- letters[1:5]colnames(a) <- letters[1:5]as.pairwise(a)
aylmer.test A Generalization of Fisher’s exact test
Description
A generalization of Fisher’s exact test; much of the documentation and R code is inspired byfisher.test()
Usage
aylmer.test(x, alternative = "two.sided", simulate.p.value = FALSE,n = 1e5, B = 2000, burnin = 100, use.brob = FALSE)aylmer.function(x, func, simulate.p.value = FALSE, n = 1e5, B = 2000,burnin=100, use.brob=FALSE, DNAME=NULL)prob(x, give.log=TRUE, use.brob = FALSE)
Arguments
x A matrix, possibly with some NA entries, coerced to integer (an object of classboard)
6 aylmer.test
alternative Indicates the alternative hypothesis. If not a function, it must be one of “two.sided”,“greater” or “less”. You may specify just the initial letter. Only used in caseswith one degree of freedom. If a function, then control is passed to aylmer.function(),for which aylmer.test() is a wrapper
simulate.p.value
Boolean, with default FALSE meaning to return the results of an exact (combina-torial) test, and TRUE meaning to compute p-values by Monte Carlo simulation
n Integer specifying the maximum number of boards to list if simulate.p.valueis FALSE; passed to allprobs() and thence no.of.boards(). This argumenthas a finite default value to prevent infinite looping
B Integer specifying the number of replicates used in the Monte Carlo version ofthe test
burnin Integer specifying the length of burn in. See details section
use.brob Boolean, with default FALSE meaning to use IEEE arithmetic and TRUE meaningto use Brobdingnagian arithmetic
give.log In function prob(), Boolean with default TRUE meaning to return the logarithmof the answer and FALSE meaning to return the value
func In function aylmer.function(), the test function used. The p-value returned isthe probability that a random permissible board has a test function less than thatof argument x
DNAME In function aylmer.function(), the name of the dataset to be specified; defaultvalue of NULL means to use standard construction
Details
If simulate.p.value is TRUE, a vector of random probabilities is used instead of the full enumer-ation. A total of B+burnin boards are generated of which the first burnin are discarded.
Value
An object of class “htest”
Note
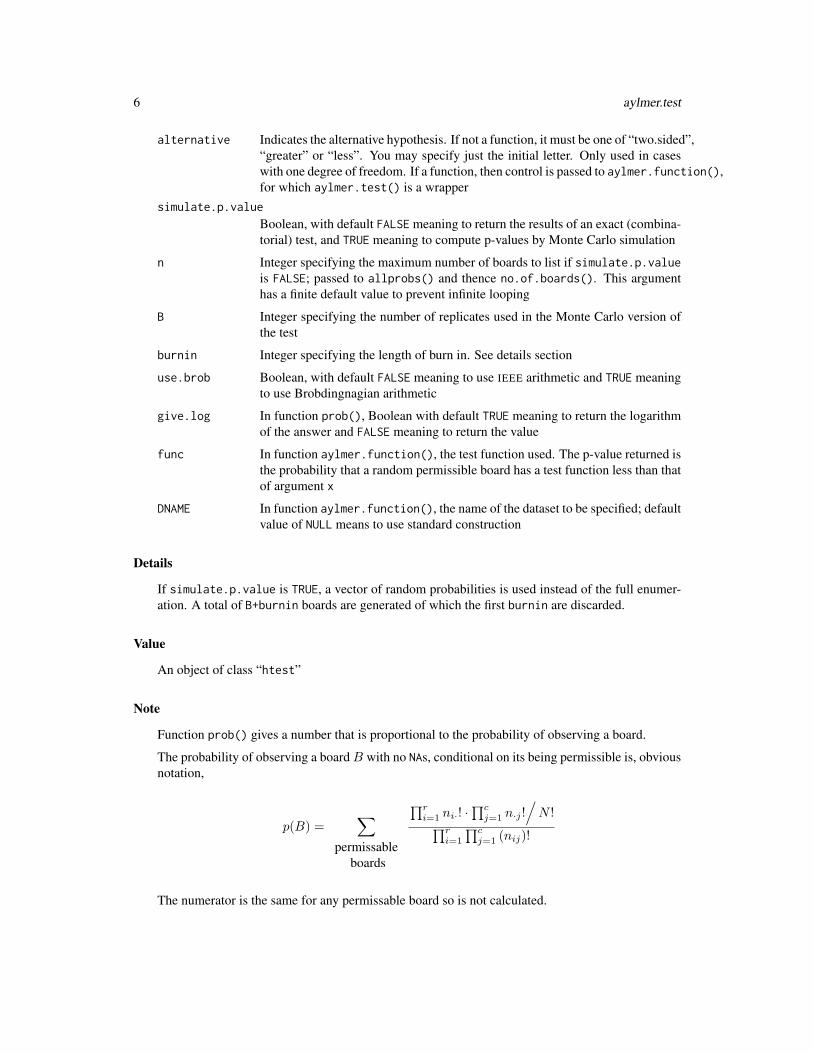
Function prob() gives a number that is proportional to the probability of observing a board.
The probability of observing a board B with no NAs, conditional on its being permissible is, obviousnotation,
p(B) =∑
permissableboards
∏ri=1 ni·! ·
∏cj=1 n·j !
/N !∏r
i=1
∏cj=1 (nij)!
The numerator is the same for any permissable board so is not calculated.
aylmer.test 7
If simulate.p.value is TRUE, the default value for B of 2000 is likely to be low, especially forlarge tables, or tables with large entries. Bear in mind that the Markov chain has high sequentialcorrelation.
If simulate.p.value is FALSE, enumerative techniques are used. In this case, the default value forn (105) is also likely to be low: a p-value of 1 is returned because the first few boards all have aprobability much much smaller than that of the data.
Author(s)
Robin K. S. Hankin (R); Luke J. West (C++); an anonymous JSS referee who suggested the approachused in aylmer.function()
References
• Ronald Aylmer Fisher 1955. Statistical methods for research workers, Oliver and Boyd
• G. H. Freeman and J. H. Halton 1951. Note on an Exact Treatment of Contingency, Goodnessof Fit and Other Problems of Significance. Biometrika, 38(1-2):141-149
• A. W. Ghent 1972. A Method for Exact Testing of 2x2, 2x3, 3x3, and Other ContingencyTables, Employing Binomial Coefficients. American Midland Naturalist, 88(1):15-27
• R. K. S. Hankin 2007. Very Large Numbers in R: Introducing Package Brobdingnag, R news3(3):15-16
• M. J. Silvapulle and P. K. Sen 2005. Constrained statistical inference. Wiley (page 326 for aspecial case of the tests performed by aylmer.function())
See Also
fisher.test, randomprobs
Examples
data(iqd)
aylmer.test(iqd)
## Not run: aylmer.test(iqd,simulate.p.value=TRUE)
data(frogs)prob(frogs)prob(frogs,use.brob=TRUE)
8 best
best Optimize a board using simulated annealing
Description
Uses simulated annealing to find the ‘best’ permissible board, using any objective function
Usage
best(x, func = NULL, n = 100, ...)
Arguments
x A board
func The objective function, with default NULL meaning to use -prob(x)
n Maximum number of attempts (passed to candidate())
... Further arguments passed to optim()
Details
The help page for optim() gives an example of simulated annealing being used to solve the trav-elling salesman problem and best() uses the same technique in which the gr argument specifies afunction used to generate a new candidate point (candidate()).
Note
Function randomprobs() also takes a func argument and can be used to find an optimal board, bygenerating random permissible boards and finding the best one. But these two functions are verydifferent: best() uses optim() which incorporates highly specific optimization algorithms to finda global maximum, while randomprobs() creates a Markov chain and reports the board with themost desirable objective function.
Author(s)
Robin K. S. Hankin
See Also
optim,prob
Examples
a <- matrix(0,5,5)diag(a) <- NAa[cbind(1:5 , c(2:5,1))] <- 4## Not run:best(a,control=list(maxit=10)) ## Answer should be all ones except the diagonal
chess 9
## End(Not run)
# Now a non-default function; SANN should be able to get func(x) down to# zero pretty quickly:## Not run:best(a,func=function(x){x[1,2]},control=list(maxit=100))
## End(Not run)# The 'dontrun' is needed because sometimes the method needs a bigger n
chess Chess playing dataset
Description
A tally of wins and losses for games between three chess players: Topalov, Anand, Karpov
Usage
data(chess)
Details
The players are:
• Grandmaster Veselin Topalov. FIDE world champion 2005-2006; peak rating 2813
• Grandmaster Viswanathan Anand. FIDE world champion 2000-2002, 2008; peak rating 2799
• Grandmaster Anatoly Karpov. FIDE world champion 1993-1999; peak rating 2780
Observe that Topalov beats Anand, Anand beats Karpov, and Karpov beats Topalov (here, “beats”means “wins more games than”).
The games thus resemble a noisy version of “rock paper scissors”.
References
• http://www.chessbase.com/
See Also
rps
Examples
data(chess)allboards(chess)
10 frogs
frogs Mating preference of frogs
Description
A matrix with 9 columns representing different mating calls, and 36 rows, representing the resultsof repeated pairwise preference tests.
Usage
data(frogs)
Details
Dataset frogs.matrix is a 9-by-9 matrix with rows and columns corresponding to 9 stimuli pre-sented to a female frog. Entry (i, j) corresponds to the number of times the frog preferred stimulusi.
Dataset frogs is a 36-by-9 matrix with each row corresponding to a pair of distinct stimuli [36 =9 ∗ (9 − 1)/2]; if a row has non-NA columns i and j, the its entries show the number of times thefrog preferred stimulus i or stimulus j.
The first form may be converted to the second using function as.pairwise(). Note that the squarematrix may have NA entries off the main diagonal (some pairs did not meet).
See purum.Rd for another mating preference dataset.
Source
• Kirkpatrick M, Rand AS, Ryan MJ (2006). “Mate Choice Rules in Animals”, Animal Be-haviour, 71, 1215–1225
• Ryan MJ, Rand AS (2003). “Sexual Selection in Female Perceptual Space: How FemaleTungara Frogs Perceive and Respond to Complex Population Variation in Acoustic MatingSignals” Evolution, 57(11), 2608–2618
See Also
purum
Examples
data(frogs)frogs.matrix
gear 11
gear Dataset of subjective judgement of gear teeth
Description
A gear (cog wheel) with seven teeth is taken out of service and teeth examined for wear. Onlyadjacent pairs of teeth may be compared, but any given pair may be compared by a number ofpeople, each of whom indicates which tooth they believe to be more worn.
The dataset is of the form of a seven-by-seven matrix, one column for each tooth. Each row consistsof precisely two non-NA entries, say in columns A and B. The entries indicate the number of timesan observer “prefers” (that is, judges to be more worn) tooth A and tooth B.
The board has a single degree of freedom.
Usage
data(gear)
Details
The null hypothesis is that there exist p1, . . . , p7 with∑
pi = 1 such that the probability of pre-ferring tooth i to tooth j is pi/(pi + pj). Alternative hypotheses might be that the comparison hassome sort of handedness in the sense that the clockwise tooth might be preferred more frequentlythan might be expected by chance.
Source
Data kindly supplied by A. G. S. Hankin
Examples
data(gear)is.1dof(gear)aylmer.test(gear)aylmer.test(gear,alternative="less")
glass British social mobility data
Description
Classification of son-father status
Usage
data(glass)
12 glass
Details
Data collected by Glass: social status of son cross-classified with status of father.
Dataset glass.al includes all the original data; dataset glass has the diagonal set to NA, thusrestricting the sample to those pairs where the father’s status is different from that of the son’s.
This dataset has ordered factors: social status is ordered from 1 (highest) to 5 (lowest).
An example of a test only possible where the factors are ordered is given below. The alternative is afunction, f(), that sums the counts in the lower triangular region of the matrix: the son has higherstatus than the father. If f(glass) is large, then this suggests that upward social mobility occursmore often than downward mobility.
Note that, because the test is conditioned on the marginal totals, a significant result would implythat downward mobility, when it occurs, involves a more extreme fall than the (more common)upwardly mobile case.
Source
• Bishop WMV, Fienberg SE, and Holland PW 1975. Discrete multivariate analysis. MIT Press
Examples
f <- function(x){sum(x[lower.tri(x)])}
# First a toy example:a <- matrix(0,5,5)diag(a) <- NAa[cbind(c(2:5,1),1:5)] <- 3
# Thus 'a' has 12 social climbers and 3 fallers. Chance?
aylmer.test(a , alternative=f)
# No!
# Now the real dataset:data(glass)aylmer.test(glass , alternative=f, simulate.p.value=TRUE , B=100)
# p-value of about 0.975 means that most boards have f(random.board) ># f(observed.board). In this case, f() is the number of climbers. The# test shows that the number of climbers is less than expected: those# who do climb, climb further than the fallers fall.
# See how one needs to be careful about one-sided and two-sided tests.
good 13
good Approximate number of contingency tables
Description
Approximate number of contingency tables with specified marginal totals.
Usage
good(x, method = "D", ...)
Arguments
x An integer-valued matrix (with no NA entries)
method The method to use; one of A, B, C, D. See details section
... Further arguments (notably n), passed to no.of.boards()
Details
All formulae and terminology taken from Good 1976. The letters A-D are from the approximationsgiven on pages 1167 and 1168.
Note This function will accept matrices with any NA entries, but a warning is given. The numberof permissable boards will be less than the number of permissible contingency tables considered byGood.
The approximations are intended to provide rough-and-ready upper bounds for boards that have afew NAs.
Note
Method “A” is the exact answer, given by no.of.boards(). Do not use this on large matrices!
Methods “B”, “C”, and “D” give (according to Good) increasingly accurate approximations to theexact answer.
Author(s)
Robin K. S. Hankin
References
• I. J. Good 1976. On the Application of Symmetric Dirichlet Distributions and Their Mixturesto Contingency Tables. The Annals of Statistics 4(6):1159–1189
See Also
no.of.boards
14 icons
Examples
a <- matrix(1,15,15)
good(a,"B")good(a,"C")good(a,"D") #identical to answer given by method "C"
icons Responses to climate change icons
Description
A matrix of nine rows and six columns, one column for each of six icons relevant to climate change.The matrix entries show the number of respondents who indicated which icon they found mostconcerning. The nine rows show different classes of respondents who were exposed to differentsubsets (of size four) of the six icons
Usage
data(icons)
Details
The six icons were used in this study were:
PB polar bears, which face extinction through loss of ice floe hunting grounds
NB The Norfolk Broads, which flood due to intense rainfall events
LF London flooding, as a result of sea level rise
THC The Thermo-haline circulation, which may slow or stop as a result of anthropogenic modifi-cation of the hydrological cycle
OA Oceanic acidification as a result of anthropogenic emissions of carbon dioxide
WAIS The West Antarctic Ice Sheet, which is calving into the sea as a result of climate change
Source
Data kindly supplied by Saffron O’Neill of the University of East Anglia
References
• S. O’Neill 2007. An Iconic Approach to Communicating Climate Change, University of EastAnglia, School of Environmental Science (in prep)
• I. Lorenzoni and N. Pidgeon 2005. Defining Dangers of Climate Change and Individual Be-haviour: Closing the Gap. In Avoiding Dangerous Climate Change (conference proceedings),UK Met Office, Exeter, 1-3 February
iqd 15
Examples
data(icons)
iqd Industrial quality control dataset
Description
A factory has four machines A, B, C, D. The quality control process identifies defects from eachmachine.
The iqd dataset has four columns, one per machine; entries correspond to the numbers of defectsproduced by each machine. The NA entries in a row indicate that a particular machine is switchedoff.
The null hypothesis would be that there exist four non-negative numbers p1, p2, p3, p4 with sum 1such that the probability of a defect arising from machine i is proportional to pi if it is switched on,and zero otherwise.
It is suspected that machine D is causing some sort of interference with machine A; machine Aproduces very few defects when D is switched off.
The shifts dataset includes only three machines, A, B, C. There are three columns, one per ma-chine; and three rows, one per operator (S1, S2, S3). On S1’s shift, machine C was out of commis-sion.
Usage
data(iqd)
Source
Data kindly supplied by Acme Corporation (widget division)
Examples
data(iqd)
aylmer.test(iqd)aylmer.test(shifts)
16 marginals
marginals Marginals of a board
Description
Various utilities to calculate the marginal totals of a board.
Usage
marginals(x)dof(x)is.board(x)as.board(x).Cargs(x)
Arguments
x A matrix, usually including one or more NA entries, coerced to integer (a “board”);see details section
Details
Function marginals() takes a matrix and returns a list holding the marginal totals and the coordi-nates of blank squares.
Function dof() takes a board and returns the number of degrees of freedom present.
Function .Cargs() takes a matrix and coerces it to a list suitable for calling the C++ routines; it isnot really intended for the end-user. This function uses formal S4 methods to coerce a matrix toan object of class board (checking for non-integer entries, etc), as do the functions documented inallboards.Rd.
Author(s)
Robin K. S. Hankin
See Also
allboardprobs
Examples
data(icons)marginals(icons)
odds.ratio 17
odds.ratio or
Description
The generalized odds ratio is a measure of the handedness of a cyclic competition graph.
Usage
odds.ratio(x)
Arguments
x matrix with one degree of freedom, coerced to a board
Details
The generalized odds ratio is the product of the odds ratios of the edges in a cyclic competitiongraph.
In the two-by-two case, the maximum likelihood estimatore of the odds ratio is just a11a22
a12a21. The
generalization to larger boards with exactly one degree of freedom is immediate: it is just theproduct of the entries on the diagonal, divided by the product of the off-diagonal elements.
Ranking permissable tables in order of increasing odds ratio thus orders the sample space and allowsone to perform one-sided tests.
Author(s)
Robin K. S. Hankin
See Also
pval.1dof
Examples
data(gear)odds.ratio(gear)
aylmer.test(gear)aylmer.test(gear,alternative="less")aylmer.test(gear,alternative="greater")
18 randomprobs
purum Classification of Purum marriages
Description
Data for 128 Purum marriages from a census (purum) and 30 marriages from Khulen village.
Usage
data(purum)
Details
The Purums are an isolated tribe in the interior of India, divided into five “sibs”: Marrim, Makan,Parpa, Thao, and the Kheyang.
Marriages between persons of the same sib are forbidden, as are persons from certain pairs ofsibs; note the lack of symmetry in the structural zeros implying a gender asymmetry (the singleKheyang-Kheyang marriage has special dispensation).
Source
• White HC 1963. An anatomy of kinship, Englewood Cliffs, N.J. Prentice-Hall; Figure 3.12,p136 for khulen and Table 3.2, p138 for purum
• Das 1945. The Purums: an old Kuki tribe of Manipur. Calcutta, University of Calcutta• Bishop WMV, Fienberg SE, and Holland PW 1975. Discrete multivariate analysis. MIT Press
Examples
data(purum)aylmer.test(purum , simulate.p.value=TRUE , B=100)
aylmer.test(khulen)aylmer.test(khulen , alternative=function(x){max(abs(x-t(x)),na.rm=TRUE)})
randomprobs Probabilities of random boards
Description
Probabilities of a random Markov chain of boards, chosen by the Metropolis-Hastings algorithm
Usage
randomprobs(x, B=2000, n=100, burnin = 0, use.brob=FALSE, func=NULL)randomboards(x, B=2000, n=100, burnin=0)candidate(x, n = 100, give = FALSE)
randomprobs 19
Arguments
x Matrix, coerced to class board: the start point
B Number of samples to take
burnin Number of samples to discard at the beginning
use.brob Boolean, with default FALSE meaning to use IEEE arithmetic and TRUE meaningto use Brobdingnagian arithmetic
n The number of times to try to find a candidate board with no non-negative en-tries; special value 0 means to search until one is found
func In function randomprobs(), the statistic to return; default of NULL interpretedas prob()
give In function candidate(), Boolean with default FALSE meaning to return a per-missible board, and TRUE meaning to return instead the number of attempts madeto find a permissible board (zero meaning no board was found). See details sec-tion below
Value
Function randomprobs() returns a vector of length B with entries corresponding to the probabilitiesof the boards encountered.
Function randomboards() returns an array with slices being successive boards
Note
Argument n of function candidate() specifies how many times to search for a board with nonon-negative entries. The special value n=0 means to search until one is found.
Boards with a large number of zeros may require more than the default 100 attempts to find apermissible board. Set the give flag to see how many candidates are generated before a permissibleone is found.
Warning: a board with at most one entry greater than zero is the unique permissible board and thealgorithm will not terminate if n=0
A board that requires more than 100 attempts is probably well-suited to the exact test as permissibleboards will likely be enumerable using allboards().
To find the permissible board that maximizes some objective function, use best(), which appliesthe bespoke optimization routines of optim()
Author(s)
Robin K. S. Hankin (R); Luke J. West (C++)
References
• N. A. Metropolis and others 1953. Equation of State Calculations by Fast Computing Ma-chines. Journal of Chemical Physics, 21:1087–1092
20 rps
See Also
aylmer.test,best
Examples
data(chess)aylmer.test(chess)
a <- matrix(1,9,9) # See Sloane's A110058plot(randomprobs(a,1000),type="b",main="Importance of burn-in")
set.seed(0)b <- diag(rep(6,6))plot(randomprobs(b,B=1000,n=1000), type="b",main="Importance of burn-in, part II")
data(purum)randomboards(purum,10)
rps A matrix showing who wins in rock-paper-scissors (RPS)
Description
A matrix showing the outcome of RPS. Each row shows the winner of a single round of RPSbetween the non-NA choices.
Usage
data(rps)
Details
The venerable game of rock-paper-scissors is the archetypal intransitive relationship. Rock beats(smashes) scissors; scissors beat (cut) paper; paper beats (wraps up) rock.
References
• http://en.wikipedia.org/wiki/Rock_paper_scissors
Examples
data(rps)allboards(rps) # just two (of course!)
allboards(rps*3) # four now.
Index
∗Topic arrayallboards, 3aylmer.test, 5good, 13marginals, 16odds.ratio, 17randomprobs, 18
∗Topic datasetschess, 9frogs, 10gear, 11glass, 11icons, 14iqd, 15purum, 18rps, 20
∗Topic mathas.pairwise, 4
∗Topic packageaylmer-package, 2
.Cargs (marginals), 16
allboardprobs, 16allboardprobs (allboards), 3allboards, 3allprobs (allboards), 3as.board (marginals), 16as.pairwise, 4aylmer (aylmer-package), 2aylmer-package, 2aylmer.function (aylmer.test), 5aylmer.test, 4, 5, 5, 20
best, 4, 8, 20board-class (allboards), 3
candidate (randomprobs), 18chess, 9
dof (marginals), 16
fisher.test, 7frogs, 10
gear, 11Glass (glass), 11glass, 11Glass.all (glass), 11glass.all (glass), 11good, 13
icons, 14Industrial (iqd), 15industrial (iqd), 15iqd, 15is.1dof (allboards), 3is.board (marginals), 16
Khulen (purum), 18khulen (purum), 18
marginals, 4, 16maxlike (allboards), 3
no.of.boards, 13no.of.boards (allboards), 3
odds.ratio, 17optim, 8
prob, 8prob (aylmer.test), 5Purum (purum), 18purum, 10, 18pval.1dof, 17pval.1dof (aylmer.test), 5
randomboards (randomprobs), 18randomprobs, 7, 18rock-paper-scissors (rps), 20rps, 9, 20
shifts (iqd), 15
21