pafr-fy2011-r6
DESCRIPTION
POPULAR ANNUAL FINANCIAL REPORT For Fiscal Year Ended June 30, 2011TRANSCRIPT

CITIZENS’ GUIDE
POPULAR ANNUAL FINANCIAL REPORT
For Fiscal Year Ended June 30, 2011
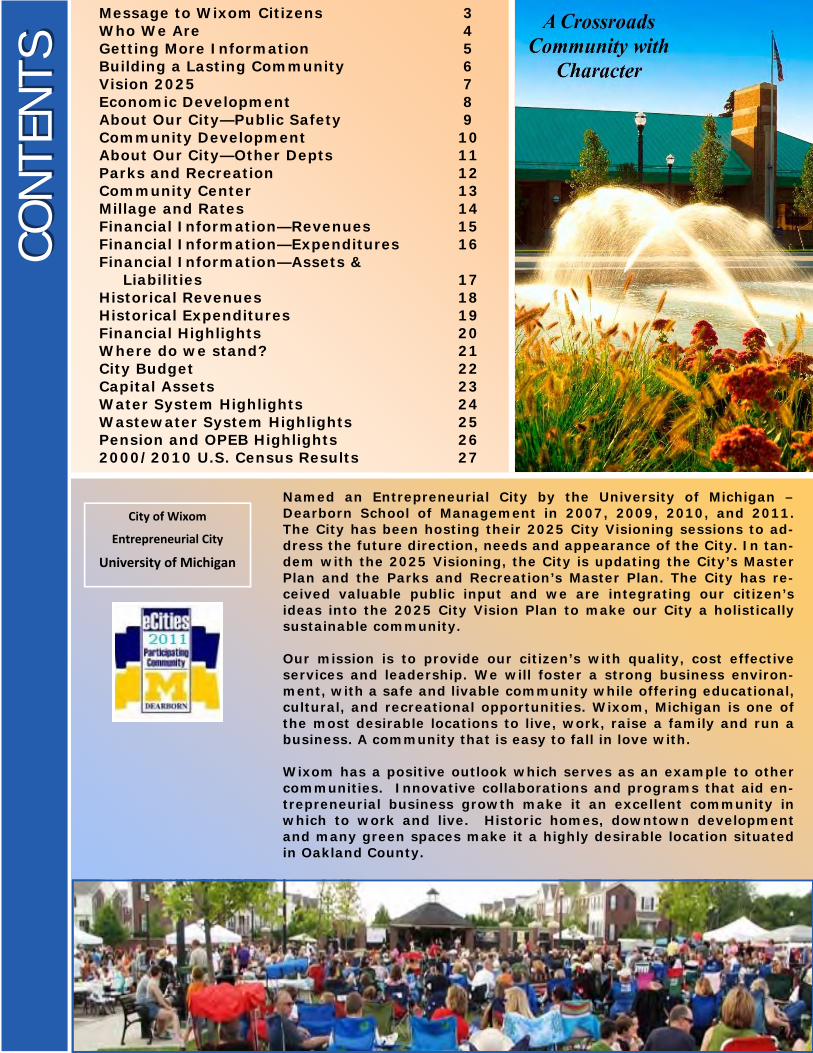
Message to Wixom Citizens 3 Who We Are 4 Getting More Information 5 Building a Lasting Community 6 Vision 2025 7 Economic Development 8 About Our City—Public Safety 9 Community Development 10 About Our City—Other Depts 11 Parks and Recreation 12 Community Center 13 Millage and Rates 14 Financial Information—Revenues 15 Financial Information—Expenditures 16 Financial Information—Assets & Liabilities 17 Historical Revenues 18 Historical Expenditures 19 Financial Highlights 20 Where do we stand? 21 City Budget 22 Capital Assets 23 Water System Highlights 24 Wastewater System Highlights 25 Pension and OPEB Highlights 26 2000/2010 U.S. Census Results 27
Named an Entrepreneurial City by the University of Michigan – Dearborn School of Management in 2007, 2009, 2010, and 2011. The City has been hosting their 2025 City Visioning sessions to ad-dress the future direction, needs and appearance of the City. In tan-dem with the 2025 Visioning, the City is updating the City’s Master Plan and the Parks and Recreation’s Master Plan. The City has re-ceived valuable public input and we are integrating our citizen’s ideas into the 2025 City Vision Plan to make our City a holistically sustainable community. Our mission is to provide our citizen’s with quality, cost effective services and leadership. We will foster a strong business environ-ment, with a safe and livable community while offering educational, cultural, and recreational opportunities. Wixom, Michigan is one of the most desirable locations to live, work, raise a family and run a business. A community that is easy to fall in love with. Wixom has a positive outlook which serves as an example to other communities. Innovative collaborations and programs that aid en-trepreneurial business growth make it an excellent community in which to work and live. Historic homes, downtown development and many green spaces make it a highly desirable location situated in Oakland County.
CO
NTEN
TS
CO
NTEN
TS
City of Wixom
Entrepreneurial City
University of Michigan
2
December 15, 2011
To the Citizens of the City of Wixom: It is with great pleasure that we present our annual Citizen’s Report for fiscal year ended June 30, 2011. The intent of this report is to offer, in an uncomplicated way, information on how your tax dollars were spent. We hope that this report is useful for you to better determine the City of Wixom’s financial condition. The information provided in this report is derived primarily from the 2011 Comprehensive Annual Financial Report (CAFR). The financial information provided in the CAFR was independently audited by Plante & Moran, PLLC, and was prepared in accordance with generally accepted accounting principles (GAAP). The City has once again re-ceived an unqualified (“clean”) opinion from our auditors which is the highest form of financial assurance that an or-ganization can receive from their audit firm. Unlike the CAFR, this PAFR is unaudited and not prepared in accordance with GAAP. Only the financial data for the primary government is included in this report and all of the City’s discretely presented components units are ex-cluded. Information in this report is condensed and summarized and certain financial statements and note disclosures required by GAAP are not included. A copy of the City’s 2011 CAFR prepared in accordance with GAAP is located on the City’s website at http://www.wixomgov.org. We are honored to have received the Certificate of Achievement for Excellence in Financial Reporting by the Gov-ernment Finance Officers Association for the seventh straight year for the fiscal year ended June 30, 2010 CAFR. A certificate is valid for one year only, and we believe that the City has met the requirements to receive the award for the fiscal year ended June 30, 2011. The City of Wixom is responding to the current economic downturn in the correct way and in a fiscally responsive manner. Providing the highest quality government services to this community, in a cost-effective manner, continues to be our fundamental goal. The City continues to maintain existing services while improving the delivery of those services. We have tightened our belts and found better ways to get the job done. The City of Wixom’s finances continue to be solid. A number of years ago, in a proactive approach to the economic projections, the City adopted a Five Year Fiscal Action Plan. This Plan, which includes a Budget Stabilization Fund, has provided a means to maintain consistency in taxes while avoiding service reductions during the current state of the economy. Partly attributable to the Five Year Action Plan, the State of Michigan Department of Treasury has rated Wixom’s financial strength and future as superior. Only 13.4% of Michigan cities were able to attain this rat-ing. Further, Moody’s has continued to affirm an A1 bond rating for the City citing sound financial operations char-acterized by healthy reserves and prudent fiscal management. Like all communities, the City is not immune to the economic downturn, the decline in property tax values, and the decrease in overall revenues, but the City through its fiscally conservative approach to the City’s finances has provided a sensible plan to deal with the downturn. The City has placed on their website interactive financial tools including a Citizen’s Guide, a City Scorecard, a City Dashboard and further financial data. The Citizen's Guide and Dashboard is the Accountability and Transparency re-quirement under the State of Michigan Economic Vitality Incentive Plan (EVIP). Understanding the current status and future prospect of the City of Wixom's financial health/condition is an integral responsibility of City Council and the professional staff, and is essential to paving the way to prosperity for the generations to come. We hope you find this information interesting and informative. We welcome any feedback and suggestions regarding the information provided in this report. The achievements of the last year are a clear indication of our sustainability and our bright future. Respectfully, J. Michael Dornan Kevin Brady City Manager Finance Director
3
W
HO
WE
ARE
WH
O W
E ARE
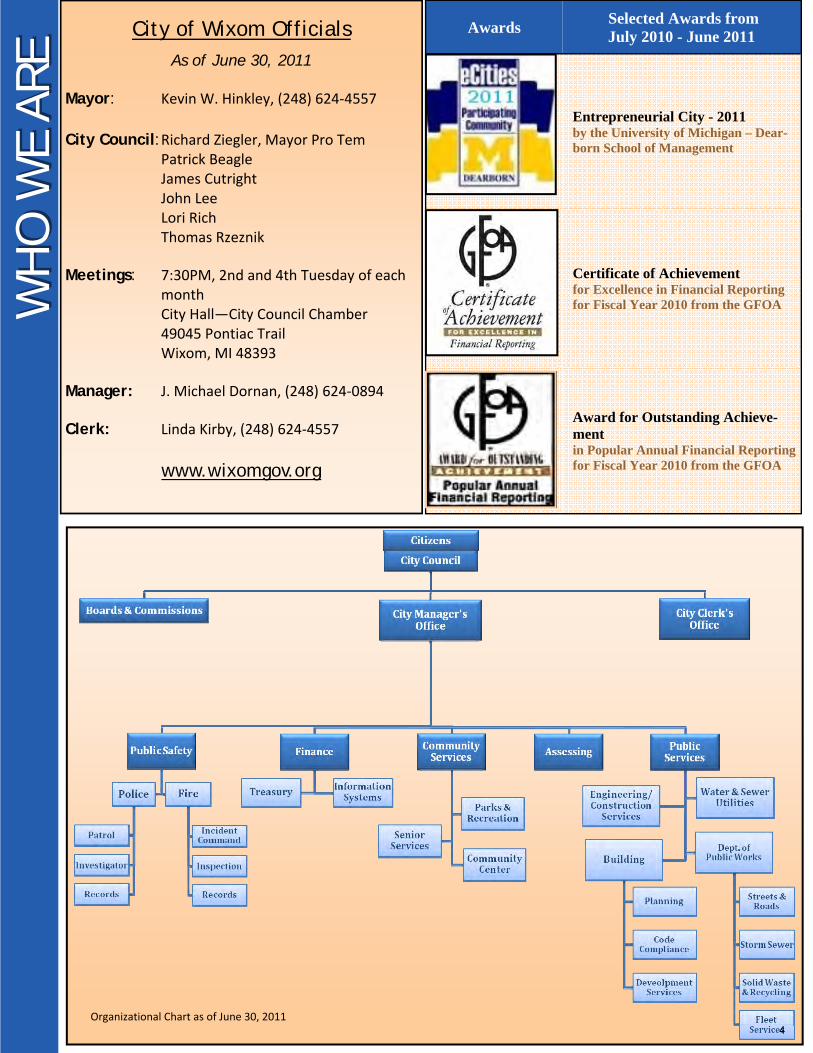
City of Wixom Officials
As of June 30, 2011 Mayor: Kevin W. Hinkley, (248) 624‐4557 City Council: Richard Ziegler, Mayor Pro Tem Patrick Beagle James Cutright John Lee Lori Rich Thomas Rzeznik Meetings: 7:30PM, 2nd and 4th Tuesday of each month City Hall—City Council Chamber 49045 Pontiac Trail Wixom, MI 48393 Manager: J. Michael Dornan, (248) 624‐0894 Clerk: Linda Kirby, (248) 624‐4557
www.wixomgov.org
Organizational Chart as of June 30, 2011
Awards Selected Awards from July 2010 - June 2011
Entrepreneurial City - 2011 by the University of Michigan – Dear-born School of Management
Certificate of Achievement for Excellence in Financial Reporting for Fiscal Year 2010 from the GFOA
Award for Outstanding Achieve-ment in Popular Annual Financial Reporting for Fiscal Year 2010 from the GFOA
4

G
ETTIN
G M
ORE
INFO
RM
AIT
ON
GET
TIN
G M
ORE
INFO
RM
AIT
ON
The City of Wixom’s website is your source to information about City policies, services, and events, available 24 hours per day, seven days a week. Log onto www.wixomgov.org and find information about public meetings, press releases, employment opportunities, community events and much more. Take advantage of many online services through our website.
Ability to check your property taxes
City Council meeting agendas & minutes
Emergency alert notice
Community Calendar
Activity and event Information
City Charter and Code
Business Tools - Economic Development and Film Office
City Hall Department Information, Passports, Permits, Trash & Taxes
Crossroads, Annual Budgets, Citizen’s Guide and CAFR and other publications
Interactive Scorecard & Dashboards
Construction Project Updates
Customizable Home Page
Document / Archive Center - Agendas, Minutes, Applica-tions, Newsletters
Current bid Information
External Links
FAQ's
General Government Information, Mayor and City Council
GIS Maps
Job Postings within the City
News and Announcements
Notify Me / Email Subscription updates
Online Job Application
Online Payments
Opinion Polls
Parks and Recreation Registration
Photo Album
Quick Links
Quick Search
Report a concern
Resident Information - Event and rental information
Resources Directory
Staff Directory
Visitor Information - Parks, maps and trails
Voter Information - Ballots and Precincts
Online Services at www.wixomgov.org
City Staff Directory
City of Wixom Photo Album
Come visit http://www.cityofwixom.phanfare.com/ 5
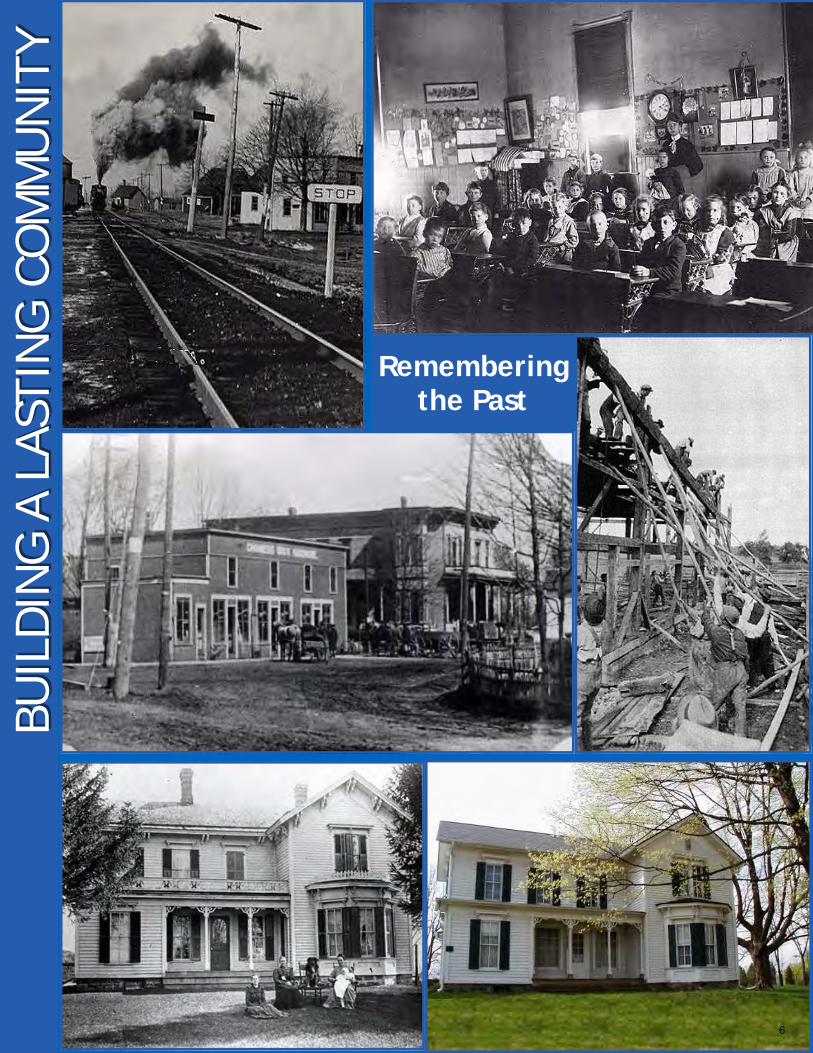
Remembering the Past
BUIL
DIN
G A
LAST
ING
CO
MM
UN
ITY
BUIL
DIN
G A
LAST
ING
CO
MM
UN
ITY
6
V
ISIO
N 2
025
VIS
ION
202
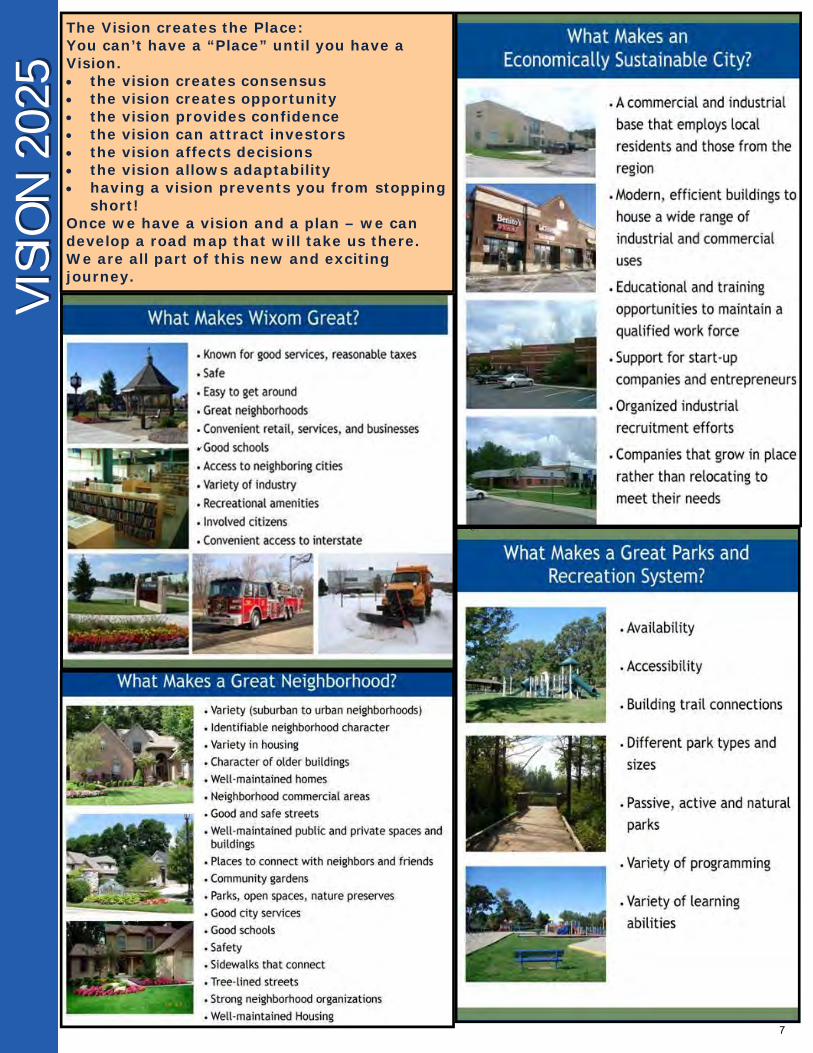
5 The Vision creates the Place: You can’t have a “Place” until you have a Vision. the vision creates consensus the vision creates opportunity the vision provides confidence the vision can attract investors the vision affects decisions the vision allows adaptability having a vision prevents you from stopping
short! Once we have a vision and a plan – we can develop a road map that will take us there. We are all part of this new and exciting journey.
7
ECO
NO
MIC
DEV
ELO
PMEN
TEC
ON
OM
IC D
EVEL
OPM
ENT
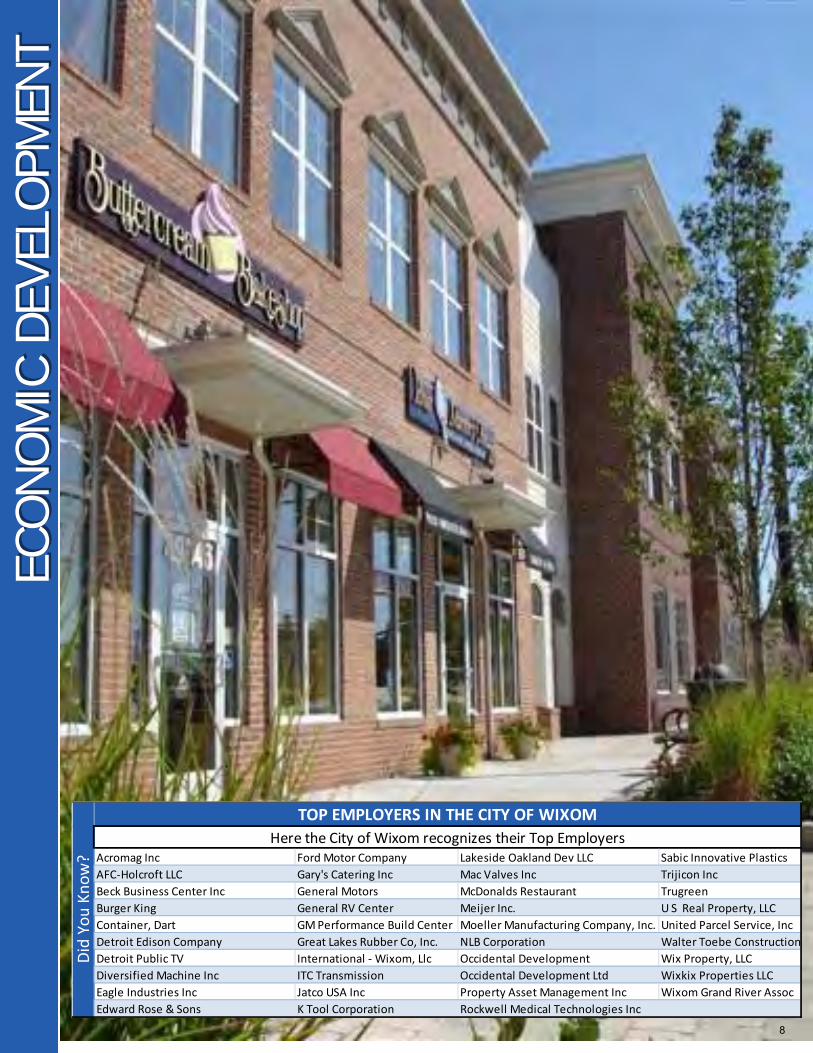
Acromag Inc Ford Motor Company Lakeside Oakland Dev LLC Sabic Innovative Plastics
AFC‐Holcroft LLC Gary's Catering Inc Mac Valves Inc Trijicon Inc
Beck Business Center Inc General Motors McDonalds Restaurant Trugreen
Burger King General RV Center Meijer Inc. U S Real Property, LLC
Container, Dart GM Performance Build Center Moeller Manufacturing Company, Inc. United Parcel Service, Inc
Detroit Edison Company Great Lakes Rubber Co, Inc. NLB Corporation Walter Toebe Construction
Detroit Public TV International ‐ Wixom, Llc Occidental Development Wix Property, LLC
Diversified Machine Inc ITC Transmission Occidental Development Ltd Wixkix Properties LLC
Eagle Industries Inc Jatco USA Inc Property Asset Management Inc Wixom Grand River Assoc
Edward Rose & Sons K Tool Corporation Rockwell Medical Technologies Inc
TOP EMPLOYERS IN THE CITY OF WIXOM
Here the City of Wixom recognizes their Top Employers
Did You Know?
8
ABO
UT
OU
R C
ITY
ABO
UT
OU
R C
ITY
—— P
UBL
IC S
AFE
TY
PUBL
IC S
AFE
TY
PolicePolice
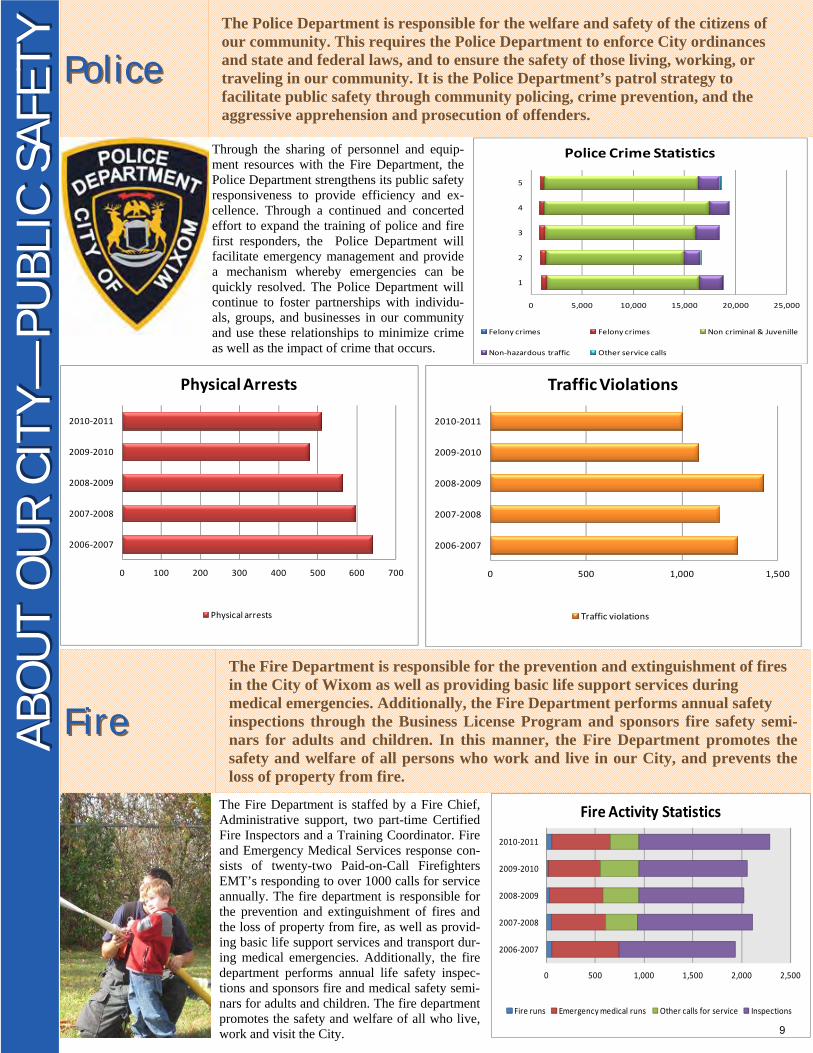
The Police Department is responsible for the welfare and safety of the citizens of our community. This requires the Police Department to enforce City ordinances and state and federal laws, and to ensure the safety of those living, working, or traveling in our community. It is the Police Department’s patrol strategy to facilitate public safety through community policing, crime prevention, and the aggressive apprehension and prosecution of offenders.
Through the sharing of personnel and equip-ment resources with the Fire Department, the Police Department strengthens its public safety responsiveness to provide efficiency and ex-cellence. Through a continued and concerted effort to expand the training of police and fire first responders, the Police Department will facilitate emergency management and provide a mechanism whereby emergencies can be quickly resolved. The Police Department will continue to foster partnerships with individu-als, groups, and businesses in our community and use these relationships to minimize crime as well as the impact of crime that occurs.
FireFire The Fire Department is responsible for the prevention and extinguishment of fires in the City of Wixom as well as providing basic life support services during medical emergencies. Additionally, the Fire Department performs annual safety inspections through the Business License Program and sponsors fire safety semi-nars for adults and children. In this manner, the Fire Department promotes the safety and welfare of all persons who work and live in our City, and prevents the loss of property from fire.
The Fire Department is staffed by a Fire Chief, Administrative support, two part-time Certified Fire Inspectors and a Training Coordinator. Fire and Emergency Medical Services response con-sists of twenty-two Paid-on-Call Firefighters EMT’s responding to over 1000 calls for service annually. The fire department is responsible for the prevention and extinguishment of fires and the loss of property from fire, as well as provid-ing basic life support services and transport dur-ing medical emergencies. Additionally, the fire department performs annual life safety inspec-tions and sponsors fire and medical safety semi-nars for adults and children. The fire department promotes the safety and welfare of all who live, work and visit the City.
0 100 200 300 400 500 600 700
2006‐2007
2007‐2008
2008‐2009
2009‐2010
2010‐2011
Physical Arrests
Physical arrests
0 500 1,000 1,500 2,000 2,500
2006‐2007
2007‐2008
2008‐2009
2009‐2010
2010‐2011
Fire Activity Statistics
Fire runs Emergency medical runs Other calls for service Inspections
0 500 1,000 1,500
2006‐2007
2007‐2008
2008‐2009
2009‐2010
2010‐2011
Traffic Violations
Traffic violations
0 5,000 10,000 15,000 20,000 25,000
1
2
3
4
5
Police Crime Statistics
Felony crimes Felony crimes Non criminal & Juvenille
Non‐hazardous traffic Other service calls
9
CO
MM
UN
ITY
DEV
ELO
PMEN
TCO
MM
UN
ITY
DEV
ELO
PMEN
T
10

ABO
UT
OU
R C
ITY
ABO
UT
OU
R C
ITY
—— O
TH
ER D
EPTS
OTH
ER D
EPTS
BuildingBuilding The Building Department is responsible for ensuring that all work performed for new construction, rehabilitation and demolition is carried out with the materials and methods that conform to approved site plans and the appropriate federal state and local building codes including the review of plans and permit applications for build-ing electrical, plumbing, mechanical, sewers signs, and other permits required by the City as well as obtaining required easements.
The Building Department is also responsible for all coordination and administration of the Planning Commission, Zoning Board of Ap-peals, Construction Board of Appeals, Property Maintenance and Code Enforcement. The Staff routinely provides data and reports to City Departments and represents the City in meetings with developers and landowners.
Public Public WorksWorks
The Department of Public Works is responsible for planning and delivery of the ba-sic day-to-day public services that have become part of our daily life. Key objectives include maintenance and repair of a public infrastructure system. Specifically, ser-vices include maintenance of all City streets, buildings and grounds, public parks, sidewalks and bike paths, traffic control, street lights, vehicle and construction/maintenance equipment, street sweeping, roadside/park/cemetery mowing and snow removal and ice control.
As the City continues to grow, mature, and encounters an increasing request for service, the Department of Public Works continues to implement time and labor saving measures through multi-use equipment and operational improvements. The DPW is also responsible for providing the contractual oversight of the water and wastewater systems, refuse collec-tion, recycling programs, and storm water management.
0
50
100
150
200
250
300
350
400
2006 2007 2008 2009 2010 2011
City of Wixom ‐ Permits issued
Permits issued‐Residential Pemits issued‐Comm & Indust
0
20,000
40,000
60,000
80,000
100,000
120,000
140,000
160,000
180,000
200,000
2006 2007 2008 2009 2010 2011
City of Wixom ‐ Permit Revenue
Residential Permit Revenue Comm & Indust Permit Revenue
0
5,000,000
10,000,000
15,000,000
20,000,000
25,000,000
2006 2007 2008 2009 2010 2011
City of Wixom ‐ Estimated Value of Construction
Residential Estimated Value Comm & Indust Estimated Value
22%
78%
Roads ‐Major (10 miles) and Local (36 miles)
Miles of street (Major) Miles of street (Local)
11
PARKS
AN
D R
ECREA
TIO
NPA
RKS
AN
D R
ECREA
TIO
N
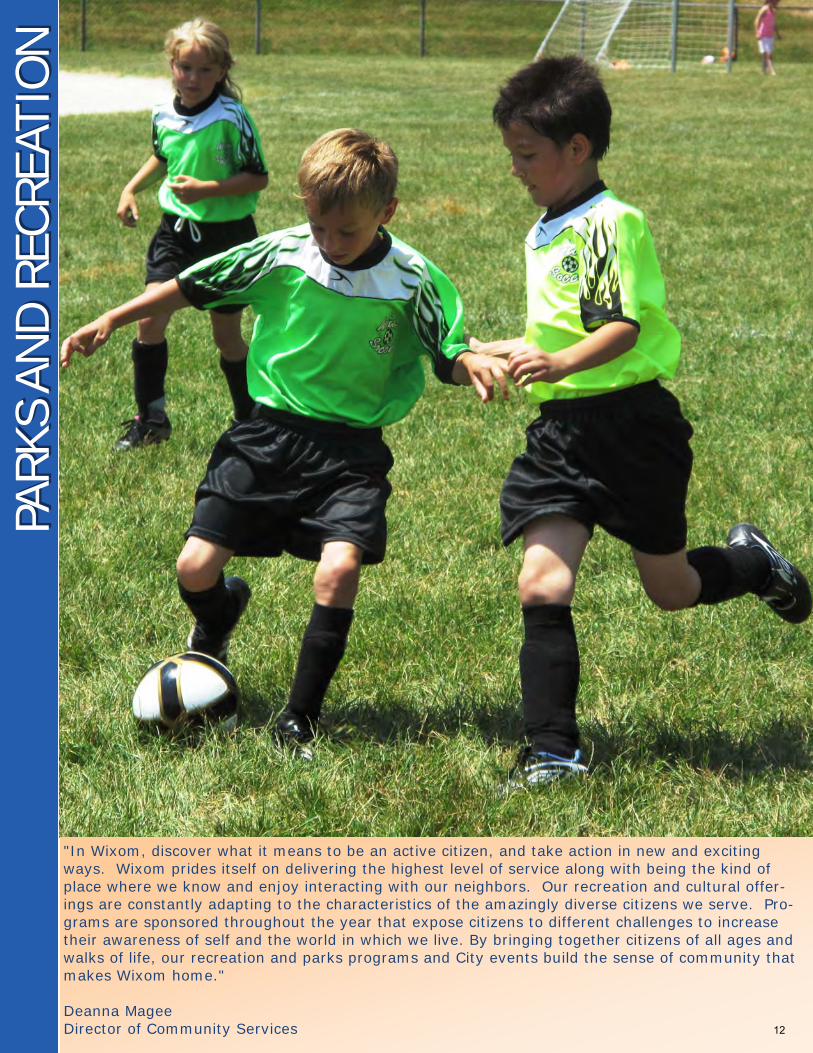
"In Wixom, discover what it means to be an active citizen, and take action in new and exciting ways. Wixom prides itself on delivering the highest level of service along with being the kind of place where we know and enjoy interacting with our neighbors. Our recreation and cultural offer-ings are constantly adapting to the characteristics of the amazingly diverse citizens we serve. Pro-grams are sponsored throughout the year that expose citizens to different challenges to increase their awareness of self and the world in which we live. By bringing together citizens of all ages and walks of life, our recreation and parks programs and City events build the sense of community that makes Wixom home." Deanna Magee Director of Community Services
12
CO
MM
UN
ITY
CEN
TER
CO
MM
UN
ITY
CEN
TER
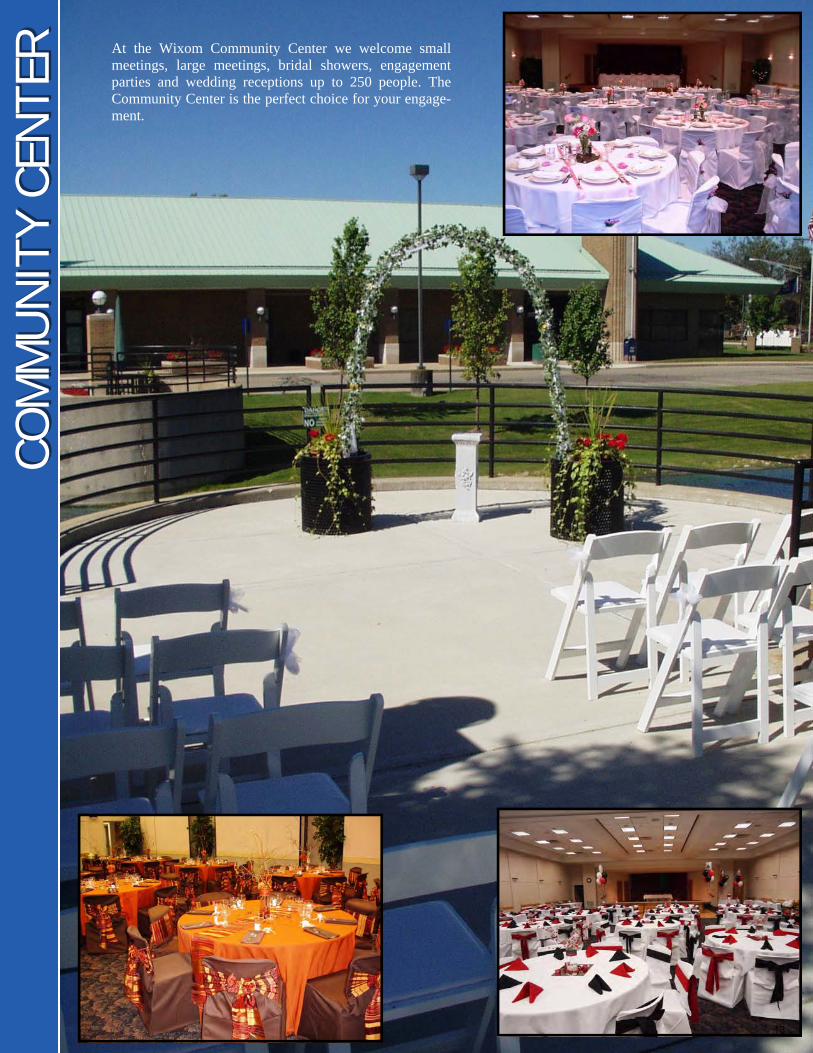
At the Wixom Community Center we welcome small meetings, large meetings, bridal showers, engagement parties and wedding receptions up to 250 people. The Community Center is the perfect choice for your engage-ment.
13
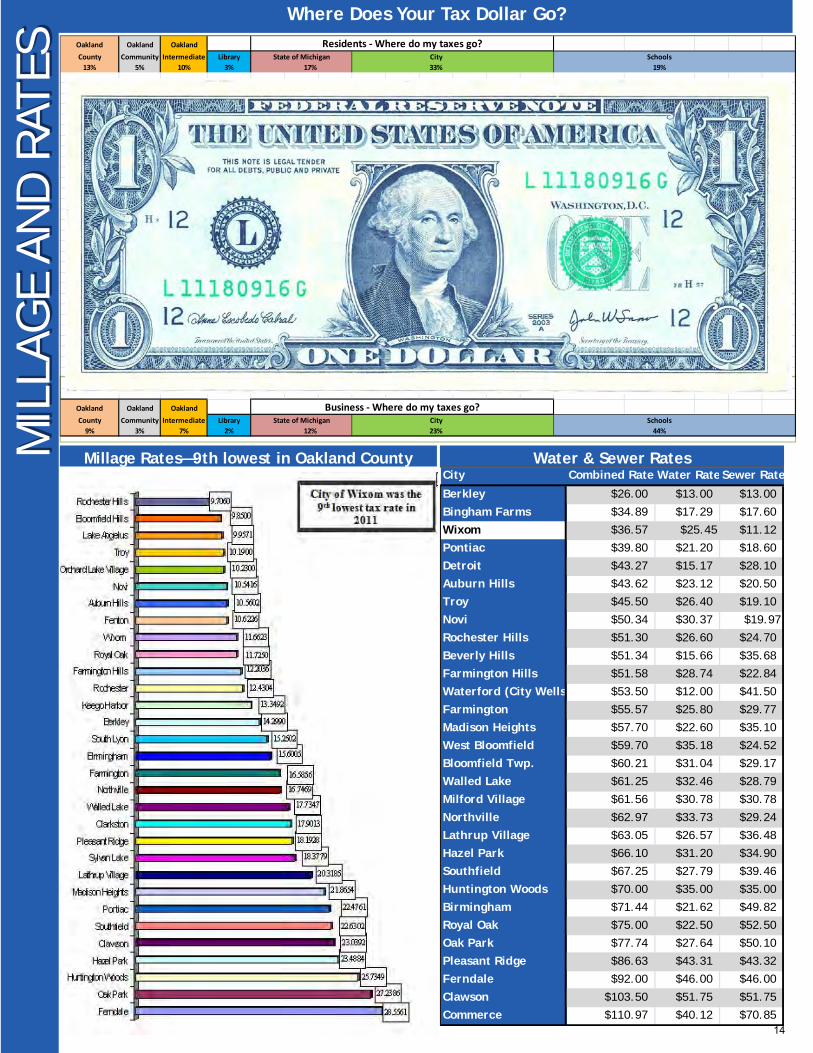
Where Does Your Tax Dollar Go?
Millage Rates—9th lowest in Oakland County
M
ILLA
GE
AN
D R
ATES
MIL
LAG
E AN
D R
ATES
Water & Sewer Rates City Combined RatesWater RateSewer Rate
Berkley $26.00 $13.00 $13.00
Bingham Farms $34.89 $17.29 $17.60
Wixom $36.57 $25.45 $11.12
Pontiac $39.80 $21.20 $18.60
Detroit $43.27 $15.17 $28.10
Auburn Hills $43.62 $23.12 $20.50
Troy $45.50 $26.40 $19.10
Novi $50.34 $30.37 $19.97
Rochester Hills $51.30 $26.60 $24.70
Beverly Hills $51.34 $15.66 $35.68
Farmington Hills $51.58 $28.74 $22.84
Waterford (City Wells $53.50 $12.00 $41.50
Farmington $55.57 $25.80 $29.77
Madison Heights $57.70 $22.60 $35.10
West Bloomfield $59.70 $35.18 $24.52
Bloomfield Twp. $60.21 $31.04 $29.17
Walled Lake $61.25 $32.46 $28.79
Milford Village $61.56 $30.78 $30.78
Northville $62.97 $33.73 $29.24
Lathrup Village $63.05 $26.57 $36.48
Hazel Park $66.10 $31.20 $34.90
Southfield $67.25 $27.79 $39.46
Huntington Woods $70.00 $35.00 $35.00
Birmingham $71.44 $21.62 $49.82
Royal Oak $75.00 $22.50 $52.50
Oak Park $77.74 $27.64 $50.10
Pleasant Ridge $86.63 $43.31 $43.32
Ferndale $92.00 $46.00 $46.00
Clawson $103.50 $51.75 $51.75
Commerce $110.97 $40.12 $70.85
Oakland Oakland Oakland
County Community Intermediate Library City Schools
13% 5% 10% 3% 17% 33% 19%
Oakland Oakland Oakland
County Community Intermediate Library City Schools
9% 3% 7% 2% 12% 23% 44%
State of Michigan
Residents ‐ Where do my taxes go?
Business ‐ Where do my taxes go?State of Michigan
14
Governmental Activities
The governmental activities are the main operating activities for a city. Most city expenditures and revenues are accounted for in the general fund. In this section we will break down the revenues and expenditures of the governmental activities for the City of Wixom.
The following further breaks down revenues earned from charges for services for 2010, 2011, and the percentage change between the two years. These are revenues earned from charges paid by citizens for services provided by the city; they are not taxes collected by the city.
FIN
AN
CIA
L IN
FORM
ATIO
NFI
NAN
CIA
L IN
FORM
ATIO
N
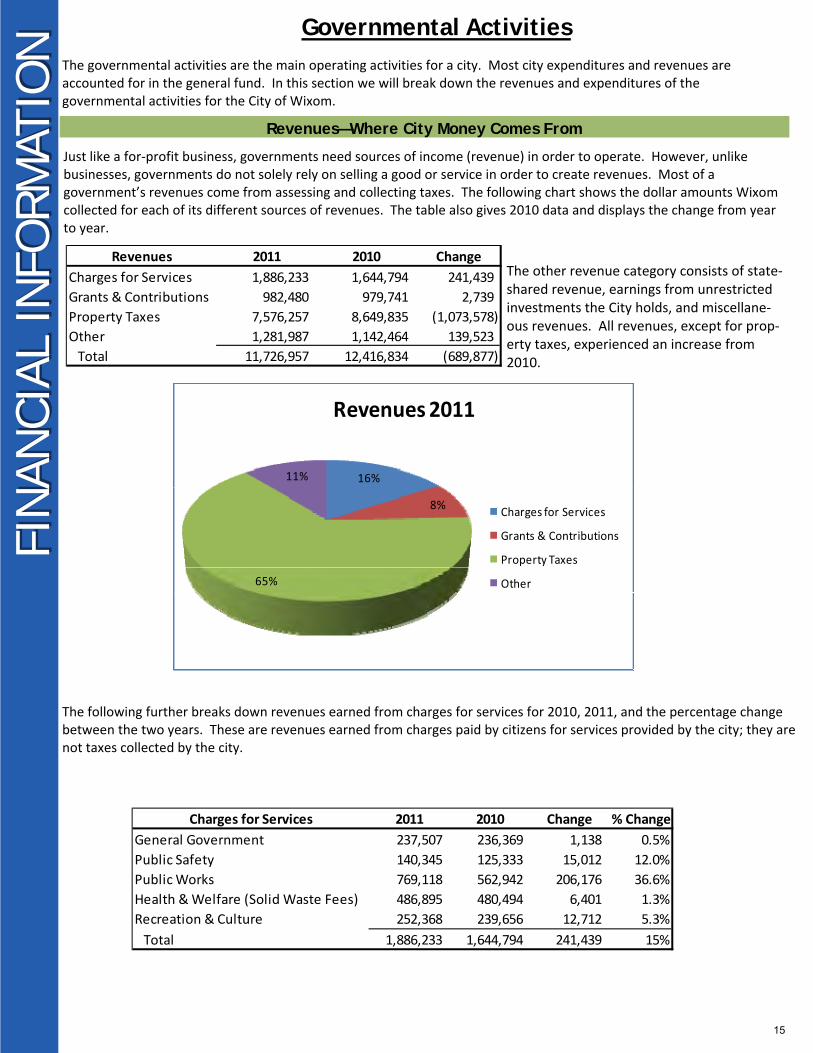
The other revenue category consists of state‐shared revenue, earnings from unrestricted investments the City holds, and miscellane‐ous revenues. All revenues, except for prop‐erty taxes, experienced an increase from 2010.
Just like a for‐profit business, governments need sources of income (revenue) in order to operate. However, unlike businesses, governments do not solely rely on selling a good or service in order to create revenues. Most of a government’s revenues come from assessing and collecting taxes. The following chart shows the dollar amounts Wixom collected for each of its different sources of revenues. The table also gives 2010 data and displays the change from year to year.
Revenues—Where City Money Comes From
Revenues 2011 2010 Change
Charges for Services 1,886,233 1,644,794 241,439
Grants & Contributions 982,480 979,741 2,739
Property Taxes 7,576,257 8,649,835 (1,073,578)
Other 1,281,987 1,142,464 139,523
Total 11,726,957 12,416,834 (689,877)
16%
8%
65%
11%
Revenues 2011
Charges for Services
Grants & Contributions
Property Taxes
Other
Charges for Services 2011 2010 Change % Change
General Government 237,507 236,369 1,138 0.5%
Public Safety 140,345 125,333 15,012 12.0%
Public Works 769,118 562,942 206,176 36.6%
Health & Welfare (Solid Waste Fees) 486,895 480,494 6,401 1.3%
Recreation & Culture 252,368 239,656 12,712 5.3%
Total 1,886,233 1,644,794 241,439 15%
15
FIN
AN
CIA
L IN
FORM
ATIO
NFI
NAN
CIA
L IN
FORM
ATIO
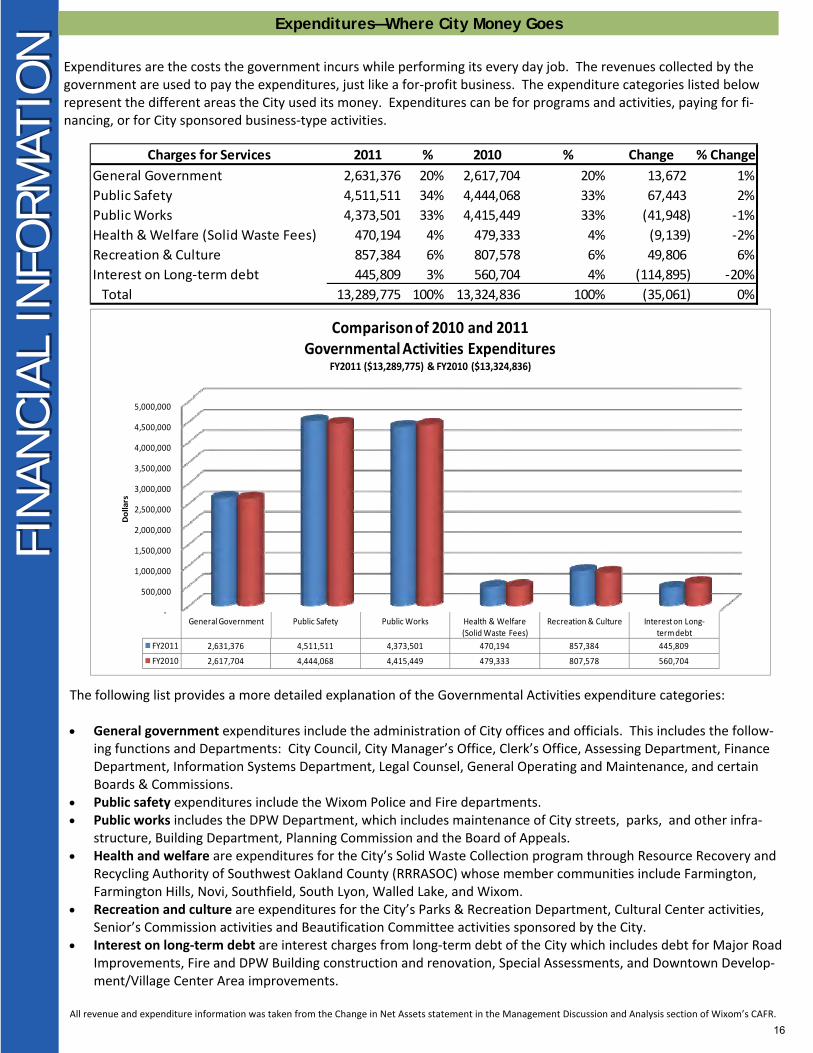
N Expenditures—Where City Money Goes
Expenditures are the costs the government incurs while performing its every day job. The revenues collected by the government are used to pay the expenditures, just like a for‐profit business. The expenditure categories listed below represent the different areas the City used its money. Expenditures can be for programs and activities, paying for fi‐nancing, or for City sponsored business‐type activities.
The following list provides a more detailed explanation of the Governmental Activities expenditure categories: General government expenditures include the administration of City offices and officials. This includes the follow‐
ing functions and Departments: City Council, City Manager’s Office, Clerk’s Office, Assessing Department, Finance Department, Information Systems Department, Legal Counsel, General Operating and Maintenance, and certain Boards & Commissions.
Public safety expenditures include the Wixom Police and Fire departments. Public works includes the DPW Department, which includes maintenance of City streets, parks, and other infra‐
structure, Building Department, Planning Commission and the Board of Appeals. Health and welfare are expenditures for the City’s Solid Waste Collection program through Resource Recovery and
Recycling Authority of Southwest Oakland County (RRRASOC) whose member communities include Farmington, Farmington Hills, Novi, Southfield, South Lyon, Walled Lake, and Wixom.
Recreation and culture are expenditures for the City’s Parks & Recreation Department, Cultural Center activities, Senior’s Commission activities and Beautification Committee activities sponsored by the City.
Interest on long‐term debt are interest charges from long‐term debt of the City which includes debt for Major Road Improvements, Fire and DPW Building construction and renovation, Special Assessments, and Downtown Develop‐ment/Village Center Area improvements.
All revenue and expenditure information was taken from the Change in Net Assets statement in the Management Discussion and Analysis section of Wixom’s CAFR.
Charges for Services 2011 % 2010 % Change % Change
General Government 2,631,376 20% 2,617,704 20% 13,672 1%
Public Safety 4,511,511 34% 4,444,068 33% 67,443 2%
Public Works 4,373,501 33% 4,415,449 33% (41,948) ‐1%
Health & Welfare (Solid Waste Fees) 470,194 4% 479,333 4% (9,139) ‐2%
Recreation & Culture 857,384 6% 807,578 6% 49,806 6%
Interest on Long‐term debt 445,809 3% 560,704 4% (114,895) ‐20%
Total 13,289,775 100% 13,324,836 100% (35,061) 0%
‐
500,000
1,000,000
1,500,000
2,000,000
2,500,000
3,000,000
3,500,000
4,000,000
4,500,000
5,000,000
General Government Public Safety Public Works Health & Welfare (Solid Waste Fees)
Recreation & Culture Interest on Long‐term debt
FY2011 2,631,376 4,511,511 4,373,501 470,194 857,384 445,809
FY2010 2,617,704 4,444,068 4,415,449 479,333 807,578 560,704
Dollars
Comparison of 2010 and 2011Governmental Activities Expenditures
FY2011 ($13,289,775) & FY2010 ($13,324,836)
16
FIN
AN
CIA
L IN
FORM
ATIO
NFI
NAN
CIA
L IN
FORM
ATIO
N
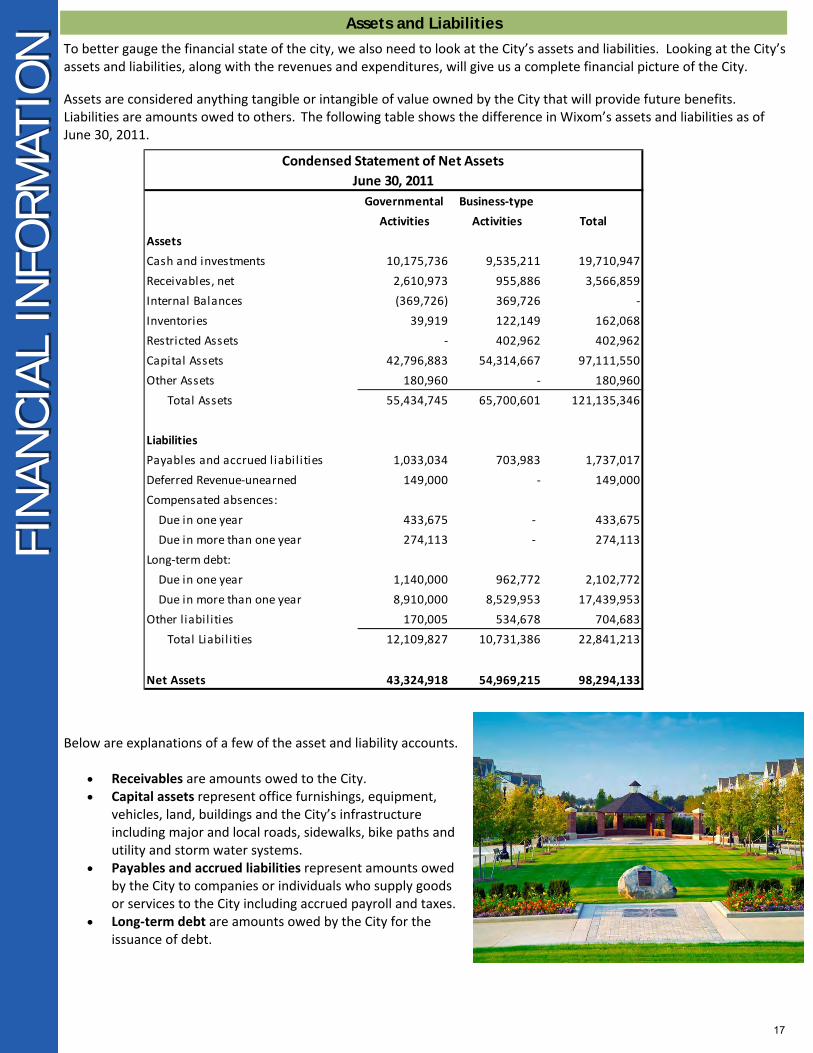
Assets and Liabilities
To better gauge the financial state of the city, we also need to look at the City’s assets and liabilities. Looking at the City’s assets and liabilities, along with the revenues and expenditures, will give us a complete financial picture of the City.
Assets are considered anything tangible or intangible of value owned by the City that will provide future benefits. Liabilities are amounts owed to others. The following table shows the difference in Wixom’s assets and liabilities as of June 30, 2011.
Below are explanations of a few of the asset and liability accounts.
Receivables are amounts owed to the City. Capital assets represent office furnishings, equipment, vehicles, land, buildings and the City’s infrastructure including major and local roads, sidewalks, bike paths and utility and storm water systems. Payables and accrued liabilities represent amounts owed
by the City to companies or individuals who supply goods or services to the City including accrued payroll and taxes.
Long‐term debt are amounts owed by the City for the issuance of debt.
Governmental Business‐type
Activities Activities Total
Assets
Cash and investments 10,175,736 9,535,211 19,710,947
Receivables, net 2,610,973 955,886 3,566,859
Internal Balances (369,726) 369,726 ‐
Inventories 39,919 122,149 162,068
Restricted Assets ‐ 402,962 402,962
Capital Assets 42,796,883 54,314,667 97,111,550
Other Assets 180,960 ‐ 180,960
Total Assets 55,434,745 65,700,601 121,135,346
Liabilities
Payables and accrued l iabilities 1,033,034 703,983 1,737,017
Deferred Revenue‐unearned 149,000 ‐ 149,000
Compensated absences:
Due in one year 433,675 ‐ 433,675
Due in more than one year 274,113 ‐ 274,113
Long‐term debt:
Due in one year 1,140,000 962,772 2,102,772
Due in more than one year 8,910,000 8,529,953 17,439,953
Other l iabil ities 170,005 534,678 704,683
Total Liabil ities 12,109,827 10,731,386 22,841,213
Net Assets 43,324,918 54,969,215 98,294,133
Condensed Statement of Net Assets
June 30, 2011
17
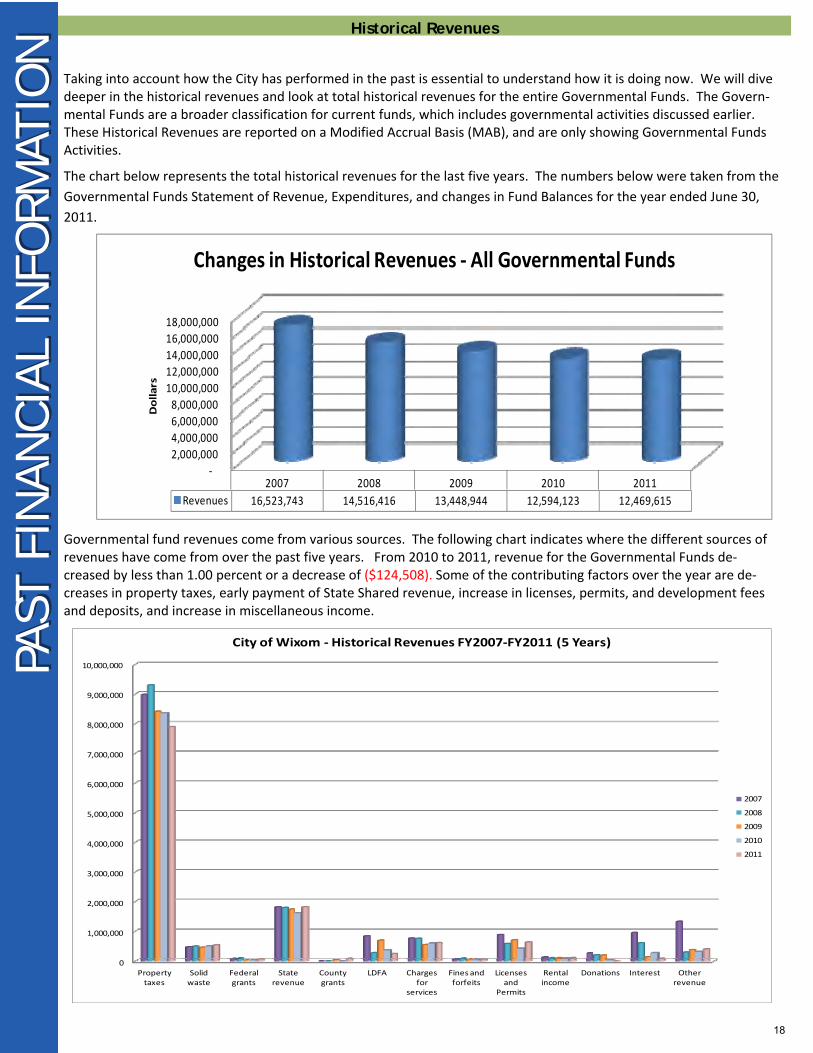
Taking into account how the City has performed in the past is essential to understand how it is doing now. We will dive deeper in the historical revenues and look at total historical revenues for the entire Governmental Funds. The Govern‐mental Funds are a broader classification for current funds, which includes governmental activities discussed earlier. These Historical Revenues are reported on a Modified Accrual Basis (MAB), and are only showing Governmental Funds Activities.
The chart below represents the total historical revenues for the last five years. The numbers below were taken from the
Governmental Funds Statement of Revenue, Expenditures, and changes in Fund Balances for the year ended June 30,
2011.
Historical Revenues
PA
STPA
ST F
INAN
CIA
L IN
FORM
ATIO
NFI
NAN
CIA
L IN
FORM
ATIO
N
Governmental fund revenues come from various sources. The following chart indicates where the different sources of revenues have come from over the past five years. From 2010 to 2011, revenue for the Governmental Funds de‐creased by less than 1.00 percent or a decrease of ($124,508). Some of the contributing factors over the year are de‐creases in property taxes, early payment of State Shared revenue, increase in licenses, permits, and development fees and deposits, and increase in miscellaneous income.
‐
2,000,000
4,000,000
6,000,000
8,000,000
10,000,000
12,000,000
14,000,000
16,000,000
18,000,000
2007 2008 2009 2010 2011
Revenues 16,523,743 14,516,416 13,448,944 12,594,123 12,469,615
Dollars
Changes in Historical Revenues ‐ All Governmental Funds
0
1,000,000
2,000,000
3,000,000
4,000,000
5,000,000
6,000,000
7,000,000
8,000,000
9,000,000
10,000,000
Property taxes
Solid waste
Federal grants
State revenue
County grants
LDFA Charges for
services
Fines and forfeits
Licenses and
Permits
Rental income
Donations Interest Other revenue
City of Wixom ‐ Historical Revenues FY2007‐FY2011 (5 Years)
2007
2008
2009
2010
2011
18
PAST
PAST
FIN
AN
CIA
L IN
FORM
ATIO
NFI
NAN
CIA
L IN
FORM
ATIO
N Historical Expenditures
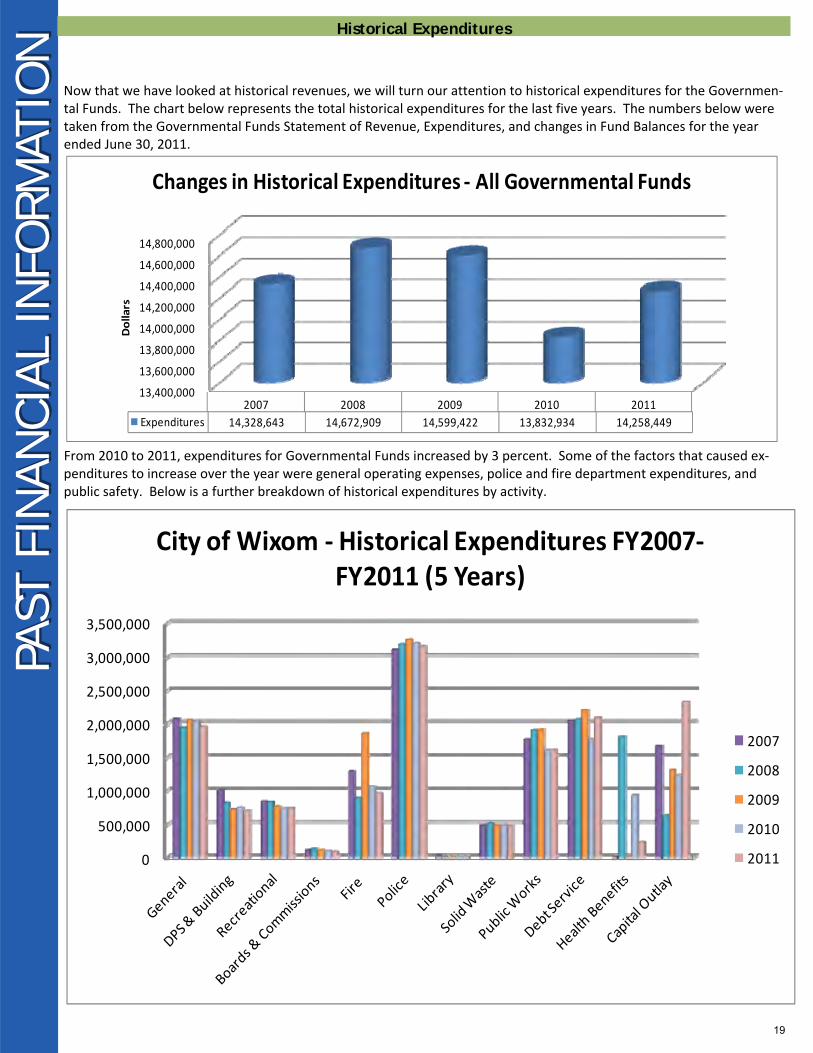
Now that we have looked at historical revenues, we will turn our attention to historical expenditures for the Governmen‐tal Funds. The chart below represents the total historical expenditures for the last five years. The numbers below were taken from the Governmental Funds Statement of Revenue, Expenditures, and changes in Fund Balances for the year ended June 30, 2011.
From 2010 to 2011, expenditures for Governmental Funds increased by 3 percent. Some of the factors that caused ex‐penditures to increase over the year were general operating expenses, police and fire department expenditures, and public safety. Below is a further breakdown of historical expenditures by activity.
0
500,000
1,000,000
1,500,000
2,000,000
2,500,000
3,000,000
3,500,000
City of Wixom ‐ Historical Expenditures FY2007‐FY2011 (5 Years)
2007
2008
2009
2010
2011
13,400,000
13,600,000
13,800,000
14,000,000
14,200,000
14,400,000
14,600,000
14,800,000
2007 2008 2009 2010 2011
Expenditures 14,328,643 14,672,909 14,599,422 13,832,934 14,258,449
Dollars
Changes in Historical Expenditures ‐ All Governmental Funds
19
F
INAN
CIA
L H
IGH
LIG
HTS
FIN
AN
CIA
L H
IGH
LIG
HTS
Other Important Financial Information and Recap
The following represents the most significant financial highlights for the fiscal year ended June 30, 2011:
The current assets of the City’s governmental activities exceed its current liabilities at the close of June 30, 2011 by $12,597,943.
The current assets of the City’s business‐type activities exceed its current liabilities at the close of June 30, 2011 by $10,982,972.
The City’s total debt during the fiscal year decreased from $22,105,678 to $19,542,725, a decrease of $2,562,953, which represents payments of out‐standing debt.
At the close of the current fiscal year, the City’s governmental funds reported combined ending fund balances of $9,573,342, a decrease of ($1,788,834). The decrease in fund balance is primarily due to total expenditures exceeding total revenues for all govern‐mental funds by ($1,788,834), which provided re‐sources for assistance in Local Roads Capital Program to be used for road projects ($1,898,084), assistance in funding of capital improvement projects through the City’s five year capital improvement plan, payments from Special Agency Fund, and the payment of debt service.
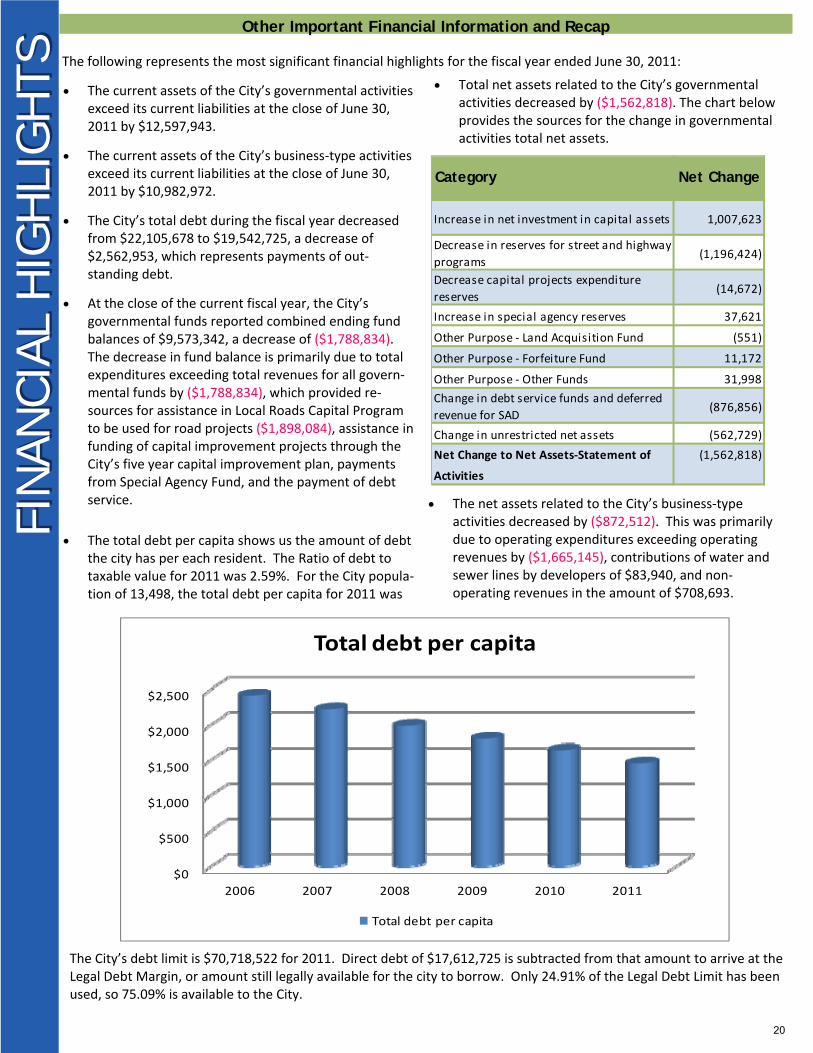
The total debt per capita shows us the amount of debt the city has per each resident. The Ratio of debt to taxable value for 2011 was 2.59%. For the City popula‐tion of 13,498, the total debt per capita for 2011 was
Total net assets related to the City’s governmental activities decreased by ($1,562,818). The chart below provides the sources for the change in governmental activities total net assets.
The net assets related to the City’s business‐type activities decreased by ($872,512). This was primarily due to operating expenditures exceeding operating revenues by ($1,665,145), contributions of water and sewer lines by developers of $83,940, and non‐operating revenues in the amount of $708,693.
The City’s debt limit is $70,718,522 for 2011. Direct debt of $17,612,725 is subtracted from that amount to arrive at the Legal Debt Margin, or amount still legally available for the city to borrow. Only 24.91% of the Legal Debt Limit has been used, so 75.09% is available to the City.
Category Net Change
Increase in net investment in capital assets 1,007,623
Decrease in reserves for street and highway
programs (1,196,424)
Decrease capital projects expenditure
reserves (14,672)
Increase in special agency reserves 37,621
Other Purpose ‐ Land Acquisition Fund (551)
Other Purpose ‐ Forfeiture Fund 11,172
Other Purpose ‐ Other Funds 31,998
Change in debt service funds and deferred
revenue for SAD (876,856)
Change in unrestricted net assets (562,729)
Net Change to Net Assets‐Statement of (1,562,818)
Activities
$0
$500
$1,000
$1,500
$2,000
$2,500
2006 2007 2008 2009 2010 2011
Total debt per capita
Total debt per capita
20

WH
ERE
DO
WE
STAN
D?
WH
ERE
DO
WE
STAN
D?
State Shared Revenue
Though the State increased their income tax rate from 3.9% to 4.35% and raised their sales tax to 6% on certain services, the State still has severe budget problems. On March 21, 2011, Governor Snyder announced in his letter to the Michigan Legislature that he has proposed the statutory revenue sharing program be discontinued and replaced with the new Economic Vitality Incentive Program. Funding for the first year is expected to limit allocation to communities that are expected to receive over $6,000 of the new reduced funding under the existing formula. Communities must qualify for this funding by meeting certain requirements based on best practices and implementing reforms. The City complied with State requirements by producing a Citizen’s Guide to their finances, as well as a “Dashboard” and Scoreboard for FY2010. Citizens of the City of Wixom can look forward to greater transparency and understanding through these documents. The City of Wixom has also adopted a multi‐year budget for fiscal years 2012 and 2013.
Tax Mix
The diverse tax mix of residential, manufacturing, office, service, technology, and retail recreational centers reduces Wixom’s impact of adverse economic cycles and provides a stable environ‐ment for new investment. The City also continues to have a strong, diversified tax base. A total of 38% of the tax roll is residential and apartments. The remaining 62% is nonresidential, composed of 31% commercial, 14% industrial and 17% personal property. The City is approximately 80 percent developed.
Property Taxes Property taxes were collected from the following (ordered from most to least) during the past 10 years:
1. Residential 2. Industrial 3. Personal 4. Commercial 5. IFT 6. Agricultural (None collected since 2007)
0
200,000
400,000
600,000
800,000
1,000,000
1,200,000
1,400,000
1,600,000
2001 2002 2003 2004 2005 2006 2007 2008 2009 2010 2011
Dollars
10/31/2001 10/31/2002 10/31/2003 10/31/2004 10/31/2005 10/31/2006 10/31/2007 10/31/2008 10/31/2009 10/31/2010 10/31/2011
Statutory 511,469 460,228 384,318 265,494 232,197 204,406 190,121 160,349 160,349 78,092 67,360
Constitutional 860,664 869,432 884,153 874,548 895,419 910,663 891,741 921,513 869,098 837,498 848,230
Total 1,372,133 1,329,660 1,268,471 1,140,042 1,127,616 1,115,069 1,081,862 1,081,862 1,029,447 915,590 915,590
City of Wixom ‐ State Shared Rvenue
Residential 38%
Commerical
31%
Industrial14%
Personal Property17%
City of Wixom ‐ Tax Mix
Residential Commerical Industrial Personal Property
0
200,000,000
400,000,000
600,000,000
800,000,000
1,000,000,000
1,200,000,000
2007 2008 2009 2010 2011
Property Tax Levy
Personal
IFT
Industrial
Commerical
Residential
21
CIT
Y BU
DG
ETCIT
Y BU
DG
ET
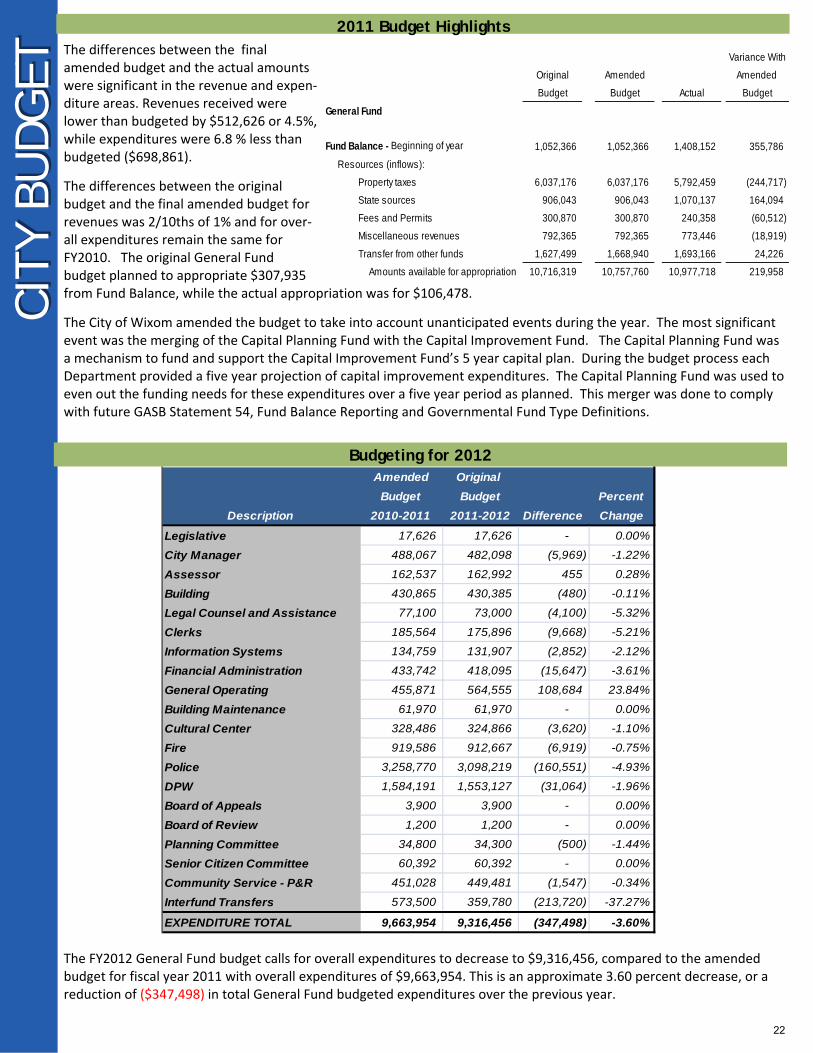
The FY2012 General Fund budget calls for overall expenditures to decrease to $9,316,456, compared to the amended budget for fiscal year 2011 with overall expenditures of $9,663,954. This is an approximate 3.60 percent decrease, or a reduction of ($347,498) in total General Fund budgeted expenditures over the previous year.
2011 Budget Highlights The differences between the final amended budget and the actual amounts were significant in the revenue and expen‐diture areas. Revenues received were lower than budgeted by $512,626 or 4.5%, while expenditures were 6.8 % less than budgeted ($698,861).
The differences between the original budget and the final amended budget for revenues was 2/10ths of 1% and for over‐all expenditures remain the same for FY2010. The original General Fund budget planned to appropriate $307,935 from Fund Balance, while the actual appropriation was for $106,478.
The City of Wixom amended the budget to take into account unanticipated events during the year. The most significant event was the merging of the Capital Planning Fund with the Capital Improvement Fund. The Capital Planning Fund was a mechanism to fund and support the Capital Improvement Fund’s 5 year capital plan. During the budget process each Department provided a five year projection of capital improvement expenditures. The Capital Planning Fund was used to even out the funding needs for these expenditures over a five year period as planned. This merger was done to comply with future GASB Statement 54, Fund Balance Reporting and Governmental Fund Type Definitions.
Budgeting for 2012
Variance With
Original Amended Amended
Budget Budget Actual Budget
General Fund
Fund Balance - Beginning of year 1,052,366 1,052,366 1,408,152 355,786
Resources (inflows):
Property taxes 6,037,176 6,037,176 5,792,459 (244,717)
State sources 906,043 906,043 1,070,137 164,094
Fees and Permits 300,870 300,870 240,358 (60,512)
Miscellaneous revenues 792,365 792,365 773,446 (18,919)
Transfer from other funds 1,627,499 1,668,940 1,693,166 24,226
Amounts available for appropriation 10,716,319 10,757,760 10,977,718 219,958
Amended Original
Budget Budget Percent
Description 2010-2011 2011-2012 Difference Change
Legislative 17,626 17,626 - 0.00%
City Manager 488,067 482,098 (5,969) -1.22%
Assessor 162,537 162,992 455 0.28%
Building 430,865 430,385 (480) -0.11%
Legal Counsel and Assistance 77,100 73,000 (4,100) -5.32%
Clerks 185,564 175,896 (9,668) -5.21%
Information Systems 134,759 131,907 (2,852) -2.12%
Financial Administration 433,742 418,095 (15,647) -3.61%
General Operating 455,871 564,555 108,684 23.84%
Building Maintenance 61,970 61,970 - 0.00%
Cultural Center 328,486 324,866 (3,620) -1.10%
Fire 919,586 912,667 (6,919) -0.75%
Police 3,258,770 3,098,219 (160,551) -4.93%
DPW 1,584,191 1,553,127 (31,064) -1.96%
Board of Appeals 3,900 3,900 - 0.00%
Board of Review 1,200 1,200 - 0.00%
Planning Committee 34,800 34,300 (500) -1.44%
Senior Citizen Committee 60,392 60,392 - 0.00%
Community Service - P&R 451,028 449,481 (1,547) -0.34%
Interfund Transfers 573,500 359,780 (213,720) -37.27%
EXPENDITURE TOTAL 9,663,954 9,316,456 (347,498) -3.60%
22
CAPI
TAL
ASS
ETS
CAPI
TAL
ASS
ETS
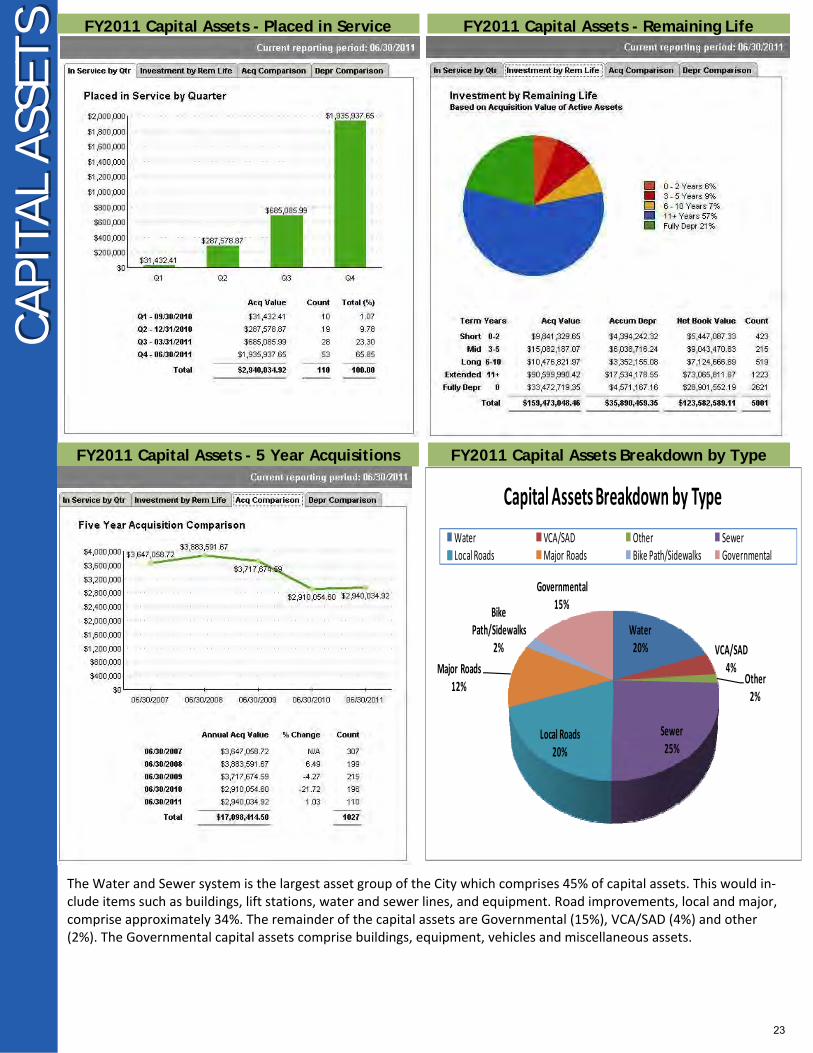
The Water and Sewer system is the largest asset group of the City which comprises 45% of capital assets. This would in‐clude items such as buildings, lift stations, water and sewer lines, and equipment. Road improvements, local and major, comprise approximately 34%. The remainder of the capital assets are Governmental (15%), VCA/SAD (4%) and other (2%). The Governmental capital assets comprise buildings, equipment, vehicles and miscellaneous assets.
FY2011 Capital Assets - Placed in Service
FY2011 Capital Assets - 5 Year Acquisitions
FY2011 Capital Assets - Remaining Life
FY2011 Capital Assets Breakdown by Type
Water20% VCA/SAD
4%Other 2%
Sewer25%
Local Roads20%
Major Roads12%
Bike Path/Sidewalks
2%
Governmental15%
Capital Assets Breakdown by Type
Water VCA/SAD Other SewerLocal Roads Major Roads Bike Path/Sidewalks Governmental
23
WAT
ER E
NTER
PRIS
E H
IGH
LIG
HTS
WAT
ER E
NTER
PRIS
E H
IGH
LIG
HTS
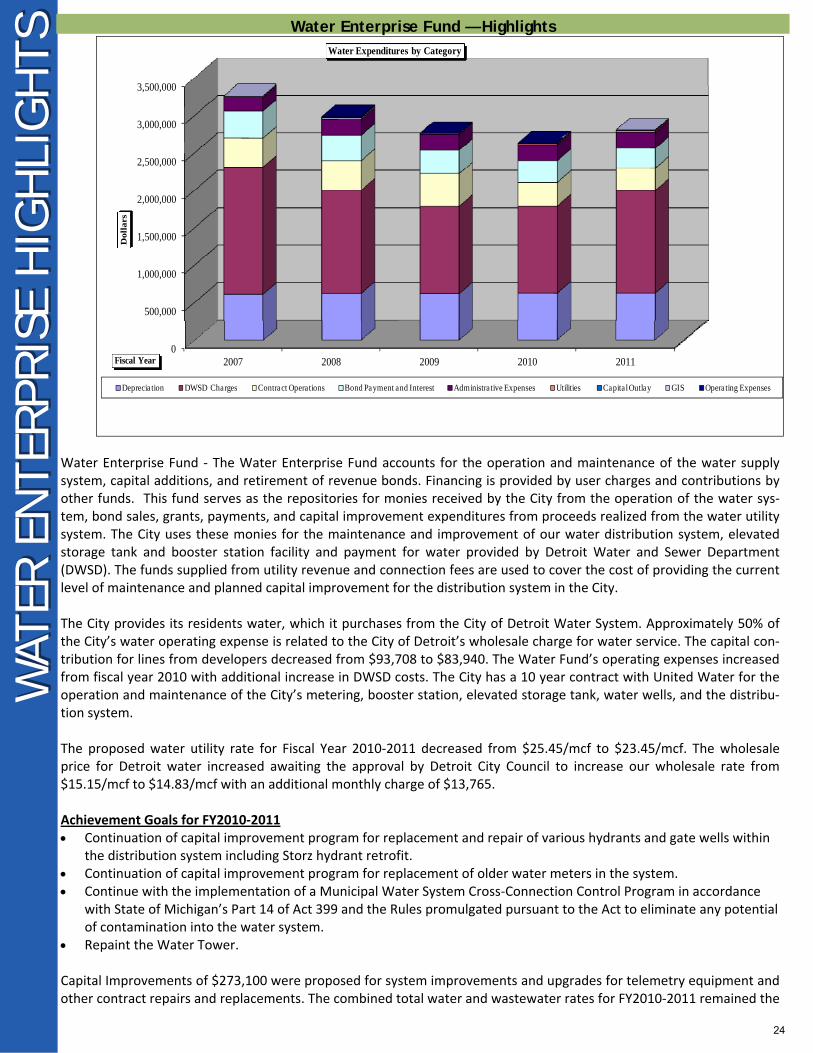
Water Enterprise Fund ‐ The Water Enterprise Fund accounts for the operation and maintenance of the water supply system, capital additions, and retirement of revenue bonds. Financing is provided by user charges and contributions by other funds. This fund serves as the repositories for monies received by the City from the operation of the water sys‐tem, bond sales, grants, payments, and capital improvement expenditures from proceeds realized from the water utility system. The City uses these monies for the maintenance and improvement of our water distribution system, elevated storage tank and booster station facility and payment for water provided by Detroit Water and Sewer Department (DWSD). The funds supplied from utility revenue and connection fees are used to cover the cost of providing the current level of maintenance and planned capital improvement for the distribution system in the City. The City provides its residents water, which it purchases from the City of Detroit Water System. Approximately 50% of the City’s water operating expense is related to the City of Detroit’s wholesale charge for water service. The capital con‐tribution for lines from developers decreased from $93,708 to $83,940. The Water Fund’s operating expenses increased from fiscal year 2010 with additional increase in DWSD costs. The City has a 10 year contract with United Water for the operation and maintenance of the City’s metering, booster station, elevated storage tank, water wells, and the distribu‐tion system. The proposed water utility rate for Fiscal Year 2010‐2011 decreased from $25.45/mcf to $23.45/mcf. The wholesale price for Detroit water increased awaiting the approval by Detroit City Council to increase our wholesale rate from $15.15/mcf to $14.83/mcf with an additional monthly charge of $13,765. Achievement Goals for FY2010‐2011 Continuation of capital improvement program for replacement and repair of various hydrants and gate wells within
the distribution system including Storz hydrant retrofit. Continuation of capital improvement program for replacement of older water meters in the system. Continue with the implementation of a Municipal Water System Cross‐Connection Control Program in accordance
with State of Michigan’s Part 14 of Act 399 and the Rules promulgated pursuant to the Act to eliminate any potential of contamination into the water system.
Repaint the Water Tower. Capital Improvements of $273,100 were proposed for system improvements and upgrades for telemetry equipment and other contract repairs and replacements. The combined total water and wastewater rates for FY2010‐2011 remained the
Water Enterprise Fund — Highlights
0
500,000
1,000,000
1,500,000
2,000,000
2,500,000
3,000,000
3,500,000
2007 2008 2009 2010 2011
Doll
ars
Fiscal Year
Water Expenditures by Category
Depreciation DWSD Charges Contract Operations Bond Payment and Interest Administrative Expenses Utilities Capital Outlay GIS Operating Expenses
24
W
AST
EWAT
ER E
NTER
PRIS
E H
IGH
LIG
HTS
WAST
EWAT
ER E
NTER
PRIS
E H
IGH
LIG
HTS Wastewater Enterprise Fund — Highlights
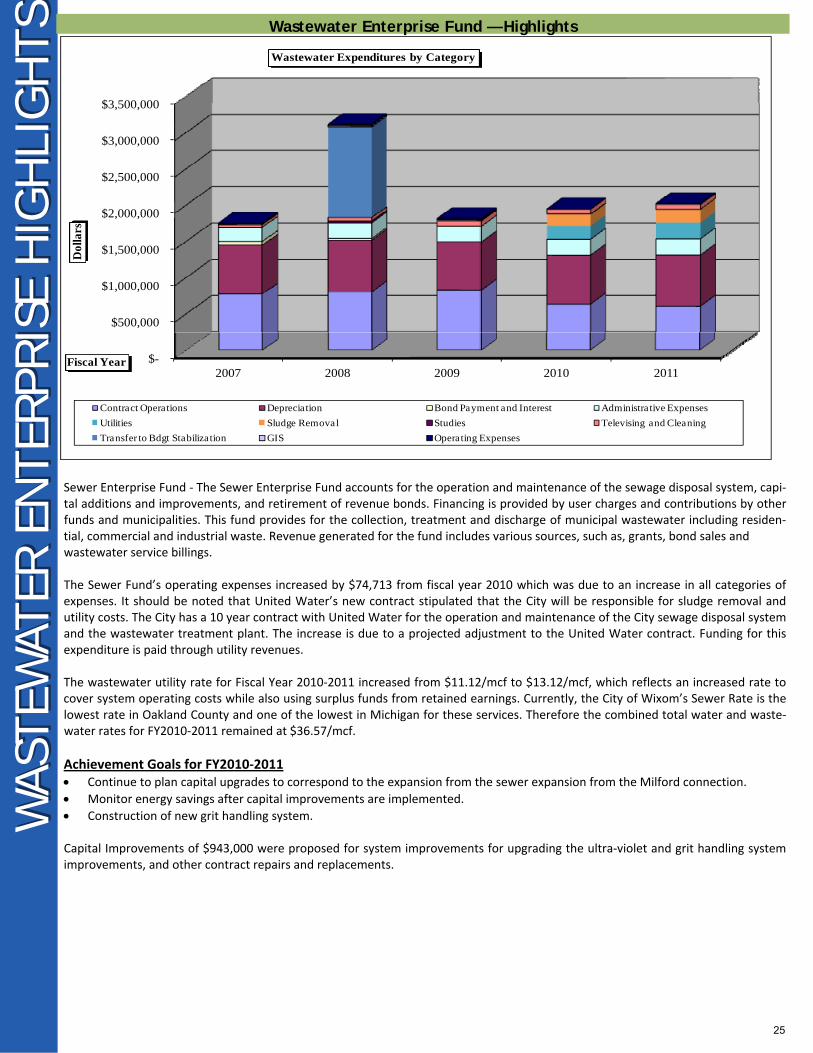
Sewer Enterprise Fund ‐ The Sewer Enterprise Fund accounts for the operation and maintenance of the sewage disposal system, capi‐tal additions and improvements, and retirement of revenue bonds. Financing is provided by user charges and contributions by other funds and municipalities. This fund provides for the collection, treatment and discharge of municipal wastewater including residen‐tial, commercial and industrial waste. Revenue generated for the fund includes various sources, such as, grants, bond sales and wastewater service billings. The Sewer Fund’s operating expenses increased by $74,713 from fiscal year 2010 which was due to an increase in all categories of expenses. It should be noted that United Water’s new contract stipulated that the City will be responsible for sludge removal and utility costs. The City has a 10 year contract with United Water for the operation and maintenance of the City sewage disposal system and the wastewater treatment plant. The increase is due to a projected adjustment to the United Water contract. Funding for this expenditure is paid through utility revenues. The wastewater utility rate for Fiscal Year 2010‐2011 increased from $11.12/mcf to $13.12/mcf, which reflects an increased rate to cover system operating costs while also using surplus funds from retained earnings. Currently, the City of Wixom’s Sewer Rate is the lowest rate in Oakland County and one of the lowest in Michigan for these services. Therefore the combined total water and waste‐water rates for FY2010‐2011 remained at $36.57/mcf.
Achievement Goals for FY2010‐2011 Continue to plan capital upgrades to correspond to the expansion from the sewer expansion from the Milford connection.
Monitor energy savings after capital improvements are implemented.
Construction of new grit handling system. Capital Improvements of $943,000 were proposed for system improvements for upgrading the ultra‐violet and grit handling system improvements, and other contract repairs and replacements.
$-
$500,000
$1,000,000
$1,500,000
$2,000,000
$2,500,000
$3,000,000
$3,500,000
2007 2008 2009 2010 2011
Dol
lars
Fiscal Year
Wastewater Expenditures by Category
Contract Operations Depreciation Bond Payment and Interest Administra tive Expenses
Utilities Sludge Removal Studies Televising and Cleaning
Transfer to Bdgt Stabilization GIS Operating Expenses
25
PEN
SIO
N A
ND
OPE
B H
IGH
LIG
HTS
PEN
SIO
N A
ND
OPE
B H
IGH
LIG
HTS
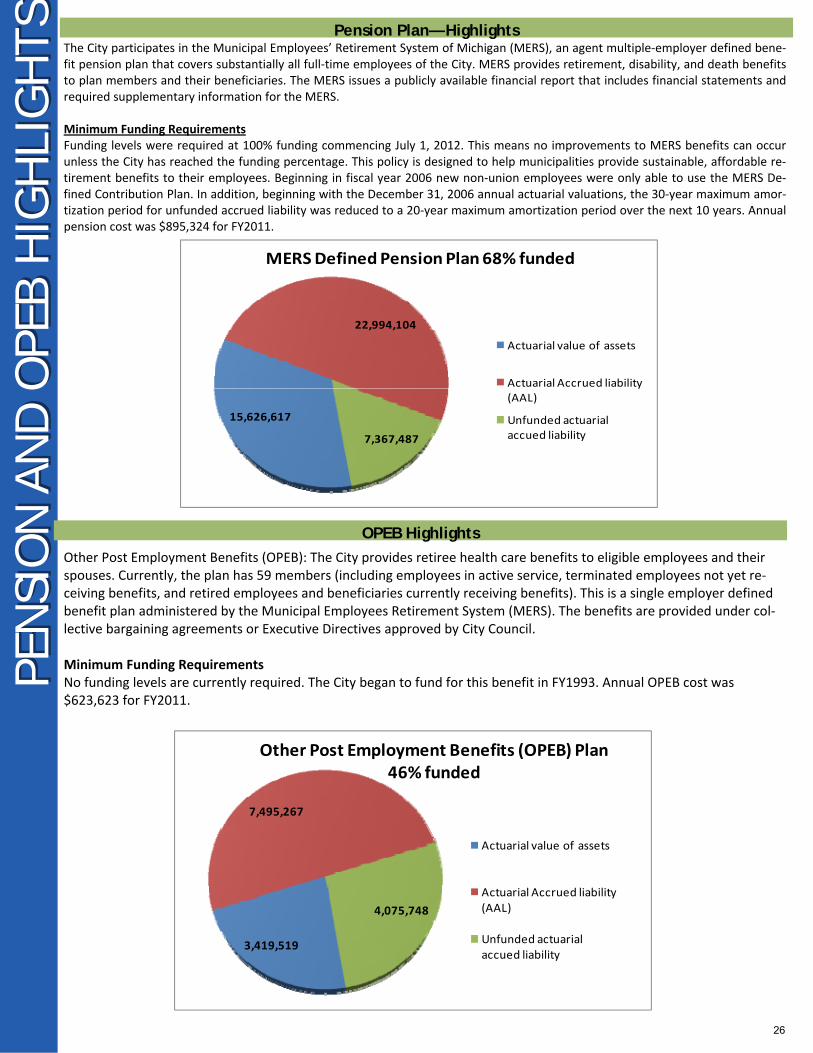
Other Post Employment Benefits (OPEB): The City provides retiree health care benefits to eligible employees and their spouses. Currently, the plan has 59 members (including employees in active service, terminated employees not yet re‐ceiving benefits, and retired employees and beneficiaries currently receiving benefits). This is a single employer defined benefit plan administered by the Municipal Employees Retirement System (MERS). The benefits are provided under col‐lective bargaining agreements or Executive Directives approved by City Council. Minimum Funding Requirements No funding levels are currently required. The City began to fund for this benefit in FY1993. Annual OPEB cost was $623,623 for FY2011.
Pension Plan— Highlights The City participates in the Municipal Employees’ Retirement System of Michigan (MERS), an agent multiple‐employer defined bene‐fit pension plan that covers substantially all full‐time employees of the City. MERS provides retirement, disability, and death benefits to plan members and their beneficiaries. The MERS issues a publicly available financial report that includes financial statements and required supplementary information for the MERS. Minimum Funding Requirements Funding levels were required at 100% funding commencing July 1, 2012. This means no improvements to MERS benefits can occur unless the City has reached the funding percentage. This policy is designed to help municipalities provide sustainable, affordable re‐tirement benefits to their employees. Beginning in fiscal year 2006 new non‐union employees were only able to use the MERS De‐fined Contribution Plan. In addition, beginning with the December 31, 2006 annual actuarial valuations, the 30‐year maximum amor‐tization period for unfunded accrued liability was reduced to a 20‐year maximum amortization period over the next 10 years. Annual pension cost was $895,324 for FY2011.
OPEB Highlights
15,626,617
22,994,104
7,367,487
MERS Defined Pension Plan 68% funded
Actuarial value of assets
Actuarial Accrued liability (AAL)
Unfunded actuarial accued liability
3,419,519
7,495,267
4,075,748
Other Post Employment Benefits (OPEB) Plan 46% funded
Actuarial value of assets
Actuarial Accrued liability (AAL)
Unfunded actuarial accued liability
26
DEM
OG
RAPH
ICS
DEM
OG
RAPH
ICS
—— C
ENSU
S D
ATA
CEN
SUS
DAT
A
27