page 0 eastern interconnection phasor demonstration enhanced wide-area visibility in the eastern...
TRANSCRIPT
Page 1
Eastern Interconnection Phasor Demonstration
Enhanced Wide-Area Visibility
In the Eastern Interconnection for Reliability Management
Transmission Reliability Program Peer Review
Washington, D.C.
Carl Imhoff
Page 2
Presentation Outline
1. Purpose of Eastern Interconnection Wide Area Measurement Demonstration
2. Review of Wide Area Measurement Systems (WAMS)
3. Benefits of Eastern Interconnection WAMS
4. Proposed Plan
5. Status Update
Page 3
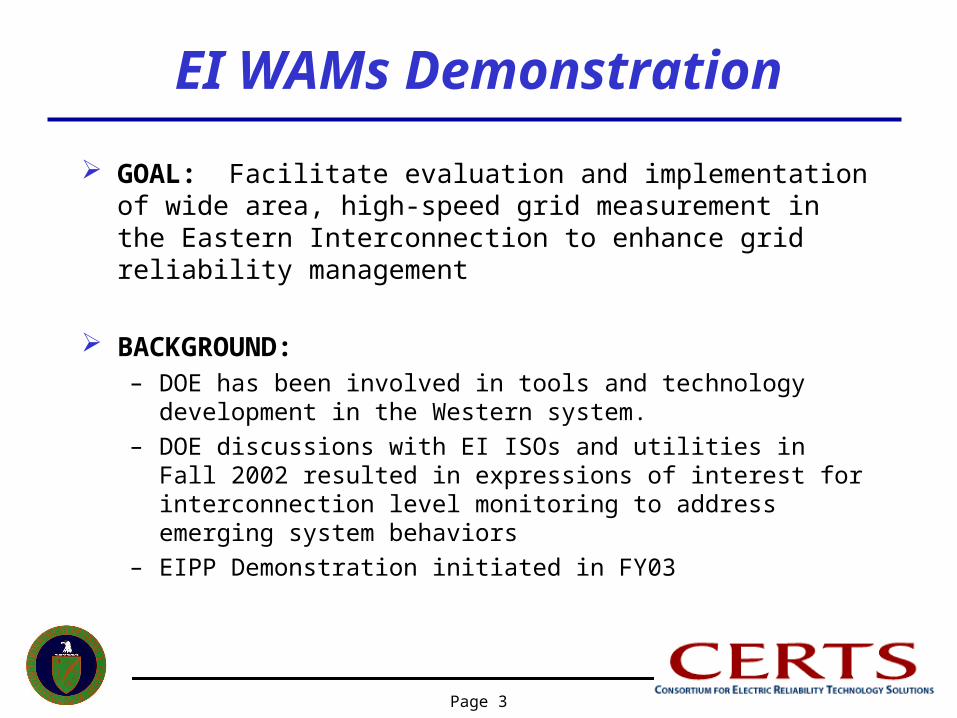
EI WAMs Demonstration
GOAL: Facilitate evaluation and implementation of wide area, high-speed grid measurement in the Eastern Interconnection to enhance grid reliability management
BACKGROUND: – DOE has been involved in tools and technology development in the
Western system.
– DOE discussions with EI ISOs and utilities in Fall 2002 resulted in expressions of interest for interconnection level monitoring to address emerging system behaviors
– EIPP Demonstration initiated in FY03
Page 4
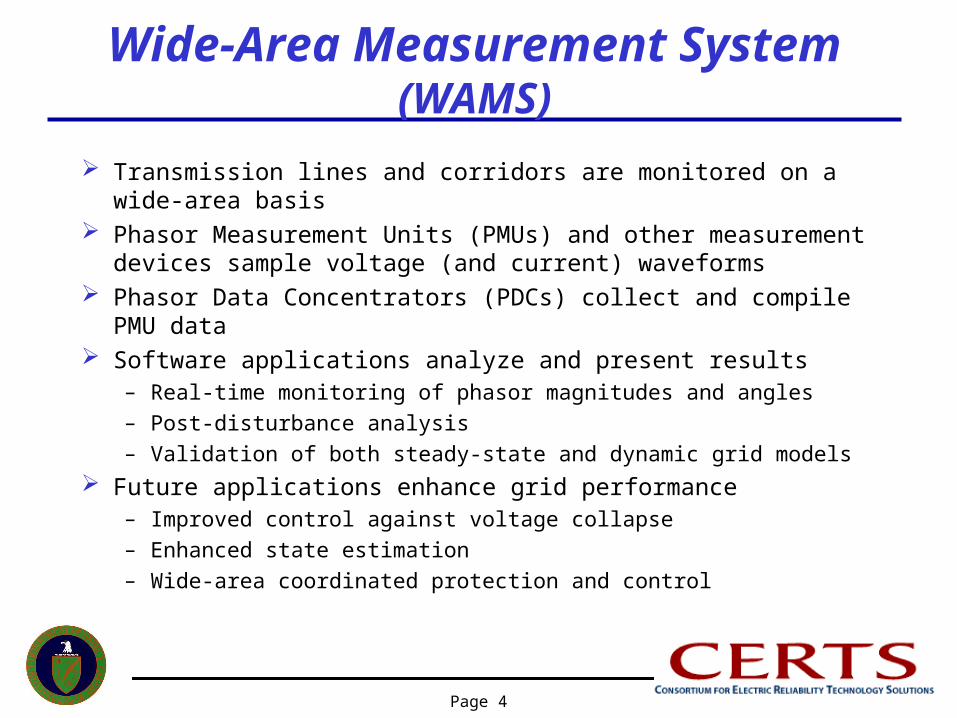
Wide-Area Measurement System (WAMS)
Transmission lines and corridors are monitored on a wide-area basis Phasor Measurement Units (PMUs) and other measurement devices
sample voltage (and current) waveforms Phasor Data Concentrators (PDCs) collect and compile PMU data Software applications analyze and present results
– Real-time monitoring of phasor magnitudes and angles
– Post-disturbance analysis
– Validation of both steady-state and dynamic grid models
Future applications enhance grid performance– Improved control against voltage collapse
– Enhanced state estimation
– Wide-area coordinated protection and control
Page 5
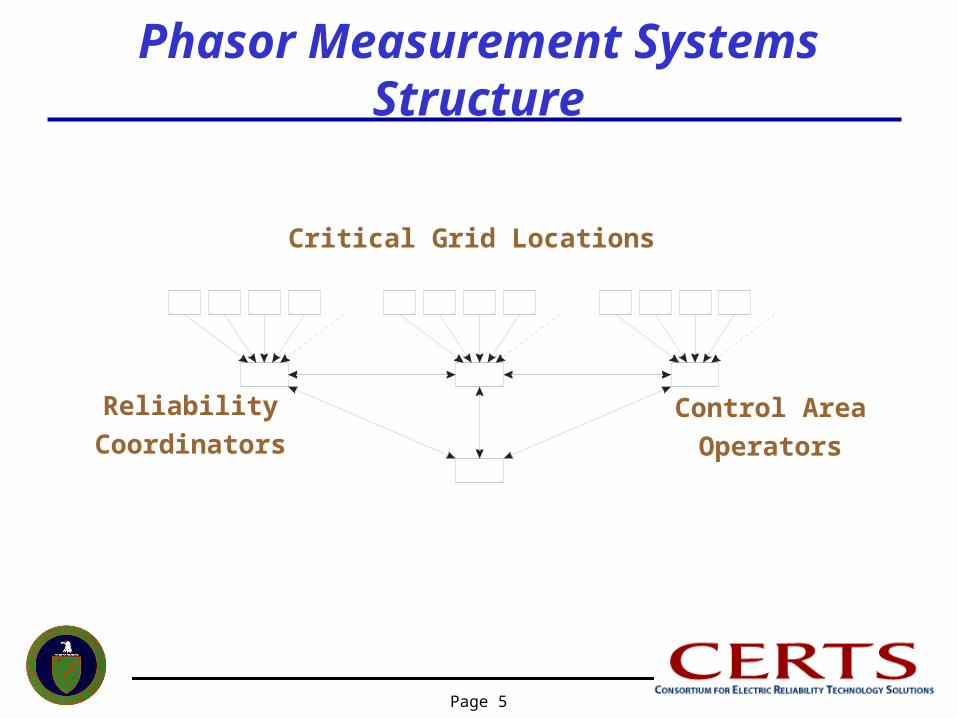
Phasor Measurement Systems Structure
Critical Grid Locations
Reliability
CoordinatorsControl Area
Operators

Page 6
Principal Benefits of EIPP WAMS
1. More comprehensive wide-area view of system
2. Rapid assessment of system conditions
3. Improved system models for steady-state and dynamic analysis
4. Enhanced post-disturbance analysis• sequence of events• what happened first
5. Power swing detection by on-line angle difference monitoring
6. Increased power system performance
7. Higher utilization of existing investments
8. Reduced outage costs
Page 7
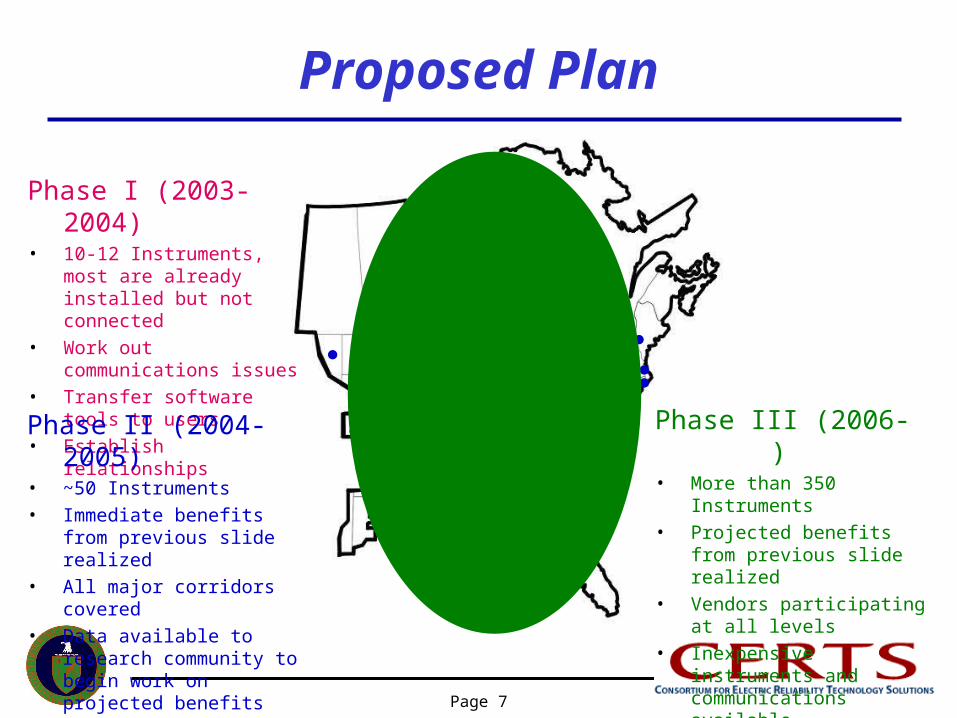
Proposed Plan
Phase I (2003-2004)• 10-12 Instruments, most are
already installed but not connected
• Work out communications issues
• Transfer software tools to users
• Establish relationships
Phase II (2004-2005)• ~50 Instruments• Immediate benefits from
previous slide realized• All major corridors covered• Data available to research
community to begin work on projected benefits
Phase III (2006- )• More than 350 Instruments• Projected benefits from
previous slide realized• Vendors participating at all
levels• Inexpensive instruments and
communications available

Page 8
Proposed Role of CERTS & DOE
PHASE I– CERTS acts as facilitator among stakeholders– Provide software tools and training for both operations environment
(voltage & frequency profiles, security coordinator tools, etc.) and off-line environment (planning, post-disturbance analysis, model validation, etc.)
– Provide a “data concentrator” to integrate data and disseminate to participants
PHASE II– CERTS engages vendors to incorporate software tools into EMS systems
and planning/control environments– Continued assistance to stakeholders to resolve hardware or software
issues– Development of “projected” benefits such as new state estimator
PHASE III– CERTS supports technical issues as they arise
Page 9
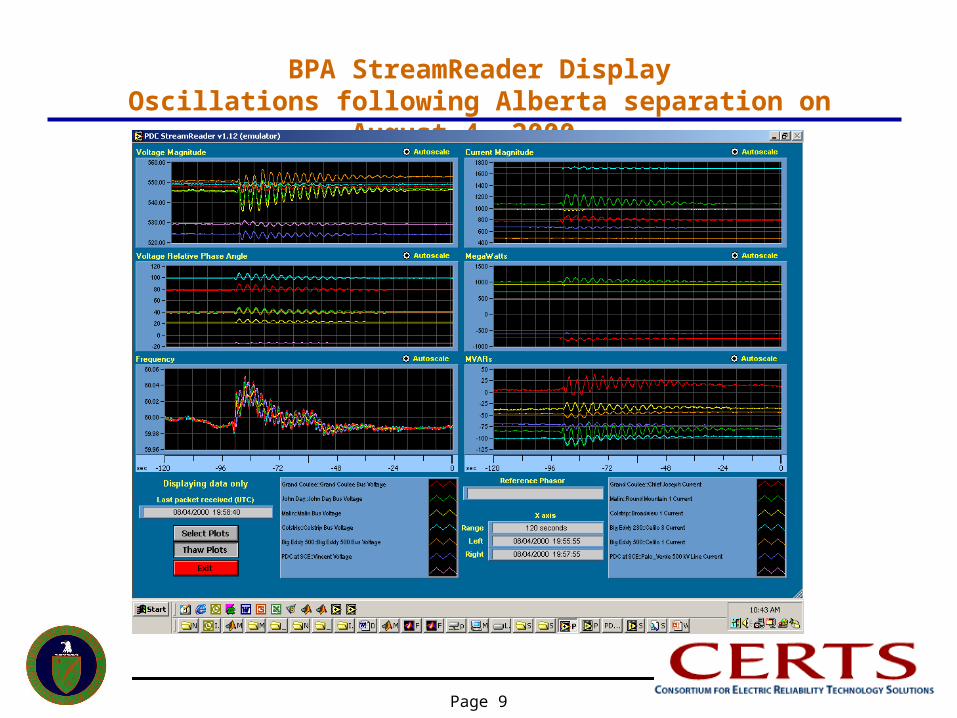
BPA StreamReader DisplayOscillations following Alberta separation on August 4, 2000
Page 10
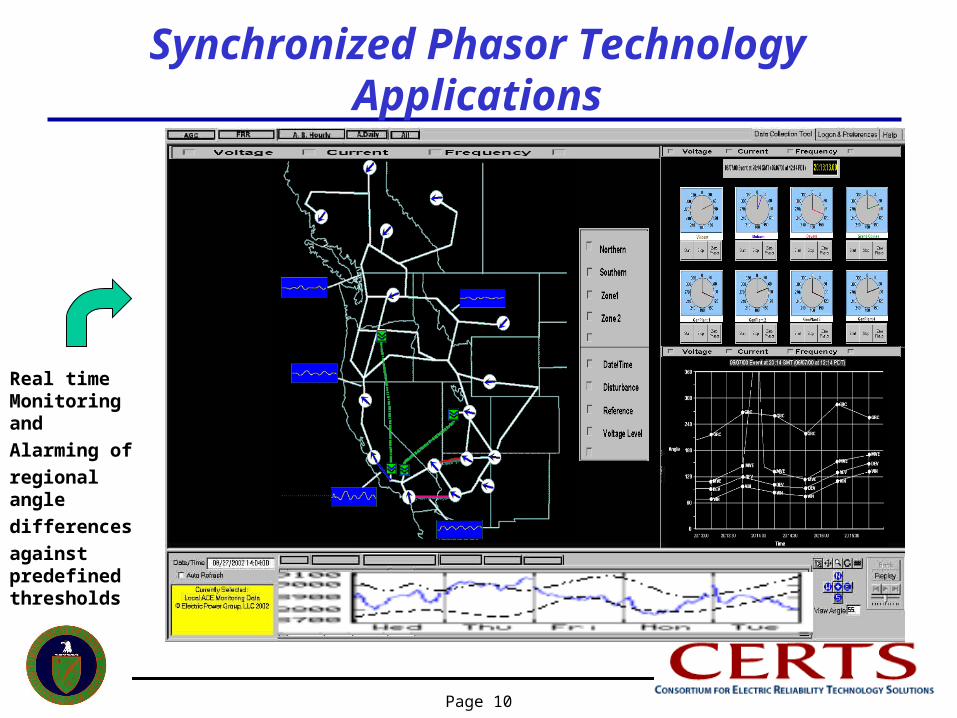
Synchronized Phasor Technology Applications
Real time Monitoring and
Alarming of
regional angle
differences
against predefined thresholds
Page 11
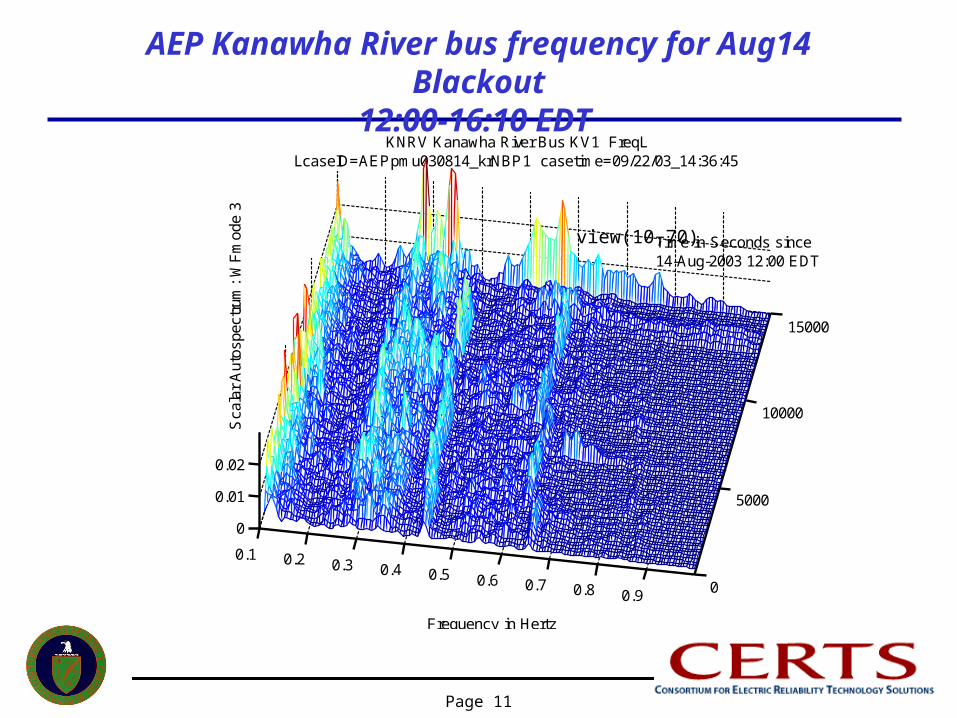
AEP Kanawha River bus frequency for Aug14 Blackout12:00-16:10 EDT
0.1 0.2 0.3 0.4 0.5 0.6 0.7 0.8 0.9 0
5000
10000
15000
0
0.01
0.02
Time in Seconds since 14-Aug-2003 12:00 EDT
Frequency in Hertz
KNRV Kanawha River Bus KV1 FreqLLcaseID=AEPpmu030814_krNBP1 casetime=09/22/03_14:36:45
Sca
lar
Aut
ospe
ctru
m:
WF
mod
e 3
view(10,70)
Page 12
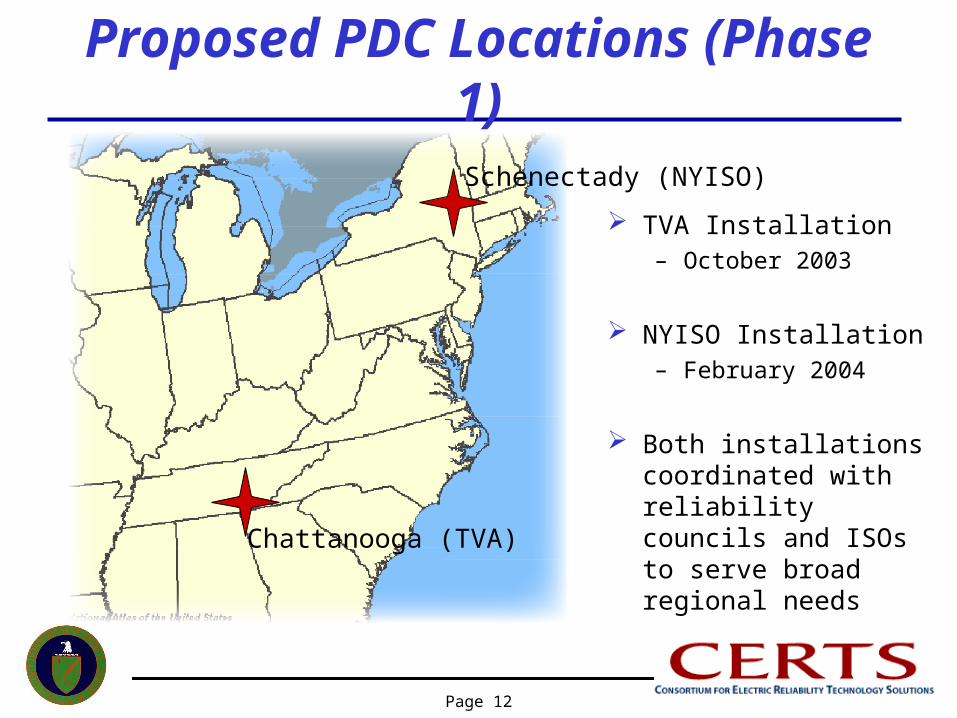
Proposed PDC Locations (Phase 1)
Chattanooga (TVA)
Schenectady (NYISO)
TVA Installation– October 2003
NYISO Installation– February 2004
Both installations coordinated with reliability councils and ISOs to serve broad regional needs
Page 13
Status Update
Meetings with Major System Operators
- Sept 2002 through May 2003 Development of Project Plan
- April 2003 through June 2003 Procure/Program/Deploy 1st Phasor Data Concentrator at TVA
October 2003 Preliminary integration of phasor / PPSM data from several
existing EI instruments (WAMs outreach) EIPP Roadmap Meeting in DC - October 29, 2003 Form EIPP Working Group - November 2003 Procure/Program/Deploy 2nd PDC at NYISO - February 2004 Discussions underway with AEP and Ameren for PDC linkage
Page 14
EIPP Working Group
Vision – improve power system reliability through wide-area measurement, monitoring and control
Participating Organizations (as of December 2003)– USDOE (Chair, Phil Overholt)– AEP– Ameren– CERTS– Entergy– FERC– MISO– NERC– NYISO– NYPA– PJM– Southern Company– SPP
Task Team Organization– Phase 1 Implementation– Real-Time Applications– Off-Line Applications– Business Management– Standards & Performance

Page 15
Next Steps
Accelerate the Working Group activities based upon urgency established by the August 2004 outage and subsequent investigation
Prioritize FY04 funding to ensure that initial network is established as quickly as possible.
Work with industry to determine options for rapid implementation and expansion pending outcomes of Phase 1 and the upcoming Outage Report recommendations.