pakistan journal of applied economics, vol.26 no.1,...
TRANSCRIPT

IMPACT OF CEOs PAY DISPARITY ON STABILITY OF BANKS:Evidence from Pakistan
Ayyaz AHMAD,* Saima SARWAR*and M. Wasif SIDDIQI*
This study is carried out to investigate the nature of association between Banks’ stability and the ChiefExecutive Officers (CEOs) pay difference as compared to other executives for a sample of 17 Pakistanicommercial banks, over the period of 9 years (2005 to 2013). The study finds that as compared to otherexecutives, CEO pay difference has a significant but negative association with stability of banks per-formance, i.e., higher pay difference between CEO and other executives induced greater risk practicesin banks. Hence, banks with lower stability must try to reduce the compensation gap between the CEOand his executive team, so that safe policies could be implemented.
I. Introduction
Saving is the most important factor for growth and stability of any economy.Savings and economic growth are closely linked to each other as enormous savingsenable an economy to walk towards self-sustained prosperity to elevate standardsof living in any country. Commercial banks are considered as one of the biggestgrids that channelize extra funds (savings) from general public in the form of de-posits and provide these funds to those who may utilise the same. Therefore, bankswork as a bridge between the customers who face capital deficit and those cus-tomers who have surplus capital. The high volume of deposits and equity on thebalance sheet of banks reflect confidence between the general public and investorof a particular bank.
During the last three decades, all countries experienced financial meltdown thatled to significant losses with the passage of time. The information asymmetries, as-sets-liability mismatches, excessive financial and operational leverages and lessregulated stock markets contributed as a whole to distraction in the financial system[Kindleberger and Aliber (2005), Simkovic (2009)]. These substantial financiallosses did hit the world economy badly, but in developing countries it was worstdue to shortage of liquidity for financial development, poverty reduction and theeconomic growth. After gaining experience, all regulatory authorities made different
Pakistan Journal of Applied Economics, Vol.26 No.1, (53-76), Summer 2016
* Department of Economics, G.C. University, Lahore, Pakistan.

kinds of regulations or measures to ensure the stability of financial system. Theseregulations are implemented to strengthen the overall capital and liquidity of a bank[Haq and Heaney (2012)] because it is morally unjust that government or financialauthorities continue to help those who are imprudent or racked up with debt; at theexpense of those who have been prudent and responsible.
The organizational structure of any commercial bank constitute a Board of Di-rectors which is elected by its shareholders to supervise the management of Banks’business and affairs with a view to enhance the long-term shareholders value. TheBoard’s responsibility is as one of stewardship. It nominates the CEO who worksas a captain of the ship. CEO and his executive team are accountable to implementBoard’s decisions, to manage business of the bank and safeguard interest of share-holders, depositors and other stakeholders. It is pertinent to mention that the Boardof Directors deal with policy making matters but the CEO and his team ensuresright operational strategies to meet expectations of the BODs and stakeholders forstable and steady position of the bank.
Investment decisions taken by local or international investors are backed bygovernance practiced by the institutions. Good governance implants investors’ con-fidence. Corporate governance in banking system is different from other industriesbecause banking industry itself has problems of contagion across financial sectorand the entire economy of the country. The degree of opaqueness and other regu-latory restrictions imposed by the central banks or government agencies make tra-ditional corporate governance practice and procedures flimsy. Therefore, there is aneed to make relevant and industry related regulations for banks to safeguard in-terest of stakeholders [Levine (2005)].
The role of managerial compensation in banks received more importance afterthe recent financial meltdown which began in 2007. During the financial crisis(2008 to 2009) only the United States banks had an estimated loss of more than 40billion dollars.1 Many empirical studies established the fact that managerial com-pensation structure has desirable impact on overall stability of industrial firms[Fama and Jensen (1983) and Jensen and Mecling (1976)]. However, the resultsbased on data of industrial firms cannot be used for banking industry, due to thedegree of financial leverage, investment dimensions and regulatory restrictions. Itis also evident from the existing literature that element of incentive is inherent incompensation structure of bank executives that induce them to take excessive risk[Bai and Elyasiani (2013)].
The impact of CEO compensation and its difference with other executives onstability of banks did not attract adequate consideration in the earlier literature.Most empirical studies focused on factors that influence the pay-inequality and pay-structure of CEO and other executives of the banks. The Bebchuk, et al. (2007) ex-
PAKISTAN JOURNAL OF APPLIED ECONOMICS54
1 Federal Deposits Insurance Corporation.

amined the relationship between CEO’s pay difference with its key executives andstock return for industrial firms. The authors reported that large pay difference be-tween CEO and his key executives decreased inconsistency in the stock return.Later, Bai and Elyasiani (2013) used CEO’s pay inequality in terms of total com-pensation of the executive team, to measure the impact on stability of banks.
In the existing literature relation between CEO’s pay-inequality as comparedto other executives and the stability of banks is positive (negative). According toLazear and Rosen (1981) CEO compensation is the prize money paid to the winnerof tournament competition. This prize money is used to motivate participants ofthe competition, i.e., executives to work hard and become a CEO of the bank. Con-sequently, more risky policies will be adopted to increase profitability and subse-quently there is a chance to win the tournament. Hence, to get prize money (whichis not calculated) based on individual’s marginal products the larger pay differencewill induce them to take more risk and stability to get down in future [Hvide(2002)]. The tournament theory holds that the amount of compensation receivedby executives of an organization is similar to tournament winnings. Tournamentparticipants are members of the organization and they may ultimately reach the topmost position, i.e., the Chief Executive Officer. The prospect of this prized-postsends a powerful signal throughout the organization when someone wins the num-ber one position by his hard work. The emphasis is not on whether an executivedeserves this amount of compensation, rather than the focus is on the motivationalproperties that executive compensation levels brings to those at lower level of theorganization.
Contrary, some empirical studies state that there is a positive relationship be-tween CEO’s pay inequality and firm’s stability because CEO being a winner oftournament applies more safe policy to lock his gain which is unduly higher thanother executives in the firm. Resultantly higher pay difference leads to implemen-tation of safe policies and in the end stability goes up. Hence, there is a need tostudy the relation between CEO’s pay difference as compared to other executivesand stability of the bank.
In Pakistan, the first major effort was made on March 28, 2002, when the Codeof Corporate Governance (the Code) was issued by the SECP.2 It was subsequentlymade part of the listing regulations of the three stock exchanges and became appli-cable to all public listed companies including all banks, except the foreign banks.The commercial banks are integral part of financial sector of Pakistan. The totalcontribution towards total assets of banks was almost 75 per cent of the financialsector in 2013. At this stage, there are 38 banks including 5 public commercialbanks, 4 specialized banks, 7 foreign banks and 22 local private banks from which
AHMAD, SARWAR AND SIDDIQI, IMPACT OF CEOs PAY DISPARITY ON STABILITY OF BANKS 55
2 Securities and Exchange Commission of Pakistan (SECP) set up in pursuance of the Securities and ExchangeCommission of Pakistan Act, 1997 for supervision and regulation of corporate sector, capital markets, insurancecompanies, non-banking finance companies and private pensions.
5 are fully Islamic banks. The total assets of banking sector, as on 31st December2013, were Rs.10,486 billion.3
The banking sector of Pakistan faced major reforms in the last decade whichinclude the minimum capital requirement, de-regulating interest rates, implemen-tation of prudential regulations and allowing more private direct investment in thebanking industry. Resultantly since 2004, the banking industry of Pakistan is con-tinuously growing at a higher pace. There are around 40 transactions of mergersand acquisitions which took place in the last decade. The number of branches is in-creasing and alternative distribution channels including branchless banking havemade this sector more lucrative for private investors. However, higher gains con-tinuously highlights the stability concerns for regulatory authorities.
Although, the code of cooperate governance has been implemented since 2002but no significance work was undertaken. Reviewing compensation structure ofCEO in a bank, it reveals that based on their performance, CEOs get high incentivesin shape of bonus, etc., but there is no specific criteria to ascertain the value. Thecurrent study intends to establish an empirical evidence for policy makers as CEO’spay inequality does or does not impact the overall stability of banks. A policy state-ment for regulatory authorities based on findings of this study is recommended.The main objectives of the study are as follows:a) To examine the impact of CEO’s pay inequality/difference as compared to an
average pay of other executives on bank’s stability.b) To investigate the influence of capital ratio, total assets and assets concentration
on bank’s stability.The rest of the paper is organized as follows: After the introduction in Section,
Section II presents the literature review. Methodology and data source is presentedin Section III while estimation of results are described in Section IV. Finally, SectionV develops the conclusion and results of the study.
II. Literature Review
This section, briefly covers the past literature, finding relationship betweenCEO’s pays inequality and stability of banks; and then explains contribution of thepresent study towards the existing published literature. Peter and Wanger (2014)worked on CEOs who are exposed to higher job risk and are paid more than the CEOsenjoying more secure jobs. CEOs experience uneven conditions in the industry andare sometime dismissed, due to their poor performance. Simultaneously, CEOs com-pensation incorporate the risk of dismissal associated with their job due to overallrisk associated with the industry. This finding is certainly important because in thecompetitive labor markets, job-risk-compensating wage difference occurs, unsurpris-
PAKISTAN JOURNAL OF APPLIED ECONOMICS56
3 The breakup of total assets of different banking groups as on December 2013 is mentioned in Appendix–A.

ingly. This study also rejects that CEOs with low job risk would secure high com-pensation. The study used hand-collected classification of CEOs turnovers in the Ex-ecucomp database of all S&P1500 companies.
Bai and Elyasiani (2013) investigated the relationship between CEO’s pay in-equality and the risk of banks. The study used Y9C reports database and extractedinformation of 733 bank holding companies (BHCs) from 1992 to 2008, by em-ploying 2SLS technique for estimation. Findings of the study endorsed that if CEOis paid at par to his position or rank in the bank, the larger contribution in the topexecutive team makes him more reluctant to take risk. They will implement safeinvestment policies, and resultantly, the BHCs stability will go up. Contrary, if somevariables portion(s) are added to CEO’s pay structure, based on his marginal output;CEO with larger pay inequality will follow more risky policies to increase his in-come and overall the bank’s stability will go down. The authors suggested thatbanks with lower stability scale should apply fixed pay model where CEO’s paywould be based on his position and not on his marginal productivity. It will encour-age CEOs to implement safe investment policies.
Bebchuk, et al. (2007) studied the importance of CEO amongst the top executivesof industrial firms in relation to his ability, degree of power and contribution towardsprofitability. For the first time, this study used a proxy ‘CEO centrality’ as a percentageof total compensation received by top 5 executives in an industrial firm by using datafrom the Compustat’s Execu-Comp database for the period 1993 to 2004. The resultsshowed that CEO had a centrality negative and significant relationship with overallstability of particular industrial firms and their accounting profitability.
Ang, et al. (2002) studied as to how the banks compensate their top executives,in relation to the CEOs. The author made two layers of compensation, CEOs ofbanks and rest of the top executives of the same banks, and concluded that CEO’spay is higher than other executives, due to his level of responsibility, higher quali-fication, more competency and more impact on firm’s value. The higher level ofresponsibility, capability and credentials require more pay-off than others. Follow-ing the conventional model of compensation and a set of 166 US banks during 1993to 1996, the study found that increase in CEO’s pay inequality will reduce the sta-bility of banks and vice a versa.
Lazear and Rosen (1981) examined the CEO’s pay inequality as compared toother key executives and introduced a compensation model called the ‘tournamentmodel’ which is based on individual rank in the firm. The study described that ifpay-off to CEOs and executives is based on their marginal contribution toward suc-cess then they will certainly adopt more risky polices to increase their share in theoverall success and resultantly the overall stability will get down. Further, if pay isbased on individual’s’ rank in the organization rather than their marginal production,then they are risk neutral. This is the reason why risk-averse workers prefer to bepaid on the basis of their rank rather than their marginal production.
AHMAD, SARWAR AND SIDDIQI, IMPACT OF CEOs PAY DISPARITY ON STABILITY OF BANKS 57
O'Reilly III, et al. (1988) discussed different psychological and economic fac-tors that can influence the CEO compensation. The study tested both the social andtournament models and using data set of 500 firms concluded that profit and firms’size has least impact on CEOs compensation. Findings of the study rejected thetournament model and found no association between it and the CEOs compensationstructure.
Hvide (2002) examined relationship between the reward under tournamentmodel and the risk-taking. The study endorsed that relative performance evaluation(RPE) must be made part of the executive compensation model. The reason behindthis theory is that if firms face some common factors that prevail in the whole market(like decrease in demand or increase in import price) the CEO with RPE option willnot select more risky policies to increase the marginal output. Further, in optimalcompensation model, CEO compensation is linked with firm’s relative performancewith industry and increase in the profit of other firms. This industry reflects that ifCEO is not working efficiently, resultantly, the firm generates less profit as comparedto other firms in similar industry. Hence, increase in profit of other firms decreasethe earning of CEO that leads to more risk averse polices for banks.
Brown, et al. (1996) explored the managerial incentives data-set of more than330 growth oriented mutual funds, during the period 1980 to 1991. The study rec-ommended that risk taking preference depends on individual’s rank in the organi-zation. If reward of individuals is relatively linked to their performance, then theytake some risk to increase their performance. Moreover, it also describes that staffat lower level has more chances to gain as compared to loose from their risky poli-cies and they adopt more risk policies to improve their performance graph. How-ever, the top executive, i.e., CEOs has more chance to loose from risky policieshence they adopt safe policies to increase stability of the firm. CEO is a key personin corporate decision-making than the other executives in the firm therefore, an in-crease in share of CEO’s pay in the top management makes him more risk averse -the result is that, the stability improves.
Coles, et al. (2006) conducted the research on association between CEO’s payperformance and the firm risk. The study used the Standard and Poor’s Exec-compdatabase for the period 1992 to 2002. According to its findings, if CEO’s pay sen-sitivity is high then more risky policies will be implemented in the firm, else CEO’spay would be more sensitive in risky firms. CEO will choose more risky investmentpolicies if pay sensitivity is high and accordingly it leads to more investment in re-search and development but there will be less investment in property, plant, andequipment. As a result, firms construct high financial and operational leverages.For this reason, with more option to increase his (CEO) pay based on his marginaloutput; this increase would lead to more insolvency risk in banks.
Chen, et al. (2006) explored the impact of option based compensation modeland risk level of banks. By using the dataset of 68 commercial banks (1995 to 1998),
PAKISTAN JOURNAL OF APPLIED ECONOMICS58

the study found an increase in CEO option based wealth and encouraged them totake more risk. The extracted results are inconsistent with risk aversion theory andit validated more incentives to increase the current compensation level to inducebanks’ executives for taking excessive risk.
Houston and James (1995) studied the CEO compensation in banking industryto promote risk taking? The authors used the Forbes annual survey of executivecompensation in their sample which covered the period from 1980 to 1990. Thestudy found that in the banking industry, CEO gets less equity based compensationas compared to the other firms, which results less sensitivity in the pay. CEOs withless sensitivity in compensation due to change in value of shares/options will leadto safe policies. It was further certified that stability of banks is the prime objectiveof corporate governance to achieve optimal results. Therefore, CEOs must haveless equity based compensation structure.
Ehrenberg and Bognanno (1990) explored the tournament compensation modeland reported a strong and significant relation between the level and structure ofprize and player’s performance. The study used the data set of golf digest almanac(1984) and the official 1985 PGA tour media guide (1984), available in 1985. Ineach case, the data included the 1984 men’s information, their rank and their prizemoney in the tournament. The findings reported that tournament compensationmodel is more suitable for executives or sales persons whose compensation dependson their output. The study, further suggested that share of total prize money is moreelastic in the top rank players, as compared to the lower rank players. Therefore,players at the top level play safe game to gain high prize. Likewise, in any organi-zation persons at higher ranks (like CEO) in the organization, will prefer to get lesspay/incentive by following risk averse polices, rather than losing more by optingrisk intensive policies. Thus, the organization stability goes up resultantly, by im-plementing the defensive policies.
After going in detail, through the past empirical work, it can be observed thatmany efforts were taken to explore relationship between the executive compensa-tion structure and the solvency risk in the industrial firms, but very few researchstudies were conducted in the banking sector on these parameters. The results ex-tracted from the research work on industrial firms cannot be considered for banksbecause of divergent growth determinants and the financial leverage. The lateststudy by Bai and Elyasiani (2013) used two measures of the executive compensa-tion: one is the CEO compensation sensitivity to stock return volatility which isnamed as ‘vega’, the second is the percentage of CEO compensation in total com-pensation of the top executives which is named as ‘pay inequality’. However, tothe best knowledge of the authors of this work, there is no study available on Pak-istan to measure the impact of executives’ compensation structure of the banks.Hence, this study has used one measure, (i.e., CEO compensation) in the total com-pensation of the top executives (pay inequality), to measure the impact of CEO’s
AHMAD, SARWAR AND SIDDIQI, IMPACT OF CEOs PAY DISPARITY ON STABILITY OF BANKS 59

pay inequality on stability of banks. Similarly, many studies have used the marketbeta or standard deviation of share return as primary source to measure the firm’sinsolvency risk but the studies by Bai and Elyasiani (2013) and Laeven and Levine(2009) used the Z-Score to measure probability of default or distance from insol-vency, which is a major concern of depositors, regulatory authorities, and the thegovernment. Again, the authors could not find any previous study on Pakistan thatconsiders the yearly Z-Score as a measure of insolvency risk for banks.
It is claimed that for the first time in Pakistan, this study attempts to fill theaforesaid gaps in literature by intensely exploring the impact of CEO’s pay inequal-ity on stability of banks. Further, the study also attempts to use the yearly Z-Scoreas a primary index to measure and review the stability of Pakistani banking sectorby considering 17 major banks which contribute approximately 90 per cent of thetotal banking sector, over the period of 2005 to 2013.
III. Methodology and Data Sources
1. Methodology
In the current study, panel data is used to estimate the degree of associationamong variables. This kind of data is often considered the best way to handle thecomplex financial situation. First, the ‘common constant method’ is used. It is alsocalled the pooled ‘OLS method’. In this method all observations are pooled to-gether and OLS regression model is run, neglecting the cross section and time seriesnature of data implicitly. This study assumes that all coefficients including interceptsare same for all cross sections. The major problem with this model is that it doesnot distinguish the various cross sections which are in the model. In simple words,by combining all cross sections, this study denies the heterogeneity or individualitythat may exist among the cross sections.
For handling this problem, fixed effect method which is also named the ‘leastsquare dummy variables (LSDV) estimator’, is considered. This method allowsthe control of unobserved heterogeneity when it is constant over time and corre-lated with explanatory variables. F-Test is proposed to test whether fixed effectsare present in the data or not. For this purpose, OLS is applied by using the abovementioned test and decision is be taken between the fixed effects and the OLSmethod of estimation. This has the hypothesis that there is no country havingfixed effects in the model specification. Similarly, to see the presence of randomeffects, Breusch-Pagan Lagrange multiplier (LM) test is proposed with null hy-pothesis where random effects model is more preferred as compared to simpleOLS technique. Further, the choice of appropriate model is made on the diagnosisof residuals. If these diagnostics reports the presence of heteroscadastiity, auto-correlation, and cross sectional dependency in the model, then the literature sug-
PAKISTAN JOURNAL OF APPLIED ECONOMICS60

gest the selection of FGLS model as one of the most suitable remedy to handlethese problems. This model helps to control the heteroscadasticity in residuals ofthe model by reducing standard errors. These reduced standard errors improvereliability of the estimates.
a) Feasible Generalized Least Square (FGLS)
The FGLS proposed by Parks (1967) is an extension of generalized leastsquare (GLS) to estimate the unknown parameters in a linear regression model.Later, this method was applied when the Heteroscedasticity was present or therewas a serial correlation. Due to presence of these econometric diseases, the OLSestimation technique sometimes gives statistical consistency and is unbiased,but it gives inefficient and misleading results. The GLS model was introducedby Alexander Aitken in 1935 where in, all assumption remain intact except theassumption for residuals as assumed in the OLS. GLS estimates are designed tocalculate unbiased optimal estimator β in a situation where Heteroscedasticityor serial correlation persists. GLS equation is the same, as in the OLS way ofestimation,
Y=Xβ+ ε,but with the following exception of
ε ~ N (0,Ω).This assumption of GLS permits heterogeneous variance between the resid-
uals that further extend to allow non-zero co-variance within the residuals terms.Consequently, it can be used to handle both the auto and serial correlation inpanel data. However, variance covariance matrix remains constant and cannotbe changed through lapse of time. The main issue with GLS way of estimationis that variance, co-variance matrix for GLS (Ω) is unknown. This adopts to usethe Feasible Generalized Least Square (FGLS). The process is the same for thismethod, except that an estimated variance covariance matrix for the residuals(Ω̂) is used in place of unknown Ω. In order to generate Ω̂ , OLS is applied firstto the model and it provides consistence estimates of β. The residuals are thenestimated as:
ε̂ = y - Xβ̂Residual values are also consistence and are used to estimate the variance co-
variance matrix Ω:Ω̂= ε̂ ε̂
The estimated variance covariance matrix (Ω̂ )̂ is then subsituated into the GLSequation to give FGLS estimate:
AHMAD, SARWAR AND SIDDIQI, IMPACT OF CEOs PAY DISPARITY ON STABILITY OF BANKS 61

β̂ = (X Ω̂ -1 X)-1 X Ω̂ -1 Y
and, Var (β̂) = (X Ω̂ -1 X)-1
FGLS allows for practical application of GLS which is equivalent to maximumlikelihood estimator in its limit. It also possess the asymptotic properties of max-imum likelihood. FGLS is preferred over OLS under HAPC (Heteroscedasticity,Autocorrelation, and Panel correlation). However, in a model where classical as-sumptions of OLS about residuals are met, the least squares shall be more efficientthan the FGLS.
2. The Econometric Model
The current study looks forward to a connection between CEO’s pay-differenceand stability of banks as measured by Z-score index. Therefore, following Bai andElyasiani (2013) the proposed model is as follows:
BSi,t = α0 + α1 • CPi,t + α2 • TAi,t + α3 • CRi,t+α4 • LLi.t + α5 • HHIi.t + µt + εi,t
3. Description of Variables
In the present study, insolvency risk is an independent variable while CEO’spay-inequality is used as dependent variable. However, other variables like totalassets, capital ratio, assets concentration index (HHI) have been taken as controlvariables. Details of variables, procedure to measure their values and the expectedresults are given in Appendix-B.
4. Criteria for Sample Selection and Data Sources
The Pakistan banking industry comprises of 38 banks with total assets of 10,486billion (December 2013). From these 38 banks, this study has selected the data setof 17 commercial banks that represents almost 90 per cent of the total assets ofbanking industry of Pakistan. Thus, to make a homogenous group for estimationand bring robustness in results, final sample of the study includes 17 commercialbanks. The data was extracted from the audited financial statements (balance sheets,profit and loss, and accounts detailed supporting notes available in the financialstatements) of banks. Further, to make a consistent data series for all variables, thisstudy considers the annual accounting data from the audited reports published atthe end of each calendar year.
PAKISTAN JOURNAL OF APPLIED ECONOMICS62

IV. Estimation of Results
This section describes the estimated results and descriptive statistics, along withthe correlation analysis of all variables. Thereafter, findings of regression modeland the post estimation of each model were discussed.
1. Descriptive Statistics
Descriptive statistics of all variables indicate that data is strongly balanced with153 observations for each variable. Further, there is a high variation, especially inbanks stability and CEO’s pay-difference. The highest variation is in CEO’s pay-difference variable which is 15.46 while banks’ stability is the second with variationvalue of 11.96. Total assets and HHI variables are normally distributed as their vari-ations are less as compared to other variables. The lowest standard deviation is inHHI variables with value of 0.19, while total assets are the second lowest with valueof 0.42. Similarly, mean value of CEO’s pay-difference variable is at top, i.e., 20.43and banks stability is second with value of 16.39. The mean value of HHI variableis at lowest with value of 3.15. Details of the descriptive statistics of all variablesare given in Table 1.
2. Correlation Analysis
Correlation analysis is performed to check the degree of association or unifor-mity between variables. This analysis further helps to determine the level of multi-collinearity between the independent variables. Further, the correlation analysis isconsidered as an essential part of primary analysis in the empirical studies. The cor-relation matrix of this study is given in Table 2.
TABLE 1Descriptive Statistics of all Variables
Variables Observations Mean Std. Dev. Minimum MaximumBS 153 16.39 11.96 -1.65 43.46CP 153 20.43 15.46 1.50 96.12CR 153 9.21 4.00 1.58 21.66LL 153 4.15 3.00 0.16 15.26HHI 153 3.15 0.19 2.81 3.74TA 153 8.37 0.42 7.31 9.23
AHMAD, SARWAR AND SIDDIQI, IMPACT OF CEOs PAY DISPARITY ON STABILITY OF BANKS 63

TABLE 2Correlation Matrix of all Regression Variables
BS CP CR LL HHI TABS 1 - - - - -CP -0.11 1 - - - -CR 0.11 0.06 1 - - -LL -0.47 0.21 0.05 1 - -HHI 0.06 0.03 -0.04 -0.23 1 -TA 0.43 0.23 -0.04 0.01 -0.35 1
According to the aforementioned correlation matrix, it is evident that CEO’s pay-difference and loan losses have negative association with while total assets, HHI andcapital ratio have positive association between banks stability. Contrary, it is also aninteresting fact that all variables except the bank stability have positive associationwith CEO’s pay-difference. The loan losses have the highest negative associationwhile total assets have highest positive correlation with banks’ stability. The associ-ation of capital ratio is negatively related to HHI and total assets; while on the otherhand capital ratio has positive association with loan losses, CEO’s pay inequality andbanks stability. It means that higher value of capital ensures that stability of banks isrising and banks have more equity to bear the loan losses. Moreover, the correlationbetween loan losses and HHI is negatively related to endorse that increase in diver-sification leads to reduction in loan losses quantum, while total assets are highly as-sociated, but are negative with HHI. Total assets have positive association with banksstability and the CEO’s pay-inequality; which means that increase in total assets en-sures increase in banks stability and also leads to high CEO’s pay-difference. Theaforesaid correlation is taken into account, with regression analysis and further, eval-uation is performed to confirm the degree of association among variables.
3. Regression Analysis
The estimation process started from the simple ordinary least square modelwhere most of the results were in line with the theory; but however, when post es-timation of the model was performed the results confirmed the validity of het-eroscadasticity, autocorrelation of the first order, and cross sectional dependencyin this model. Thus, it was concluded that these estimates are biased and inefficient;and to remove these issues from the estimation, fixed effect model was applied. Tomake the right choice between the OLS and Fixed Effect model, F-Test supported
PAKISTAN JOURNAL OF APPLIED ECONOMICS64

the Fixed Effect model over OLS, rejecting the null hypothesis showing that thereare no fixed effects in the model. Similarly, presence of random effects was alsotested, and again, to choose between the OLS and random effect, LM test was used.Findings of the test confirmed that random effect model is more reliable than theOLS test. After these diagnostics, the next step was taken to make selection be-tween the fixed effect and random effect models. For this purpose Hausman Testwith null hypothesis was applied, where the random effect was more preferablethan the fixed effect model. The test rejected the null hypothesis and favored thefixed effect model where the diagnostics of which confirmed the presence of het-eroscadasticity. This led to move towards the remedy being suggested via use ofFGLS. In the estimation of FGLS model, it can be written manually that the com-mand using STATA software would remove the HAPC problem in the panel esti-mation. It is clear that these results do not have the above mentioned problems.Therefore, no post-estimation is required after this estimation technique. Resultsof regression are analysed using OLS, Fixed effect and FGLS models (Table 3).
Table 3 describe the impact and nature of relation between the dependent variable,i.e., banks stability and proposed independent and control variables-CEO’s pay-differ-ence, capital risk, loan losses, HHI and total assets. The results show that CEO’s pay-difference has significant but negative relation with banks stability in all models. Thisfinding is similar to, as being anticipated. It also supports the findings of some studies[Bebchuk, et al. (2007), and Lazear and Rosen (1981)]. All variables show approxi-mately the same type of relationship as found in the previous literature. Moreover, itcan be seen that as we reach towards the final selection of the model, the significanceof variables improves, which shows that problem of heteroscadasticity is being perfectlydealt with the help of FGLS model through reducing standard errors of estimates. Incase of Fixed Effect model, due to presence of group-wise heteroscadasity, signs of fewvariables seem to be inconsistent in their nature and do not support results of the baselinemodel, i.e., the OLS. However, when this problem is solved, along with the other two(i.e., serial correlation and cross sectional dependence) with the help of FGLS, it canbe observed that in most cases, variables resume their (same) nature of relationship, asin the case of OLS.
The results of capital risk and total assets indicate that these variables have positiveand significant relation with banks stability which means that an increase in these vari-ables further strengthen the stability of banks. Loan losses have negative but significantrelationship with banks stability-as expected, this finding is also uniform [Bai andElyasiani (2013)]. However the impact of assets concentration (HHI) variable was foundnegative with insignificant relationship on stability of banks throughout the models whichmeans that assets concentration does not have any prominent role to ensure the overallstability of banks. It is due to the reason that regulatory authority of banking sector inPakistan (i.e., the State Bank of Pakistan) has clearly defined the exposured limits for allfinancing institutes that need to comply, before sanctioning any kind of finance to any
AHMAD, SARWAR AND SIDDIQI, IMPACT OF CEOs PAY DISPARITY ON STABILITY OF BANKS 65

type of customer, regardless the industry in which the intending borrower is operating.These exposure limits include single obligor/group limit, related party exposure limit,and the exposure against contingent liabilities.4 Thus, the asset concentration has no sig-nificant impact on stability of banks as financing is restricted to all kinds of borrowers,irrespective the industry in which the intending borrower is running business.
It is evident from the regression results that banks stability has both the negativeand significant relation with CEO’s pay inequality and loan losses, while it has sig-
TABLE 3Summarized Results of Estimated Model
Bank Stability is Dependent Variable under all Methods of EstimationIndependent Pooled Fixed FGLSVariables OLS EffectCEO’s pay difference -0.126 -0.198 -0.076
(0.013)** (0.209) (0.041)**Capital ratio 0.505 0.589 0.459
(0.006)*** (0.007)*** (0.000)***Loan losses -1.629 -0.356* -0.724
(0.000)*** (0.089) (0.000)***HHI 9.936 -1.985 0.903
(0.018)** (0.476) (0.361)Total assets 15.041 2.648 7.686
(0.000)*** (0.074)** (0.000)***Constant -136.093 -53.978 -46.060
(0.000)*** (0.001)*** (0.000)***Observations 153 153 153R2 0.4061 - -Wooldridge test 32.993 - No(Autocorrelation Test) (0.000) - AutocorrelationWhite Test 44.66 Modified No(Hetreoskadasticity Test) (0.0012) Wald Test Hetreoskadasticity
344.78, (0.000)Cross sectional 1.872 - -correlation (pesaran) (0.0612)Breusch-Pagan LM 941.94 Hausman Test -
(0.0000) (5.09, 0.07)Multi-collinearity Test 1.16 - -Mean VIF
Note: ***,** and * indicates significance at level 1 per cent, 5 per cent and 10 per cent respectively. p-value in parentheses.
PAKISTAN JOURNAL OF APPLIED ECONOMICS66
4 Prudential Regulations for Corporate/Commercial Banking (Risk Management and Operations), State Bank ofPakistan, BPRD circular No. 6(2014).
nificantly positive relationship with capital risk and total assets. However, assetsconcentration (HHI) has negative but insignificant relation with the overall stabilityof banks in the final choice of model, i.e., the FGL.
4. Validity of Multivariate Regression Models
This study plied different post-estimation tests to verify the results of eachmodel and check presence of Multi-collinearity, Autocorrelation, Heteroscedasticity,and Cross Section Dependence in residuals of the applied models. Results of allthese tests are presented in Table 1 (last row). In this regard, for multi-collinearityVIF (variance inflation factor) the test was applied, which showed that all variablesare free from multi-collinearity and no independent variable in the model is stronglyassociated with other independent variables. Further the auto/serial correlation hasbeen tested through Wooldridge test which clearly indicate that there is an existenceof auto/serial correlation in the data. In addition to this, White Test has been appliedto testify the presence of Heteroscedasticity in the panel data which confirm itspresence in the residuals of the model. Hence, it proves that results through OLSway of estimation do not meet the assumption of OLS, and therefore, estimates arenot reliable. In continuation to the above mentioned findings, this study applies thefixed effect method of estimation. First, the Modified Wald test for group-wise Het-eroscedasticity in fixed effect regression model was applied. The results of this testshows that again residuals suffer from the problem of Heteroscedasticity. Similarly,to check the cross sectional independence, Pesaran Test was used which confirmedthat Cross sections are not independent CD ≁ N(0, 1). Hence, all these tests did notsupport the use of Fixed Effect model.
In this situation where OLS and fixed effect models were not appropriate, thisstudy moved toward the FGLS model which has been proposed as a remedy for re-moval of the HAPC disease of estimated model. It assumes no auto/serial correla-tion existence as panels are homoskedastic. The FGLS results are certainly capableto predict the relation without any violation.
V. Conclusion and Policy Recommendations
This section of the study comprises of conclusion and policy recommendationswhich are based on results and discussion presented in the previous sections of thisstudy. Lastly, the directions for future research are given.
1. Conclusion
It is certainly acknowledged from findings of the study that in Pakistan, CEOsand other executives’ pay-structure play a vital role to ensure the long-run stability
AHMAD, SARWAR AND SIDDIQI, IMPACT OF CEOs PAY DISPARITY ON STABILITY OF BANKS 67
of banking institutes. This study involves CEO’s pay-difference in terms of averagepay of executives in a bank and attempts to find relationship with bank stability.The study also includes the capital ratio, loan loss, HHI and total assets, as controlvariables in the model.
Following the existing literature, the panel data of 17 commercial banks of Pak-istan that contributes over 88 per cent towards the total assets of Pakistani bankingsector, was used in December 2013. The core purpose of this study is to measurethe overall stability of banking sector and how much it gets affected by CEO’s payinequality/difference, along-with the other control variables. The Feasible Gener-alized Least Square (FGLS) method of estimation was used to measure the natureof relationship and to quantify significance of all independent variables of the study.
On the basis of the results, the CEO’s pay-difference in terms of average exec-utive pay has significant and negative impact on banks stability. As the differencebetween the CEO’s pay and average pay level of other executives of the bank in-creases, the stability of bank is lowered. The study also highlights that CEO with-draw a sizable amount as bonus which is based on performance of the bank. Thisfactor may encourage the CEO to take excessive risk to magnify performance andin return it positively impacts an overall compensation of the bank; but the ambitionto enlarge performance of banks brings higher risk to them. In addition to this it isalso concluded that banks with lower stability scale must apply fixed pay modelwhere CEO’s pay would be based on his position and not on his marginal produc-tivity. It will encourage CEO’s to implement safe investment policies.
This study also describes that increase in capital and total assets have positiveand significant impact on overall stability of banks, while increase in loan lossesratio decrease their overall stability. However, loan diversification has insignificantimpact on overall stability scale of banks, due to exposure limits that are definedby the State Bank of Pakistan in its prudential regulations.
2. Policy Recommendations
The State Bank of Pakistan is an autonomous body that ensures overall stabilityof the financial sector of Pakistan. However, the SECP is considered a supreme au-thority to ensure implementation of the code of corporate governance in all regis-tered legal entities, but in the case of Pakistani banking sector it is almost dealt bythe State Bank of Pakistan. Being custodian of the financial sector, the State Bankof Pakistan must exercise its power and introduce law under the code of corporategovernance for compensation structure of CEOs and other executives. Hence, thisstudy empirically proves that these factors have significant but negative stabilityto banks. The desired policy papers must certainly incorporate prerequisites for anybank to grant high amount, other than the fixed pay that merely encourage CEOsto take excessive risk. This study is also helpful for the international regulatory
PAKISTAN JOURNAL OF APPLIED ECONOMICS68
bodies like Basel Committee which may incorporate the above mentioned variablesand draw new guidelines to ensure stability of the financial sector.
3. Future Research Directions
This study consider the lump-sum amount of CEO’s pay in-terms of averagepay of other executives and regress it with bank stability scale, but in future, theattributes of CEO’s pay may be considered separately to investigate the relationbetween CEO’s pay to attribute it with the stability of the bank.
Further, the scope of study is limited to Pakistan only which may be extendedto other countries and regions of the world, so that more conclusive results are ex-tracted for regulatory authorities.
Department of Economics,G.C. University, Lahore, Pakistan.
AHMAD, SARWAR AND SIDDIQI, IMPACT OF CEOs PAY DISPARITY ON STABILITY OF BANKS 69

Bibliography
Ang, J., B. Lauterbach, and B.Z. Schreiber, 2002, Pay at the executive suite: Howdo US banks compensate their top management teams? Journal of Banking &Finance, 26(6), 1143-1163.
Asteriou, D., and S.G. Hall, 2011, Applied Econometrics, New York: PalgraveMacmillan.
Bai, G., and E. Elyasiani, 2013, Bank stability and managerial compensation, Jour-nal of Banking & Finance, 37(3), 799-813.
Bebchuk, L. A., M. Cremers, and U. Peyer, 2007, CEO centrality (No.w13701),National Bureau of Economic Research.
Brooks, C., 2014, Introductory econometrics for finance, Cambridge UniversityPress.
Brown, K. C., W.V. Harlow, and L.T. Starks, 1996, Of tournaments and temptations:An analysis of managerial incentives in the mutual fund industry, The Journalof Finance, 51(1), 85-110.
Chen, C. R., T.L. Steiner, and A.M. Whyte, 2006, Does stock option-based execu-tive compensation induce risk-taking? An analysis of the banking industry,Journal of Banking & Finance, 30(3), 915-945.
Code of Corporate Governance, Securities & Exchange Commission of Pakistan,2002, March 28.
Coles, J. L., N.D. Daniel, and L. Naveen, 2006, Managerial incentives and risk-taking, Journal of Financial Economics, 79(2), 431-468.
De Hoyos, R. E., and V. Sarafidis, 2006, Testing for cross-sectional dependence inpanel-data models, Stata Journal, 6(4), 482.
Demsetz, R. S., and P.E. Strahan, 1997, Diversification, size, and risk at bank hold-ing companies. Journal of Money, Credit, and Banking, 29(3), 300-313.
Ehrenberg, G., and M.L. Bognanno, 1990, Do tournaments have incentive effects?,Journal of Political Economy, 98(6), 1307 - 1324.
Fama, E. F., and M.C. Jensen, 1983, Separation of ownership and control, Journalof Law and Economics, 26(2), 301-325.
Haq, M., and R. Heaney, 2012, Factors determining European bank risk, Journalof International Financial Markets, Institutions and Money, 22(4), 696-718.
Houston, J. F., and C. James, 1995, CEO compensation and bank risk: Is compen-sation in banking structured to promote risk taking?, Journal of Monetary Eco-nomics, 36(2), 405-431.
Hvide, H. K., 2002, Tournament rewards and risk taking, Journal of Labor Eco-nomics, 20(4), 877-898.
Jensen, M.C. and W.H. Meckling, 1976, Theory of the firm: Managerial behavior,agency costs and ownership structure, Journal of Financial Economics, 3(4)305-360.
PAKISTAN JOURNAL OF APPLIED ECONOMICS70

Kindleberger, C. P., and R.Z. Aliber, 2005, Manias, panics, and crashes: A historyof financial crises, New Jersey: John Wiley & Sons, Inc.
Laeven, L., and R. Levine, 2009, Bank governance, regulation and risk taking, Jour-nal of Financial Economics, 93(2), 259-275.
Lazear, P., and S. Rosen, 1981, Rank-order tournaments as optimum labor contracts,Journal of Political Economy, 89(5), 841-864.
Levine, R., 2005, Finance and growth: Theory and evidence, Handbook of Eco-nomic Growth, 1, 865-934.
O'Reilly III, C. A., B.G. Main, and G.S. Crystal, 1988, CEO compensation as tour-nament and social comparison: A tale of two theories, Administrative ScienceQuarterly, 23(2), 257-274.
Pesaran, M. H., 2004, General diagnostic tests for cross section dependence in pan-els, University of Cambridge, Faculty of Economics, Cambridge Working Pa-pers in Economics No. 0435.
Peters, F. S., and A.F. Wagner, 2014, The executive turnover risk premium, TheJournal of Finance, 69(4), 1529-1563.
Prudential Regulations for Corporate /Commercial Banking (Risk Management andOperations), 2014, State Bank of Pakistan, BPRD Circular No.6.
Sanchez, G., 2012, Fitting panel data linear models in Stata, Senior Statistician,Stata Corporation LP, Puebla, Mexico.
Simkovic, M., 2009, Secret liens and the financial crisis of 2008, American Bank-ruptcy Law Journal, 83, 253.
AHMAD, SARWAR AND SIDDIQI, IMPACT OF CEOs PAY DISPARITY ON STABILITY OF BANKS 71

APPENDIX-A
PAKISTAN JOURNAL OF APPLIED ECONOMICS72
Breakup Total Assets of PakistaniBanking Sector (2013)(amounts in billions)
Share of Sample Banks in Overall Total Assets ofPakistani Banking Sector (2013)
(amounts in billions)
Private Commercial Banks8,12777%
Rest of Banks1,21312%
Sample Banks9,27488%
Foreign Banks2643%
Specialized Banks1752%
Public Commercial Banks1,92118%

Source: Author’s efforts. Data extracted from the State Bank of Pakistan, and the Annual reports of banks(2005 to 2013).
AHMAD, SARWAR AND SIDDIQI, IMPACT OF CEOs PAY DISPARITY ON STABILITY OF BANKS 73
Compensation Breakup of Banks’ CEO in Pakistan(amounts in millions)
Managerial Remuneration67%
Rent & House Maintenance10%
Utilities3%
Medical1%
Bonus11%
Others6%
Conveyance1%
Leave Encashment1%

APPENDIX-B
(Continued)
PAKISTAN JOURNAL OF APPLIED ECONOMICS74
Variable Definition Sources
Bank Stability/Distance to de-fault–Depen-dent variable.
Bank Stability is stability score of bank i in year t, asmeasured by Z score. Here stability means as to howmuch a particular bank has distance to get default. Zscore will be used as a proxy to measure the stabilityof a bank. It will be calculated by the following for-mula:
(ROA+CAR)BStabilityi,t =
(ROA)
whereas, ROA refers to return on assets and CARrefers to capital assets ratio. This formula will meas-ure the probability of insolvency/default of a particu-lar bank at a given time. The higher Z score valuewill indicate that a particular bank has higher profitsto meet its debt obligations. Z score is better thansimple standard deviation of stock return because itdirectly measure the distance from insolvency or inother words it measure the probability of default.
Bai andElyasiani(2013), andLaeven andLevine (2009).
CEO’s pay in-equality–Inde-pendentvariable.
CEO’s pay inequality is the percentage of CEO an-nual pay as compared to average pay of an executiveof particular bank is likely to be negatively relatedwith stability of bank. The CEO’s pay includes mana-gerial compensation, utilities, bonus and other mone-tary benefits paid during the year. Similarly, thisstudy has obtained average compensation of execu-tives in any particular bank by dividing total compen-sation paid to the executives of bank with number ofexecutives reported by the bank. Here ‘executive’means an employee, other than the chief executiveand directors, whose basic salary exceeds five hun-dred thousand rupees in a financial year. It is manda-tory for all listed banks to report this information intheir annual reports separately.
CEOannualpayCEOpayinequalityi,t =
Averageexecutivepay
Bai andElyasiani(2013), andLaeven andLevine (2009).

(Continued)
(Continued)
AHMAD, SARWAR AND SIDDIQI, IMPACT OF CEOs PAY DISPARITY ON STABILITY OF BANKS 75
Variable Definition Sources
Total assets –Control vari-able.
Total Assets are a natural log of total assets of bank iin year t as declared in annual consolidated balancesheet. It is a proxy for bank size and likely to be posi-tively related with stability of bank because largebanks are more organized, well regulated and haveexpanded product line and features to mitigate riskfactor. The large banks have better option & expertiseto diversify their business to minimize the firm spe-cific risk but leave the system risk unaffected.
Totalassetsi,t = ln(TotalAssetsi,t)
Bai andElyasiani(2013), Chen,et al. (2006),and Demsetzand Strahan(1997).
Capital Ratio –Control vari-able.
Capital Ratio will measure the financial leverage ofbank i in year t. It is likely to be positively related tostability of particular bank because high capital ratiomeans particular bank has sufficient funds to absorbits debt liabilities and losses due to non- performingloan. The high ratio ensures that the bank has lesschance to get insolvent. Resultantly, bank stabilitywill go up.
TotalEquityCapitalRatioi,t =
TotalAssets
Bai andElyasiani(2013), andChen, et al.(2006).
Loan Losses –Control vari-able.
Loan Losses will be used as a proxy to measure thecredit portfolio riskiness of banks i in year t. TheState Bank of Pakistan has made it mandatory for allbanks to maintain some provision based on the out-standing advances portfolio performance to cover thecredit risk. This ratio is likely to be negatively relatedwith overall stability of a bank. A high loan provi-sions/losses means that advances portfolio is not gen-erating income for the bank and bank is creatingprovision as per directions of regulatory authoritiesagainst non-performing loans. It will be calculated asbelow:
LoanProvsionsLoanLossessi,t =
TotalAssets
Bai andElyasiani(2013).
(Continued)
PAKISTAN JOURNAL OF APPLIED ECONOMICS76
Variable Definition Sources
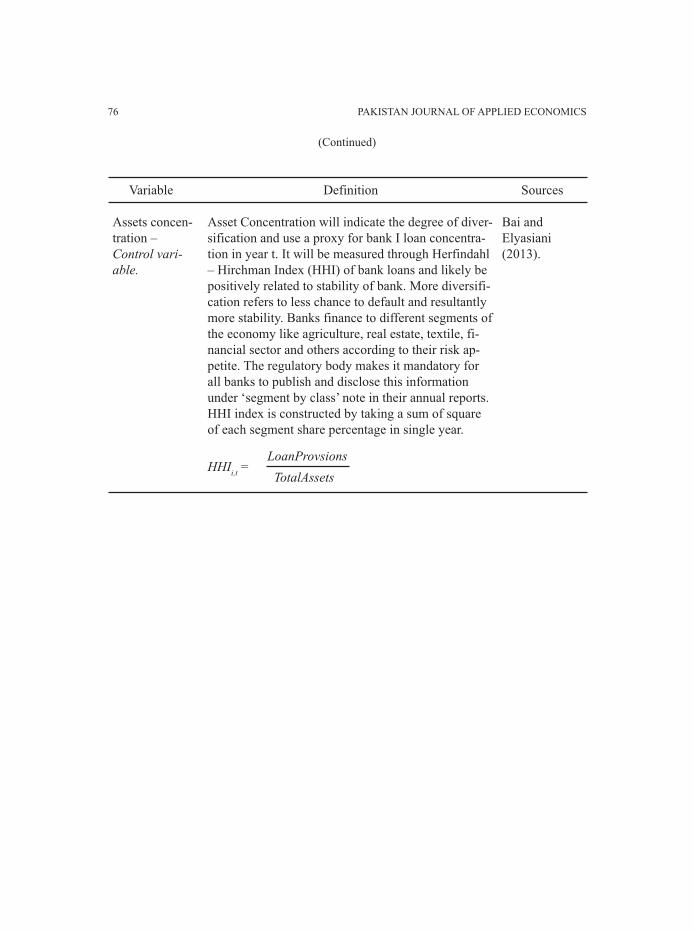
Assets concen-tration – Control vari-able.
Asset Concentration will indicate the degree of diver-sification and use a proxy for bank I loan concentra-tion in year t. It will be measured through Herfindahl– Hirchman Index (HHI) of bank loans and likely bepositively related to stability of bank. More diversifi-cation refers to less chance to default and resultantlymore stability. Banks finance to different segments ofthe economy like agriculture, real estate, textile, fi-nancial sector and others according to their risk ap-petite. The regulatory body makes it mandatory forall banks to publish and disclose this informationunder ‘segment by class’ note in their annual reports.HHI index is constructed by taking a sum of squareof each segment share percentage in single year.
LoanProvsionsHHIi,t =
TotalAssets
Bai andElyasiani(2013).