palestinian water authority - pwa.ps قارير/annual water status report... · pdf...
TRANSCRIPT


1
Palestinian Water Authority
Table of Contents
D ec e m b e r 2012
Annual Status Report on water resources, Water Supply, and Wastewater in the Occupied State of
Palestine2011

2
Water Status Report 2011
West Bank: Al-Bireh, Al-Balo’, Baghdad St. P.O.Box 2174, Al-Bireh | Tel: +972 2 242 9022 Fax: +972 2 242 9341
Gaza: Al Rimal, Al Wehdeh St. | Tel: +972 8 283 3609 | Fax: +972 8 282 6630
WWW.PWA.PS
Palestinian Water Authority

3
ContentsTable of Contents 3List of Tables 5List of Figures 7Abbreviations 8Foreword 10 Introduction 12
Part one Water Resources
Introduction 15Rainfall and recharge 16Rainfall 16Recharge estimate for the Season 2010/11 16Surface water 19The Jordan River 20Wadis 21Groundwater 23General Overview 23 Well Abstractions 25Springs Discharge 27Water Level Fluctuation 29
Water Quality 30Non-conventional water resources 32Treated wastewater reuse 32Desalinated water 33Purchased water (Mekorot) 33Water resources projects completed in 2011 34
Part two Water Supply Introduction 37Water supply versus water consumption 39Water supply and demand gap 41Water consumption 45Average Water Supply Rate 45Average water Consumption Rate 47Water supply costs and tariffs 47Water network coverage 50Water quality 51Water supply for agricultural purposes 54Water supply projects completed in 2011 57
1.11.21.2.11.2.21.31.3.11.3.21.41.4.11.4.21.4.31.4.41.4.51.51.5.11.5.21.5.31.6
2.12.22.32.42.4.12.4.22.52.62.72.82.9

4
Water Status Report 2011
Part three Wastewater Introduction 63
Wastewater resources and quantities in West Bank 65
Wastewater collection and disposal in West Bank 65
Urban Area 66
Refugee camps 67
Rural Area 68
Quantities of Wastewater 69
Treatment in Israeli WWTP’s (trans boundary streams) 71
Influent flowing inside West Bank (local streams) 72
Wastewater treatment in West Bank 73
Central Wastewater Treatment Plants 74
Collective Wastewater Treatment Plants 80
Onsite Small Scale Black Wastewater Treatment Plants 84
Wastewater Collection and Treatment in Gaza Strip 86
Existing wastewater treatment plants 88
Wastewater projects in 2011 90
3.1
3.2
3.3
3.3.1
3.3.2
3.3.3
3.3.4
3.35
3.3.6
3.4
3.4.1
3.4.2
3.4.3
3.5
3.5.1
3.6

5
List of TablesRecharge Estimates
Estimated discharge in West Bank wadis, 2010/2011 season
Summary of existing water harvesting structures
Water allocation according to Oslo agreement and utilization in 201 1
Summary of total abstraction from Palestinian wells per use
Summary of 2011 Palestinian wells abstractions per aquifer,West Bank
Wastewater network coverage, Gaza Strip, 2011
List of Water Resources Infrastructure projects in 2011
Total Supplied Amount (for Agricultural and Domestic Uses) - Governorate Scale (MCM), 2011
Domestic Water Supply and Consumption in the Palestinian Governorates
Supply and Demand Quantities (for 150 l/c/d)
Water Supply and Consumption Rates in the Palestinian Governorates
Population and communities served/ un-served with a water network in 2011
Distribution of tested water sample by district, West Bank, 2011
Water produced from local resources (wells and springs) for agricultural and non-agricultural uses per basin, 2011
Population connected to sewage network or cesspits, by type and locality and governorate
Population connected to sewage network or by governorate
Population connected to sewage network in the urban areas
Population connected to sewage network in the refugee camps
Population connected to sewage network in the rural areas
Estimated Annual Generated Wastewater (MCM) in the West Bank governorates
The Estimated Generated Wastewater in the West Bank wadis and treated in Israel
The Estimated Generated Wastewater in the West Bank local streams and non treated
The existing central wastewater treatment plants
Daily Wastewater Flow Rates of Al-Bireh WWTP
Treated Wastewater/Effluent Characteristics - Al-Bireh WWTP, 10 April 2010
Influent Wastewater Characteristics – Ramallah WWTP, 17 February 2008
Table1
Table 2
Table3
Table 4
Table 5
Table 6
Table 7
Table 8
Table 9
Table 10
Table 11
Table 12
Table 13
Table 14
Table 15
Table 16
Table 17
Table 18
Table 19
Table 20
Table 21
Table 22
Table 23
Table 24
Table 25
Table 26
Table 27

6
Water Status Report 2011
Treated Wastewater/Effluent Characteristics – Ramallah WWTP, 17 February 2008
Pretreated Wastewater/Effluent Characteristics – Tulkarm WWPTP, February 2011
Pretreated Wastewater/Effluent Characteristics – Jenin (Wadi Moqatta’, February 2011
Pretreated Wastewater/Effluent Characteristics – Nablus West (different locations, 2011
Existing collective wastewater treatment systems
Average Influent and Effluent Wastewater Characteristics - ‘Ein Siniya WWTP, April 2008 - January 2009
Agencies that implemented on-site small scale black/grey wastewater treatment plants
Projection of Gaza population in Gaza Strip, PCBC, 2007
The coverage of wastewater network all over the Governorates in Gaza Strip, 2011
General features of wastewater production and collection in Gaza Strip.
Treatment plants in the Gaza Strip, 2011.
Wastewater projects under preparation, implementation and completed in 2011
Table 28
Table 29
Table 30
Table 31
Table 32
Table 33
Table 34
Table 35
Table 36
Table 37
Table 38
Table 39

7
List of FiguresRainfall contour maps for the West Bank, 2010/2011 season and long term average West Bank average annual rainfall Averages of rainfall in the Gaza Strip Rainfall contour maps for the Gaza Strip, 2010/2011 season and long term average Current utilization of Jordan River water Surface water catchments and wadis Location of wells in the West Bank Average annual abstraction rate from all Palestinian Wells in the West BankAnnual spring discharge in the West Bank Annual average water level in well 14-17/005, northern part of WAB Representative water level decline in well L/57 in Gaza Annual average nitrate content in selected wells in the Jordan Valley Annual average chloride content in selected wells in Qalqilia and Tulkarem Representative chloride trend graph for the Gaza Strip Annual quantity of domestic water purchased from Mekorot (MCM XSelected indicators for water supply in the Palestinian Territory Water supply and demand in the west Bank (MCM) Water supply deficit in the west Bank- Summary Water Supply and Demand in the Gaza Strip (MCM) Supply Rate versus Consumption Rate in the West Bank Governorates (2011) Average selling price compared to the operating costs of the main 10 WSP in the West Bank governorates, 2011 Distribution of tested water samples (Coliform test) by District, West Bank, 2011 Distribution of testes water samples, networks and resources (Coliform test) by District, West Bank, 2011 Nitrates in West Bank wells monitored by PWA Nitrates in Gaza Strip wells monitored by PWA Water Supply based on the water use and water source- Governorate scale (MCM) West Bank population connected to sewers or cesspits West Bank population connected to sewers or cesspits by locality type. Existing and Planned Wastewater Plants in the West Bank Existing and Planned Wastewater Plants in the Gaza Strip
Figure 1 Figure 2 Figure 3 Figure 4 Figure 5 Figure 6 Figure 7 Figure 8 Figure 9Figure 10 Figure 11 Figure 12 Figure 13 Figure 14 Figure 15 Figure 16Figure 17 Figure 18 Figure 19 Figure 20 Figure 21
Figure 22
Figure 23 Figure 24Figure 25Figure 26 Figure 27 Figure 28Figure 29Figure 30

8
Water Status Report 2011
AbbreviationsAgence Française de Développement (French Developmen t Agency)
Eastern Aquifer Basin
European Commission
Ministry of Environmental Affairs
Gesellschaft für Internationale Zusammenarbeit (German Development Agency)
Government of Israel
Hydrological Service of Israel
Israeli Civil Administration
Institutional Water Sector Review project (integral part of Sector Reform Program)
Integrated Water Resources Management
Joint Service Council
Jordan Valley
Joint Water Committee
Jerusalem Water Undertaking
Lower Aquifer
Local Aid Coordination Secretariat
liter per capita per day
Million Cubic Meter
Million Cubic Meter per Year
millimeters
Multi-Year Water Allocation System
Northeastern Aquifer Basin
Non-governmental Organization
National Water Council
occupied State of Palestinian
Consortium led by ORGUT Consulting AB, also including Finnish Consulting Group Ltd. and Palestinian Wastewater Engineering Group
Project Implementation Unit
Project Management Unit
Palestinian National Authority
Parts per Million
Project Steering Committee
Palestinian Water Authority
Palestinian Wastewater Engineers Group
Reform Committee Unit
Reform Office
Reform Steering Committee
Swedish International Development Cooperation Agency
Service Provider
AFD
EAB
EC
MENA
GIZ
GOI
HSI
ICA
IWSR
IWRM
JSC
JV
JWC
JWU
LA
LACS
l/c/d
MCM
MCM/Y
Mm
MYWAS
NEAB
NGO
NWC
OSP
OR GUT
PIU
PMU
PNA
ppm
PSC
PWA
PWEG
RCU
RO
RSC
SIDA
SP

9
Terms of Reference
Technical, Planning and Advisory Services project (integral part of Sector Reform Program)
Upper Aquifer
United Stated Agency for International Development
Western Aquifer Basin
World Bank
West Bank Water Department
Water Evaluation and Planning
Water Resources Management
Water Supply and Sewerage Authority
Water Sector Working Group
World Water Forum
TOR
TPAT
UA
USAID
WAB
WB
WBWD
WEAP
WRM
WSSA
WSWG
WWF

10
Water Status Report 2011
FrorewordIn the framework of the water and waste water sector reform, the Palestinian Water Authority (PWA) in close cooperation and coordination with Technical Planning Advisory Team (TPAT) has accomplished the Water Status Report for 2011. The main objective of this report is to address the general status of all available water in Palestinian territories for 2011 with respect to sources, supply and wastewater.
The report includes three parts that reflect the water status in the State of Palestine; the first part discusses the Palestinian utilization of the available water resources in Palestine in 2011 with respect to water quantity and quality. The report includes also detailed analysis and evaluation for rainfall pattern, surface water and groundwater resources supported by illustration figures and tables. The second part of the report shows the current water supply figures for all Palestinian communities, it also gives general overview on the crisis of supplying water to Palestinians and the severe water shortage problem in Palestinian territories due to the current political conflict. The third part contains an overview of the wastewater situation in Palestine. This part gives general figures on the raw wastewater quantities generated in Palestinian territories and shows the current PWA efforts with international donors to construct several waste water treatment plants including large-scales and small-scales plants.

11
I would like to express my deep gratitude to the team of PWA for their commitment and efforts led to publishing this report, especially to the Water Resources Directorate; Omar Zayed, Deeb Abdelghafour, Majedah Alawneh; Salam Abu Hantash, Hazem Jouma and Anwar Zohlouf, and to the Planning Directorate, Adel Yasin, Dr.Hani Qasim, Hadeel Faydi, Ashraf Dweikat, Shahd Tibi, Fadi Safi ,and Rawan Isseed from TPAT Project Implementation Unit, and from PWA Gaza, Ahmed Yaqoubi, Mahmoud Abdullatif, and Jamal Dadah, for their efforts as a team to setup a concrete process to issue such report. Lastly, I would like to express my gratitude to the TPAT team for their technical support and the UNICEF team for their technical and financial support to enable PWA to set up a sustainable mechanism to disseminate the data and information on water and wastewater sector. In addition, special thanks to World Bank for funding the printing of this report.
Dr.Shaddad Attili Head of Palestinian Water Authority

12
Water Status Report 2011
IntroductionThis Annual Water Status Report aims to provide an overview on the water sector
situation in the Occupied State of Palestine during the year 2011. It is intended
that this report will be the first in a series of annual water status reports.
The report is divided in to three parts that describes the water resources, water
supply and the wastewater.
The report has been produced by PWA with assistance of TPAT Capacity Building
Program, which is co-funded by the World Bank and Sida(of Sweden) in a trust
Fund and the French Agency for Development (AFD).
This report targets water sector stake holders including but not limited
to government institutions, water professionals, water service providers,
municipalities, universities, NGOs and donor organizations, and is illustrated with
a large number of tables, figures and maps.
The report will be produced in the English language for this year only, English
and Arabic versions will be produced for the following years. The report can also
be downloaded from the PWA website (www.pwa.ps).

13
Water ResourcesPart one

14
Water Status Report 2011
Al - Auja Dam, March 2012Al - Auja Dam, March 2012

15
1.1 Introduction
Groundwater is the main source of water for Palestinians in the occupied Palestinian territory (West Bank and Gaza Strip) and provides more than 90% of all water supplies. The main aquifer systems can be divided into four distinct units; the Western Aquifer Basin, the North-eastern Aquifer Basin and the Eastern Aquifer Basin for the West Bank, and the Coastal Aquifer for Gaza, where the groundwater is available at much shallower depth.
Following the 1967 occupation, Israel has controlled all shared water resources including surface and groundwater, and has utilized more than 85% of these resources, leaving only 15% for Palestinian use. The surface water in OSP is represented by several seasonal wadis, as well as the Jordan River, which is currently controlled and used exclusively by the Israelis.
Due to the above mentioned, the OSP is among the countries with the scarcest renewable water resources per capita; average domestic water consumption is only 72 l/c/d in the West Bank, and 96 l/c/d in Gaza but with water quality is much below international standards. This is far below the per capita water resources available in other countries in the Middle East and in the world, constraining economic development, increasing running costs leading to health problems. More than half of the available groundwater is u sed for domestic water supply, severely limiting the available volume for irrigated agriculture and industry.
The water situation in Gaza is much worse than in the West Bank. The Coastal Aquifer in the Gaza Strip receives an annual average recharge of 50-60 MCM/y mainly from rainfall, while the annual extraction rate of this aquifer complex is estimated at about 178.8 MCM. These unsustainably high rates of extraction have led to lowering the groundwater level, the gradual intrusion of seawater and upwelling of saline groundwater. Tests have indicated high salinity levels of more than 1,500 ppm chloride, making significant parts of the aquifer unsuitable for drinking water, domestic applications and for many irrigated crops. The shallow aquifer complex is also very vulnerable to ongoing and serious pollution from agriculture, solid waste and wastewater. In fact it is believed that the Gaza Aquifer has already passed the point of no return and needs to be regenerated before it can be sustainable used again, leaving the population of the Gaza Strip without a reliable and affordable water source.This report gives a general overview of the current water resources available for Palestinians covering both local resources and non-conventional sources.

16
Water Status Report 2011
1.2 Rainfall and recharge1.2.1 RainfallThe climate in the Palestinian territory is Mediterranean in its basic pattern, and varies from semi-arid in the west to extremely arid in the east and southeast.
he mean annual rainfall in the West Bank varies from about 650 mm in the western part to less than 100 mm in the east; the long-term annual average is about 454 mm. During the past 8 years, average accumulated annual rainfall increased in the northern and north western parts of the West Bank. In 2010/2011 however rainfall in the northern and western parts of the area peaked at only 538 mm/y, while in the east it was as low as 70 mm/y. The average annual rainfall for the year 2010/2011 for the entire West Bank was about 347 mm. For the West Bank Figure 1 shows the spatial distribution for the average annual rainfall in 2010/2011 and for the long-term annual average rainfall. Annual rainfall normal display most extreme spatial distribution, the spatial rainfall variation is uneven, and the areas receiving different amounts of rainfall are not of the same size. Figure 2 shows the historical records of annual average rainfall in the West Bank.
Figure (1) Rainfall contour maps for the West Bank, 2010/2011 season and long
term average

17
Figure (2) West Bank average annual rainfall
In Gaza Strip, the average rainfall is calculated over the period 1981-2010 for 12 stations as shown in Figure 3, while Figure 4 presents the spatial distribution of average rainfall for the 2010/2011 season.
Figure( 3 Averages of rainfall in the Gaza Strip
Rainfall in Gaza Strip during the season 2010-2011 is classified low (225mm) if compared with the long-term annual average rainfall of 372.1 mm. Rainfall is unevenly distributed it varies considerably by governorates from the North to the South.

18
Water Status Report 2011
Figure (4)Rainfall contour maps for the Gaza Strip, 2010/2011 season and long
term average.
1.2.2 Recharge estimate for the Season 2010/11
Based on rainfall figures for the hydrological year 2010/2011, the total water volumes over the West Bank and Gaza Strip were 2390 MCM and 81 MCM, respectively. The 2010/2011 season average recharge for the three West Bank ground water basins was estimated at 598 MCM. This recharge quantity was calculated as follows: about 153 MCM received as a net recharge to the Eastern Basin, around 311 MCM to the Western Basin and around 134 MCM to the North-eastern Basin. Meanwhile, the groundwater recharge in the Gaza coastal aquifer was about 33MCM. Table 2 shows the recharge estimate for the groundwater aquifers in the West Bank and Gaza strip.

19
Table (1) Recharge Estimates
Aquifer-Basin
Area within
West Bank
( Km2)
Average
rainfall
(mm)
2010/2011
Recharge
Volume
2011/ 2010
(MCM)
Long-term
Average
Recharge
(MCM)
Western Aquifer 1,767 407 311 318-430
Northeastern
Aquifer981 433 134 135-187
Eastern Aquifer 2,896 281 153 125-197
West Bank Total 5,644 347 598 578-814
Coastal Aquifer 365 225 33 55-60
Palestine Total 6,009 631 633-874
* Note: the indicated areas and recharge are those within the West Bank and Gaza.
It is obvious from the table above that the total recharge rates for all aquifers in season 2010/2011 were less than the long-term annual average rates. If this trend continues it will have a negative impact on the water resources in the West Bank; for the Gaza Strip the effect is even more immediate and it will accelerate the aquifer collapse.
1.3 Surface water
Surface water resources are represented mainly by the Jordan River and ephemeral wadis flowing towards three basic directions: towards the Mediterranean (West Bank and Gaza Strip), toward the Jordan Valley and towards the Dead Sea.

20
Water Status Report 2011
1.3.1 The Jordan River
The Jordan River is one of the main rivers in the region, and the only permanent river in the West Bank and in the whole of the OSP. It flows from north to south from an altitude of 2200 meters above sea level to end at the Dead Sea at an altitude of 425 meters below sea level. The Jordan River is shared among five riparian countries: Palestine, Jordan, Syria, Lebanon and Israel, with the latter using most of the water.
The Jordan River flows into Lake Tiberius, and continues south to join with the Yarmouk River at the Yarmouk Triangle, then flows south to end at the Dead Sea. Historically, the quantity of water flowing into the Lower Jordan River and discharging into the Dead Sea is estimated 1400 MCM/y. This amount decreased dramatically during the past six decades and is presently no more than 30 MCM/y (FOEME-2010). This huge reduction in flow is mainly due to diversion of its water by Israel of more than 500 million cubic meters through the National Israel Water Carrier that extends south to the Negev, in addition to the construction of many dams upstream. Moreover, natural factors such as evaporation also had an adverse impact on Jordan River flows. Furthermore, the Jordan River is threatened by the discharge of large quantities of untreated wastewater from Israeli settlements located along south of Lake Tiberius. Figure 5 shows the current utilization of the Jordan River by riparian countries.
Jordan River
Jordan
Lebanon
Syria
160 MCM
235 MCM
5 MCM
West Bank
0 MCM
30 MCMResidual Water raeched to Dead Sea
Meddeirainian Sea
800 MCM
Israel
130000
130000
155000
155000
180000
180000
205000
205000
230000
230000
255000
255000
100000
125000
150000
175000
200000
225000
250000
275000
300000
·
LegendJordan river basinPolitical Borders
2011Utilization of Jordan River
400 – 550 MCM to the NWC

21
1.3.2 Wadis
Runoff water flowing in wadis during the rainy season forms an important potential source of water. The long-term average annual flow of flood water through wadis in the West Bank is estimated at about 165 MCM/y. During the 2010/2011 season the average flow reached 131 MCM/y. The West Bank wadis are classified into eastern (toward the Jordan Valley and the Dead Sea) and western (towards the Mediterranean) by the direction of flow as shown in Figure 6. About 33 major West Bank surface catchments are recognized, Table 2 lists the annual average flow.
Figure (6) Surface water catchments and wadis

22
Water Status Report 2011
Table (2) Estimated discharge in West Bank wadis, 2010/2011 season
In the Gaza Strip, the main wadi is Wadi Gaza, which originates at the eastern border where Israel is trapping the natural flow for irrigation purposes. This (action dries the Wadi except in very wet years. Due to the flat topography in Gaza for storing and using any remaining surface water resources is very limited. In the overview (Table 2) the flow from the Gaza Wadis is not included for this reason.
Surface water harvesting of wadis was not taken into account in the National total volume as it is still not much developed, despite

23
significant interest. The required investments are high and in addition the Israeli occupation imposes severe restrictions on dam-construction permits. Table 3 shows the existing storm water harvesting structures in the West Bank and the harvested quantities.
Table (3) Summary of existing water harvesting structures
.No Harvesting method Location Use Potential (CM)
1 Dams Al Auja Agriculture 700,000
2 Cisterns West Bank Domestic 4,000,000
3 Agricultural Ponds Jordan Valley, Marj Ibn A’mer Agriculture 750,000
1.4 Groundwater1.4.1 General OverviewGroundwater is the main source of water for the Palestinians in the West Bank and Gaza Strip, providing more than 90% of fresh water supply for various purposes. The main aquifer systems are comprised of several deep-seated rock formations from the Lower Cretaceous to the recent age. The spatial and vertical hydro-geological variety of the Mountain Aquifers in the West Bank determines the quantity, quality, and extraction cost of ground-water, which differ greatly within this relatively small area. The system is di-vided into four units, three units on the West Bank and one in the Gaza Strip. For the descriptions below only the Palestinian parts of the shared aquifers are considered when discussing sustainable yield and abstraction. If Israeli abstraction within the West Bank is considered, then the sustainable yield is comparable but not equal to long term average recharge.Western Aquifer Basin: This is the largest basin and the most important among the West Bank Aquifer basins. It has an annual yield ranging from 362-400 MCM per year. However, this basin is heavily exploited by the Israelis at variable rate of 340-430 and in some years it reaches more than 520 MCM/Y, while the Palestinians utilization is about 25MCM/y from wells in 2011. The main aquifer system in this basin is the upper and lower Cenomanian aquifers.Northeastern Aquifer Basin: Most of the recharge areas of this basin are located within the West Bank boundaries and it has an annual yield of 100-145 MCM. Despite this, the Israelis exploit the aquifer at a rate of 103 MCM/Y, most of this quantity taken from springs in the Galbou’ Area. The Palestinians utilized only 20 MCM/Y from wells and springs in 2011, mainly from the shallow Eocene aquifer. The aquifer system in this basin includes the shallow Eocene Aquifer, Upper and Lower Cenomanian Aquifers.

24
Water Status Report 2011
Eastern Aquifer Basin: The basin is divided into three main sub-aquifers, namely the Mountainous Heights, Northeastern Tip and Jordan Valley. The annual yield of this basin varies from 145 to 185 MCM. However, the Israelis exploit the aquifer at a rate of 50 MCM/Y from wells in addition to 100 MCM/y from Dead Sea Springs that are controlled by Israel; while the Palestinians utilized about 42 MCM/y from groundwater wells and springs in 2011.
Table 4 shows the groundwater allocations for both sides according to Oslo agreement and the consumption figures in 2011 from the three shared groundwater aquifers (West Bank area only). It is obvious from Table 4 that, 17 years after the Oslo Agreement came into force, the Palestinians in the West Bank are still utilizing only less than 14% of available shared groundwater resources, while the Israelis utilizing more than 86%.
Table (4) Water allocation according to Oslo agreement and utilization in 2011
*This includes 100 MCM from Dead Sea springs, which Israel prevents Palestinians from developing
** This doesn’t include the water quantity from unauthorized wells.
The Gaza Coastal aquifer: The Coastal Aquifer is the only source of water in the Gaza Strip, with the thickness of the water bearing strata ranging between several meters in the east and south-east to about 120-150 m in the western regions and along the coast. The aquifer consists mainly of sand and gravel and sandstone (Kurkar) intercalated by clay and silt. A hard and non-productive layer of clay and marl with low permeability (Sakia Formation) has a thickness of about 800-1000 m situated below the coastal aquifer. The yearly recharge volume for this limited aquifer is in the range of 55-60 MCM/yr.

25
1.4.2 Well Abstractions
The total number of the Palestinian wells in the West Bank tapping all aquifer systems is 383, of which 119 wells are not pumping or abandoned and in need for rehabilitation Figure 7. The total annual abstraction from the pumping wells is approximately 65.5 MCM in year 2011 among of which 33.5 MCM for domestic uses and 32 MCM for agricultural; Figure 8 shows the annual average abstraction from Palestinian wells during the period of 2007-2011. The number of Israeli wells inside West Bank is 39, and the average annual abstraction of these wells is estimated at about 54 MCM. Furthermore, Israel has more than 500 wells inside the Green Line (mainly in the Western Basin), which abst ract more than the annual recharge rate of all aquifers. As a result, the Palestinians are inevitably affected due to general decline of water level in the aquifers, as the total annual abstraction greatly exceeds the recharge rates.
Figure(7) Location of wells in the West Bank

26
Water Status Report 2011
Figure (8 ) Average annual abstraction rate from all Palestinian Wells in
the West Bank
Table 5 and Table 6 summarize the total abstractions from Palestinian wells per use and per aquifer, respectively. In Gaza, the total abstracted volume in 2011 for municipal uses is about 92.8 MCM in addition to 4.2 MCM/y supplied from Mekorot and for agricultural use is about 86 MCM with total supplied volume of about 178.8 MCM. This means that the total recharge is only one third of total abstractions. Consequently, the cumulative water deficit is still increasing even when there was a remarkable increase in the amount of rainfall received in the season of 2010-2011 compared with previous years.
Table ( 5) Summary of total abstraction from Palestinian wells per use
Basin
Palestinian Abstractions (MCM) in 2011
Domestic Agriculture Total
Western Basin 7.9 17.1 25.0
Eastern Basin 7 .13 12.0 25.7
North-eastern Basin 11.9 2.9 14.8
Total West Bank 33.5 32 65.5
Gaza Coastal Aquifer 92.8 86 178.8
27
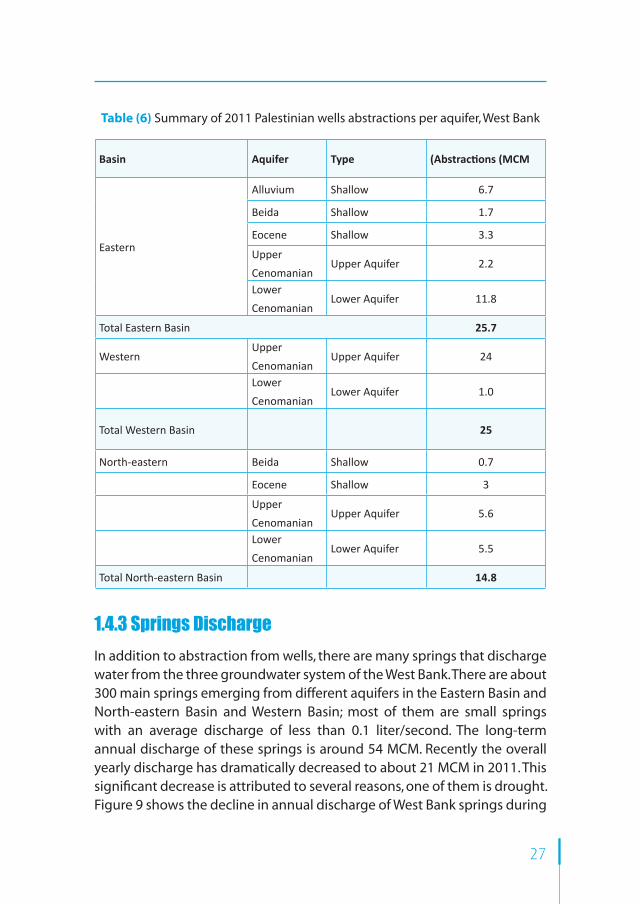
Table (6) Summary of 2011 Palestinian wells abstractions per aquifer, West Bank
basin Aquifer Type )Abstractions (mcm
Eastern
Alluvium Shallow 6.7
Beida Shallow 1.7
Eocene Shallow 3.3
UpperCenomanian
Upper Aquifer 2.2
LowerCenomanian
Lower Aquifer 11.8
Total Eastern Basin 25.7
Western UpperCenomanian
Upper Aquifer 24
LowerCenomanian
Lower Aquifer 1.0
Total Western Basin 25
North-eastern Beida Shallow 0.7
Eocene Shallow 3
UpperCenomanian
Upper Aquifer 5.6
LowerCenomanian
Lower Aquifer 5.5
Total North-eastern Basin 14.8
1.4.3 Springs Discharge
In addition to abstraction from wells, there are many springs that discharge water from the three groundwater system of the West Bank. There are about 300 main springs emerging from different aquifers in the Eastern Basin and North-eastern Basin and Western Basin; most of them are small springs with an average discharge of less than 0.1 liter/second. The long-term annual discharge of these springs is around 54 MCM. Recently the overall yearly discharge has dramatically decreased to about 21 MCM in 2011. This significant decrease is attributed to several reasons, one of them is drought. Figure 9 shows the decline in annual discharge of West Bank springs during

28
Water Status Report 2011
2005-2011. Meanwhile, the Dead Sea springs which are located in the Eastern Basin discharged about 110 MCM/yr, these springs are under the control of the Israelis.
Generally, the springs in the Eastern Aquifer Basin are divided into two groups:
1. Jordan River Basin Springs: A group of 42 main springs that flow towards the east to the Jordan River Basin through the eastern wadis of the West Bank. Their long term annual discharge is about 33 MCM. The most important springs of this group are: Bardala, Far’a, Fasail, Diouk, Nou’meh Ein Sultan, Qilt and Auja.
2. Dead Sea Basin Springs: A group of about 21 main springs located directly near the north western areas of the Dead Sea inside the West Bank. Their long term annual discharge reaches about 110 MCM; and has a brackish quality. The most important springs of this group are: Fashkha springs Ghuweir, Turaba and Ein Gedi.
There are 36 main springs in the North-eastern Basin that has long-term annual discharge of 14 MCM. Generally, variation of springs discharge from one year to another depends mainly on rainfall and abstraction rates from the aquifer.
Figure (9) Annual spring discharge in the West Bank

29
1.4.4 Water Level Fluctuation
During the past years, a clear decline was observed in groundwater levels of many production wells in the West Bank and the Gaza Strip. Declines occurred mainly in the southern parts of the West Bank as a result of the recent repeated drought and intensive abstraction from the nearby Israeli wells. The decline in water level varies from well to another based on well location, hydro-geological properties and pumping in terms of quantity and duration. Generally, the decline varied from just a few meters in the north to more than 20 m in the south over the past 3 years. Figure 10 represents the annual average water levels in selected well in Western Basin.
Figure (10) Annual average water level in well 14-17/005, northern part of WAB
Moreover, the decline in groundwater levels was also observed in many groundwater wells in the Gaza Strip. This is a natural consequence of abstraction rates being significantly higher than the recharge rate of the coastal aquifer. The most serious declines have been observed in the northern and southern parts of Gaza Strip as a result of intensive local pumping (Figure 11).

30
Water Status Report 2011
Figure (11) Representative water level decline in well L/57 in Gaza
1.4.5 Water Quality
As a general overview on water quality status in West Bank aquifers, a partial analysis including only chloride and nitrate content is presented. The used data are based on averaging the available time-series data in PWA during the period of 2005-20011. Furthermore, and in order to evaluate general trends in groundwater quality, data from selected representative wells in Jordan Valley, Qalqilya, Tulkarem were selected. In the Jordan Valley Area, many wells show a gradual increase in nitrate concentrations over time, Figure 12. This reflects significant agricultural activity in this area. Meanwhile, the nitrate concentration shows a general increase in the Jordan Valley area and in Tulkarem and Qalqilia districts from 2007 to 2009. For chloride, it was observed from the annual records (2005-2011) that none of the wells located in Qalqilia and Tulkarem districts exceed the acceptable limit. However, there is a gentle increasing trend in chloride concentration in some wells (Figure 13).
(A) (A) Booster station kardala, Tubas
(B) (B) wadi al qilt, alfuwar spring, Jericho
(c) (c) Jenin well #2, Jenin

31
Figure (12): Annual average nitrate content in selected wells in the Jordan Valley
Figure 13: Annual average chloride content in selected wells in Qalqilia and Tulkarem
In Gaza, the direct consequences of over pumping of the coastal aquifer are seawater intrusion and uplift of the deep brine water; as a result the water quality falls below the accepted international guidelines for potable water resources. Currently, several agricultural wells are also showing high salinity levels. In addition to this Gaza is experiencing serious wastewater-driven problems, it is characterized by high levels of nitrates in the groundwater. The chloride concentration of the pumped water is in the range of 100-1000 mg/l, while the nitrate is in the range of 50-300 mg/l. resulting in less than 5% of the delivered domestic water matching prevailing drinking water standards. A significant water salinity increase was generally observed in 2011 as a result of continuous over-pumping. The trend of increase varies from well to well based on well location, abstraction rate and pumping duration (Figure 14).

32
Water Status Report 2011
Figure (14) Representative chloride trend graph for the Gaza Strip
1.5 Non-c onventional water resources
1.5.1 Treated wastewater reuse
According to a recent PCBS survey in 2011, around 32% -35% of the households in the West Bank are connected to a wastewater (WW) collection system. Today, only one Palestinian wastewater treatment plant is functioning in the West Bank, treating less than 3% of all sewerage produced.
Not only systematically blocking the development of Palestine’s wastewater and sanitation sector, but also Israel has been, unilaterally imposing new wastewater arrangements that are patently unfair. Around 15 MCM of the generated WW is treated inside of Israel from Jenin, Tulkarm, Nablus, Ramallah, Beit Jala, and Hebron. Since 1996, for example, Israel has unilaterally deducted over $US42 million from Palestinian tax revenues for the construction and maintenance of wastewater treatment plants in Israel built to treat and reuse Palestinian wastewater for the exclusive use of Israel’s agricultural sector. Palestinians receive no compensation for this lost resource (WWF6 Fact Sheet, 2012). Of the 30 proposed Palestinian wastewater treatment plant proposals submitted to the Joint Water Committee since 1995, only 4 have received approval from Israel. Even with Joint Water Committee approval, the construction of these wastewater treatment plants has been repeatedly delayed.
In the Gaza Strip, four WWTPs exist (Beit Lahia, Gaza, Khan Younis and Rafah) where though Khan Younis WWTP is a matter of a collection pond. Collectively, these provide coverage of about 72% of the households but

33
the quality of treated effluent is far below Palestinian and International guidelines and remains a serious hazard to groundwater quality and public health (Table 7). There are plans started to be implemented for treating all Gaza wastewater by the construction new three regional WWTPs.
Table (7) Wastewater network coverage, Gaza Strip, 2009
Governorate Population Waste water
(Production (m3/day
% Coverage
North Area 298,000 23,000 80
Gaza 547,000 60,000 90
Middle Area 224,000 10,000 75
Khan Younis 300,000 9,000 40
Rafah 184,000 10,000 75
TOTAL 1,553,000 112,000 72
1.5.2 Desalinated water
Desalination of brackish water to achieve acceptable levels of drinking water quality is an important OSPion that is still not implemented in the West Bank. In Gaza it was implemented at small scale. Around 2-3 MCM/yr is provided for drinking through about 100 private water vendors (brackish groundwater desalination) in addition to one public sea water desalination plant and around six pubic brackish water desalination plants operated by CMWU and Municipal Departments.
The PWA recently finalized a study of water supply OSPions for the short, medium and long term. At the short term, low volume (STLV) sea water desalination plant to be constructed with a total capacity of 13 MCM/y. In the long-terms regional seawater desalination plant will be constructed with a capacity of 55 MCM/y by the year 2017-2022.
1.5.2 Purchased water (Mekorot)
West Bank water supply relies heavily on the import of water from Mekorot systems. These imports compensate to some extent the constraints imposed on the development construction of new wells and have been increasing during the recent years (see Figure 15). The total quantity provided to the Palestinian Communities in the West Bank through Mekorot is about 53MCM (around 49 MCM for domestic usage and 4 for agricultural usage) and about 4.2 MCM in Gaza Strip.

34
Water Status Report 2011
Figure (15) Annual quantity of domestic water purchased from Mekorot (MCM)
Source: Draft water strategy report, 2012
1.6 Water resources projects completed in 2011
Several water resources infrastructre projects have been implemented during the year of 2011. Most of these projects were funded and implemented by different donors under close coordination and supervision from WBWD and PMU. Table 8 shows the implemented projects during 2011.
Table (8) List of Water Resources Infrastructure projects in 2011

35
Water SupplyPart two

36
Water Status Report 2011
Al Qilt & Al Fuwar Spring, Jericho

37
2.1 IntroductionAccess to clean drinking water is essential not only for human health, but also to the economic and municipal development of a society. Water scarcity in Palestine continues to be the cause of political conflict and additional costs while ensuring an adequate amount of clean water remains extremely difficult. Moreover, the Occupied State of Palestine (OSP) suffers from exceptional circumstances under the Israeli occupation that denies the Palestinians from their rights and restricts their access to water resources. This struggle that the Palestinians face within the water supply process is continuously increasing under the growing population and water demands.
In 2011 a total volume of 323 million cubic meters (MCM) of water was supplied to the OSP. Table 9 explains that 137 MCM was utilized for agriculture while the remaining 186 MCM was utilized for domestic, public, commercial and industrial uses (which will be referred to hereafter as “water utilized for domestic uses”). This resulted with low quantity of water supplied in the West Bank and low quality of water supplied in the Gaza Strip. The situation in Gaza remains critical. 184MCM was available, 86MCM for agriculture and 98MCM for all other uses. The total volume available to the public supply system indicates a relatively high per capita use, however this figure can be misleading since over 90% is of poor quality and the volume of water extracted from the coastal aquifer is three times more than that recommended to sustain the aquifer for future use. Gaza plans to improve both the quality and quantity of existing supplies by constructing a 55MCM/yr desalination plant and is implementing parallel projects to rehabilitate its water supply networks to Non Metered Water which is as high as 45%.
The West Bank suffers different but equally serious problems in that it is denied its access to water rights, whilst Israel abstracts water from the West Bank for ever expanding settlements and sells what little remains back again to Palestinians. Palestinian attempts to maximize and redistribute available supplies are hampered by a total control of Israel and severe restrictions in the building or rehabilitation of water infrastructure outside Area A.

38
Water Status Report 2011
Average consumption, excluding agriculture is around 73 l/c/d, remains low compared to Israel. Dramatically 70 communities, with a population of 112,733 remain without piped water supplies in 2011.
Figure 16 shows a general description of the OSP water supply dependence on local and purchased resources on one hand; and its distribution to domestic and agricultural uses on the other hand. This figure clearly shows the difference in the water supply system in both West Bank and Gaza Strip. despite the fact that Gaza’s population makes no more than 68% of the West Bank’s, but the water supply for agricultural and domestic supplies is considerably higher, this is due to the high abstraction rates from the coastal aquifer despite the poor water quality where the aquifer is being over pumped with annual quantities that double that of the safe pumping rate (50-60 MCM/year); this has forced seawater and water from surrounding saline aquifers to intrude into this fresh water source leading to water salination. Hence, this made the purchased resources almost invisible compared to the large amounts of water abstracted from the local resources.
Table (9) Total Supplied Amount (for Agricultural and Domestic Uses) -
Governorate Scale (MCM), 2011
Governorate Total
resources )MCM)
Supply based on use
Domestic use Agricultural use
Jenin 6.8 5.7 1.1
Tubas 7.4 1.5 5.9
Tulkarem 15.1 5.2 9.9
Nablus 17.1 15.0 2.1
Qalqilya 10.9 4.7 6.2
Salfit 2.5 2.5 0.0
Jericho 27.9 3.8 24.1
Ramallah and Jerusalem 22.8 21.3 1.5
Bethlehem and Hebron 29.1 28.6 0.5
Total- West bank 139.6 88.3 51.3
Total- Gaza Strip 183.7 97.7 86.0
Palestinian Territory 323.3 186.0 137.3

39
Figure (16) Selected indicators for water supply in the Palestinian Territory
In this chapter, an attempt is made to evaluate water supply and demand with the available secondary data that was not particularly designed for this purpose. The main focus of this section is to discuss the water supply, consumption, demand and deficit.
2.2 Water supply versus water consumptionIn the year 2011, 58% of water supplied in the OSP was for domestic purposes -including industrial and commercial purposes- with 88 MCM supplied to the West Bank and 98 MCM supplied to Gaza Strip. And the rest 42% was supplied for agricultural purposes with 51 MCM supplied to the West Bank and 86 MCM supplied to Gaza Strip. This section will focus on the water supply for domestic purpose, which is explained in Table 10 below.

40
Water Status Report 2011
Table (10) Domestic Water Supply and Consumption in the Palestinian
Governorates
Governorate Population
Total
Supplied
(MCM)
Total
Consumed
(MCM)
Total Losses
(MCM)
Percent
of Losses
%
Jenin 281,158 5.7 3.9 1.8 31
Tubas 56,642 1.5 1.1 0.4 29
Tulkarem 168,973 5.2 3.3 1.9 36
Nablus 348,023 15.0 10.2 4.8 32
Qalqilya 100,012 4.7 3.4 1.3 28
Salfit 64,615 2.5 1.8 0.7 27
Ramallah 310,218 16.6 12.5 4.2 25
Jericho 46,718 3.8 2.9 0.9 24
Jerusalem 147,489 4.7 3.1 1.6 33
Bethlehem 194,095 11.3 7.5 3.8 34
Hebron 620,418 17.3 12.6 4.7 27
Total - West
Bank2,338,361 88.3 62.3 26.0 30
North 309,345 21.9 11.8 10.1 46
Gaza 537,890 36.2 21.0 15.2 42
Middle 236,198 15.2 8.3 6.9 45
Khan Younis 301,136 15.2 8.4 6.8 45
Rafah 195,598 9.2 5.4 3.8 41
Total- Gaza
Strip1,580,167 97.7 54.9 42.8 44
Water consumption is the water delivered to customers from distribution network and metered (billing system). The water loss in the West Bank reached up to 36% of the supplied water (Tulkarem and Nablus). Table 10 shows that the amount of water loss in Nablus or in Ramallah (4.8 MCM and 4.7 MCM respectively) covers all the needed amounts for Tubas, Salfit, or Jericho (3.1 MCM, 3.5MCM, 2.6 MCM respectively as shown in Table 11 in the following section). This is why options should be clear regarding the further identification of losses occurrence and the efforts needed to control or eliminate them. However, PWA and local water service providers have

41
developed their capacity in detecting real losses and monitoring water theft. The term “Real Losses” is defined by the Environmental Protection Agency (EPA) as the physical leaks that consist of leakage from transmission and distribution mains, leakage and overflows from the utilities storage tanks and leakage from service connections up to and including the meter. Locating and repairing the leak is part of the operation and maintenance (O&M) priorities. However, as the integrity of our aging infrastructure decreases, the loss of water in the distribution system increases. This has an extrusive relation with the water cost; to cover the additional cost, the suppliers pass the cost of the lost amounts of water to the consumers through their bills. Eventually, this increases the price of water and decreases the consumption rate.
2.3 Water supply and demand gapPalestinians are accustomed to occasional droughts, scarcity of water, water restraints, and a frequent displacement of people as a result; reaching the needed amount of drinking water is a huge challenge in the middle of the on-going circumstances. Table 11 shows that the needed quantities to provide a per capita supply rate of 150 L/c/d (based on the WHO standard supply rate) in the West Bank are almost 40 MCM more than the currently available quantity. Moreover, and paying attention to the actual consumption (after deducting the losses in the supplied quantities) compared to the needed quantities, the gap (deficit) increases to almost 66 MCM.
Table (11) Supply and Demand Quantities (for 150 l/c/d)
Governorate Population Needed
Quantities
(MCM)
Supplied
Quantities
(MCM)
Deficit
(MCM)
Actual
Consumption
(MCM)
Actual
Deficit
(MCM)
Jenin 281,158 15.4 5.7 9.7 3.9 11.5
Tubas 56,642 3.1 1.5 1.6 1.1 2.0
Tulkarem 168,973 9.3 5.2 4.1 3.3 6.0
Nablus 348,023 19.1 15.0 4.1 10.2 8.9
Qalqilya 100,012 5.5 4.7 0.8 3.4 2.1
Salfit 64,615 3.5 2.5 1 1.8 1.7
Ramallah 310,218 17.0 16.6 0.4 12.5 4.6
Jericho 46,718 2.6 3.8 -1.2 2.9 -0.3

42
Water Status Report 2011
Jerusalem 147,489 8.1 4.7 3.4 3.1 5.0
Bethlehem 194,095 10.6 11.3 -0.7 7.5 3.1
Hebron 620,418 34.0 17.3 16.7 12.6 21.4
Total West Bank 2,338,361 128.2 88.3 39.9 62.3 65.9
North 309,345 16.9 21.9 -5.0 11.8 5.1
Gaza 537,890 29.4 36.2 -6.8 21.0 8.4
Middle 236,198 12.9 15.2 -2.3 8.3 4.6
Khan Younis 301,136 16.5 15.2 1.3 8.3 8.2
Rafah 195,598 10.7 9.2 1.5 5.4 5.3
Total- Gaza Strip 1,580,167 86.4 97.7 -11.3 54.9 31.5
Figure 17 shows the importance of depending on the actual consumption to get the realistic values; it shows the gap between the available amounts of water and the needed amounts (assuming an average supply rate of 150 l/c/d). This Figure shows that Jericho and Bethlehem have supply rates that cover and exceed the needed quantities. Yet, the actual surplus is only in Jericho (with a limited amount of 0.3 MCM) which refutes the fact that Bethlehem consumers are supplied with more than 150 l/c/d, but also suffer from water shortage that does not meet their demand. Refer to Figure 18 for a summary map on water supply and demand.
Figure (17) Water supply and demand in the west Bank (MCM)

43
Figure (18 ) Water supply deficit in covering domestic demand in the west Bank , 2011

44
Water Status Report 2011
Looking at water supply and demand situation in the Gaza Strip in Table 11, shows that there is a massive effect of the water loss in Gaza compared to thatin the West Bank. This is reflected in Figure 19 below; where an additional indi-cator is added to the graph explaining the actual deficit rather than the “defi-
cit” itself (that depends on the water consumption and takes the water losses into consideration). The losses in Gaza reached high percentages up to 46% -as mentioned earlier- which makes a huge difference and almost double the loss percentages in the West Bank. The demand gap based on the supplied amounts (deficit) calculations showed that all governorates (except Khan Younis and Rafah) have surplus in their water supplies, however the actual deficit calculations showed that none of the governorates cover the needed.amounts and there is an actual deficit of about 32 MCM in the Gaza StripThe thriving need for additional water quantities that cover the population’s need needs a serious action to be taken. This includes building adequate drinking water infrastructure to deliver the supplementary amounts along with preventing current and future infrastructure from falling into disrepair as a result of inadequate institutional arrangements, insufficient cost-recovery, poor operation and maintenance, overall lack of sound management practices, and above all adjustment of agreements set with the Israelis. Progress towards providing drinking water needs to be accelerated and sustained to contribute to breaking the circle of poverty, lack of education, poor housing and ill-health.
Figure 19 Water Supply and Demand in the Gaza Strip(MCM)

45
2.4 Water consumption rate - individual analysis
2.4.1 Average Water Supply Rate The quantity of water delivered and used at the household level is an important indicator that measures the adequacy of domestic water supply and influences hygiene and public health. The supplied water must meet the minimal quality standards for the particular use, with drinking water having extremely strict standards. This was applied in the West Bank resulting with a total available amount of water for domestic uses of about 88 MCM supplied to 2,34 million capita, with an average daily water supply rate of 103 Liters per capita as shown in Table 12.
In 2011, the supplied amounts did not exceed 70% of the international recommended supply rate. Nevertheless, this does not deny the fact that water supply rates increased significantly in the last five years. This change is a result of the rising production from local resources as well as purchased amounts with minimal decrease in the water loss and unaccounted for water.
Jericho and Bethlehem have the highest water supply rates in the West Bank governorates as expected. Jericho always had the highest supply daily rates among other governorates; this is due to the high temperature of the area compared to other governorates accompanied with the use of additional water-consuming applications such as the wet cooling systems. On the other hand, Tubas was always the one with the least water supply rates. Though, this was not the case in 2011 where Jenin suffered from the least daily supplied amounts for domestic uses.
Al auja spring Canal, Jericho

46
Water Status Report 2011
Table (12) Water Supply and Consumption Rates in the Palestinian Governorates
Governorate
Total
Supplied
(MCM)
Total
Consumed
(MCM)
Per capita
Supply Rate
(l/c/d)
Per capita
Consumption
Rate (l/c/d)
Jenin 5.7 3.9 56 38
Tubas 1.5 1.1 73 52
Tulkarem 5.2 3.3 84 54
Nablus 15.0 10.2 118 80
Qalqilya 4.7 3.4 129 93
Salfit 2.5 1.8 106 77
Ramallah 16.6 12.5 147 110
Jericho 3.8 2.9 223 169
Jerusalem 4.7 3.1 87 58
Bethlehem 11.3 7.5 160 105
Hebron 17.3 12.6 76 56
Total- West
Bank88.3
62.3 103 73
North21.9
11.8 - -
Gaza 36.2 21.0 - -
Middle 15.2 8.3 - -
Khan Younis 15.2 8.3 - -
Rafah 9.2 5.4 - -
Total- Gaza
Strip97.7
54.9 - -
The quantity of water supplied to domestic uses in the Gaza Strip (98 MCM as clarified earlier) is considered misleading if used in calculating the per capita supply and consumption, this is reflected in this report as the supply and consumption rates are calculated for the West Bank only. Table 12 shows that there are no calculated rates in Gaza governorates, or else these values could be misleading due to the poor quality of the water supplied for this purpose.

47
2.4.2 Average water Consumption RateAlthough the available drinking water quantity reached 88 MCM, the total consumed amount of water was less than 63 MCM in the West Bank. This means that over 26 MCM (30% of water supplied for domestic uses) was lost. This resulted in an average water consumption rate of 73 l/c/d (Figure 20) compared to an average water supply rate of 103 l/c/d. This divergence between the two values is very clear in Figure 20. However, the visual analysis could be misleading. For example, from the Figure one can conclude that Jericho recorded the highest water loss and hence the highest loss percentage. On the contrary, this is not true and what is shown in the Figure is due to the higher amounts of available water in Jericho compared to other governorates. This is why this Figure is an indication of the difference between supply and demand on the governorate level only.
Figure (20) Supply Rate versus Consumption Rate in the West Bank Governorates (2011)
2.5 Water supply costs and tariffsThere is a complexity in describing the tariff system in the OSP, where there is no unified system that controls the water prices for the consumer and each water service provider (which can be a municipality, utility, village council) applies a different structure than the others. These distinctive structures are designed based on several determinants:

48
Water Status Report 2011
Source of water: whether local or purchased; not more than 2% (4.2 MCM) of Gaza’s water supply and not less than 40% (52.7 MCM) of West Bank’s water supply; are purchased resources from Mekorot through the West Bank Water Department (WBWD). These supplied quantities are characterized with a relatively high price that was set depending on the Israeli life conditions that are quite different than those in the OSP. A good example on the variation in water tariff based on the source is seen through the different tariffs applied in Tulkarem, Ramallah and Jerusalem; Tulkarem does not depend on more than 3% (0.4 MCM)of their water supply on the purchased resources which has a different delivery cost from the local resources abstraction (which is solely groundwater wells in Tulkarem), Ramallah and Jerusalem on the other hand; depend on more than 86% (19.7 MCM) of their water supply on the purchased resources. This is the major reason behind the tariff difference between those governorates, where the average selling price per cubic meter from the major water service providor in Tulkarem is 3.08 NIS compared to 4.11 NIS and 4.07 NIS in Ramallah and Jerusalem respectively.It should be noted that in some cases, the water tariff can be different despite the similarity of the source, Tulkarem and Qalqilya depend on groundwater wells -that lay on the Western aquifer- as the main and only source for their water supply, nevertheless, the average selling price in Tulkarem different than that in Qalqilya. Quantity of water consumed; these prices take in most municipalities a gradual increase depending on the consumed quantity, this is a policy used to reduce the water consumption. There are several categories; each category has a different tariff connected to the quantity of the water consumed. However, there is always a minimum charge that differs according to the WSP. Cost of water production; especially when the WSP depends on local resources (springs or groundwater wells). These costs depend on many factors: pumping rate, depth of the wells, passed distance, and most of all energy cost which is the main element of cost depending on the source and type of energy used. Most of the wells use diesel motors for producing water while the rest depend on electricity. These costs are higher in the West Bank than in Gaza Strip as the depth of wells (and hence the energy costs) is pretty higher than those in the coastal aquifer (in Gaza) and can reach up to 70% (e.g. Qalqilya) from the total costs.Unaccounted for Water cost; there is additional cost for the water before it reaches the supply points or main meters for the municipalities and utilities. The lost amounts of water due to any reason (leakage from main lines and
49
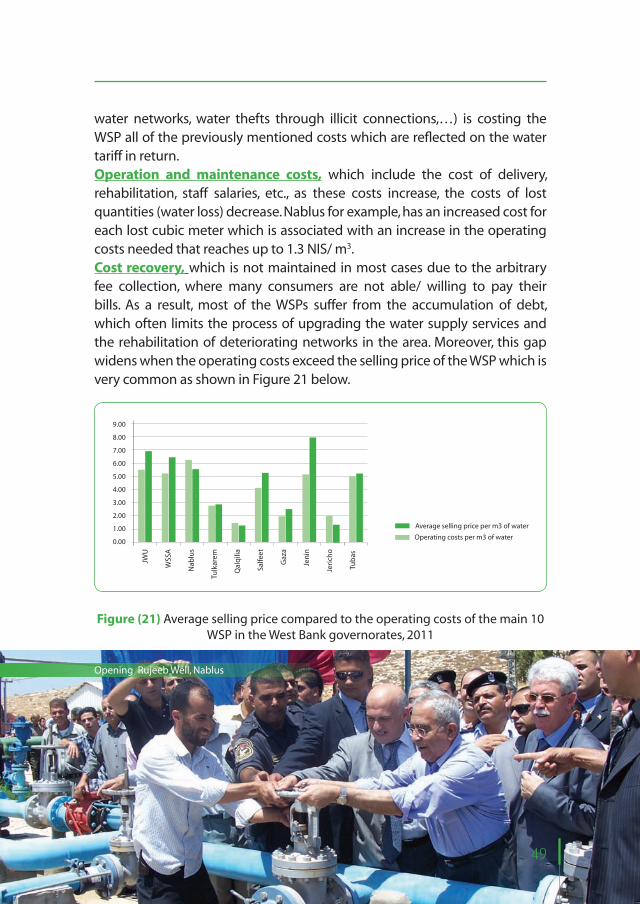
water networks, water thefts through illicit connections,…) is costing the WSP all of the previously mentioned costs which are reflected on the water tariff in return. Operation and maintenance costs, which include the cost of delivery, rehabilitation, staff salaries, etc., as these costs increase, the costs of lost quantities (water loss) decrease. Nablus for example, has an increased cost for each lost cubic meter which is associated with an increase in the operating costs needed that reaches up to 1.3 NIS/ m3.Cost recovery, which is not maintained in most cases due to the arbitrary fee collection, where many consumers are not able/ willing to pay their bills. As a result, most of the WSPs suffer from the accumulation of debt, which often limits the process of upgrading the water supply services and the rehabilitation of deteriorating networks in the area. Moreover, this gap widens when the operating costs exceed the selling price of the WSP which is very common as shown in Figure 21 below.
Figure (21) Average selling price compared to the operating costs of the main 10 WSP in the West Bank governorates, 2011
49
Opening Rujeeb Well, Nablus

50
Water Status Report 2011
2.6 Water network coverageContinuous efforts are desperately needed to serve a total population of 2,338,361 residents (this does not include the residents living in the parts of Jerusalem that was annexed by Israel in 1967) by water networks, distributed over 490 communities in the West Bank, of which 420 of them are currently served with a water network. The total served population in the West Bank (2,225,628 capita) is more than 95%. This population is distributed over different types of localities: urban areas, rural areas and camps. Water network coverage is available for all camps and urban areas. Rural areas (villages) are served up to 96%, and the rest are still need piped networks. Table 13 below shows that 112,733 Palestinians living in 70 villages are still without a running water network.
Table (13) Population and communities served/ un-served with a water network in 2011
Governorate Population ServedCommunities
Servedpopulation
Un-servedCommunities
Un-servedPopulation
Jenin 281,158 63 262,145 9 19,013Tubas 56,642 11 42,989 8 13,653Tulkarem 168,973 33 167,880 2 1,093Nablus 348,023 46 300,788 16 47,235Qalqilya 100,012 32 98,209 1 1,803Salfit 64,615 20 64,615 0 0Jericho 46,718 13 46,718 0 0Ramallah 310,218 74 309,383 1 835Jerusalem 147,489 28 145,939 2 1,550Bethlehem 194,095 44 194,095 0 0Hebron 620,418 56 592,867 31 27,551Total 2,338,361 420 2,225,628 70 112,733
Comparing the un-served population/communities in the West Bank in the year 2011 with those in the previous year; shows that the un-served communities have increased, the explanation of this is that the PWA has changed the policy in calculating the served population/ communities through this year. In 2010, the community was considered served if it was receiving or within an ongoing project

51
phase, this however has changed in the 2011 due to the unbalanced situation and the ongoing obstacles in implementing the projects, the community now is considered un-served unless there is water coming out of the taps whether it is currently receiving a project or not.
2.7 Water qualityThe Palestinian Water Authority is concerned with the water quality from the water resource itself, while the quality of water after being supplied to the consumers is considered a Health Ministry’s responsibility and the results of their tests are obtained upon request. There is a difference between the type, number, intensity, and results of the tests conducted b y the two facilities as the quality of supplied water for different purposes could be hindered during the transmission from the water source to the consumer due to the presence of pollutants in addition to the deteriorating water networks. As section 2.3 in the water resources chapter discusses the water quality of the water in the ground water aquifers. The following table (Table 14) and figures (Figure 22 and Figure 23) show the water quality of samples taken from the water tabs at the end users.
Delbah spring hebron

52
Water Status Report 2011Ta
ble
(14
) Dis
trib
uti
on
of t
este
d w
ater
sam
ple
by
dis
tric
t, W
est
Ban
k, 2
011S
ou
rce:
Dis
tric
tTe
sted
wat
er s
amp
les
(Co
lifo
rm t
est)
1Te
sted
wat
er s
amp
les
fro
m n
etw
ork
s an
d r
eso
urc
es
(Co
lifo
rm t
est)
No.
of
sam
ple
s
No.
of c
on
tam
inat
ed
sam
ple
s
Per
cen
tag
e o
f
co
nta
min
ated
sam
ple
s
No.
of
sam
ple
s
No.
Of
co
nta
min
ated
sam
ple
s
Per
cen
tag
e o
f
co
nta
min
ated
sam
ple
s
Jen
in11
0022
220
.272
020
027
.8
Tub
as80
051
6.4
710
223.
1
Tulk
arem
850
157
18.5
800
9912
.4
Nab
lus
600
108
18.0
600
100
16.7
Qal
qily
a70
010
414
.962
085
13.7
Salfi
t45
532
7.0
400
225.
5
Ram
alla
h
& A
l Bir
eh
750
516.
850
025
5
Jer
ich
o55
089
16.2
240
6025
Jeru
sale
m50
031
6.2
120
97.
5
Bet
hle
hem
383
369.
413
013
10
Heb
ron
950
149
15.7
320
257.
8
So
uth
Heb
ron
860
328
38.1
530
5510
.4
Tota
l84
9813
5816
5690
715
12.6
Hea
lth
An
nu
al R
epo
rt o
f Pa
lest
ine
2011
, Pal
esti
nia
n H
ealt
h I
nfo
rmat
ion
C
entr
e, M
inis
try
of
Hea
lth
, Pal
esti
nia
n N
atio
nal
Au
tho
rity
, 201
2.
1 te
sted
wat
er s
amp
les,
incl
ud
ing
so
urc
es, n
etw
ork
s, ci
ster
ns,
rain
wat
er c
iste
rns.
..

53
Tab
le (1
4) D
istr
ibu
tio
n o
f tes
ted
wat
er s
amp
le b
y d
istr
ict,
Wes
t B
ank,
201
1So
urc
e:
Dis
tric
tTe
sted
wat
er s
amp
les
(Co
lifo
rm t
est)
1Te
sted
wat
er s
amp
les
fro
m n
etw
ork
s an
d r
eso
urc
es
(Co
lifo
rm t
est)
No.
of
sam
ple
s
No.
of c
on
tam
inat
ed
sam
ple
s
Per
cen
tag
e o
f
co
nta
min
ated
sam
ple
s
No.
of
sam
ple
s
No.
Of
co
nta
min
ated
sam
ple
s
Per
cen
tag
e o
f
co
nta
min
ated
sam
ple
s
Jen
in11
0022
220
.272
020
027
.8
Tub
as80
051
6.4
710
223.
1
Tulk
arem
850
157
18.5
800
9912
.4
Nab
lus
600
108
18.0
600
100
16.7
Qal
qily
a70
010
414
.962
085
13.7
Salfi
t45
532
7.0
400
225.
5
Ram
alla
h
& A
l Bir
eh
750
516.
850
025
5
Jer
ich
o55
089
16.2
240
6025
Jeru
sale
m50
031
6.2
120
97.
5
Bet
hle
hem
383
369.
413
013
10
Heb
ron
950
149
15.7
320
257.
8
So
uth
Heb
ron
860
328
38.1
530
5510
.4
Tota
l84
9813
5816
5690
715
12.6
Hea
lth
An
nu
al R
epo
rt o
f Pa
lest
ine
2011
, Pal
esti
nia
n H
ealt
h I
nfo
rmat
ion
C
entr
e, M
inis
try
of
Hea
lth
, Pal
esti
nia
n N
atio
nal
Au
tho
rity
, 201
2.
1 te
sted
wat
er s
amp
les,
incl
ud
ing
so
urc
es, n
etw
ork
s, ci
ster
ns,
rain
wat
er c
iste
rns.
..
Figure (22) Distribution of tested water samples (Coliform test) byDistrict, West Bank, 2011
Figure (23) Distribution of tested
water samples, networks a nd resources
(Coliform test) by District, West Bank, 2011
Based on the household environmental survey conducted by the PCBS for the year 2011: “47% of households in the Palestinian Territory considered the water quality to be good: 71% in the West Bank compared to 5% in the Gaza Strip”1. This difference in how people perceive the supplied water quality in the West Bank than that in Gaza is due to many reasons that include the population density, level of served population, level of occurring water borne diseases, and so on. However, this does not mean that the water quality in the West Bank is out of discussion; the increase in the population density in the West Bank –which is much lower than that in Gaza- with a combination of poor sanitation facilities and aquifer vulnerability (karstic aquifers) is causing nitrate contamination levels to increase, meaning that, over time, it will become increasingly more difficult to supply West Bank citizens with water that complies with WHO domestic water standards.
Moreover, the situation in Gaza is completely different and the quality is continuously deteriorating day after day as discussed earlier. The very dense population discharge huge amounts of pollutants to a relatively small area. Groundwater pollution by nitrates is already wide spread in
1 For the whole report you can refer to the PCBS publidhed reports, available online on: http://www.pcbs.gov.ps/Portals/_PCBS/Downloads/book1813.pdf

54
Water Status Report 2011
the Gaza Strip and exceeds WHO-recommended threshold (50 ppm). This percentage is continuously growing (with higher concentrations under urban areas, suggesting that a major component of the contamination is from sewerage, and not from agriculture). Figure 24and Figure 25 below show the nitrate concentration in the West Bank and Gaza strip wells as monitored by the PWA.
Figure (24) . Nitrates in West Bank wells
monitored by PWA
Figure (25) Nitrates in Gaza Strip wells moni-
tored by PWA
Source: TPAT computation from PWA water quality data base
2.8 Water supply for agricultural purposes
There is a direct relation that connects the water resource with the water use. Areas with limited access to local resources cannot have a distinctive agricultural activity due to the non-feasibility of purchasing water for this purpose, Figure 26 clearly shows this relation, for instance, about 30 MCM was supplied in Jericho for a population of 46,718, the high dependence on the local resources (93%) explains the small mounts purchased from Mekorot. The Figure also shows the high supplies of water for agricultural purposes (86%). Table 15 shows the water abstracted from local resources for agricultural purposes per basin.

55
Jen
in
Tub
as
Tulk
arem
Nab
lus
Qal
qily
a
Salfi
t
Ram
alla
h
Jeri
cho
Jeru
sale
m
Bet
hle
hem
Heb
ron
0
5
10
15
20
25
0
5
10
15
20
25
30
Domestic use (MCM)
Agricultural use (MCM)
local Resources (MCM)
Purchased Resources (MCM)
Figure (26) Water Supply based on the water use and water source- Governorate
scale (MCM)
Destruction of water well in Jenin by the Israeli occupation, Jenin

56
Water Status Report 2011Ta
ble
(15
) Wat
er p
rod
uce
d fr
om
loca
l res
ou
rces
(wel
ls a
nd
sp
rin
gs)
for a
gri
cult
ura
l an
d n
on
-ag
ricu
ltu
ral u
ses
per
bas
in, 2
011
Tota
lea
stre
n ba
sin
Prod
uctio
n )M
CM)3
Wes
tern
bas
in P
rodu
ction
(mcm
) 4N
orth
-eas
tern
bas
in P
rodu
ction
(m
cm) 5
Gov
erno
rate
Agric
ultu
ral
Non
- Ag
ricul
-tu
ral
Agric
ul-
tura
lN
on- A
gric
ultu
ral
Agric
ultu
ral
Non
- Ag
ricul
tura
l
4.7
--
-1.
123.
52Je
nin
3.3
0.76
0.62
-1.
20.
73Tu
bas
14.7
--
9.9
4.8
-Tu
lkar
m
13.6
--
-3.
5610
.00
Nab
lus
10.3
--
7.2
3.1
__
Qal
qiliy
a
0.1
0.01
0.09
__
__
Salfi
t
3.1
0.53
2.60
__
__
Ram
alla
h an
d A
l-Bire
h
26.0
24.1
91.
81_
__
_ Je
richo
and
Al-A
ghw
ar
--
-_
__
_( Je
rusa
lem
(J2
9.4
0.27
9.12
__
__
Beth
lehe
m
1.7
0.1
1.6
__
__
Hebr
on
86.9
25.9
15.8
17.1
7.9
5.8
14.2
Wes
t ban
k
3 o
slo
II (1
995)
ag
reem
ent
qu
ota
is 5
6 M
CM
78
MC
M to
be
dev
elo
ped
4 o
slo
II (1
995)
ag
reem
ent
qu
ota
is 2
2 M
CM
5
osl
o II
(199
5) a
gre
emen
t q
uo
ta is
42

57
The purchased resources are used for domestic water supply (drinking water purposes) except for 4 MCM supplied for agricultural use in Tubas governorate. In general 37% of the water supplied in the West Bank is used for agriculture compared to 46% in Gaza. It must be noted that the water quantity used for agriculture in the West Bank is calculated based on the amounts abstracted from the agricultural wells and springs, while this value is estimated in Gaza and not calculated.
The Agricultural sector in Gaza Strip in average consumes around 75-80 million cubic meters from the groundwater wells, with an irrigated area of more than two thirds of the total cultivated area. The agricultural water demand was roughly estimated from the available cultivated areas gathered from Ministry of Agriculture ( MoA) for the season 2009, multiplied by the irrigation water quota allowed for each crop allocated officially by PWA and MoA, as most of the agricultural wells distributed allover Gaza Strip are unmetered , not functioning well or not installed absolutely. The method used in estimating the agricultural water use is appropriately similar to the simulations applied by the Israeli Administration since 1967. The current cultivated lands in Gaza Governorates observed a remarkable decrease due to sequences of the last war launched against Gaza Strip which lasted 22 days of heavy intensive air strikes and land invasions. The total cultivated areas record in the last years witnessed an observed decline since the mid of the nineteen’s with drastically decrease in citrus, which considered the main consumer of water.
Note : All agriculture and domestic wells in Gaza strip had water meter before 1992 “ Gaza and Jericho Agreement”.
2.9 Water supply projects completed in 2011
PWA cooperated with nongovernmental organizations (NGOs) and international donors to solve the water shortage issue by changing the old main lines and developing water systems -in areas with high water loss such as Bethlehem and Hebron- in one hand, reducing the commercial losses by preventing theft from the main lines on the other hand. This was not easy, facing the Israeli army that damaged water systems and storage tanks and created obstacles in the operation and maintenance processes. With regard to this, the following is a clarification for each governorate.

58
Water Status Report 2011
More than 11 million dollars were provided in 2011 to support water supply related projects. Some of those projects were concerned with constructing networks, tanks, or transmission lines; others were concerned with rehabilitating and expanding existing structures based on the area’s needs. All of the finished projects are implemented under the supervision of the project management unit (PMU) and the West Bank Water Department (WBWD).
The distribution of the fund is primarily based on the area’s need; where the areas with the most critical situations have the priority of the next project. All governorates were targeted but with different types of projects as follows:
Ramallah and Jerusalem: the projects that targeted the villages of north-west Jerusalem were aiming at increasing the supply and consumption rates from less than 25 l/c/d to more than 40 l/c/d by building water networks, water tank and installing a transmission line with a fund that exceeded 4 million dollars, in addition to the rehabilitation of “Altireh” village water network.
Jericho: the projects ranged between “Akabet Jabr” project, rehabilitation of part of Jericho water network, Rehabilitation of the internal water network in the Auja.
Hebron and Bethlehem: The projects that targeted Hebron were not only aiming at increasing the water supply through constructing water tanks in areas like Carmel, Khelet Almai, Qarn Al Thawr, Deir Samet and Yatta, but were also concerned with decreasing the water losses which reached 45% in 2010, through a number of rehabilitation projects that included the villages west of Hebron and Al Thahereya, rehabilitation of Saer and Halhul pump stations, and rehabilitation/expanding of internal network with the establishement of water lines for the villages in the west. The projects that targeted Bethlehem on the other hand, were mainly a pipe line and tank for the industrial zone, and a water network in the Dheisheh refugee camp.
Moreover, the Northern area had a variety of water supply projects that included:
Tubas: two main water supply projects targeted this area: construction of wells (Tammoun well, a water tank, poser, vertical well pump, electronic panel and transformer], and construction of water lines [Fara’a refugee camp water line and tank).

59
Jenin: Construction of internal water network for Bir Al-Basha area, drilling of “Balaa” well, Replacement of house connections for the villages of north-west of Jenin, Rehabilitation and expansion of the internal network in Qabatiya, Generation of transmission water line, and finally construction of water network and a new tank in Rapa.
Tulkarem: water supply projects in this area included “Anabta” pumping station, drilling of “Balaa” well, construction of elevated water tank (500 m3) and transmission pipe line of 2.5km length in Em Reyaheya.
Nablus: in 2011, there was an establishment of an integrated water system for the villages of north-west Nablus, constriction of 16 km transmission pipe line for 8 villages, and processing of Sabastya well.
(B)
(B) halhul water transmission line, hebron
(c)
(c)Dahr al abed water tank, Jenin
(A)
(A) halhul water tank, hebron

60
Water Status Report 2011
Extracting water from Maythloun well

61
WastewaterPart three

62
Water Status Report 2011
Ein Sinia wastwater stream, Ramallah

63
3.1 IntroductionThe wastewater sector in Palestinian territories has been neglected under Israeli occupation since 1967. The occupying power has not developed the Palestinian Territory infrastructure according to international conventions agreed upon. The wastewater sector has been marginalized since the creation of the Palestinian Authority due to the understandable need of providing citizens with safe drinking water. This has in the past absorbed the bulk of capital investments both by the government and the donor community.
In the early stages of the PNA it was identified that there was a need to initiate capital investment activities in the sector prompted by a rapidly deteriorating existing infrastructure and a rapidly rising population predicted to be 3.75% annually. This was triggered by movement of the rural population into urban locations, crude birth rate and returning refugees. Some of the deterioration was attributed to negligence by Israel throughout the early history of occupation, resulting in an insufficient and inadequate infrastructure. Israel also prevented the Palestinian people from development and management of their own wastewater infrastructure.
The objective of this part 3 on wastewater is to provide planners and the decision makers to establish a realistic strategy for the wastewater sector. It provides all basic elements that constitute and impact on the sector. It can also be used as a basis for researchers as it provided the most updated data available on the sector and the plans for future development.
Management practices for wastewater disposal in the West Bank are limited to the collection of wastewater by piped sewage networks and on site household cesspits. Furthermore, wastewater treatment facilities are restricted to a few localities in the West Bank. This, combined with an expanding population , exerts pressure on sewage systems especially in urban areas and that together with under capacity wastewater treatment plants has become a major priority:
In the West Bank, 31% of the population is connected to wastewater collection networks, many of them are old and poorly maintained, which is the cause of frequent spillage and leaks contaminating the surrounding areas, whereas the rest of the population depends on cesspits, open ditches and septic tanks, as it is shown in Table 16:

64
Water Status Report 2011
Table (16) Population connected to sewage network or cesspits, by type and
locality and governorate ( Per 1000 persons connected)
Governerate No. of localities Piped Networkspersons connected)
Cesspits(persons connected)
URBAN AREASJenin 13 32.3 133.3
Tubas 3 0 37.8
Tulkarm 9 51.1 62.5
Nablus 8 132.7 59.4
Qalqiliya 3 3 .5 11.7
Salfit 3 6.7 16.8
Ramallah 14 62.3 98.6
Jericho 2 0 24.8
Jerusalem 9 33.9 60.7
Bethlehem 12 62.4 73.8
Hebron 20 152.9 376.6
TOTAL 96 583.5 955.9
RURAL AREASJenin 68 0.5 103.7
Tubas 17 0.0 12.5
Tulkarm 24 3.6 33.5
Nablus 53 14.1 108.4
Qalqiliya 31 1.6 37.5
Salfit 17 0.0 41.2
Ramallah 56 1.5 129.8
Jericho 8 0.0 10.5
Jerusalem 20 7.3 36.2
Bethlehem 30 6.0 37.7
Hebron 70 1.5 73.2
CAMPS
Sum 394 36.1 624.0
Jenin 1 11.0 0.3
Tubas 1 1.1 5.3
Tulkarm 2 18.3 0.0
Nablus 3 33.4 0.0
Qalqiliya 0 0.0 0.0
Salfit 0 0.0 0.0
Ramallah 5 14.8 3.2
Jericho 2 0.0 11.4
Jerusalem 1 9.2 0.2
Bethlehem 3 13.6 0.6
Hebron 2 16.1 0.2
Sum 20 117.6 21.3
Grand Total 510 737.1 1601.2

65
3.2 Wastewater resources and quantities in West Bank
Management practices for wastewater disposal in the West Bank are limited to the collection of wastewater by piped sewage networks and on site household cesspits. Furthermore, wastewater treatment facilities are restricted to a few localities in the West Bank. This, combined with an expanding population, exerts pressure on sewage systems especially in urban areas and that together with under capacity wastewater treatment plants has become a major priority.Figure 27 represents the percent of population connected to a piped network collection system versus those that use another system either by using cesspits or dumping direct into the environment.
Figure (27) Population served by collection systems versus traditional systems
3.3 Wastewater collection and disposal in West Bank
In the West Bank 31% of the total population are served by sewerage collection networks, most of them are within the main cities and refugee camps. These are old networks constructed > 50 years ago. Unfortunately there are no records available on the status of these networks, but based on interviews with the operators these networks, have deteriorated as there has been limited budget to maintain or rehabilitate or upgrade. Table 17 shows the percent of population connected to sewerage network systems in the year 2011.

66
Water Status Report 2011
Table (17) Population connected to sewage network or by governorate
Governorate No. ofcommunities
Totalpopulation
Total Servedpopulation
(1000)
Totalunservedpopulation
(1000)
served
population
(%)
unserved
population
(%)
Jenin 82 281,2 43,8 237,4 15.6 84.4
Tubas 21 56,6 1,1 55,5 1.9 98.1
Tulkarm 35 169,0 73,0 96,0 43.2 56.8
Nablus 64 348,0 180,2 167,8 51.8 48.2
Qalqiliya 34 100,0 50,1 49,2 50.9 49.1
Salfit 20 64,6 6,7 57,9 10.3 89.7
Ramallah 75 310,2 78,6 231,6 25.3 74.7
Jericho 12 46,7 0 46,7 0.0 100.0
Jerusalem 30 147,5 50,4 97,1 34.2 65.8
Bethlehem 45 194,1 81,9 112,2 42.2 57.8
Hebron 92 620,4 170,5 449,9 27.5 72.5
TOTAL 510 2338,4 737,1 1601,2 31.5 68.5
3.3.1 Urban AreaHebron, Nablus, Jenin, Tulkarem, Ramallah and Al Bireh have either totally or partially wastewater networks. Jericho and Tubas still lack wastewater collection networks. Work has started in Jericho, and construction expected to start in Tubas in 2013. Table 18 shows the status of population in the urban areas connected to sewerage systems.
Table (18) Population connected to sewage network in the urban areas
Governorate No. ofcommunities
Totalpopulation
Total Servedpopulation
(1000)
Totalunservedpopulation
(1000)
served
population
(%)
unserved
population
(%)
Jenin 13 165.6 32.3 133.3 19.5 80.5
Tubas 3 37.8 0.0 37.8 0.0 100.0
Tulkarm 9 113.6 51.1 62.5 45.0 55.0
Nablus 8 192.1 132.7 59.4 69.1 30.9
Qalqiliya 3 60.9 49.3 11.7 80.8 19.2
Salfit 3 23.4 6.7 16.8 28.5 71.5
Ramallah 14 160.9 62.3 98.6 38.7 61.3

67
Jericho 2 24.8 0.0 24.8 0.0 100.0
Jerusalem 9 94.6 33.9 60.7 35.8 64.2
Bethlehem 12 136.2 62.4 73.8 45.8 54.2
Hebron 20 529.4 152.9 376.6 28.9 71.1
TOTAL 96 1539.4 583.5 955.9 37.9 62.1
3.3.2 Refugee camps
United Nations Relief and Works Agency for Palestine Refugees (UNRWA) has constructed wastewater networks in the majority of West Bank camps, such as Jenin, Balata, Askar, Jalazoun, Dheisheh, etc. while wastewater collection services are still unavailable in Jericho camps (As-Sultan and Aqbat Jabr). Wastewater network services are provided to 85% of the refugee camps . 95% of the served refugee camps are connected to a sewage network. The piped network in the refugee camps collects both the rainwater and the domestic wastewater so that, during the rainy season, this additional rainwater infiltration causes the network to overflow into the streets, agricultural land, and into houses. Table 19 shows the status of the refugee camps areas.
Table (19 ) Population connected to sewage network in the refugee camps
Governorate No. ofcommunities
Totalpopulation
Total Servedpopulation
(1000)
Totalunservedpopulation
(1000)
served
population
(%)
unserved
population
(%)
Jenin 1 11.4 11.1 0.3 97.0 3.0
Tubas 1 6.4 1.1 5.3 17.0 83.0
Tulkarm 2 18.3 18.3 0.0 100.0 0.0
Nablus 3 33.4 33.4 0.0 100.0 0.0
Qalqiliya
Salfit
Ramallah 5 18.0 14.8 3.2 82.1 17.9
Jericho 2 11.4 0.0 11.4 0.0 100.0
Jerusalem 1 9.4 9.2 0.2 98.0 2.0
Bethlehem 3 14.2 13.6 0.6 95.5 4.5
Hebron 2 16.3 16.1 0.2 99.0 1.0
TOTAL 20 138.9 117.6 21.3 84.7 15.3

68
Water Status Report 2011
3.3.3 Rural Area
The rural population of the West Bank, accounts for 28.5% of the total population, the situation here is not any better. Less than 30 towns or cities out of 394 in the West Bank are connected in part to a piped sewage network. Other communities discharge their wastewater into unlined cesspits. There are some projects now underway which are constructing WW collection systems in some of the rural areas. These are either to be connected to an existing system like Irtas, or to be connected to Israeli WWTP’s like Baqa Al-Sharqiya, Barta’a Al-Skharqiya and Habla. Other villages like Anza, Beit Dajan, Sarra, Hajja, Taybeh, Ramoun and Misilya will be connected to a small scale WWTP’s to serve only those villages. Table 18 on the previous page shows the population status in the urban areas connected to sewerage systems. Table 20 below shows population status in the rural areas connected to sewerage systems.
Table (20) Population connected to sewage network in the rural areas
Governorate No. ofcommunities
Totalpopulation
Total Servedpopulation
(1000)
Totalunservedpopulation
(1000)
served
population
(%)
unserved
population
(%)
Jenin 68 104.2 0.5 103.7 0.4 99.6
Tubas 17 12.5 0.0 12.5 0.0 100.0
Tulkarm 24 37.1 3.6 33.5 9.8 90.2
Nablus 53 122.5 14.1 108.4 11.5 88.5
Qalqiliya 31 39.1 1.6 37.5
Salfit 17 41.2 0.0 41.2
Ramallah 56 131.3 1.5 129.8 1.2 98.8
Jericho 8 10.5 0.0 10.5 0.0 100.0
Jerusalem 20 43.4 7.3 36.2 16.7 83.3
Bethlehem 30 43.7 6.0 37.7 13.7 86.3
Hebron 70 74.7 1.5 73.2 2.1 97.9
TOTAL 394 660.1 36.1 624.0 5.5 94.5
The percentage of population which is connected to sewage networks or cesspits according to location (urban, rural or refugee camp) in the study area is shown in the Figure 28.

69
Figure (28) West Bank population connected to sewers or cesspits by locality
type.
the following map shows connection to sewage networks around the west bank
3.3.4 Quantities of Wastewater
Wastewater quantities generated yearly in the West Bank estimated at approx 62 MCM annually a daily rate, 170Ml/day including municipal. Industrial wastewater, in addition to 35 MCM annually 96Ml/day of untreated wastewater discharged by settlements and industrial zones into the West Bank environment.
Less than 5% wastewater is generated from industrial activities like in Nablus, Ramallah and Hebron. Table 21 shows the estimated generated wastewater in 2011.
Ein Sinia wastwater stream, Ramallah

70
Water Status Report 2011
Figure (28) Status of Connections to Sewagae Network in West Bank

71
Table (21) Estimated Annual Generated Wastewater (MCM) in the West Bank
governorates
Governorate Population
(106 )
Estimated WS- Into
Israel
Into
Wadi
Treated Cesspits Estimated
WW
Jenin 0.281 5.7 1.10 0.00 0.00 2.90 3.99
Tubas 0.057 1.5 0.00 0.11 0.00 0.94 1.05
Tulkarm 0.169 5.2 1.46 0.00 0.00 2.18 3.64
Nablus 0.348 15 4.02 3.21 0.00 3.27 10.5
Qalqiliya 0.100 4.7 2.19 0.00 0.00 1.10 3.29
Salfit 0.065 2.5 0.00 0.29 0.00 1.46 1.75
Ramallah 0.310 17.6 0.80 0.44 1.83 9.25 12.32
Jericho 0.047 3.8 0.00 0.00 0.00 2.66 2.66
Jerusalem 0.147 4.7 0.40 0.26 0.00 2.63 3.29
Bethlehem 0.194 11.3 1.17 1.64 0.00 5.10 7.91
Hebron 0.620 17.3 3.83 0.42 0.00 7.86 12.11
TOTAL WB 2.338 89.3 14.97 6.38 0.00 41.17 62.51
The total collected quantities from these networks as shown in Table 21 is either treated in Palestinian central treatment plants like Al-Bireh or small collective treatment plants like Zeita and Attil. Wastewater is also dumped into surface water streams (Wadis) and then either treated in Israeli treatment plants like Jenin, Tulkarm, West Nablus, Beit Jala, and Hebron, or disposed into Wadis. Wastewater that is disposed of in wadis like Ramallah, East Nablus, Bethlehem, etc. or in cesspits. The following section will show detail of the final status discharged wastewater.
3.3.5 Treatment in Israeli WWTP’s (trans boundary streams)
Around 15 MCM annually of wastewater is collected from several areas in the year 2011 is dumped in wadis, and then treated in WWTP’s inside the green line. At the expense of the Palestinian people, and treatment costs are directly deducted every month by the Israeli government from the Palestinian clearance account without any positive valuation of the treated waters. This water is reused by the Israelis.
The estimated quantities of wastewater generated from Palestinian

72
Water Status Report 2011
communities and treated in Israel are summarized in Table 22. Parts of the influent which has infiltrated into the soil before reaching to the treatment plants depends on the soil characteristics and distance.
One of PWA aims to reduce the quantities of Wastewater flowing in trans-boundary streams by constructing large scale treatment plants like Nablus West (under construction), Ramallah-Ein Jariout (under Design) and Hebron Regional WWTP (tendering process).
Table (22) The Estimated Generated Wastewater in the West Bank wadis and
treated in Israel
No Name Service Area Name of
WWTP
M3/Day MCM/
year
1 Wadi Al-Moqatta Jenin City & Jenin Camp Gilbo
WWTP
3,000 1.10
Wadi Zumer West Nablus, Ein Beit Alma
Camp and some adjacent
communities
4,000 1.46
Tulkarem city, Tulkarem camp
and Nur Shams Camp
11,000 4.02
3 Wadi Al-Zuhur Qalqilia City Ner Elyaho
WWTP
6,000 2.19
4 Wadi Suriq Ramallah City Suriq
WWTP
3,300 1.20
5 Wadi Beit Jala Beit Jala and some parts of
Bethlehem City
3,200 1.17
6 Wadi Al-Samen Hebron City and Kiryat Arbaa
Colony
Shoket
WWTP
10,500 3.83
TOTAL 14.97
3.3.6 Influent flowing inside West Bank (local streams)
More than 6 MCM of untreated wastewater estimated to be generated from several communities in the year 2011 disposed into several streams that flowing to the east and north east of the West Bank. Table 23shows the estimated generated wastewater that disposed in local streams.

73
Table (23) The Estimated Generated Wastewater in the West Bank local streams
and non treated
.No )Stream (Wadi measuring Points m3/d mcm/year
Salfit 800 0.292 Wadi Al-Sajour East Nablus,Askar and Balata Camps,
Azmut, Salim and surroundings8,800 3.21
3 Wadi Al-Haramiya Al Jalazoun Camp and surrounding 1,200 0.444 Wadi Al-Nar Beit Sahur and Beitlehem 4,500 1.645 Wadi Sair Al›Aroub Camp 1,150 0.426 Wadi Far›a Far›a Camp 300 0.11 TOTAL 6.11
The other generated wastewater is stored in cesspits in the rural areas, where the estimated wastewater dumped into cesspits is around 41 MCM (112 Ml/day). Around 2 MCM (54 Ml/day) is collected in Al-Bireh and surrounding refugee camps and treated in Al-Bireh WWTP and then dumped into Wadi Al-Qilt without reuse. In addition to a few quantities treated in small scale collective systems and reused locally, but this amount considered as negligible compared to the total generated WW
3.4 Wastewater treatment in West Bank
There has been 3 WWTP constructed in Tulkarem, Jenin, Ramallah. These primary treatment lagoons have formed the only significant WW treatment in recent years. The ponds that were built in the mid-1970s had not been improved or upgraded until the advent of the Palestinian National Authority and the creation of the PWA in 1996. Despite the increase in wastewater quantities flowing into those ponds and plants they were all operating beyond their maximum capacities. The result of this has led to partially treated waste water being discharged in areas surrounding these plants. The result of this has been multiple environmental and sanitary problems.
Throughout this period, wastewater from Palestinian cities has been and is still discharged into West Bank Wadis and natural waterways. In some cases, water even flows inside of the green line, where it is collected and treated in treatment plants built originally to treat Israeli Wastewater or plants build specifically to treat the Palestinian wastewater crossing the border. Examples of this are Yad Hanna WWTP that was built in Emek Hefer in 2003

74
Water Status Report 2011
to treat wastewater from Tulkarm and West Nablus. Shoket WWTP that was built in 2009 to treat wastewater flowing from Hebron. Those two treatment plants were financed by deducting funds from the Palestinian tax money collected by Israeli’s.
The PNA has built one treatment plant at Al Bireh in 2000 in the West Bank. This plant has a treatment capacity of up to 2 MCM 5.5 Ml/day Work is also underway to complete plants built at West Nablus and it expected to start construction at Ramallah (Ain Jeriout), Hebron, Jericho,Tubas and Nablus East.
In addition, there will be some de-centralized plants in rural areas is now under construction in Anza, Beit Dajan, Sarra, Hajja, Beit Hasan, Tybeh-Rammoun. Construction is expected to start in Misilya, Al-Aroub, and the Bethlehem Industrial Zone.
In the following sections, the status of each treatment plant will be described according to the type of treatment (central, collective, and on-site)
3.4.1 Central Wastewater Treatment Plants
There are three central wastewater treatment plants (WWTPs) located in Al-Bireh, Ramallah, and Jenin cities in addition to the Tulkarm pre-treatment wastewater plant. The WWTP in Jenin is currently being rehabilitated and is expected to start operation in October 2012.
A new central WWTP is now under construction to serve the western area of Nablus city and the nearby five villages with the support of the German Government. This is being funded through the German Development Bank (KfW).
Table 24 outlines the location of the existing, under rehabilitation and construction centralised wastewater treatment plants the operational year and status of the plants.

75
Table (24) The existing central wastewater treatment plants
Name of Wastewater Treatmentplant
OperationalYear
Design Flow for DryWeather(m3/day)
Actual Flow(m3/day)
Population(served (person
Status of WWTP
Al-Bireh Wastewater TreatmentPlant
2000 5,750 5,000 50,000 Operating wellwith good ef-ficiency
Ramallah Wastewater TreatmentPlant
and 1975 rehabilitated in2002/2003
1400 2,400 25,000 Not operating well((overloaded
Tulkarm Wastewater Pre-TreatmentPlant
and 1972 rehabilitated in2004
15000 4,000 75,000 Not operating well(Sludge accumula-(tion and odours
Jenin Waste-water Treat-ment Plant
Operation is expected to start in January2012
9,250 3,000 40,000 Under rehabilita-tion
West Nablus Wastewater TreatmentPlant
Operation is expected to start by theMid 2013
15000(2020)
:(201310,500 :(2020)15,000
110,000 Not operated yet(under construc-(tion
Below, a complete description for the status of the treatment plants will be described.
Al-Bireh Wastewater Treatment PlantLocation
Al-Bireh wastewater treatment plant (WWTP) was constructed in the 2000 with the support of the German Government through the German Development Bank (KfW). It is located in Wadi Al-’Ein, 2 km south east of Al-Bireh City, over 22 dunums of land, with enough capacity to serve future expansion.

76
Water Status Report 2011
Wastewater Sources and Characteristics
Table (25) Daily Wastewater Flow Rates of Al-Bireh WWTP
Parameter )Flow rate (m3/day
Average daily flow 5.000
Average daily design flow for dry weather 5.750
Average daily design flow for wet weather (2xADW)
11.500
Reference: (Al-Bireh Municipality, 2010)
Wastewater T reatment Process and Effluent Characteristics
Table (26) Treated Wastewater/Effluent Characteristics - Al-Bireh WWTP, 10 April
2010
Parameter concentration
Chemical Oxygen Demand (COD) 89 mg/l
Biochemical Oxygen Demand (BOD5) 6 mg/l
Total Nitrogen (TN) 6.8 mg/l
Nitrate - Nitrogen (NO3-N) 3.3 mg/l
Phosphate (PO4-P) 1.3 mg/l
Electric Conductivity (EC) 1.3 Ms
Reference: (Al-Bireh Municipality, 2010)
Ramallah Wastewater Treatment Plant
LocationRamallah WWTP was designed and constructed in 1973 by an Israeli company. It is located in Ramallah industrial zone at a distance of around 2 km south west of Ramallah City, over 40 dunums of land. Currently, Ramallah WWTP is not operating well and does not meet the requirements for effluent discharge. This is because it is hydraulically and organically overloaded funded by KFW has funded a new WWTP with an estimated value of 27 million Euro. This plant is scheduled for construction will be construction in 2013 near Ein Jariut to replace the old plant and to serve Ramallah, Beitunia and Surroundings by a new WWTP.

77
Wastewater Sources and Characteristics
Ramallah WWTP was designed in 1973 for a capacity of 1,500 m3/day and an influent BOD
5 of 1,083 mg/l the plant treats the water using the extended
aeration treatment technology. The WWTP receives the wastewater generated by around 22,000 persons. The wastewater flow into the treatment plant is approximately 2,200 m3/day. The influent wastewater characteristics are shown in Table 27. These are based on the results of the monitoring and evaluation program of Ramallah WWTP that was carried out by the Civil Engineering Department at Birzeit University in the period from March 2007 until February 2008.
Table( 27) Influent Wastewater Characteristics – Ramallah WWTP, 17 February 2008
Parameter concentration
Chemical Oxygen Demand (COD) 853 mg/l
Biochemical Oxygen Demand (BOD5) 280 mg/l
Total Suspended Solids (TSS) 6,212 mg/l
Ammonium - Nitrogen (NH4-N) 28.8 mg/l
Phosphate (PO4-P) 15.4 mg/l
pH 9.55
Conductivity (EC) 7.61 Ms
Reference: (Birzeit University, 2008)
Wastewater Treatment Process and Effluent Characteristics
Table (28) Treated Wastewater/Effluent Characteristics – Ramallah WWTP, 17
February 2008
Parameter concentration
Chemical Oxygen Demand (COD) 132.3 mg/l
Biochemical Oxygen Demand (BOD5) 60 mg/l
Total Suspended Solids (TSS) 1,748 mg/l
Ammonium - Nitrogen (NH4-N) 14.9 mg/l
Phosphate (PO4-P) 8.4 mg/l
Fecal Coliforms 6.00E+02 cfu/100 ml
pH 7.55
(Conductivity (EC 3.23 ms
Reference: (Birzeit University, 2008)

78
Water Status Report 2011
Tulkarm Wastewater Pre-treatment PlantLocationTulkarm Wastewater Pre-Treatment Plant (WWPTP) was constructed in year 1972. It is located at a distance of 1 km west (western region) of Tulkarm city and close to the Green Line (Armistices line, 1949), over 8 dunums of land. In 2004, Tulkarm Municipality rehabilitated the WWPTP. Funding for this was provided through the German Government through the German Development Bank (KfW).
Wastewater Sources and CharacteristicsCurrently, the Tulkarm WWPTP serves around 73,270 persons, Nur Shams camp, and Tulkarm camp. This plant treats an average daily flow of 4,000 m3 of wastewater originating from domestic, commercial and industrial sources.
Wastewater Treatment Process and Effluent Characteristics
Table (29) .Pretreated Wastewater/Effluent Characteristics – Tulkarm WWPTP,
February 2011
Parameter concentration
Chemical Oxygen Demand (COD) 502 mg/l
Biochemical Oxygen Demand (BOD5) 282 mg/l
Total Suspended Solids (TSS) 326 mg/l
Reference: (PWA ,Transboundary project, 2012)
Jenin Wastewater Treatment PlantLocation The Jenin Wastewater Treatment Plant is located in the Al Basateen Area, approximately 1.5 km north of Jenin city at the Jenin Governorate. The Jenin WWTP was originally built in the 1972 and covers 23 dunums, the facilities have a total surface area of approximately 3.12 dunum.
Wastewater Sources and Characteristics
Currently, Jenin WWTP serves around 39,000 persons residing in Jenin city and Jenin Camp. It treats an average daily flow of 3,000 m3 of wastewater originating from domestic and commercial sources.
Wastewater Treatment Process and Effluent Characteristics

79
Table (30) Pretreated Wastewater/Effluent Characteristics – Jenin (Wadi Moqatta’,
February 2011
Parameter concentration
Chemical Oxygen Demand (COD) 662 mg/l
Biochemical Oxygen Demand (BOD5) 334 mg/l
Total Suspended Solids (TSS) 617 mg/l
Reference: (PWA ,Transboundary project, 2012)
West Nablus Wastewater Treatment Plant
LocationThe l WWTP at West Nablus is currently under construction to serve the western parts of Nablus city and the nearby five villages. This project is being supported by the German Government through the German Development Bank (KfW). The WWTP will be located over 110 dunums of Deir Sharaf Village lands a distance of 10 km North West of Nablus City.The Nablus Municipality expects the construction of the WWTP to reach completion in Spring 2013.
Wastewater Sources and Characteristics West Nablus WWTP will serve around 55% of the population, in addition to those living in the villages of Deir Sharaf, Beit Wazan, Zawata, Beit Iba and Qusin. A total population of 110,000 persons. The plant is designed to be built in three phases to serve 150,000, 225,000 and 300,000 persons in the 1st (year 2020), 2nd (year 2025) and 3rd (year 2035) phases, respectively with activated sludge treatment technology.
Wastewater Treatment Process and influent Characteristics
Table (31) Pretreated Wastewater/Effluent Characteristics – Nablus West
(different locations, 2011
Parameter Concentration
Chemical Oxygen Demand (COD) 764 mg/l
Biochemical Oxygen Demand (BOD5) 578 mg/l
Total Suspended Solids (TSS) 1495 mg/l
Reference: (An-Najah University, 2011)

80
Water Status Report 2011
3.4.2 Collective Wastewater Treatment Plants
In addition to the existing central WWTPs, some non-governmental organizations (NGOs) and academic institutions have established collective wastewater treatment systems in several localities that lack sewage collection networks and depend on cesspits for wastewater disposal.
Table(32) Existing collective wastewater treatment systems
Governor-ate
Locality Operational Year
Design Flow(m3/day)
Actual Flow (m3/day)
Status of PWWT Implementing Institution
Hebron Kharas 2003 120 100 Not Functioning) PHG
Hebron Nuba 2002 120 200 Malfunctioning
Ramallah Bani Zeid (Al-Gharbi-yeh)
2004 (re-habilitated 2011)
100 50 Not Functioning (under rehabilita-tion)
Hebron Deir Samit 2001 13.5 n.a. (Over-(loaded
Malfunctioning PHG
Qalqiliya Hajja 2004 40 - 30 40 Functioning well (under rehabilita-tion)
Nablus Sarra 2004 - - To be replaced by new WWTP
Salfit Biddya 2007 11.2 Malfunctioning Un-der rehabilitation
PARC
Tulkarm Attil‹ 2006 14 30 Malfunctioning with low efficiency
PARC
Tulkarm Zeita 2008 14 30-35 Malfunctioning with low efficiency
Qalqiliya Sir 2006 14 18-20 Functioning wellwith medium ef-ficiency
Tulkarm Zeita 2004 Na .n.a Malfunctioning withlow efficiency
UNDP
Ramallah & Al-Bireh
Ein Siniya‹ 2007 10 .n.a Not Functioning(since mid 2009)
Birzeit Univer-sity
Bethlehem Nahhalin 2007 50 25 Not Functioning op-erational problem
ARIJ
Below, a complete description for the status of the treatment plants.

81
Kharas Wastewater Treatment SystemThe existing wastewater treatment system in Kharas was implemented 2003. The system is composed of a 7.75 km gravity sewage collection network and provides WW treatment for 150 housing units, 2 mosques, 4 schools and a clinic. The WWTP is constructed on 2 dunums of land, which does allow for future expansion of the plant. The plant was designed to serve around 2,000 persons with a capacity of 120 m3/day. The actual daily flow to the WWTP was estimated at 100 m3 of wastewater originating from domestic and commercial sources. Since February 2010 the WWTP has not functioned due to lack of maintenance, the constructed wetlands have not functioned satisfactorily due to problems associated with the gravel media
Nuba Wastewater Treatment SystemThe wastewater treatment system in Nuba was implemented by the PHG in 2002. The system was composed of 1.8 km gravity sewage network and a WWTP designed to serve around 2,000 persons with a capacity of 120 m3/day. The sewage network was expanded gradually from 1.8 km in 2002 to 6.7 km in 2008, connecting an additional 205 housing units (Nuba Village Council, 2011). The WWTP is covers 2 dunums of land. The daily flow to the WWTP was estimated at 200 m3 of wastewater originating from domestic and commercial sources. Initially the WWTP was operated well with a high COD removal efficiency of 90%. Unfortunately it is now malfunctioning. The constructed wetlands have not functioned since commissioning due to a design failure that has not been remedied. Currently there is uncontrolled wastewater leakage from the wetland area into the surrounding area.
Bani Zeid Wastewater Treatment SystemBani Zeid (Al-Gharbiyeh) plant was constructed by the PHG .The system is composed of 3 km gravity sewage, installed in 2002, and a WWTP designed to treat 100 m3/day. The WWTP is covers 9 dunums of land. It was commissioned in 2004 and is currently serving 31 houses and a school. The daily flow to the WWTP is estimated at 20 m3 of wastewater, originating from domestic and commercial sources. As a result of the plant not operating efficiently a new project funded through the PWA. The rehabilitation of the plant was funded via an Austrian project and implemented by PHG. Construction started in June 2011 and it is expected to be completed in summer 2012. The WWTP capacity will be increased and more population will be served.

82
Water Status Report 2011
Deir Samit Wastewater Treatment System
Deir Samit was constructed in 2004. The system has 900 m gravity sewage network and a WWTP for 40 houses and a school. The WWTP covers 0.5 dunum of land, and is designed to treat 13.5 m3 of domestic wastewater per day. The WWTP operated well during the period between November 2004 and April 2005. Recently it has been reported by the Deir Samit Village Council that the WWTP is overloaded and has suffered from lack of maintenance and incorrect operation due to a lack of financial resources
Hajja Wastewater Treatment System
Hajja was constructed in 2004. The system has 2 km gravity sewer and a WWTP for 100 houses, 4 schools, 4 mosques and a clinic. The WWTP was designed to treat 30 – 40 m3 of wastewater per day. The daily flow to the plant is estimated at 40 m3 of wastewater originating from domestic and commercial sources, the plant is operating with moderate efficiency. A new project funded by EU through the food security project and will be implemented by JVC to rehabilitate and expand the plant. This work is ongoing and expected to be completed in summer 2012.
‘Attil Wastewater Treatment System
‘Attil was constructed in 2006. The system is 1.9 km gravity sewer and a WWTP for 44 houses. The plant covers 400 m2 of land designed to treat 14 m3 of domestic wastewater per day with a population equivalent of 175. The treated effluent is currently used by four local farmers for restricted irrigation of 15 dunums of agricultural land cultivated with fruit trees. The WWTP is functioning well with low efficiency. The treated effluent is currently used by two local farmers for restricted irrigation of 4 dunums of agricultural land cultivated with fruit

83
Zeita Wastewater Treatment System
The system was designed treat 14 m3 of domestic wastewater from 54 houses using 1.3 km gravity sewer and a collective WWTP that covers 1.5 dunums of land. The Zeita Municipality expanded the sewage network which allowed an additional 75 – 80 houses to be connected to the treatment system. The daily flow to the plant is estimated to be 30 – 35 m3, which exceeds the design capacity of the plant. The plant is functioning well with low efficiency. The treated effluent is used by two local farmers for restricted irrigation of 4-5 dunums of agricultural land cultivated with fruit
Sir Wastewater Treatment System
Sir was constructed in 2006. The system is 1.5 km gravity sewer and a WWTP for 41 houses. The plant covers 300 m2 of land and was designed to treat 14 m3 of domestic wastewater per day. The actual daily flow to the plant is 15 m3. The plant is functioning well with moderate efficiency. The treated effluent is used by three local farmers for restricted irrigation of 10 dunums of agricultural land cultivated with fruit
Biddya Wastewater Treatment System
Biddya was designed to daily collect and treat 11.2 m3 of domestic wastewater from 42 houses, with a population equivalent of 140, using 1.2 km gravity sewer and a collective WWTP that covers 2-3 dunums of land. Currently, the treatment system receives the wastewater generated from 38 houses, one clinic, and a mosque. The plant is currently malfunctioning with low efficiency as it is overloaded and not operated and maintained effectively. The treated effluent is discharged in an open area. An Austrian project managed by PWA and implemented by PHG to rehabilitate the WWTP was started in October 2011. It is expected to be completed in autumn 2012. The plant’s capacity will be increased to treat all the Wastewater generated from the connected population.
‘Ein Siniya Wastewater Treatment System
‘Ein Siniya is a pilot wastewater treatment plant that was constructed in 2007. The pilot plant was designed to treat 10 m3 of wastewater per day. The average influent and effluent wastewater characteristics for the period between April 2008 and January 2009 are shown in Table below

84
Water Status Report 2011
Table (33) Average Influent and Effluent Wastewater Characteristics - ‘Ein Siniya
WWTP, April 2008 - January 2009
Parameter Influent (mg/l)
effluent
(mg/l)
efficiency (%)
Chemical Oxygen Demand (COD) 438 44 90.4
Total Suspended Solids (TSS) 1363 6 99.5
Biochemical Oxygen Demand BOD 258 25 90.3
At the start of operation, the WWTP was operating well with a high COD, BOD, and TSS removal efficiencies of 90.4%, 90.3% and 99.5 % respectively; however it is not currently operating. The plan is to transfer the WWTP to another location to be used for experimental and educational purposes.
Nahhalin Wastewater Treatment System
Nahhalin is a storage/ removal system (cesspit) and is designed to daily collect and treat 50 m3 of domestic wastewater generated from around 1,300 persons. The wastewater is collected using a 7 m3 vacuum truck which conducts around 7 trips per day to the plant. The WWTP plant is 750 m2 of land rented by the village council, however it is not currently operating. The reasons why the Village Council have stopped operation of the system was said to be lack of financial resources.
3.4.3 Onsite Small Scale Black Wastewater Treatment Plants
In addition to the existing central and collective WWTPs, onsite small scale wastewater treatment plants have been established in several rural localities of the West Bank where the dispersed pattern of houses in these rural localities makes it economically unfeasible to construct wastewater collection networks and centralized wastewater treatment plants.
On-Site small scale wastewater treatment plants, which can serve a single house or a cluster of houses, respond to the needs and conditions in rural localities. They can solve the wastewater collection and disposal problems in such communities, along with the benefit of generating a water resource

85
that can be utilized for irrigation purposes as land and agriculture are available.
Two types of onsite small scale wastewater treatment systems were implemented in the West Bank, namely: 1. Black wastewater treatment and, 2. grey wastewater treatment. Table 34 shows the agencies that implemented on-site small scale black/grey wastewater treatment plants, and the number of the implemented units.
Table (34) Agencies that implemented on-site small scale black/grey wastewater
treatment plants
Implementing Agency WWTP Type Total Number of WWTPs
Applied Research Institute – Jerusalem (ARIJ) Black WW 180
Grey WW 107
Palestinian Hydrology Group (PHG) Grey WW 156
Union of Agricultural Work Committees (UAWC) Grey WW 67
United Nations Food and Agriculture Organisa-tion (FAO)
Grey WW 67
Palestinian Wastewater Engineers‹ Group (PWEG)
Grey WW 81
Palestinian Agricultural Relief Committees (PARC)
Grey WW 80
(Source: Implementing Agencies, 2011)
The status of the small scale treatment plants is difficult to report. The efficiency of the treatment plants, their operation, maintenance, and reuse depends on the behavior and willingness of the owners. According to surveys done by PWA through the Austrian project in 2011 indications are that the majority of those on site plants are not working effectively, initial indications are that this is due to lack of O&M experience or lack of awareness. These results show, the quality of treatment in most cases do not comply with the Palestinian standards for treatment and reuse.

86
Water Status Report 2011
3.5 Wastewater Collection and Treatment in Gaza Strip
In Gaza Strip, water is used for three main categories: domestic, agriculture and industry. The existing population of the Gaza Strip is approximately 1.416 Million inhabitants (PCBS, 2007) distributed between urban and rural areas and based on current trends is expected to reach 2,910,400 inhabitants by 2025. This means that the population will be more than doubled in the coming 20 years. Regarding future distribution and projection of population growth in the most densely area in the World. The Ministry of Planning and International Cooperation (MOPIC) forecasts that the growth of 3.5% is distributed proportionally between to the urban areas. As a result the population of the rural areas will increase by natural growth only and the impact of immigration will be in the urban areas (MOPIC, 1997) as shown in Table 35.
Table (35) Projection of population in Gaza Strip, PCBC, 2007
Governorates 1996 2000 2005 2010 2015 2020 2025
Northern
Governorate
148,700 169,259 198,234 228,614 258,495 286,549 318,892
Gaza Governorate 354,400 415,835 501,156 671,327 839,375 950,816 1,075,038
Deir El Balah
Governorate
145,200 165,212 193,427 223,016 252,129 279,382 310,822
Khan Younis
Governorate
201,400 242,903 300,615 546,933 743,731 850,319 968,875
Rafah Governorate 113,100 128,091 149,339 171,656 193,735 213,637 236,801
TOTAL 962,800 1,121,300 1,342,771 1,841,546 2,287,465 2,580,703 2,910,428
Global density
(inhab/km²)
2,638 3,072 3,679 5,045 6,267 7,070 7,974
Rate of population
growth (%/year)
3.80 3.60 6.27 4.32 2.41 2.40
Around two thirds of the population in the Gaza Strip is served by sewage network system and the remainder disposes raw wastewater into cesspools, open drains and vaults. Khan Younis Governorate in the south of Gaza represents the poorest area in wastewater collection as well as

87
poor treatment and infrastructure. The collected wastewater through the sewage network system is pumped to four wastewater treatment plants (WWTPs), as shown in Table 36.
Table (36) The coverage of wastewater network all over the Governorates in Gaza
Strip, 2011
Governorate Population (capita) coverage
(%)
Wastewater production (m3/day)
North Area 298,125 80 23,000
Gaza 546,959 90 60,000
Middle area 223,679 75 10,000
Khan Younis 299,918 40 10,000
Rafah 183,649 75 10,000
TOTAL 1,552,330 72 113,000
Water uses in Gaza Strip for domestic purposes varies from 75 l/c/d to 107 l/c/d with an average of 96l/c/d (PWA, 2011). Wastewater generation is around 80% of water use for domestic purposes. The quantities of treated wastewater are expected to reach 80 MCM per year by 2025.
This waste water if collected and treated effectively has the potential to minimize the shortage in water sources in the area. The quality of the wastewater is considered acceptable for reuse after treatment. The analyses carried for heavy metals and toxic elements shows that the raw sewage is nearly free from these hazardous elements.
The wastewater is considered heavily polluted if the organic loading is high. Hence the concentration of the waste water from the area is considered high. It has been suggested that this is due to water consumption, which is below the required demand according to WHO. The consumption per head is generally low resulting in a more concentrated effluent.
Wastewater treatment has been considered in the Gaza strip since 1970. Stabilization ponds were the technology proposed at that time. During the Israeli occupation period, there was no real attention towards improvement of wastewater treatment. In cooperation with international agencies, the

88
Water Status Report 2011
Palestinians have carried many trials to treat and reuse wastewater in this region.
Greater attention has been paid to improve this sector following the creation of the Palestinian National Authority (PNA) in 1993. The PNA intends to prepare a Palestinian policy regarding wastewater treatment and reuse. This policy will guide agencies in the proper treatment technology by using local and international experience in treatment technology and cost. To achieve this objective the consultants intend to access the data from the existing treatment plants and monitor rehabilitation carried out in the last few years to evaluate the quality of effluent compared and carry out cost benefit analysis from each of the treatment plants studied.
3.5.1 Existing wastewater treatment plants
There are four wastewater treatment plants operating in the Gaza Strip: Jabalia in the north, Gaza in the Gaza City, Khan Younis and Rafah in the south. The type of treatment, quantity and final disposal of each plant is summarized in Table 37. The existing three plants are heavily overloaded as the actual flow exceeds the design flow. Blocked pipes and flooded manholes are daily events in Gaza Strip. The total capacity of the existing three WWTPs is approximately 41. MCM/year.
Table (37) General features of wastewater production and collection in Gaza
Strip.
Governorate Population
Capita
Connect to
Sewage net-
work (%)
Sewage
Production
(m3/day)
Treatment
Availability
Final Destina-
tion
Northern 290, 000 80% 23,000Available Par-tially Treat-ment
100% Infiltra-tion basins East & North of Gaza Strip
Gaza 550, 000 90% 60,000
Available 80% Partially Treatment &20% Raw
100% to sea)

89
Middle 220, 000 75% 10, 000 Not Available
100% Wadi Gaza and indi-rectly to the Sea 10,000 Raw
Khan Younis 280, 000 40% 10,000Available Par-tially Treat-ment
100% to sea
Rafah 185, 000 75% 10,000Available par-tially Treat-ment
100% to sea
TOTAL 1,525,.000 41 mcm / yr
33 mcm /y To sea
Table 38 presents the general comments of the status and condition of wastewater treatment plants in Gaza Strip in2011 . The Mediterranean Sea represents the final disposal of most treated or partially treated wastewater in Gaza strip.
Table (38) Treatment plants in the Gaza Strip, 2011.
Location construction
Date
Treatment
method
Quantity
m3/day
Final disposal remarks
beit Lahia 1976 Stabilization
ponds and
aerated lagoons
23,000 Surroundings
and dunes
The new treatment
plant is under construc-
tion while the old one is
overloaded
Gaza 1977 Anaerobic ponds
followed with
bio-towers
60,000 To the sea The treatment plant is
under rehabilitation by
KFW in 2012
Khan
Younis
2007 Anaerobic lagoon
followed by aero-
bic lagoon
10,000 To the sea The treatment plant
is under rehabilitation
by Icrc
rafah 1983 Anaerobic ponds
followed with
bio-towers
10,000 To the sea The plant is new
rehabilitate by Icrc

90
Water Status Report 2011
Figure (30) Existing and Planned Wastewater Plants in the Gaza Strip
3.6 Wastewater projects in 2011As mentioned in the previous sections, several donors committed to help the Palestinian to improve the wastewater sector in terms of collection, treatment, reuse and capacity building. The following table shows the status of the ongoing projects (name, service area, donor, budget, type of the project).

91
Tab
le (3
9)
Was
tew
ater
pro
ject
s u
nd
er p
rep
arat
ion
, im
ple
men
tati
on
an
d c
om
ple
ted
in 2
011
No
Was
tew
ater
Pro
ject
Area
Dono
rDe
sign
ca
paci
ty
(m3/
d)
esti
mat
edco
stSt
atus
Popu
latio
nco
mpo
nent
s
1Je
nin,
Misi
lya
villa
geW
BAF
D40
0€
M 2
.8 F.
S. &
EIA
&De
sign
phas
e4,
000
Col
lecti
on sy
stem
, WW
TP,
Reus
e sy
stem
2Tu
bas,
Tay
asee
rW
BEU
3000
€ M
22
F.S&
EIA
&De
sign
phas
e25
,000
Col
lecti
on sy
stem
, WW
TP,
Reu
se sy
stem
, Cap
acity
Build
ing
3N
ablu
s wes
t, W
WTP
WB
KFW
1200
0€
M 3
0 U
nder
Cons
truc
tion
110,
000
Col
lecti
on sy
stem
, WW
TP,
Reus
e sy
stem
4 R
amal
lah,
Bet
unia
- Ein
Jario
tW
BKF
W10
000
€ M
27
Desig
n ph
ase
59,0
00 C
olle
ction
syst
em, W
WTP
,Re
use
syst
em
5 Je
richo
sew
erag
epr
ojec
tW
BJa
pan
9600
$ M
32
Und
erCo
nstr
uctio
n22
,000
Colle
ction
syst
em, W
WTP
, Re
use
syst
em, C
apac
ity
Build
ing
6He
bron
, WW
TPW
B W
B &
AFD
1500
0$
M 3
8F.S
. & E
IA30
0,00
0 C
olle
ction
syst
em, W
WTP
, R
euse
syst
em, C
apac
ityBu
ildin
g
7 R
ehab
ilita
tion
of Je
nin
TPW
BKF
W90
00€
M 1
.5Co
mpl
eted
55,0
00 R
ehab
ilita
tion
of e
xisti
ngW
WTP
8 T
ulka
rm S
ewer
age
Proj
ect
WB
KFW
-€
M 1
9 U
nder
Cons
truc
tion
75,0
00 C
olle
ction
syst
em, t
runk
line,
pre
-tre
atm
ent

92
Water Status Report 2011
No
Was
tew
ater
Pro
ject
Area
Dono
rDe
sign
ca
paci
ty
(m3/
d)
esti
mat
edco
stSt
atus
Popu
latio
nco
mpo
nent
s
9 A
nza,
Bei
t Daj
an,
Haj
ja, S
ir, A
t-Tay
bah,
Ram
mun
WB
EU 2
00-4
00(e
ach)
€ 9
Und
erCo
nstr
uctio
n20
,000
Col
lecti
on sy
stem
, WW
TP,
Reu
se sy
stem
, Cap
acity
Build
ing
10 A
l-Yam
un, Q
abati
ya,
Ya’
abad
, Azz
un, ,
,Tar
qum
iya,
Dur
a
WB
USA
ID18
,000
-30
,000
Each
(20-
(25M
USD
Des
ign
com
plet
ed15
0,00
0 C
olle
ction
syst
em, W
WTP
, R
euse
syst
em, C
apac
ityBu
ildin
g
11 B
eit H
asan
sew
erag
epr
ojec
tW
BSp
ain
100
$ 0.
31M
Desig
n Ph
ase
8,00
0 C
onst
ructi
on o
f WW
TP &
colle
ction
syst
em
12 A
l’Aro
ub W
WTP
proj
ect
WB
Spai
n12
00€
M 1
.5Co
nstr
uctio
n of
WW
TP
13Ha
bla,
Baq
a, B
arta
’aW
BJa
pan
-$
M 6
.2Co
mpl
eted
22,0
00Co
llecti
on sy
stem
14 N
ablu
s Eas
t sew
erag
epr
ojec
tW
BKF
W14
000
€ M
30
F.S.
& E
IA&
Desig
n ph
ase
80,0
00 C
olle
ction
syst
em, W
WTP
, R
euse
syst
em, C
apac
ityBu
ildin
g
15 N
orth
Eas
t Jer
usal
emW
W p
roje
ctW
BFi
nlan
d-
San
itatio
n an
dba
selin
e St
udy
30,0
00 C
olle
ction
syst
em, W
WTP
, R
euse
syst
em, C
apac
ityBu
ildin
g

93
No
Was
tew
ater
Pro
ject
Area
Dono
rDe
sign
ca
paci
ty
(m3/
d)
esti
mat
edco
stSt
atus
Popu
latio
nco
mpo
nent
s
16 R
awab
i Reg
iona
l se
wer
age
proj
ect.
F.Sph
ase
WB
UST
DA-
$ M
0.5
Feas
ibili
ty st
udy
Col
lecti
on sy
stem
, WW
TP,
Reu
se sy
stem
, Cap
acity
Build
ing
17 W
est B
ethl
ehem
vill
ages
wat
er su
pply
and
sani
tatio
n pr
ojec
t
WB
WB
-$
M 3
.65
TO
R fo
r the
feas
ibili
ty st
udy
25,0
00 C
olle
ction
syst
em, W
WTP
, R
euse
syst
em, C
apac
ityBu
ildin
g
18 U
pgra
ding
exi
sting
smal
l sca
le W
WTP
inRu
ral A
rea
WB
Aust
ria-
€ M
0.2
2 Im
plem
enta
tion
phas
e20
,000
Reh
abili
tatio
n of
exi
sting
WW
TP
19Ar
tas s
ewag
e pr
ojec
tW
BBT
C€
M 0
.6Co
mpl
eted
5,00
0 C
olle
ction
syst
em &
pos
ter
stati
on
20 H
ebro
n In
dust
rial a
rea
WW
pro
ject
WB
USA
ID$
M 1
.5 Im
plem
enta
tion
phas
e-
Cle
anin
g in
dust
rial z
one
from
slur
ry g
ener
ated
by
ston
e cu
tting
fact
orie
s
21 B
ethl
ehem
Indu
stria
lZo
ne W
WTP
WB
AFD
Pha
se 1
:0.
5
Pha
se 2
:€
3.5
M
Und
erCo
nstr
uctio
nPh
ase
1:10
0
Phas
e 2:
500
WW
TP a
nd C
olle
ction
syst
em

94
Water Status Report 2011
No
Was
tew
ater
Pro
ject
Area
Dono
rDe
sign
ca
paci
ty
(m3/
d)
esti
mat
edco
stSt
atus
Popu
latio
nco
mpo
nent
s
22 A
l-Rih
an N
eigh
borh
ood
WW
proj
ect
WB
Priv
ate
Und
erCo
nstr
uctio
n50
0 W
WTP
and
Col
lecti
onsy
stem
23 A
l-Tire
h N
eigh
borh
ood
WW
pro
ject
WB
Priv
ate
$ M
3.8
Und
erCo
nstr
uctio
n2,
000
WW
TP a
nd C
olle
ction
syst
em
24 D
iplo
mati
c Co
mpo
und
WW
pro
ject
WB
Priv
ate
$ M
1.5
Und
erCo
nstr
uctio
n50
0 W
WTP
and
Col
lecti
onsy
stem
25N
orth
Gaz
a Be
it La
hiah
GZ W
B, A
FD,
SIDA
, BTC
3000
0$
M 7
5/40
Und
erCo
nstr
uctio
n E
mer
genc
y Ph
ase:
Reh
abili
tatio
n &
exp
ansio
nof
exi
sting
WW
TP
26Ga
za C
entr
alGZ
KFW
5000
0€
M 1
9 U
nder
Cons
truc
tion
Em
erge
ncy
Phas
e: R
ehab
ilita
tion
& e
xpan
sion
of e
xisti
ng W
WTP
27 K
han
Youn
isGZ
IDB,
Japa
n44
,000
$ 5
6MU
nder
Des
ign
WW
TP a
nd C
olle
ction
Syst
em

95
No
Was
tew
ater
Pro
ject
Area
Dono
rDe
sign
ca
paci
ty
(m3/
d)
esti
mat
edco
stSt
atus
Popu
latio
nco
mpo
nent
s
22 A
l-Rih
an N
eigh
borh
ood
WW
proj
ect
WB
Priv
ate
Und
erCo
nstr
uctio
n50
0 W
WTP
and
Col
lecti
onsy
stem
23 A
l-Tire
h N
eigh
borh
ood
WW
pro
ject
WB
Priv
ate
$ M
3.8
Und
erCo
nstr
uctio
n2,
000
WW
TP a
nd C
olle
ction
syst
em
24 D
iplo
mati
c Co
mpo
und
WW
pro
ject
WB
Priv
ate
$ M
1.5
Und
erCo
nstr
uctio
n50
0 W
WTP
and
Col
lecti
onsy
stem
25N
orth
Gaz
a Be
it La
hiah
GZ W
B, A
FD,
SIDA
, BTC
3000
0$
M 7
5/40
Und
erCo
nstr
uctio
n E
mer
genc
y Ph
ase:
Reh
abili
tatio
n &
exp
ansio
nof
exi
sting
WW
TP
26Ga
za C
entr
alGZ
KFW
5000
0€
M 1
9 U
nder
Cons
truc
tion
Em
erge
ncy
Phas
e: R
ehab
ilita
tion
& e
xpan
sion
of e
xisti
ng W
WTP
27 K
han
Youn
isGZ
IDB,
Japa
n44
,000
$ 5
6MU
nder
Des
ign
WW
TP a
nd C
olle
ction
Syst
em

96
Water Status Report 2011
This publication has been produced by the Palestinian Water Authority in partnership with UNICEF in support of the data bank enhancement initiative. The views expressed in this publication are those of authors and do not necessarily reflect the policies or views of UNICEF and the designations and presentation of material do not imply any expression of opinion of the United Nations or UNICEF as to the legal status of any country, territory, city, or area, or of the authorities thereof, or as to the delimitation of boundaries or national affiliation.