palm calculus part 1 the importance of the viewpointperfeval.epfl.ch/printme/palm1.pdf · dec....
TRANSCRIPT
Palm CalculusPart 1The Importance of the Viewpoint
JY Le Boudec
1April 2019

AirBnB claims: median occupancy of rented listings is 11%(40 days a year)
Airbnb. Data on the Airbnb community in New York City . Technical report, AirBnB corporation, Dec. 2015.
2
Insideairbnb.com claims:median occupancy of rented listings is 40‐50%(165 days a year)
Lecuyer, M., Tucker, M. and Chaintreau, A., 2017, April. Improving the Transparency of the Sharing Economy. In Proceedings of the 26th International Conference on World Wide Web Companion (pp. 1043‐1051). International World Wide Web Conferences Steering Committee.
Who says the truth ?

SovRail: according to our systematic tracking system, probability of a train being late 5%
3
BorduKonsum: according to our consumer survey, probability of being late 30%
Who says the truth ?

1. Event versus Time Averages
Consider a simulation, state 𝑡
Assume simulation has a stationary regime
Consider an Event Clock: times at which some specific changes of state occur
Ex: arrival of job; Ex. queue becomes empty
Event average statistic: mean queue length seen by an arriving customer:
Time average statistic: mean queue length (seen by an inspector):
4

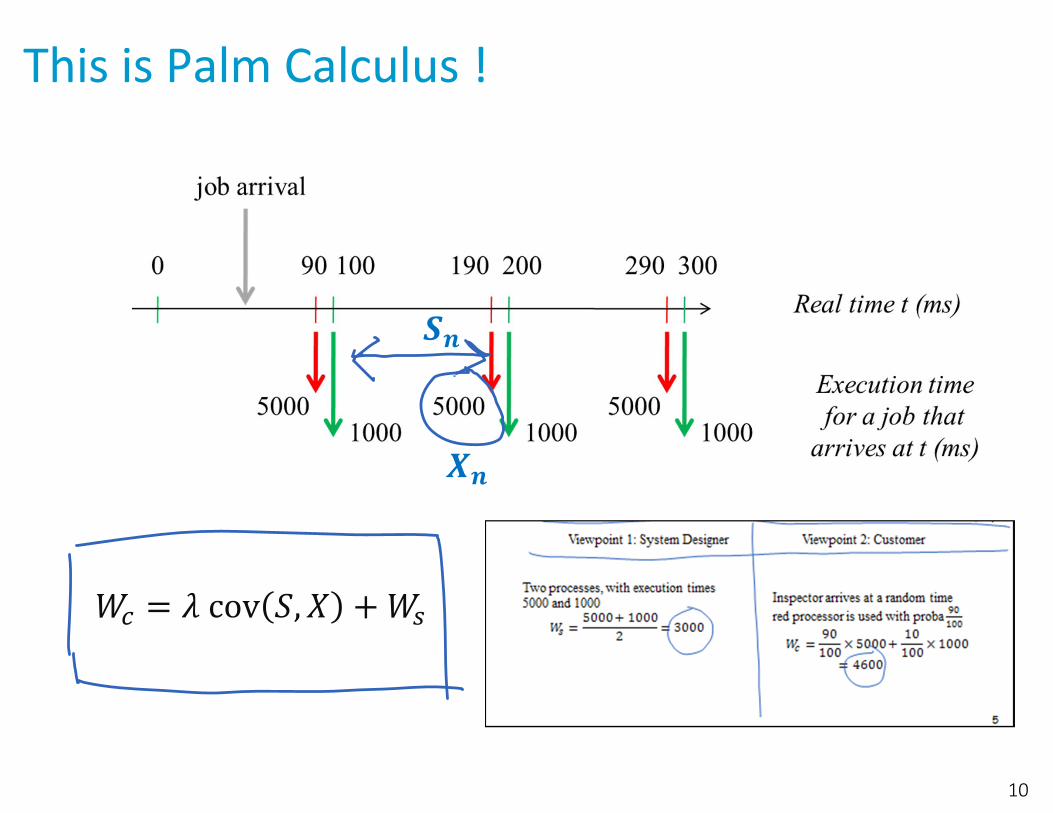
Example: Gatekeeper; Average execution time
5
0 90 100 190 200 290 300
50001000
Real time t (ms)
job arrival
50001000
50001000
Execution time for a job thatarrives at t (ms)
Viewpoint 1: System Designer Viewpoint 2: Customer
Two processes, with execution times 5000 and 1000
𝑊5000 1000
2 3000
Inspector arrives at a random timered processor is used with proba
𝑊90
100 500010
100 10004600

Sampling Bias
and are different, but both are average execution times !A metric definition should mention the sampling method (viewpoint)Different sampling methods may provide different values: this is the sampling bias
Palm Calculus is a set of formulas for relating different viewpoints
Can often be obtained by means of the Large Time Heuristic
6
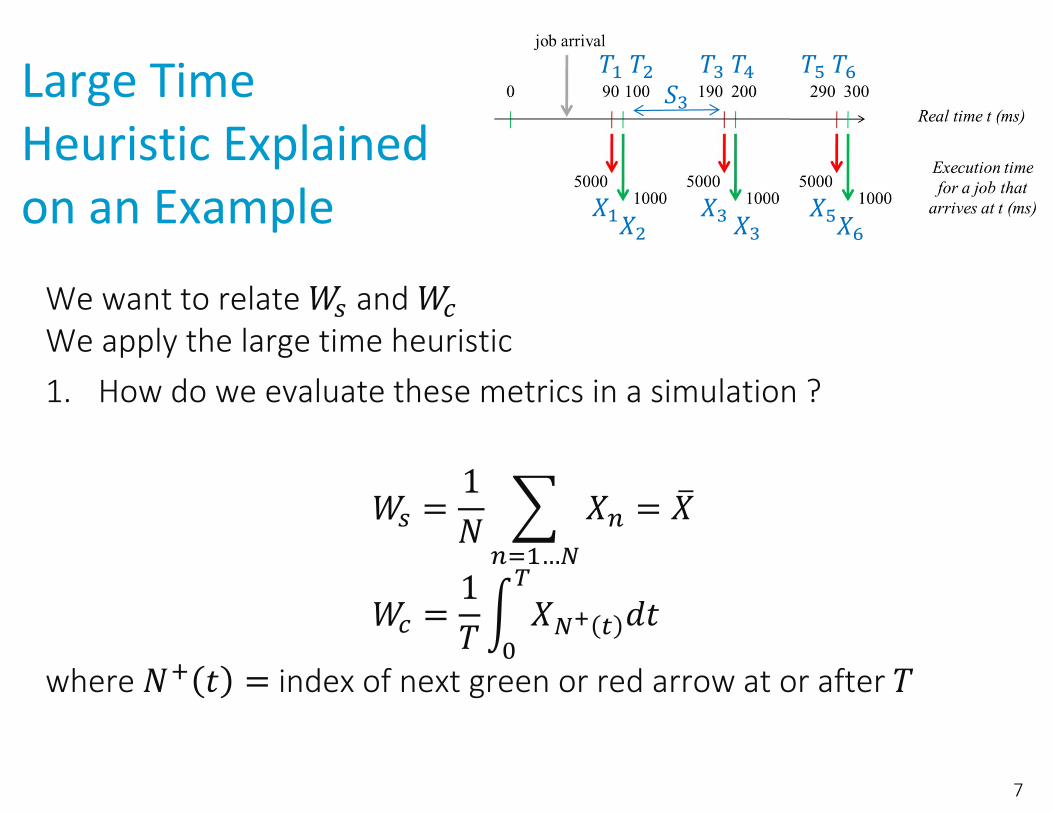
Large Time Heuristic Explained on an Example
We want to relate and We apply the large time heuristic1. How do we evaluate these metrics in a simulation ?
…
where index of next green or red arrow at or after
7
𝑇 𝑇 𝑇 𝑇 𝑇 𝑇
𝑋𝑋
𝑋𝑋
𝑋𝑋
𝑆
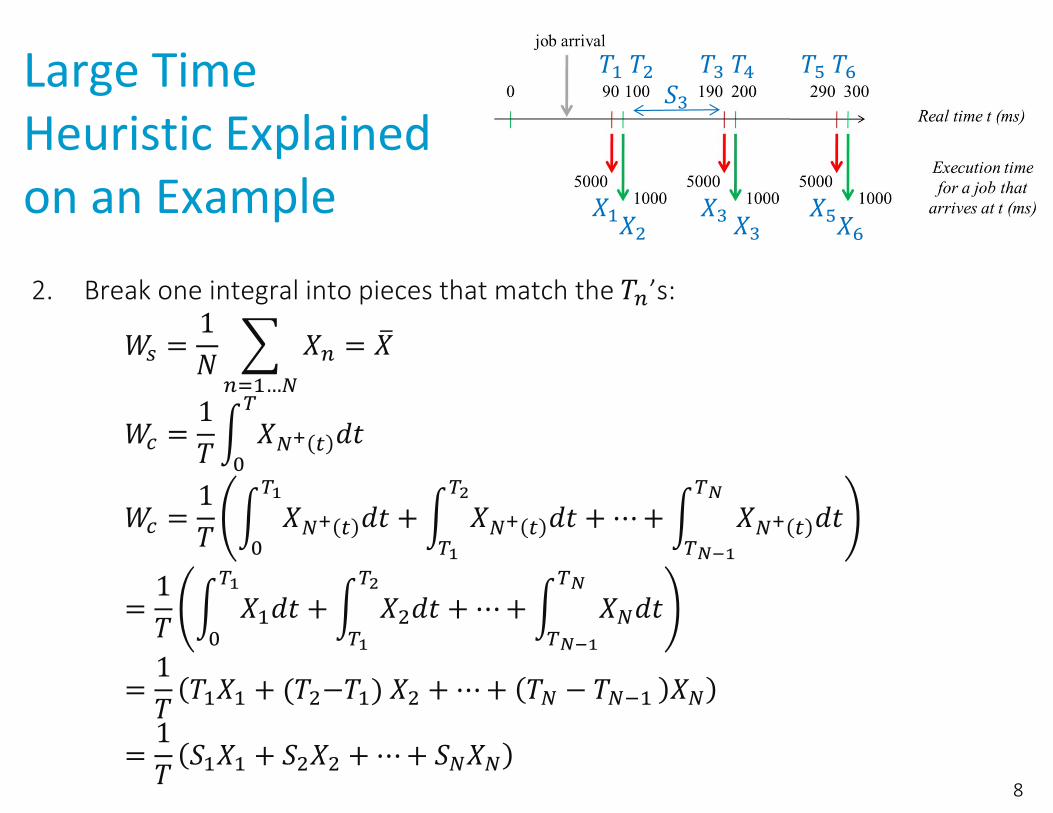
Large Time Heuristic Explained on an Example
2. Break one integral into pieces that match the 𝑇 ’s:
𝑊1𝑁 𝑋
…
𝑋
𝑊1𝑇 𝑋 𝑑𝑡
𝑊1𝑇 𝑋 𝑑𝑡 𝑋 𝑑𝑡 ⋯ 𝑋 𝑑𝑡
1𝑇 𝑋 𝑑𝑡 𝑋 𝑑𝑡 ⋯ 𝑋 𝑑𝑡
1𝑇 𝑇 𝑋 𝑇 𝑇 𝑋 ⋯ 𝑇 𝑇 𝑋1𝑇 𝑆 𝑋 𝑆 𝑋 ⋯ 𝑆 𝑋
8
𝑇 𝑇 𝑇 𝑇 𝑇 𝑇
𝑋𝑋
𝑋𝑋
𝑋𝑋
𝑆
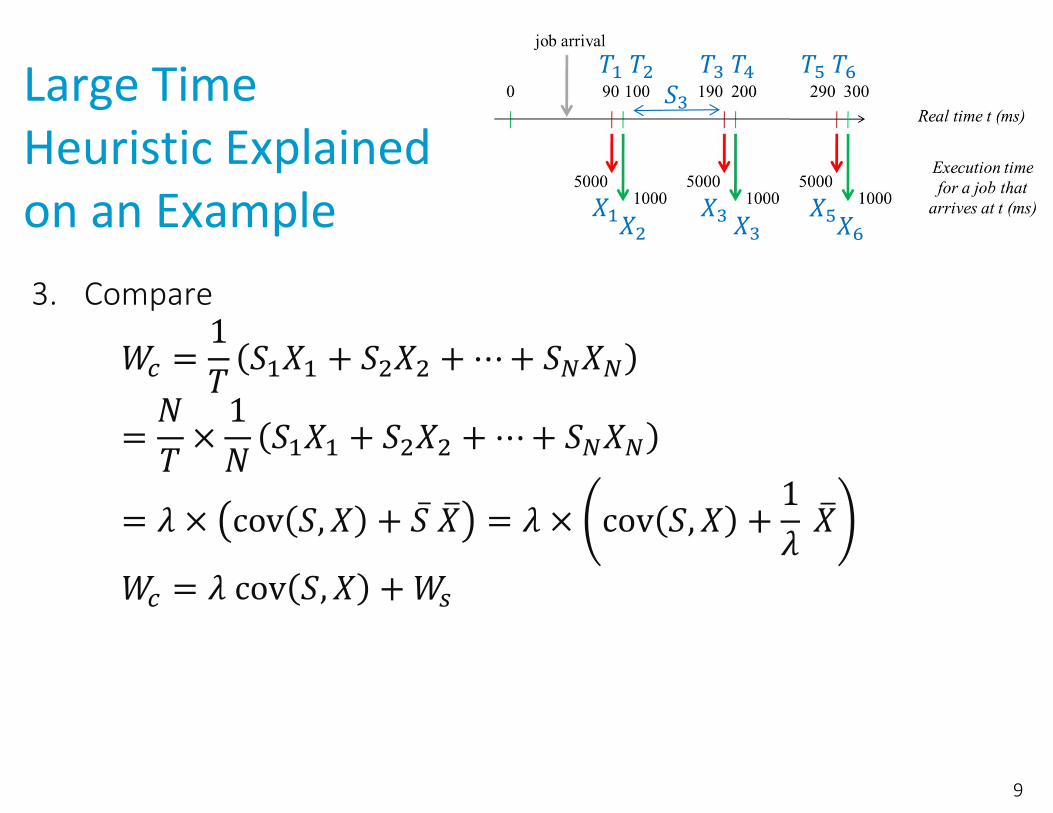
Large Time Heuristic Explained on an Example3. Compare
9
𝑇 𝑇 𝑇 𝑇 𝑇 𝑇
𝑋𝑋
𝑋𝑋
𝑋𝑋
𝑆
This is Palm Calculus !
10
𝒏
𝒏
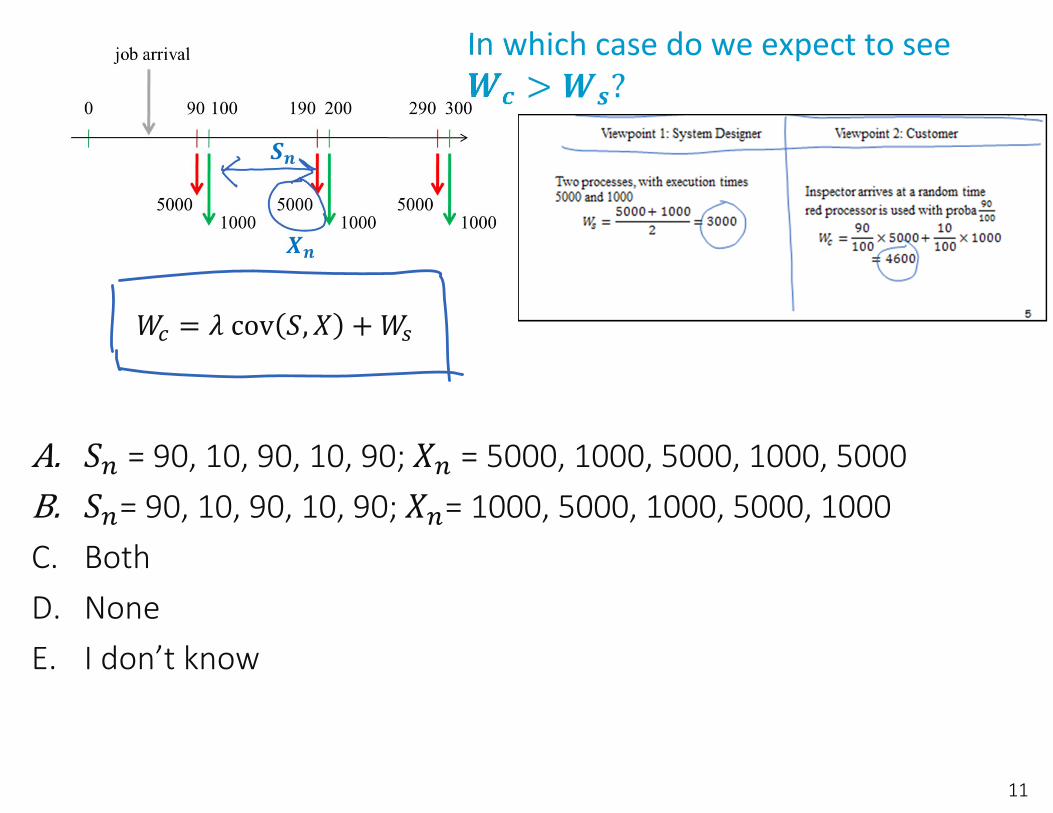
In which case do we expect to see 𝒄 𝒔
= 90, 10, 90, 10, 90; = 5000, 1000, 5000, 1000, 5000= 90, 10, 90, 10, 90; = 1000, 5000, 1000, 5000, 1000
C. BothD. NoneE. I don’t know
11
𝑊 𝜆 cov 𝑆, 𝑋 𝑊

Solution
In case A, and are positively correlated (when the interval is long, so is the processing time), i.e. . By the Palm calculus formula:
In case B, the correlation is negative, therefore
Answer A
12
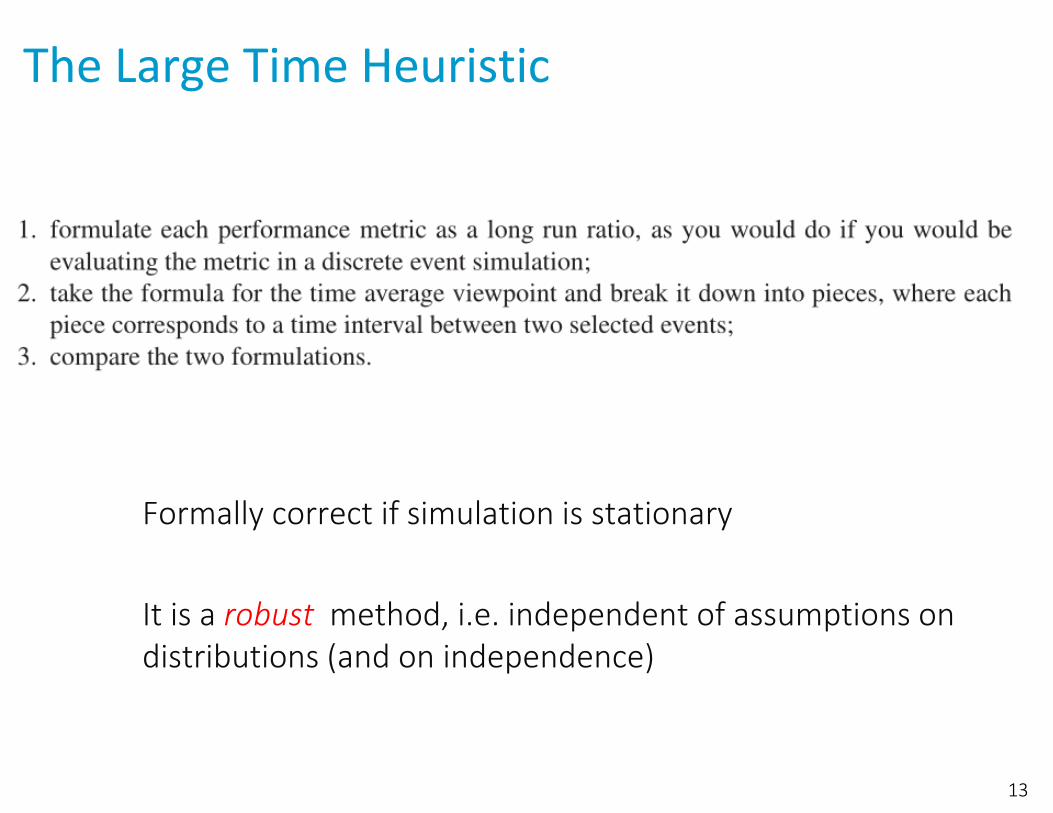
The Large Time Heuristic
Formally correct if simulation is stationary
It is a robust method, i.e. independent of assumptions on distributions (and on independence)
13
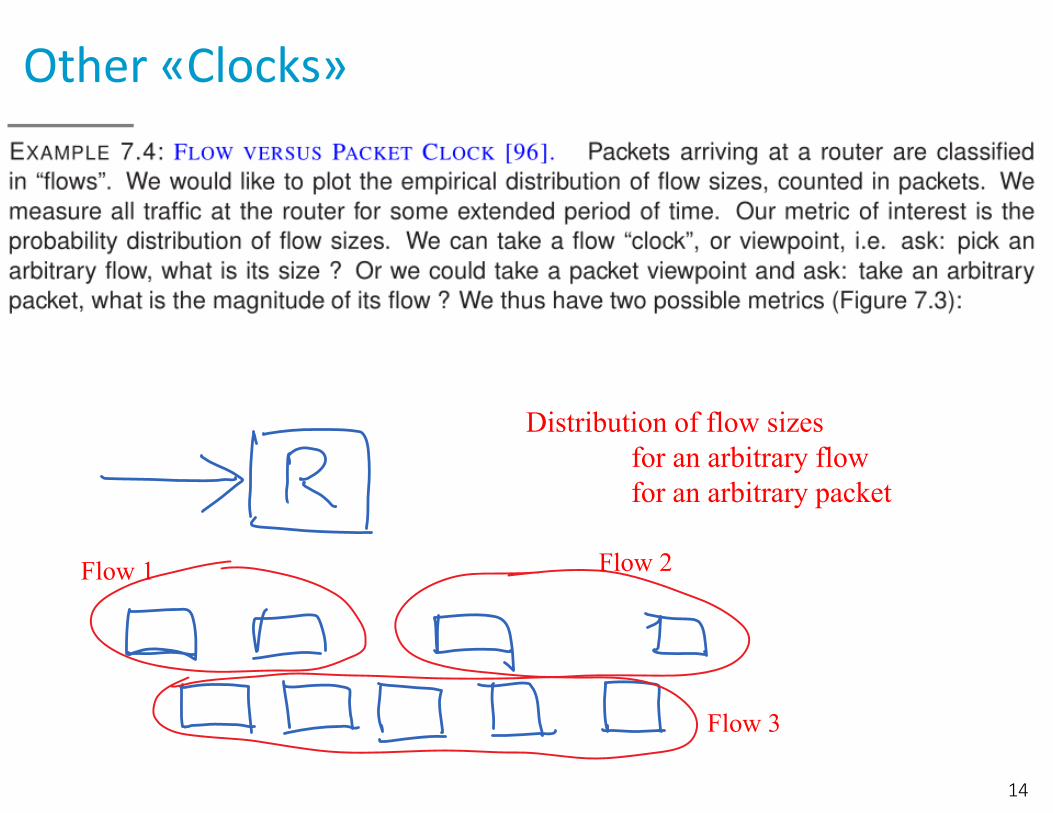
Other «Clocks»
14
Flow 1 Flow 2
Flow 3
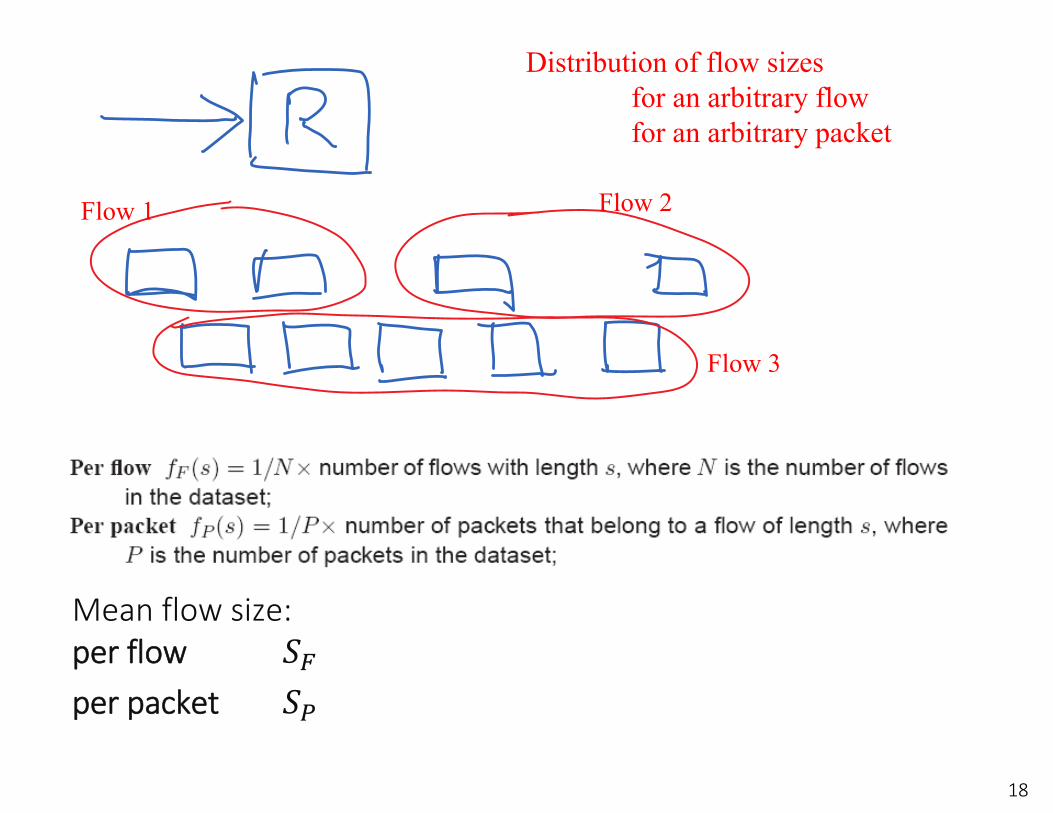
Distribution of flow sizesfor an arbitrary flowfor an arbitrary packet

Which curves are for the per‐packet viewpoint ?
A. AB. BC. It dependsD. I don’t know
15

Solution
Answer AThere are more packets in the large flows. So more packets experience a large flow size.
16
17
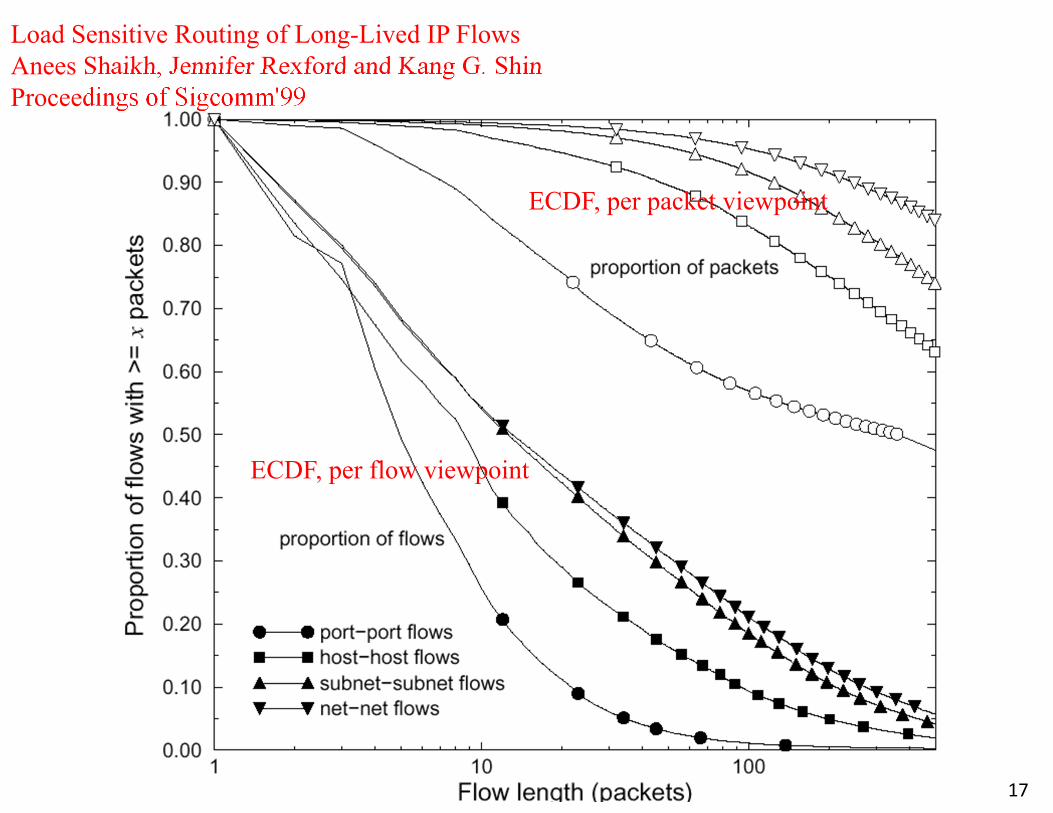
Load Sensitive Routing of Long-Lived IP FlowsAnees Shaikh, Jennifer Rexford and Kang G. ShinProceedings of Sigcomm'99
ECDF, per flow viewpoint
ECDF, per packet viewpoint
Mean flow size:per flow per packet
18
Flow 1 Flow 2
Flow 3
Distribution of flow sizesfor an arbitrary flowfor an arbitrary packet
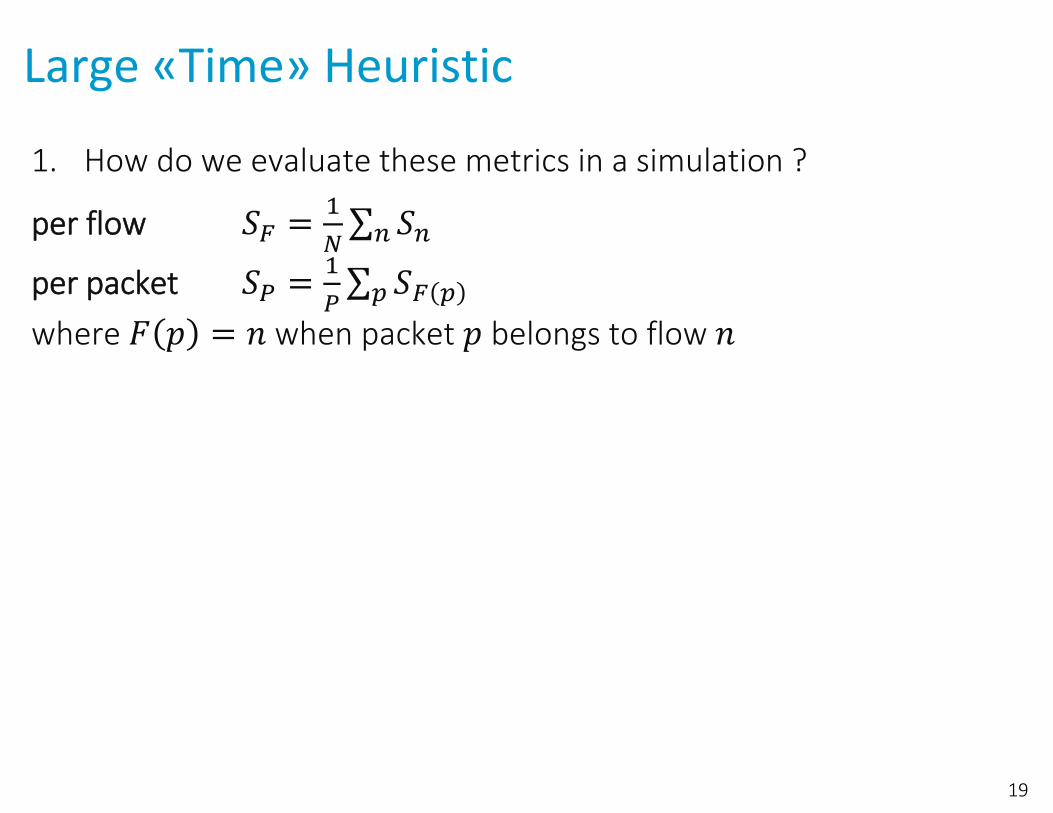
Large «Time» Heuristic
1. How do we evaluate these metrics in a simulation ?
per flow
per packetwhere when packet belongs to flow
19

1. How do we evaluate these metrics in a simulation ?per flow
per packetwhere when packet belongs to flow
2. Put the packets side by side, sorted by flow
20
Flow n=1 Flow n=2 Flow n=3
p=1 p=2 p=3 p=4 p=5 p=6 p=7 p=8 p=9
Size 𝑆 Size 𝑆 Size 𝑆
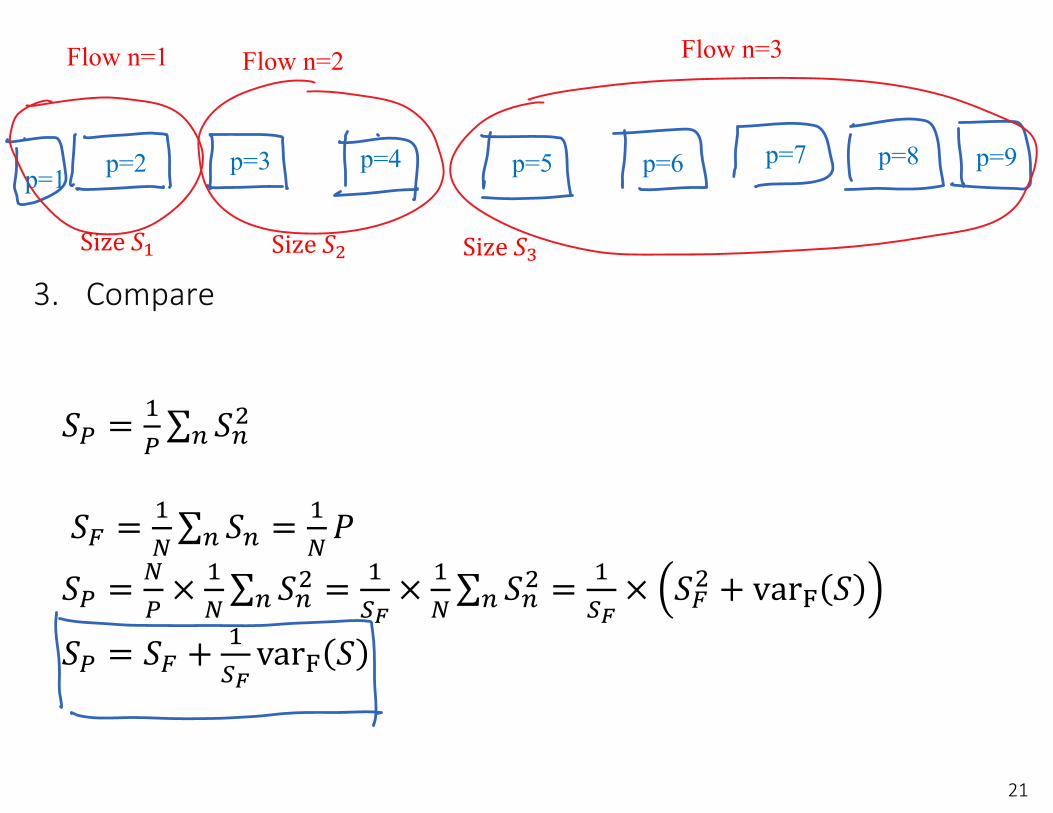
3. Compare
21
Flow n=1 Flow n=2 Flow n=3
p=1 p=2 p=3 p=4 p=5 p=6 p=7 p=8 p=9
Size 𝑆 Size 𝑆 Size 𝑆
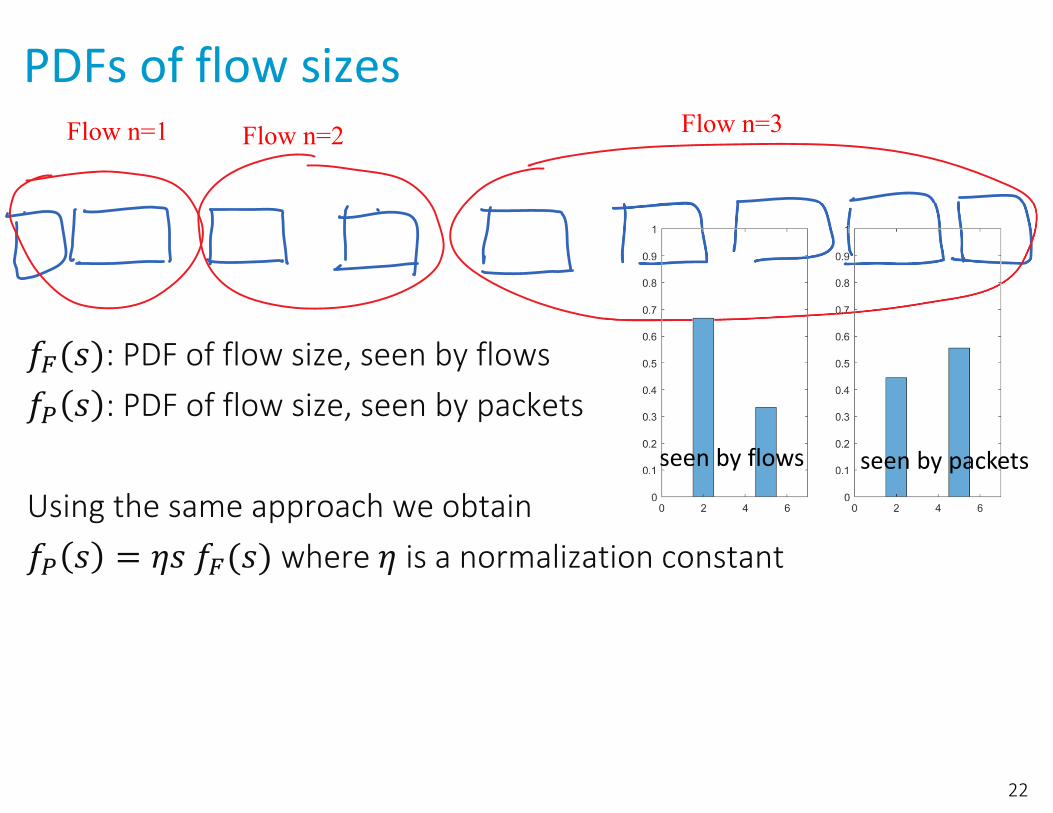
PDFs of flow sizes
: PDF of flow size, seen by flows: PDF of flow size, seen by packets
Using the same approach we obtainwhere is a normalization constant
22
Flow n=1 Flow n=2 Flow n=3
seen by flows seen by packets
AirBnB’s Paradox
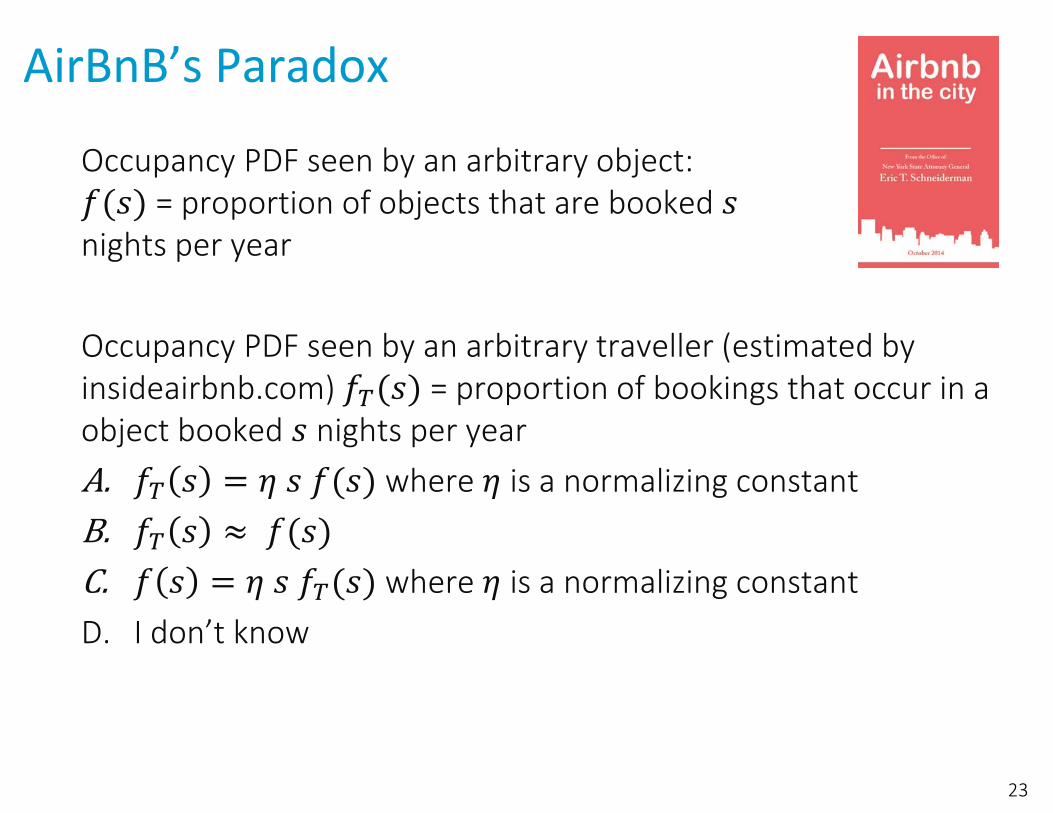
Occupancy PDF seen by an arbitrary object: = proportion of objects that are booked
nights per year
Occupancy PDF seen by an arbitrary traveller (estimated by insideairbnb.com) = proportion of bookings that occur in a object booked nights per year
where is a normalizing constant
where is a normalizing constantD. I don’t know
23

SolutionThis is the same case as with files (listings) and packets (bookings).
Therefore, with the same arguments
The median of the distribution with PDF is 40 days (reported by airbnb)The median of the distribution with PDF is 165 days (reported by insideairbnb.com)An arbitrary booking is more likely to fall in a listing that is often booked.
24
Object 1 Object 2 Object 3 Object 4
Take‐Home Message
How we sample data to compute a metric (the viewpoint) should be screened carefully.
Apparent paradoxes come from confusions in viewpoints.
Metrics may be misleading if sampling method is not appropriate.
Next we will see a formal theory (Palm Calculus) and its use in simulations.
25