parameter optimization in gmaw process with … · parameter optimization in gmaw process with...
TRANSCRIPT

PARAMETER OPTIMIZATION IN GMAW PROCESS WITH SOLID AND METAL-CORED WIRES
Edna Margarita Moncayo Torres, [email protected] Jorge Andrés Girón Cruz, [email protected] Jesus Emilio Pinto Lopera, [email protected] Sadek C. Absi Alfaro, [email protected] University of Brasília, Departament of Mechanical Engineering, Brasília, D.F., 70.910-900, Brazil.
Abstract. The balance among the input parameters in gas metal arc welding (GMAW) characterizes the metal transfer modes and influences the geometry, microstructure and mechanical properties of the welded joint. For this reason, the selection of input parameters values plays a very significant role in determining the quality of a welding process. This paper presents a methodology to find optimal input variables in GMAW processes with solid and metal-cored wires. The methodology uses images acquired with a high speed camera aiming to identify different metal transfer modes and work regions. Models of weld bead geometry were found using response surface methodology. Criterions for quality of joints were defined from responses surfaces and optimal input parameters were found.
Keywords: GMAW, optimal input variables, weld bead geometry, response surface methodology.
1. INTRODUCTION
Gas metal arc welding (GMAW) is increasingly employed for fabrication in many industries because of its great advantages over others techniques, like its versatility, since it can be applied to any welding position, and can be easily integrated into many robotic production lines. These advantages have motivated many researchers to study GMAW process in detail (Messler, 1999), otherwise all the important commercial metals such as carbon steel, stainless steel, aluminum, nickel alloys, among others, can be welded in any position with GMAW process by choosing appropriate shielding gas, electrode, and welding variables (Weglowskid et al., 2008). For this reason is very important the knowledge of optimal input parameters to generate weld beads with good appearance and quality.
One common approach to achieve the best welding parameters is to construct mathematical models to relate the process response to different input variables and its design is performed by using analytical or empirical approaches. Analytical approaches generally vary from simple models based on analysis of forces acting upon a drop of weld metal (Waszink and Graat, 1983) to highly complex models including high-level computer simulations (Xu et al., 2009). Due to the impossibility of modeling accurately the behavior of all variables involved in the process, analytical models are generally used with constraint parameters, and experimental procedures are an important step to validate parameter choices. Empirical models can be determined from statistical analysis of samples obtained from different experiments and is strictly based on the responses of processes minimizing the need of determining all parameters, the results are a good approximation of the process behavior.
This paper presents a methodology to find the optimal input parameters of GMAW welding based on criterions of quality analysis of the weld beads geometry. Were defined as input variables the voltage, wire feed rate and welding speed because their main influence on weld bead geometry maintaining the shielding gas and the wire diameter and composition of the electrode constant with a power source in constant voltage mode. A solid and a metal-cored wire were used as welding electrodes, them both with widely application in industry. The back-lighting technique has been used to film the metal transfer process using a laser beam and a high speed camera for delimitation of different metal transfer modes in each type of wire. It was used the response surface methodology (RSM) for each type of wire to obtain empirical models that shown a stable relation between input parameters and their quality.
2. GMAW PROCESS
GMAW-Gas Metal Arc Welding, also known as MIG/MAG (MIG - Metal Inert Gas and MAG - Metal Active Gas), is an electric arc welding that is shield from contaminants by the flow of an inert, active or mixed gas. This process uses a continuously-fed consumable wire metal electrode which is melted by the arc from the tip to the weld pool. The transfer mode of the metal determines the operating features of the process and depending on the welding conditions this transfer can take place in three principal modes: globular, spray, and short-circuiting.
Globular transfer is a free flight natural metal transfer mode, where the droplet diameter is larger than 1.25 times the wire diameter, and occurs at relatively low currents. Since it is often accompanied by extensive spatters, globular transfer is typically used in welding parts having relatively loose quality requirements and is limited to bead on plate positions. Spray transfer has a droplet diameter smaller than the smaller globular case (Iordachescu et al., 2006), it is a highly stable and efficient process and occurs at high currents, this mode is commonly used in weld plates limited to a thickness larger than 3 mm and bead on plate positions. In short-circuiting transfer mode the molten droplet on the wire
ABCM Symposium Series in Mechatronics - Vol. 6 Copyright © 2014 by ABCM
Part I - International Congress Section I - Modelling, Control & Identification
141

tip makes direct contact with the weld pool, characterized by repeated, intermittent arc extinguishment and re-ignition and can be used in any welding position. It is associated with low heat input and hence is commonly used in welding thin sheets (Messler, 1999).
2.1 Wire electrode
Solid and metal-cored wire electrodes are used in GMAW process, the former is often made of mild steel which can be coated with copper for prevent oxidation and improve electrical conductivity, this wire is the best choice when working on thin materials, such as sheet metal, they produce nice and clean welds but, do not work well in windy conditions. Similar in construction to flux-cored wire, metal-cored wires consist of thin carbon steel sheaths packed with iron powder with traces of deoxidizers and arc stabilizers. Metal-cored wires have some advantages over the solid ones such as higher deposition rates, greater deposition efficiencies (about 95%), minimum slag on weld bead surface, low spatter generation and reduction in the level of welding fumes generated (Lyttle, 1996).
In this work were used AWS A5.18 ER70S-6 and ASME/AWS SFA-5.9 EC410NiMo wire electrodes. ER70S-6 is a coppered low alloy steel solid wire formulated to provide high quality welds and trouble-free performance and can be used with various gas mixtures such as 100%CO2, Ar-25%CO2 or Ar-2%O2, in any welding position. It produces a smooth stable arc with low spatter, a weld bead that ties in evenly with the sides and has a smooth finished appearance. ER70S-6 is mainly for welding structures made by shipping steel and low alloy steel, such as ships, containers, vehicles, machineries, bridges, pipe fabrication and general fabrication. It is widely used in high-speed robotic and automatic welding applications and semi-automatic applications. EC410NiMo is a metal-cored wire designed for the fabrication and repair welding of hydro turbine components in 13%Cr-4%Ni alloyed soft martensitic steels. It is easy to operate in any welding position and offers very favorable arc characteristics, both with conventional or pulsed GMAW power sources. Unlike solid wires, a deep penetration and well wetted flat beads reduce fusion defects and slag inclusions, leading to reduced post weld grinding and repairs. It is often used with Ar-2%CO2 and Ar-4%CO2.
2.2 Weld bead geometry
In the field of welding, weld quality mainly depends on the mechanical properties of the weld metal and heat affected zone, which in turn, is influenced by metallurgical characteristics and chemical compositions of the weld. Moreover, these mechanical-metallurgical features depend on the weld bead geometry, which are directly related to welding process parameters (Esme et al. 2009), hence, study and control of weld bead shape is essential and relationships between the process parameters and the weld bead geometry characteristics are often established. Some important geometrical characteristics of the weld beads in study are shown in Fig. 1. In order to achieve online control, this work is focused on external characteristics; width, reinforcement and area of weld bead (cross section of surface).
Figure 1. Weld Bead Geometry Characteristics.
2.3 Modeling
RSM is used in this work to achieve second-order models of weld bead geometry. To perform the experiments for three independent input variables this methodology uses a central composite design (CCD) as shown in Fig. 2. CCD is based on two-level factorial design (8 experiments) augmented by additional center (6 experiments) and axial points (6 experiments). Based on experimental design, multiple linear regression technique is used to get second-order models, which can be written as Eq. (1), where y represents the response and x the input variable. The b terms are called regression coefficients and represent the parameters that determine the model.
(1)
ABCM Symposium Series in Mechatronics - Vol. 6 Copyright © 2014 by ABCM
Part I - International Congress Section I - Modelling, Control & Identification
142

Figure 2. Central composite design for three input variables.
Regression coefficients can be achieved by the relation of Eq. (2).
( ) (2)
, where is a column vector with ten positions, each one for a respective regression coefficient; y is the vector of experimental responses; the expression XT represents the transpose of the matrix X, which is the array for the coded variables in the experimental design for the regressor variables x1, x2, x3, x12, x22, x32, x1x2, x1x3, x2x3 (Lopera and Alfaro, 2011; Lopera et al., 2012). The coded variables (-1, 0, 1; for two-level factorial design) are necessary because the differences between units of variables measurement can influence the model responses. Input variables are encoded using the Eq. (3).
[ ( ) ( )] ⁄
[ ( ) ( )] ⁄(3)
, where indicates the coded variable and the real value of the input variable, j represents the input variable, ( ) and ( ) are the real values of factorial design (the corners of square). The initial model responses are given in terms of coded variables, so Eq. (3) is used to translate the answers to real values of the model (final model). The amount of reduction in the variability of models obtained by using the regressor variables in the model is named the adjusted coefficient of multiple determination ( ) and is defined in the Eq. (4).
( ) ∑ ( ̂ )
∑ ( ̅)
(4)
, where, ̅ is the sample mean of measurements, ̂ is the fitted value of the model, is the experimental response, n is the number of observations and k is the number of regressor variables.
3. METHODOLOGY
Figure 3 shows the sequence of the methodology to obtain the optimal parameters for weld beads geometrics characteristics.
Figure 3. Methodological diagram of the project.
3.1 Identification of GMAW process variables
Welding parameters are the variables that can be changed or modified in the process and can affect the characteristics of the electric arc and modify the shape of the weld deposited. Since measured responses depend on many parameters, in this work are taken in consideration the variables which direct action and interaction have a significant influence on the external geometry of the weld bead (with shielding gas and electrode constant). Then, voltage, wire feed rate and welding speed were established as input variables.
ABCM Symposium Series in Mechatronics - Vol. 6 Copyright © 2014 by ABCM
Part I - International Congress Section I - Modelling, Control & Identification
143

3.2 Experimental design
Models to define the geometric characteristics were defined from de input variables and the width, reinforcement and area of the weld beads, established as output variables and a central composite design was conducted in order to examine the behavior of the responses of variables in the experimental domain. The distance of the axial points to the center (α) was chosen for a rotatable design where α = (F) 1/4; F is the number of points of the factorial part (F=8), α= (8)1/4 =1.682, the range and level of the investigated factors are shown in the Tab. 1.
Table 1. Ranges and levels of the welding variables selected for the CCD.
Welding parameters Symbol Ranges and Levels
-1.682 -1 0 1 1.682 Wire feed rate (m/min) 4.8 5.5 6.5 7.5 8.2 Voltaje (V) 16.2 19 23 27 29.7 Welding speed (mm/s) 6.6 8 10 12 13.4
With the combination of the values of the variables listed in the Tab. 1 was realized the experiments matrix that is displayed in Tab. 2, wherein are indicated the selected experiments and the values for each variable.
Table 2. Values of the variables considered in the preparation of the matrix of experiments.
Experiment
1 5.5 19 8 2 7.5 19 8 3 5.5 27 8 4 7.5 27 8 5 5.5 19 12 6 7.5 19 12 7 5.5 27 12 8 7.5 27 12 9 4.8 23 10 10 8.2 23 10 11 6.5 16.3 10 12 6.5 29.7 10 13 6.5 23 6.6 14 6.5 23 13.4 15 6.5 23 10 16 6.5 23 10 17 6.5 23 10 18 6.5 23 10 19 6.5 23 10 20 6.5 23 10
3.3 Development of experiments
The materials used in the experimental procedure are:
Solid wire: AWS A5.18 ER70S-type 6 with a diameter of 1 mm. Metal-cored wire: 410NiMo MC, with a diameter of 1.2 mm Base material: steel AISI 1020. Distance from contact tube to the workpiece 16 mm Shielding gas: 96% Ar and 4% CO2 Shielding gas flow rate: 15 liters / min
With the aim to make comparisons between the metal-cored and solid wire, are made the same experiments as shown in Tab. 2 for each wire mentioned above and are obtained the geometric parameters, in this case, reinforcement , width , and the area of weld bead . For measurement the geometrical parameters is use a scanning system developed in the laboratory of welding, which consists of a line shape laser and a webcam. The device is run through
ABCM Symposium Series in Mechatronics - Vol. 6 Copyright © 2014 by ABCM
Part I - International Congress Section I - Modelling, Control & Identification
144

the weld bead and by use of digital image processing generates a 3D reconstruction of the weld. Measurements of reinforcement, width and area of weld bead are obtained as shown in the Fig. 4 and Fig. 5.
Figure 4. Reconstruction in 3D of the weld bead.
Using the scanning system is obtained two measures for each output variable, the first being the average measure, regardless the limits of the bead, and the second is a measure of the error with respect to the non-uniformity of the weld bead (standard deviation of measure).
Figure 5. Measurements of geometrical parameters.
3.4 Identification of transfer modes of GMAW process
To identify the metal transfer modes it was used the Back-lighting technique and a high-speed camera to obtain, in each experiment, the images of the metal transfer. The technique uses directional back-lighting illumination with a laser beam as light source that is expanded by a system of lenses and guided to the interesting objects of welding and to the camera, before reaching the camera lens, the laser beam passes through an optic band-pass interference filter (in laser band), then the arc light that not coincide with the filter band are rejected (Lopera et al., 2011). The images are obtained at a rate of 1000 frames per second, with a resolution of 120 x 100 pixels.
Figure 6, 7 and 8 present image sequences of the experiments. The images allow to identify the different transfer modes. Figure 6 shows the short-circuit transfer, the molten metal at the tip of the wire reaching the pool of fusion. Figure 7 shows the globular transfer, the drops of molten metal are very large and the movement towards the weld pool is mainly influence by the gravity. Figure 8 shows the spray transfer, the diameters of metal droplets are smaller than electrode diameter and are separated from the electrode tip by electromagnetic forces.
ABCM Symposium Series in Mechatronics - Vol. 6 Copyright © 2014 by ABCM
Part I - International Congress Section I - Modelling, Control & Identification
145

Figure 6. Short-circuit transfer mode.
Figure 7. Globular transfer mode.
Figure 8. Spray transfer mode.
3.5 Application of response surface methodology
The response surface methodology is developed from the Tab. 2 for all regressor variables. Then, models of each geometric characteristic (width, reinforcement and area of weld bead) and models of standard deviation for each characteristic are found. Optimal parameters adjusted to a certain wanted characteristic are found by the sequence shown in Fig. 9.
Figure 9. Sequence to obtain the optimal parameters.
All possible combination of input variables that satisfy a required or wanted output response (geometric characteristic) are calculated by the model of weld bead geometry, then, the combinations are used on the models of standard deviation for each characteristic, the optimal welding parameters are those that meet with the minimum value on the model.
4. RESULTS
The geometric parameters for the solid and the metal-cored wire, corresponding to the values of the input variables listed in Tab. 2, are shown in Tab. 3, where μ is the mean of the measurement of each geometric characteristic and is the measure of the error with respect to the non-uniformity of the weld bead. Figure 10 shows the work point in relation to welding voltage and current showing the metal transfer modes for each wire electrode. In red is represented the region of short-circuit transfer mode, in green the region of globular transfer mode and in blue the region of spray transfer mode, the figure illustrates the interactions among the regions, indicating the transitions between one transfer mode and another.
ABCM Symposium Series in Mechatronics - Vol. 6 Copyright © 2014 by ABCM
Part I - International Congress Section I - Modelling, Control & Identification
146

Table 3. Results of the experiments for solid and metal-cored wire.
Solid wire Metal-cored wire
No Exp
Reinforcement (mm) Width (mm) Area of weld
bead (mm2) Reinforcement
(mm) Width (mm) Area of weld bead (mm2)
Μ μ μ μ μ μ
1 2.09 0.09 5.98 0.21 9.74 0.46 3.56 0.18 4.98 0.30 13.83 1.00 2 2.56 0.08 6.78 0.23 13.25 0.56 4.04 0.25 5.55 0.65 17.62 1.61 3 1.62 0.10 7.62 0.61 9.76 0.84 2.63 0.14 7.79 0.54 16.04 1.48 4 2.22 0.11 8.83 0.55 14.90 1.02 3.08 0.09 8.77 0.50 20.33 1.26 5 1.76 0.08 5.01 0.28 6.89 0.41 2.74 0.11 4.82 0.25 10.46 0.60 6 2.08 0.13 5.39 0.39 8.46 0.70 3.11 0.16 5.39 0.42 13.08 1.04 7 1.40 0.14 5.77 0.73 6.72 0.97 2.32 0.13 6.10 0.48 11.32 1.03 8 1.89 0.13 6.70 0.45 9.28 0.61 2.67 0.11 7.00 0.40 14.69 0.97 9 1.57 0.12 5.67 0.58 7.21 0.74 2.31 0.12 6.20 0.48 11.52 1.07 10 2.21 0.12 7.21 0.49 11.65 0.78 3.20 0.11 7.58 0.22 18.22 0.81 11 2.07 0.34 4.94 0.93 7.94 2.32 3.52 0.17 4.65 0.60 13.11 1.28 12 1.71 0.10 7.69 0.42 9.93 0.62 2.71 0.14 7.73 0.56 15.89 1.54 13 2.31 0.09 8.63 0.47 14.59 0.78 3.17 0.13 8.39 0.49 20.36 1.39 14 1.60 0.09 5.49 0.50 6.88 0.65 2.44 0.11 6.07 0.35 11.77 0.74 15 1.82 0.10 6.57 0.65 8.95 0.73 2.76 0.17 6.20 0.46 13.36 1.29 16 1.76 0.12 6.78 0.874 9.05 1.09 2.78 0.17 6.23 0.47 13.48 1.24 17 1.74 0.09 6.51 0.708 8.71 0.76 2.72 0.15 6.22 0.48 13.23 1.31 18 1.88 0.10 6.79 0.810 9.82 0.94 2.78 0.18 6.27 0.54 13.58 1.42 19 1.80 0.09 6.78 0.708 8.71 0.76 2.79 0.17 6.31 0.50 13.68 1.31 20 1.76 0.10 6.55 0.810 9.82 0.94 2.73 0.17 6.17 0.49 13.18 1.31
( a ) ( b )
Figure 10. Transfer zones for each electrode; (a) solid wire, (b) metal-cored wire. Red represents the region of short-circuit transfer mode, green the globular transfer mode and blue the spray transfer mode.
Equation (5) and Eq. (6) present the models of the reinforcement for the solid wire with an adjusted coefficient of multiple determination percentage (
) of 94.88%, and for the metal-cored wire with a of 94.79%, respectively (in terms of coded variables 1-wire feed rate, 2-voltage and 3-welding speed).
(5)
(6)
Equation (7) and Eq. (8) presents the respective models of the error with respect to non-uniformity of the weld bead for solid wires and metal-cored.
Vol
tage
(V)
Vol
tage
(V)
Current (A) Current (A)
ABCM Symposium Series in Mechatronics - Vol. 6 Copyright © 2014 by ABCM
Part I - International Congress Section I - Modelling, Control & Identification
147

(7)
(8)
Since models are presented in terms of the coded values (-1.682, -1, 0, 1, 1.682), conversion to real values of models are performed by used of Eq. (3). Equation (9) represents how to use Eq. (3) in the models, where x1, x2 and x3 are the real values of input variables.
(9)
Figure 11 represents the response surfaces of the reinforcement in function of the wire feed rate (wire speed) and voltage for a constant value of welding speed (10 mm/s) the similar shape of surface is observed in relation to wire feed rate and voltage and in general the voltage tends to decrease the reinforcement and higher wire feed rate leads to obtaining higher values for reinforcement. All those trends are justifiable from the principles of behavior of arc welding processes.
( a ) ( b )
Figure 11. Response surfaces of the reinforcement; (a) solid wire, (b) metal-cored wire.
Equation (10) presents the models of the width for the solid wire with and Eq. (11) for metal-
cored wire with .
(10)
(11)
Equation (12) and Eq. (13) represent the models of the width error with respect to non-uniformity of the welding bead to the solid wires and metal-cored respectively.
(12)
(13)
Figure 12 shows the response surface of the width weld bead related to the wire speed and the voltage (constant welding speed, 10 mm/s), in this is observed that the width increases with the voltage and feed rate for the two types of wire.
ABCM Symposium Series in Mechatronics - Vol. 6 Copyright © 2014 by ABCM
Part I - International Congress Section I - Modelling, Control & Identification
148

( a ) ( b )
Figure 12. Response surface of the width; (a) solid wire, (b) metal-cored wire.
Equation (14) is presented the model of the area of weld bead for the solid wire with and the Eq.
(15) for metal-cored wire with .
(14)
(15)
Equation (16) and Eq. (17) represents the models of the area of weld bead error with respect to non-uniformity of the welding bead to solid wires and the metal-cored respectively.
(16)
(17)
Figure 13 shows the response surface of the area of weld bead vs. the wire speed and the voltage (welding speed, 10 mm/s), here the area of weld bead increases with the increment of voltage and wire feed rate, this describes the relationship between the behavior of the bead reinforcement and width.
( a ) ( b )
Figure 13. Response surface of the area of weld bead; (a) solid wire, (b) metal-cored wire.
ABCM Symposium Series in Mechatronics - Vol. 6 Copyright © 2014 by ABCM
Part I - International Congress Section I - Modelling, Control & Identification
149

As example, Fig. 14 shows the possible combinations of the three input variables, to obtain a width of 6 mm with solid wire.
Figure 14. Set of combinations of the input variables for a width of 6 mm with solid wire.
Figure 15 shows the possible combinations of input variables to obtain reinforcement of 3 mm with tubular wire.
Figure 15. Set of combinations of the input variables for a reinforcement of 3 mm with tubular wire.
Once obtained these combinations they are evaluated in the model of error with respect to non-uniformity. Since it seeks to find the optimal parameter to generate a weld bead with good appearance and quality, it is chosen the combination that has the smallest error. Table 4 and Tab 5 show some optimal parameters for a particular characteristic.
Table 4. Optimal parameters for particulars width.
Width (mm)
Solid wire Metal-cored wire
Voltage (V)
Wire speed
(m/min)
Weld speed
(mm/s)
Voltage (V)
Wire speed
(m/min)
Weld speed
(mm/s) 5 19.77 8.5 14 18.03 4.5 12.31
5.5 18.02 4.5 6.88 18 4.5 13.78 6 26.67 8.5 14 18.94 4.5 6.5
6.5 28.74 8.5 13.18 20.09 4.5 6.5 7 28.91 8.5 12.2 20.41 8.46 14
7.5 18..26 8.5 6.5 24.40 8.5 14
ABCM Symposium Series in Mechatronics - Vol. 6 Copyright © 2014 by ABCM
Part I - International Congress Section I - Modelling, Control & Identification
150
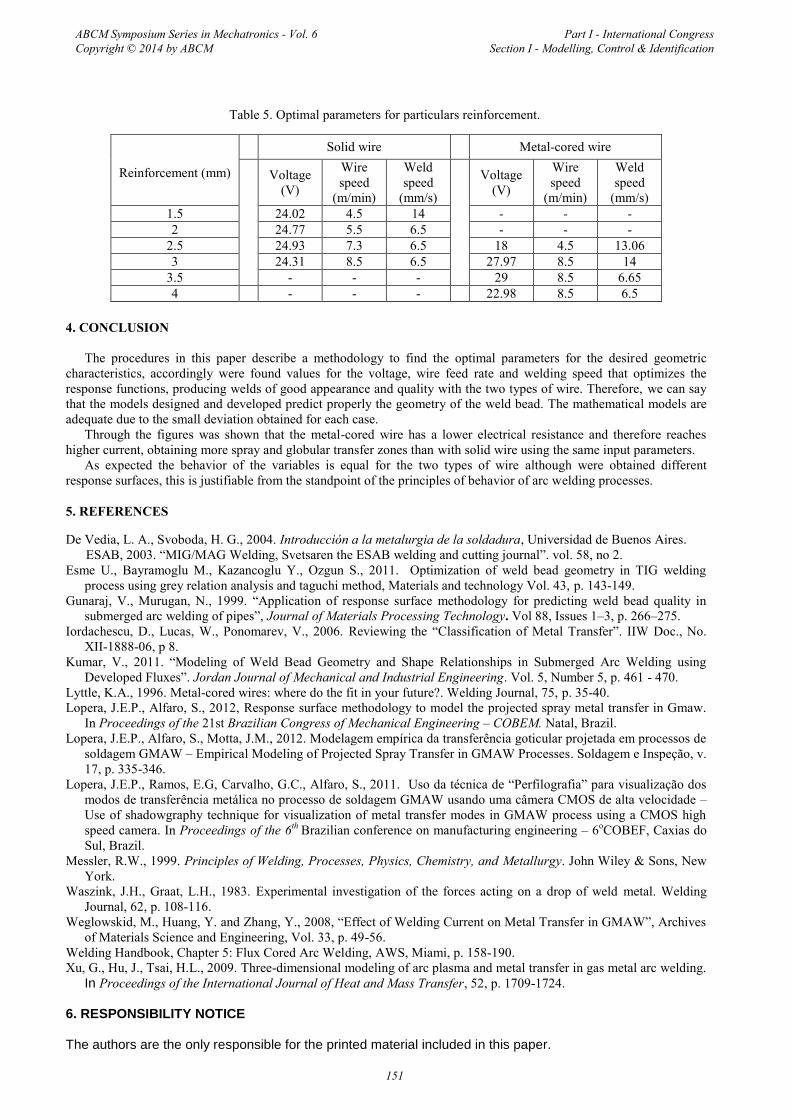
Table 5. Optimal parameters for particulars reinforcement.
Reinforcement (mm)
Solid wire Metal-cored wire
Voltage (V)
Wire speed
(m/min)
Weld speed
(mm/s)
Voltage (V)
Wire speed
(m/min)
Weld speed
(mm/s) 1.5 24.02 4.5 14 - - - 2 24.77 5.5 6.5 - - -
2.5 24.93 7.3 6.5 18 4.5 13.06 3 24.31 8.5 6.5 27.97 8.5 14
3.5 - - - 29 8.5 6.65 4 - - - 22.98 8.5 6.5
4. CONCLUSION
The procedures in this paper describe a methodology to find the optimal parameters for the desired geometric characteristics, accordingly were found values for the voltage, wire feed rate and welding speed that optimizes the response functions, producing welds of good appearance and quality with the two types of wire. Therefore, we can say that the models designed and developed predict properly the geometry of the weld bead. The mathematical models are adequate due to the small deviation obtained for each case.
Through the figures was shown that the metal-cored wire has a lower electrical resistance and therefore reaches higher current, obtaining more spray and globular transfer zones than with solid wire using the same input parameters.
As expected the behavior of the variables is equal for the two types of wire although were obtained different response surfaces, this is justifiable from the standpoint of the principles of behavior of arc welding processes.
5. REFERENCES
De Vedia, L. A., Svoboda, H. G., 2004. Introducción a la metalurgia de la soldadura, Universidad de Buenos Aires. ESAB, 2003. “MIG/MAG Welding, Svetsaren the ESAB welding and cutting journal”. vol. 58, no 2. Esme U., Bayramoglu M., Kazancoglu Y., Ozgun S., 2011. Optimization of weld bead geometry in TIG welding
process using grey relation analysis and taguchi method, Materials and technology Vol. 43, p. 143-149. Gunaraj, V., Murugan, N., 1999. “Application of response surface methodology for predicting weld bead quality in
submerged arc welding of pipes”, Journal of Materials Processing Technology. Vol 88, Issues 1–3, p. 266–275. Iordachescu, D., Lucas, W., Ponomarev, V., 2006. Reviewing the “Classification of Metal Transfer”. IIW Doc., No.
XII-1888-06, p 8. Kumar, V., 2011. “Modeling of Weld Bead Geometry and Shape Relationships in Submerged Arc Welding using
Developed Fluxes”. Jordan Journal of Mechanical and Industrial Engineering. Vol. 5, Number 5, p. 461 - 470. Lyttle, K.A., 1996. Metal-cored wires: where do the fit in your future?. Welding Journal, 75, p. 35-40. Lopera, J.E.P., Alfaro, S., 2012, Response surface methodology to model the projected spray metal transfer in Gmaw.
In Proceedings of the 21st Brazilian Congress of Mechanical Engineering – COBEM. Natal, Brazil. Lopera, J.E.P., Alfaro, S., Motta, J.M., 2012. Modelagem empírica da transferência goticular projetada em processos de
soldagem GMAW – Empirical Modeling of Projected Spray Transfer in GMAW Processes. Soldagem e Inspeção, v. 17, p. 335-346.
Lopera, J.E.P., Ramos, E.G, Carvalho, G.C., Alfaro, S., 2011. Uso da técnica de “Perfilografia” para visualização dos modos de transferência metálica no processo de soldagem GMAW usando uma câmera CMOS de alta velocidade – Use of shadowgraphy technique for visualization of metal transfer modes in GMAW process using a CMOS high speed camera. In Proceedings of the 6th
Brazilian conference on manufacturing engineering – 6oCOBEF, Caxias do Sul, Brazil.
Messler, R.W., 1999. Principles of Welding, Processes, Physics, Chemistry, and Metallurgy. John Wiley & Sons, New York.
Waszink, J.H., Graat, L.H., 1983. Experimental investigation of the forces acting on a drop of weld metal. Welding Journal, 62, p. 108-116.
Weglowskid, M., Huang, Y. and Zhang, Y., 2008, “Effect of Welding Current on Metal Transfer in GMAW”, Archives of Materials Science and Engineering, Vol. 33, p. 49-56.
Welding Handbook, Chapter 5: Flux Cored Arc Welding, AWS, Miami, p. 158-190. Xu, G., Hu, J., Tsai, H.L., 2009. Three-dimensional modeling of arc plasma and metal transfer in gas metal arc welding.
In Proceedings of the International Journal of Heat and Mass Transfer, 52, p. 1709-1724.
6. RESPONSIBILITY NOTICE
The authors are the only responsible for the printed material included in this paper.
ABCM Symposium Series in Mechatronics - Vol. 6 Copyright © 2014 by ABCM
Part I - International Congress Section I - Modelling, Control & Identification
151