paramyxoviruses infection mimics in vivo in3d human broncho
TRANSCRIPT
NASA/TP–2012-217363
Paramyxovirus Infection Mimics In Vivo Cellular
Dynamics in Three-Dimensional Human
Bronchio-Epithelial Tissue-Like Assemblies
Anne M. Deatly2
Yen-Huei Lin2
Maureen McCarthy1
Wei Chen2
Lynn Z. Miller2
Jorge Quiroz3
Becky M. Nowak2
Robert A. Lerch2
Stephen A. Udem2
Thomas J. Goodwin1*
1 Disease Modeling and Tissue Analogues Laboratory, NASA Johnson Space Center,
Houston, Texas 77058 2
Vaccines Discovery, Wyeth Research, Pearl River, New York 10965 3
Biometrics Research, Wyeth Research, Pearl River, New York 10965
*Correspondence should be addressed to: Disease Modeling and Tissue Analogues Laboratory,
NASA Johnson Space Center, Houston Texas, 77058
August 2012

THE NASA STI PROGRAM OFFICE . . . IN PROFILE Since its founding, NASA has been dedicated to
the advancement of aeronautics and space
science. The NASA Scientific and Technical
Information (STI) Program Office plays a key
part in helping NASA maintain this important
role.
The NASA STI Program Office is operated by
Langley Research Center, the lead center for
NASA’s scientific and technical information.
The NASA STI Program Office provides access
to the NASA STI Database, the largest
collection of aeronautical and space science STI
in the world. The Program Office is also
NASA’s institutional mechanism for
disseminating the results of its research and
development activities. These results are
published by NASA in the NASA STI Report
Series, which includes the following report
types:
• TECHNICAL PUBLICATION. Reports of
completed research or a major significant
phase of research that present the results of
NASA programs and include extensive data
or theoretical analysis. Includes
compilations of significant scientific and
technical data and information deemed to be
of continuing reference value. NASA’s
counterpart of peer-reviewed formal
professional papers but has less stringent
limitations on manuscript length and extent
of graphic presentations.
• TECHNICAL MEMORANDUM. Scientific
and technical findings that are preliminary
or of specialized interest, e.g., quick release
reports, working papers, and bibliographies
that contain minimal annotation. Does not
contain extensive analysis.
• CONTRACTOR REPORT. Scientific and
technical findings by NASA-sponsored
contractors and grantees.
• CONFERENCE PUBLICATION. Collected
papers from scientific and technical
conferences, symposia, seminars, or other
meetings sponsored or cosponsored by
NASA.
• SPECIAL PUBLICATION. Scientific,
technical, or historical information from
NASA programs, projects, and mission,
often concerned with subjects having
substantial public interest.
• TECHNICAL TRANSLATION. English-
language translations of foreign scientific
and technical material pertinent to NASA’s
mission.
Specialized services that complement the STI
Program Office’s diverse offerings include
creating custom thesauri, building customized
databases, organizing and publishing research
results . . . even providing videos.
For more information about the NASA STI
Program Office, see the following:
• Access the NASA STI Program Home Page
at http://www.sti.nasa.gov
• E-mail your question via the internet to
• Fax your question to the NASA Access Help
Desk at (301) 621-0134
• Telephone the NASA Access Help Desk at
(301) 621-0390
• Write to:
NASA Access Help Desk
NASA Center for AeroSpace Information
7115 Standard
Hanover, MD 21076-1320

NASA/TP–2012-217363
Paramyxovirus Infection Mimics In Vivo Cellular
Dynamics in Three-Dimensional Human
Bronchio-Epithelial Tissue-Like Assemblies
Anne M. Deatly2
Yen-Huei Lin2
Maureen McCarthy1
Wei Chen2
Lynn Z. Miller2
Jorge Quiroz3
Becky M. Nowak2
Robert A. Lerch2
Stephen A. Udem2
Thomas J. Goodwin1*
1 Disease Modeling and Tissue Analogues Laboratory, NASA Johnson Space Center,
Houston, Texas 77058 2
Vaccines Discovery, Wyeth Research, Pearl River, New York 10965 3
Biometrics Research, Wyeth Research, Pearl River, New York 10965
*Correspondence should be addressed to: Disease Modeling and Tissue Analogues Laboratory,
NASA Johnson Space Center, Houston Texas, 77058
August 2012

Available from:
NASA Center for AeroSpace Information National Technical Information Service
7115 Standard Drive 5285 Port Royal Road
Hanover, MD 21076-1320 Springfield, VA 22161
301-621-0390 703-605-6000
This report is also available in electronic form at http://ston.jsc.nasa.gov/collections/TRS/

i
Acronyms
ANOVA analysis of variance
bPIV3 SF Bovine PIV3 Shipping Fever
cp cold passage
ds double-stranded
EMA epithelial membrane antigen
FDR false discovery rate
HBE human bronchio-epithelial
HBTC human bronchi and trachea
hr host-range
HRE human respiratory epithelium
MAP2 microtubule associated protein 2
MIP-1α Macrophage Inhibitory Factor 1-α
MOI multiplicity of infection
pi post infection
PVA polyvinyl alcohol
PIV3 parainfluenza virus type 3
RANTES Regulated upon Activation, Normal T cell-Expressed and -Secreted
RE restriction enzyme
RSV respiratory syncytial virus
RWV rotating wall vessel
3D three-dimensional
2D two-dimensional
ts temperature sensitive
TLA tissue-like assembly
UV ultraviolet
wt wild type
ii
Table of Contents
Abstract ........................................................................................................................................................ 1
1.0 Results ................................................................................................................................................... 3
Characterization of 3D HBE TLAs .......................................................................................................... 3
Expression of HRE-specific markers ........................................................................................................ 5
Gene expression in BEAS-2B monolayers and 3D HBE TLAs ................................................................... 7
wtRSV and wtPIV3 replicate more efficiently than mutants in TLAs ...................................................... 8
Innate immune response to RSV and PIV3 infection .............................................................................. 9
TLAs predict in vivo inflammatory responses ..................................................................................... 10
2.0 Discussion ............................................................................................................................................ 14
3.0 Methods ............................................................................................................................................... 19
Cells ....................................................................................................................................................... 19
3D TLA cultures ..................................................................................................................................... 19
Viruses .................................................................................................................................................. 19
Scanning Electron Microscopy of 3D HBE TLAs .................................................................................... 20
Transmission Electron Microscopy of 3D HBE TLAs .............................................................................. 20
Expression of epithelial markers by confocal microscopy .................................................................... 21
Expression of epithelial markers by immunohistochemistry ................................................................ 22
Host transcriptional profiling data analysis ......................................................................................... 22
In vitro virus inoculation and titration ................................................................................................ 24
Human nasal wash samples ................................................................................................................ 24
Quantifying cytokines .......................................................................................................................... 25
4.0 Supplementary Methods .................................................................................................................... 26
Construction of rbPIV3 Shipping Fever ............................................................................................... 26
5.0 Acknowledgments ................................................................................................................................ 28
6.0 References ............................................................................................................................................ 29

1
Abstract
Respiratory syncytial virus (RSV) and parainfluenza virus cause severe respiratory
disease, especially in infants, children, and the elderly. An in vitro model that accurately
mimics infection of the human respiratory epithelium (HRE) would facilitate vaccine
development greatly. Monolayer cultures traditionally used to study these viruses do not
accurately and precisely differentiate the replication efficiencies of wild type and attenuated
viruses. Therefore, we engineered novel three-dimensional (3D) tissue-like assemblies (TLAs)
of human bronchio-epithelial (HBE) cells to produce a more physiologically relevant in vitro
model of the HRE. TLAs resemble HRE structurally and by expression of differentiated
epithelial cell markers. Most significantly, wild type viruses exhibited a clear growth advantage
over attenuated strains in TLAs unlike monolayer cultures. In addition, the TLAs responded to
virus infection by secreting pro-inflammatory mediators similar to the respiratory epithelia of
infected children. These characteristics make the TLA model a valuable platform technology to
develop and evaluate live, attenuated respiratory virus vaccine candidates for human use.
Respiratory virus diseases, the most frequent and least preventable of all infectious
diseases, range in severity from the common cold to severe bronchiolitis and pneumonia.[1, 2]
Two paramyxoviruses, RSV and parainfluenza virus type 3 (PIV3), are responsible for a
majority of the most severe respiratory diseases of infants and young children.[3] RSV causes
70% of all bronchiolitis cases[4] and is a major cause of morbidity and mortality worldwide,
especially in infants.[5] PIV3 causes 10% -15% of bronchiolitis and pneumonia during infancy,
second only to RSV,[6] and 40% of croup in infants.[7]
To date, licensed vaccines are not available to prevent these respiratory diseases. At
present, traditional monkey kidney (Vero and LLC-MK2) and human (HEp-2) tissue culture cells
and small animal models (mouse, cotton rat, guinea pig, ferret, and hamster) fail to accurately
imitate viral replication and human disease states.[8] Lacking an authentic model has
impeded the development and evaluation of live, attenuated vaccine candidates.
Development of a physiologically relevant in vitro tissue culture model that reproduces
characteristics of the HRE, the primary target of RSV and PIV3, would aid in predicting clinical
attenuation and safety of vaccine candidates. Successful tissue engineering of a 3D human
intestinal model using novel NASA technology[9] inspired the development of a tri-culture 3D
model for the HRE. Sequential layering of primary mesenchymal cells (comprised of normal
human fibroblasts and endothelial cells) followed by BEAS-2B epithelial cells derived from
2
human bronchi and tracheae were recapitulated on Cultisphere and/or cytodex3 microcarriers in
cylindrical vessels that rotate horizontally, creating an organized epithelial structure. Horizontal
rotation randomizes the gravity vector modeling aspects of microgravity.[9,10] Mesenchymal and
epithelial cells grown under these conditions reproduce the structural organization, multicellular
complexity, and differentiation state of the HRE (Goodwin et al, NASA/TP 2008-214771).
The opportunity to study respiratory viruses in a nasal epithelium model is invaluable
because the most promising respiratory virus vaccine candidates are live attenuated viruses for
intranasal administration. Here we characterize the interactions of respiratory viruses and
epithelial cells grown under modeled microgravity in comparison to gravity-ladened monolayers.
3D HBE TLAs and traditional monolayers (two-dimensional [2D]) are infected at 35°C, the upper
temperature of the upper HRE,[11] to simulate in vivo infection conditions. Growth kinetics of wild
type (wt) RSV and PIV3 viruses were compared in 2D and 3D cells to that of strains attenuated
in humans[12-14] or rhesus macaques.[15]
This novel 3D HBE model also offers an opportunity to study whether the epithelial cell
function, especially in host defense, is recapitulated by mimicking the structural organization of
the HRE. In vivo, airway epithelial cells play a significant and dynamic role in host defense[16] by
blocking paracellular permeability and modulating airway function through cellular interactions
or tight junctions. As regulators of the innate immune response, epithelial cells constitutively
express cytokines, chemokines, and colony-stimulating factors including RANTES, IL-8, IL-6,
GM-CSF, and G-CSF for proactive host defense.[17] In response to viral infection, epithelial cells
induce potent immuno-modulatory and pro-inflammatory cytokines that recruit phagocytic and
inflammatory cells to clear the virus and enhance protection.
Although disease pathogenesis is classically attributed to the cytopathic effects of the
pathogen, severe disease states associated with RSV and PIV3 are attributed to the
inflammatory response, especially in infants. RSV is a potent inducer of cytokines and pro-
inflammatory mediators in epithelial cells in vivo.[18] A differentiated human epithelial model
independent of the complete functional immune system will help elucidate the role of epithelial
cells in respiratory disease.
We reported here, virus and host cell interactions in 3D HBE TLAs are similar to those in
vivo. Because the epithelial cell organization[19] of the TLAs impacts not only the expression of
airway epithelial characteristics, but also cellular communication, the TLAs represent a more
physiologically relevant model of the HRE than BEAS-2B or other non-tumour monolayer
3
models of respiratory disease. As a result, wild type respiratory viruses have a clear growth
advantage over attenuated viruses in TLAs unlike traditional monolayers. In addition, the TLAs
respond to wild type virus infection by secreting pro-inflammatory mediators characteristic of
infected HRE. TLAs expressing microbial defense mechanisms provide an excellent model to
study the interactions of respiratory pathogens with their host and to identify the innate immunity
mediators. Therefore, 3D HBE TLAs offer advantages for the study of respiratory viruses and
the development of viral vaccine candidates.
1.0 Results
Characterization of 3D HBE TLAs
The HBE-TLA is a multilayered tissue primarily comprised of pseudo-stratified epithelial
cells, a basement membrane, and underlying mesenchymal cells.[16] Ciliated, secretory, and
basal epithelial cells are joined by intercellular junctions and anchored to the basement
membrane via desmosomal interactions. Through tight junctions and the mucociliary layer, the
basement membrane maintains polarity of the epithelium and presents a physical barrier
between the mesenchymal layer and the airway.[20,21]
To mimic the structural organization of the HRE, primary mesenchymal cells derived
from human bronchi and tracheae (HBTC) form the initial layers of the TLAs on cytodex or
Cultisphere microcarriers. Four to 6 days later, immortalized human epithelial BEAS-2B cells
are layered on top. HBE TLAs develop in rotating wall vessels, a modeled microgravity
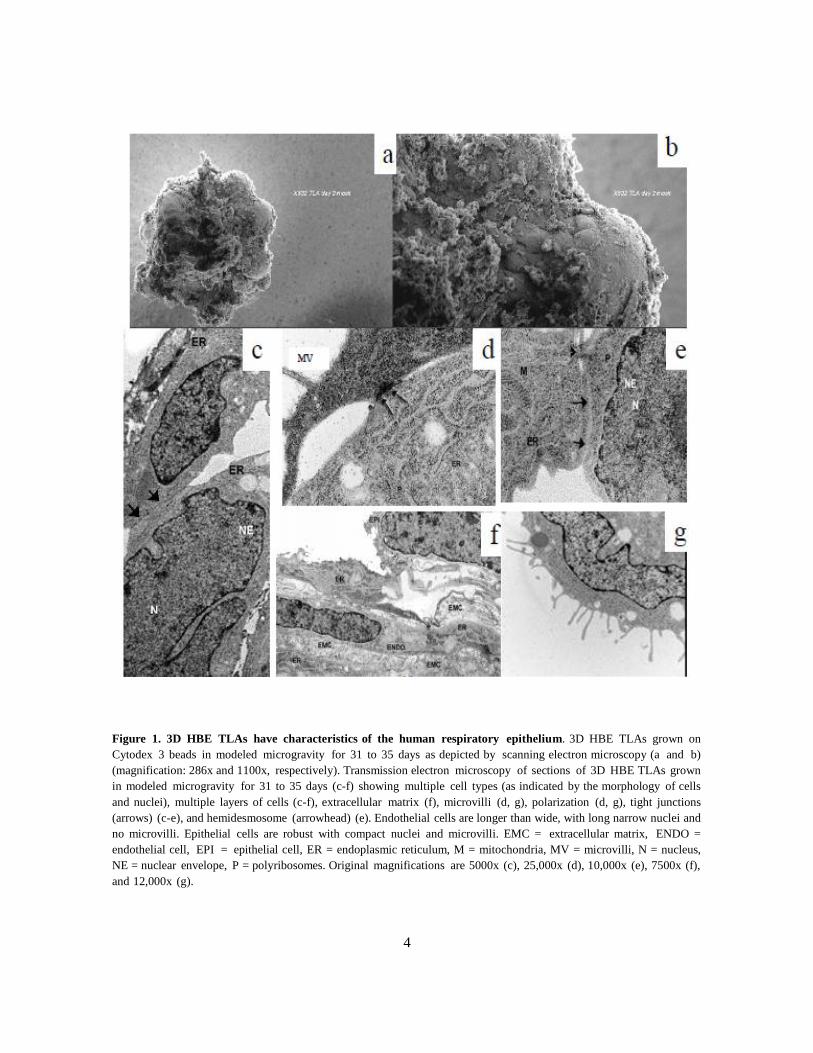
environment (Fig. 1a–b). HBE TLAs share many of the structural and morphological
characteristics of the HRE including multiple layers (Fig. 1c-f) of different cell types as indicated
by different shapes of cells and nuclei (Fig. 1c-f) and tight junctions (Fig. 1c-e). Microvilli (Fig.
1d and g) are also evident on the apical side. Exposure to air may be required for cilia
development. Extracellular matrix simulating the basement membrane is also present (Fig. 1f).
4
Figure 1. 3D HBE TLAs have characteristics of the human respiratory epithelium. 3D HBE TLAs grown on
Cytodex 3 beads in modeled microgravity for 31 to 35 days as depicted by scanning electron microscopy (a and b)
(magnification: 286x and 1100x, respectively). Transmission electron microscopy of sections of 3D HBE TLAs grown
in modeled microgravity for 31 to 35 days (c-f) showing multiple cell types (as indicated by the morphology of cells
and nuclei), multiple layers of cells (c-f), extracellular matrix (f), microvilli (d, g), polarization (d, g), tight junctions
(arrows) (c-e), and hemidesmosome (arrowhead) (e). Endothelial cells are longer than wide, with long narrow nuclei and
no microvilli. Epithelial cells are robust with compact nuclei and microvilli. EMC = extracellular matrix, ENDO =
endothelial cell, EPI = epithelial cell, ER = endoplasmic reticulum, M = mitochondria, MV = microvilli, N = nucleus,
NE = nuclear envelope, P = polyribosomes. Original magnifications are 5000x (c), 25,000x (d), 10,000x (e), 7500x (f),
and 12,000x (g).

5
Expression of HRE-specific markers
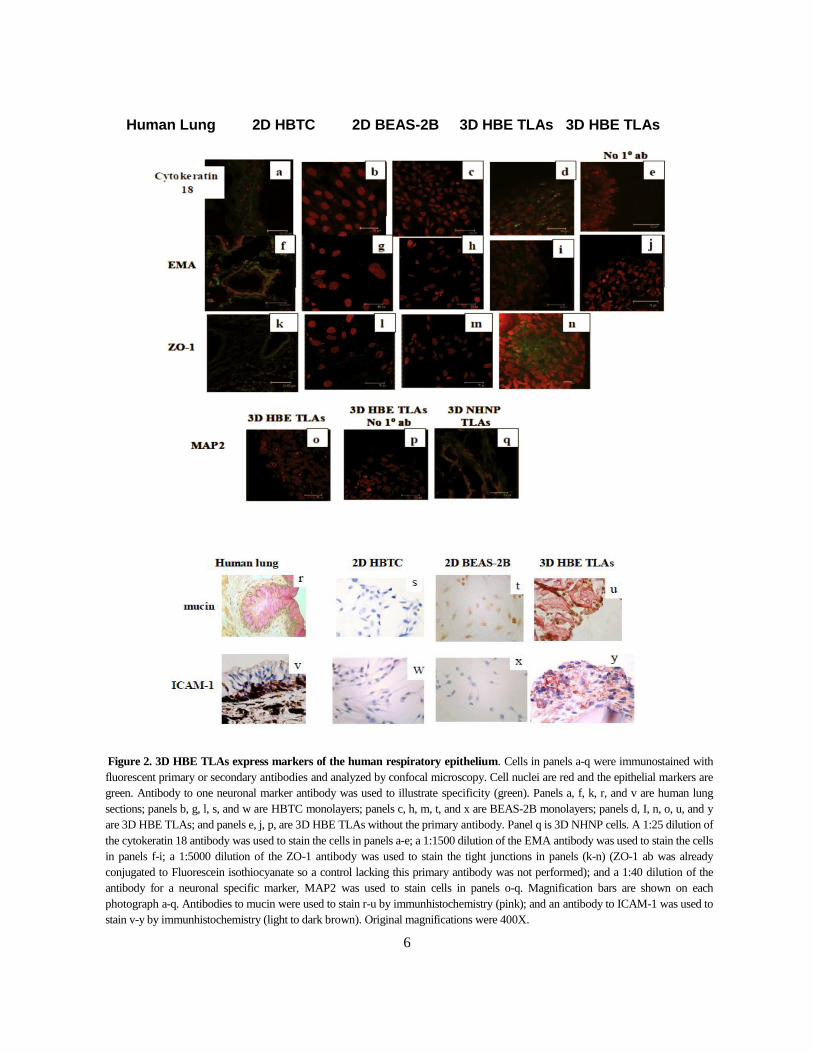
Fixed TLAs, HBTC monolayers, BEAS-2B monolayers, and normal human lung were
immunostained for epithelial-specific cell markers to evaluate the cellular composition and
differentiation state (Fig. 2). The markers were selected to highlight epithelial characteristics
including tight junctions (ZO-1), and polarization (epithelial membrane antigen [EMA]).
Expression of ICAM-1 and cytokeratin 18 highlight a differentiated state. Expression of mucin
glycoprotein indicates the potential to produce mucus. As illustrated, expression levels of
epithelial markers in TLAs are very similar to the levels in normal human lung than in 2D BEAS-
2B and HBTC cells. Note that the staining of ZO-1 is concentrated at cell junctions in 3D HBE
TLAs as in the human lung. There may be low expression of ZO-1 in HBTC monolayers, but the
staining is more diffuse. A neuronal-specific marker, microtubule associated protein 2 (MAP2),
is not expressed in 3D HBE TLAs but is expressed in 3D normal human neural progenitor cells.
6
Human Lung 2D HBTC 2D BEAS-2B 3D HBE TLAs 3D HBE TLAs
Figure 2. 3D HBE TLAs express markers of the human respiratory epithelium. Cells in panels a-q were immunostained with
fluorescent primary or secondary antibodies and analyzed by confocal microscopy. Cell nuclei are red and the epithelial markers are
green. Antibody to one neuronal marker antibody was used to illustrate specificity (green). Panels a, f, k, r, and v are human lung
sections; panels b, g, l, s, and w are HBTC monolayers; panels c, h, m, t, and x are BEAS-2B monolayers; panels d, I, n, o, u, and y
are 3D HBE TLAs; and panels e, j, p, are 3D HBE TLAs without the primary antibody. Panel q is 3D NHNP cells. A 1:25 dilution of
the cytokeratin 18 antibody was used to stain the cells in panels a-e; a 1:1500 dilution of the EMA antibody was used to stain the cells
in panels f-i; a 1:5000 dilution of the ZO-1 antibody was used to stain the tight junctions in panels (k-n) (ZO-1 ab was already
conjugated to Fluorescein isothiocyanate so a control lacking this primary antibody was not performed); and a 1:40 dilution of the
antibody for a neuronal specific marker, MAP2 was used to stain cells in panels o-q. Magnification bars are shown on each
photograph a-q. Antibodies to mucin were used to stain r-u by immunhistochemistry (pink); and an antibody to ICAM-1 was used to
stain v-y by immunhistochemistry (light to dark brown). Original magnifications were 400X.

7
Gene expression in BEAS-2B monolayers and 3D HBE TLAs
Cellular differentiation involves complex cellular interactions.[22] Not only do cell
membrane junctions, extracellular matrices, and soluble autocrine and paracrine factors [23-26]
play a significant role in tissue development, but also the spatial orientation and spatial
relationships of the layered cells. The fact that each HBE cell has three membrane surfaces, a
free apical surface, a lateral surface, and a basal surface[19] that interacts with mesenchymal
cells enhances differentiation and cell-to-cell communication in epithelial cells grown in
modeled microgravity compared to traditional monolayers. An important role of the HRE is to
produce an innate immune response to pathogens in the airway. Transcriptional profiling results
(Fig. 3) also indicate a higher number of genes involved in immune response, immunological
and inflammatory diseases are upregulated in uninfected 3D HBE TLAs as compared to BEAS-
2B monolayers. Most importantly, the profile of cytokines secreted from uninfected TLAs (Fig.
9a) parallel the profile detected in human airways as described elsewhere.[17]
Figure 3. Higher levels of cell development, cell signaling, and cell growth as well as immune response are expressed
in 3D HBE TLAs compared to BEAS-2B monolayers.

8
wtRSV and wtPIV3 replicate more efficiently than mutants in TLAs
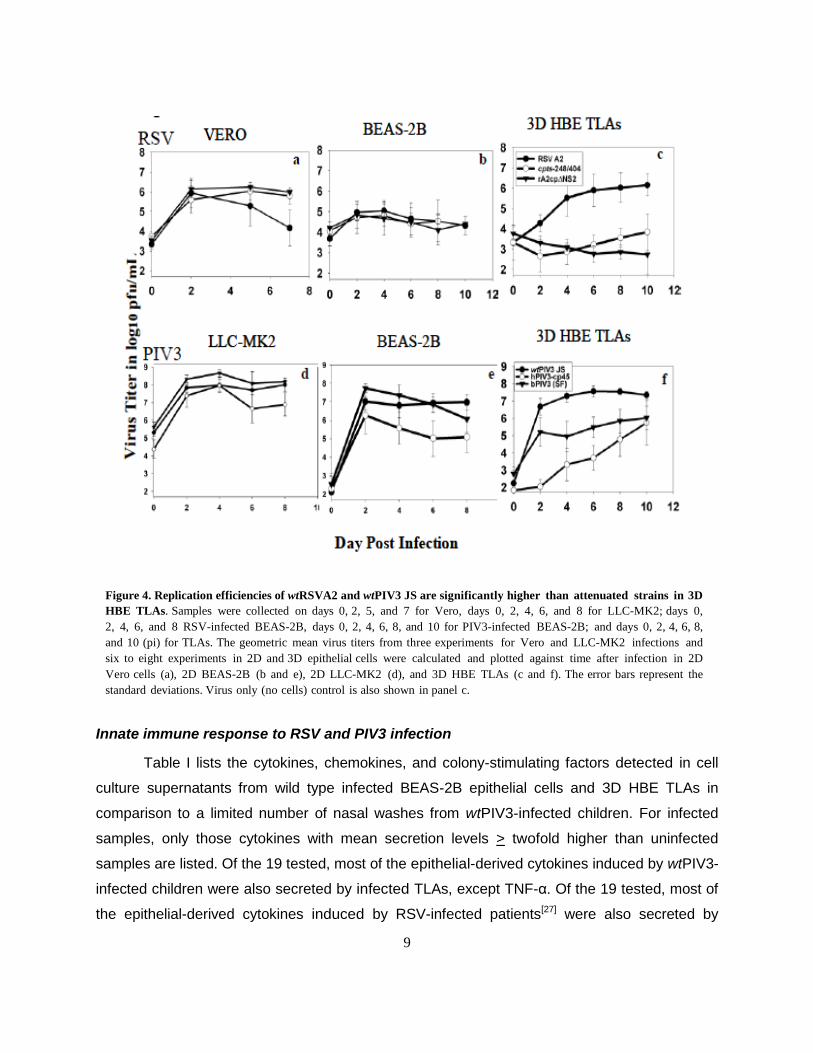
To compare the replication efficiencies of different RSV and PIV3 strains grown in
different culture conditions, monolayers and TLAs were infected at 35°C—the upper
temperature of the upper HRE. Culture samples were collected on different times post infection
(pi) to quantify the virus. Peak replication of wtRSVA2 and attenuated strains cpts248/404 and
rA2cpΔNS2, were similar in Vero and BEAS-2B epithelial cell monolayers (Fig. 4a and b). The 2
log10 pfu/mL reduction in titer of wtRSVA2 from day 2 to 7 in Vero cells (Fig. 4a) resulted from
destruction of the monolayer. In contrast in HBE TLAs, attenuated strains, cpts248/404 and
rA2cpΔNS2 replicated to a peak titer of 3-4 log10 pfu/mL, significantly lower than the peak titer
of 6 log10 pfu/mL of wtRSVA2 (Fig. 4c). Hence, a significant difference in replication of wtRSV
and attenuated viruses was clearly differentiated in TLA cultures as in vivo.[12, 14] The fact that
innate immunity pathways are more highly expressed in HBE TLAs than monolayers (Fig. 3)
may play a role in attenuation. wtPIV3 (JS), Bovine PIV3 Shipping Fever virus (bPIV3 SF), and
PIV3-cp45 each replicated to > 8 log10 pfu/mL by day 4 pi in 2D monkey kidney LLC-MK2 cells.
Lower replication efficiency observed for PIV3-cp45 only on day 6 and 8. Host restriction of
bPIV3 SF, however, was not observed in LLC-MK2 cells (Fig. 4d). In epithelial BEAS-2B
monolayers, PIV3-cp45 replicated 1.5 to 2 log10 pfu/mL lower than wtPIV3 JS from day 4 to 8,
suggesting an attenuated phenotype in this cell line; however, the replication levels of wtPIV3
JS and bPIV3 SF were similar (Fig. 4e). In HBE TLAs, replication of JS approached 7.5 log10
pfu/mL by day 6 pi, while PIV3-cp45 and bPIV3 SF replicated maximally to 5.5 and 3.5 log10
pfu/mL on day 6, respectively, and to 6 log10 pfu/mL by day 10 (Fig. 4f). Similar to RSV strains,
the attenuated PIV3 viruses replicated less efficiently than wtPIV3 in HBE TLAs. Growth
restriction of the attenuated strains may be due to a slower progression from layer to layer in 3D
HBE TLAs. More detached cells were observed in infections with wild type viruses than
infections with the attenuated strains.
9
Innate immune response to RSV and PIV3 infection
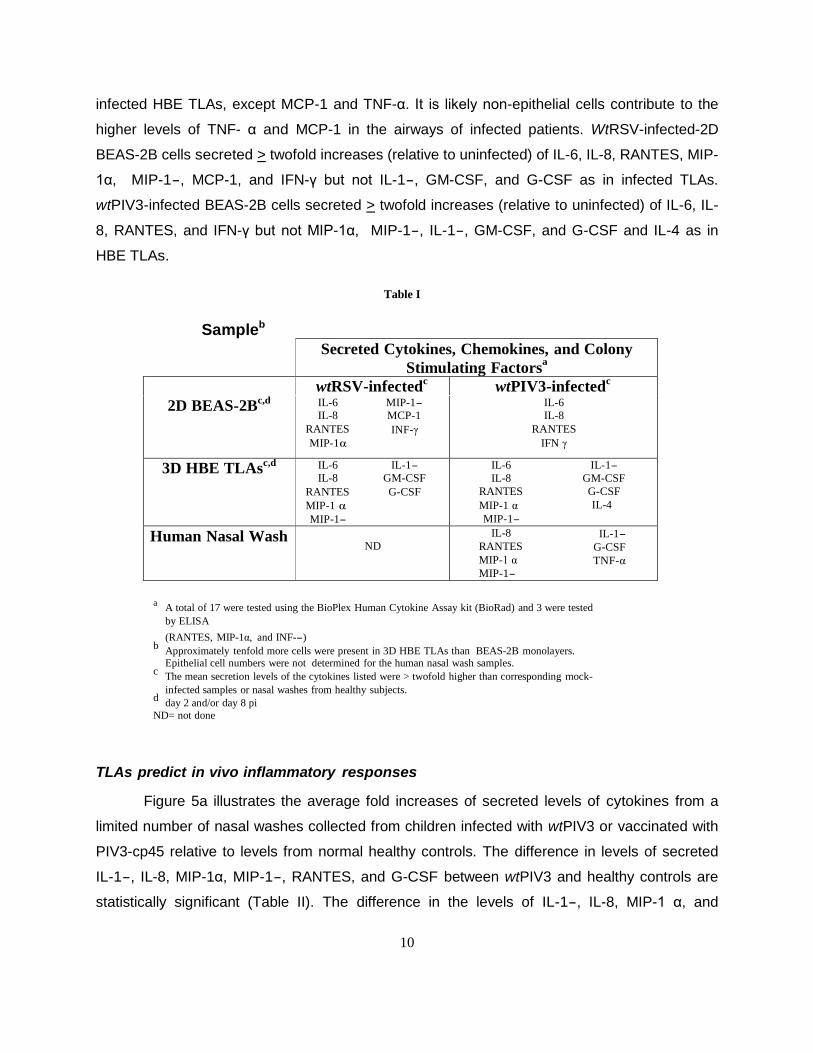
Table I lists the cytokines, chemokines, and colony-stimulating factors detected in cell
culture supernatants from wild type infected BEAS-2B epithelial cells and 3D HBE TLAs in
comparison to a limited number of nasal washes from wtPIV3-infected children. For infected
samples, only those cytokines with mean secretion levels > twofold higher than uninfected
samples are listed. Of the 19 tested, most of the epithelial-derived cytokines induced by wtPIV3-
infected children were also secreted by infected TLAs, except TNF-α. Of the 19 tested, most of
the epithelial-derived cytokines induced by RSV-infected patients[27] were also secreted by
Figure 4. Replication efficiencies of wtRSVA2 and wtPIV3 JS are significantly higher than attenuated strains in 3D
HBE TLAs. Samples were collected on days 0, 2, 5, and 7 for Vero, days 0, 2, 4, 6, and 8 for LLC-MK2; days 0,
2, 4, 6, and 8 RSV-infected BEAS-2B, days 0, 2, 4, 6, 8, and 10 for PIV3-infected BEAS-2B; and days 0, 2, 4, 6, 8,
and 10 (pi) for TLAs. The geometric mean virus titers from three experiments for Vero and LLC-MK2 infections and
six to eight experiments in 2D and 3D epithelial cells were calculated and plotted against time after infection in 2D
Vero cells (a), 2D BEAS-2B (b and e), 2D LLC-MK2 (d), and 3D HBE TLAs (c and f). The error bars represent the
standard deviations. Virus only (no cells) control is also shown in panel c.
10
infected HBE TLAs, except MCP-1 and TNF-α. It is likely non-epithelial cells contribute to the
higher levels of TNF- α and MCP-1 in the airways of infected patients. WtRSV-infected-2D
BEAS-2B cells secreted > twofold increases (relative to uninfected) of IL-6, IL-8, RANTES, MIP-
1α, MIP-1-, MCP-1, and IFN-γ but not IL-1-, GM-CSF, and G-CSF as in infected TLAs.
wtPIV3-infected BEAS-2B cells secreted > twofold increases (relative to uninfected) of IL-6, IL-
8, RANTES, and IFN-γ but not MIP-1α, MIP-1-, IL-1-, GM-CSF, and G-CSF and IL-4 as in
HBE TLAs.
TLAs predict in vivo inflammatory responses
Figure 5a illustrates the average fold increases of secreted levels of cytokines from a
limited number of nasal washes collected from children infected with wtPIV3 or vaccinated with
PIV3-cp45 relative to levels from normal healthy controls. The difference in levels of secreted
IL-1-, IL-8, MIP-1α, MIP-1-, RANTES, and G-CSF between wtPIV3 and healthy controls are
statistically significant (Table II). The difference in the levels of IL-1-, IL-8, MIP-1 α, and
Table I
Sampleb
Secreted Cytokines, Chemokines, and Colony
Stimulating Factorsa
wtRSV-infectedc wtPIV3-infected
c
2D BEAS-2Bc,d
IL-6 MIP-1-
IL-8 MCP-1
RANTES INF-γ
MIP-1α
IL-6
IL-8
RANTES
IFN γ
3D HBE TLAsc,d
IL-6 IL-1-
IL-8 GM-CSF
RANTES G-CSF
MIP-1 α
MIP-1-
IL-6 IL-1-
IL-8 GM-CSF
RANTES G-CSF
MIP-1 α IL-4
MIP-1-
Human Nasal Wash ND
IL-8 IL-1- RANTES G-CSF
MIP-1 α TNF-α MIP-1-
a A total of 17 were tested using the BioPlex Human Cytokine Assay kit (BioRad) and 3 were tested
by ELISA
(RANTES, MIP-1α, and INF--) b
Approximately tenfold more cells were present in 3D HBE TLAs than BEAS-2B monolayers. Epithelial cell numbers were not determined for the human nasal wash samples.
c The mean secretion levels of the cytokines listed were > twofold higher than corresponding mock-
infected samples or nasal washes from healthy subjects. d
day 2 and/or day 8 pi
ND= not done

11
RANTES in nasal washes from wtPIV3- and PIV3-cp45-infected children are also statistically
significant. Importantly, the differences in cytokine levels were not significant between the PIV3-
cp45 and control nasal washes. The mean fold increases of cytokines secreted from wild type
and attenuated PIV3- and RSV-infected TLAs from day 0 to 2 pi and 6 to 8 pi are illustrated in
Fig. 5b and c. Similar to the cytokines present in the human nasal washes, the levels of the
cytokines secreted from HBE TLAs were higher than the levels secreted from TLAs infected
with bPIV3 and PIV3-cp45 and statistically significant in the day 6 to 8 samples (Table II).
Similar results are illustrated for TLAs infected with wtRSVA2 relative to TLAs infected with
cpts248/404 and rA2cpΔNS2. Similar to the nasal wash levels of IL-8, MIP-1α, and RANTES,
potential biomarkers of inflammation, the differences in levels secreted from TLAs infected with
wild type and attenuated strains are statistically significant (Table II).
In contrast, the cytokine secretion levels were sometimes higher in 2D BEAS-2B cells
infected with attenuated viruses than wild type virus (Fig. 5d and e); i.e., MIP-1α and RANTES
in bPIV3 SF and rA2cpΔNS2 infections. Lower fold increases of these chemokines from wild
type infected cells may be explained by cytopathic effect of day 8 but not day 2 monolayers.
The fold increases of RANTES secretion levels were extremely high in day 2 RSV-infected
BEAS-2B cells and, thus, graphed separately (inset).
Table II. Statistical Significance of Cytokine Levels in Nasal Washes, 3D HBE TLAs, and 2D BEAS-2B Cells
Nasal Wash Samples IL-1β IL-6 IL-8 MIP-1α MIP-1β RANTES G-CSF GM-CSF
wt PIV3 vs. PIV3 neg
wt PIV3 vs. PIV3-cp45
PIV3-cp45 vs. PIV3 neg
0.03
0.03
1.000
0.051
0.08
1.000
0.018
0.022
0.941
0.014
0.045
0.58
0.035
0.105
0.592
0.027
0.002
0.205
0.049
0.089
0.771
inc
inc
inc
3D HBE TLA Samples* IL-1β IL-6 IL-8 MIP-1α MIP-1β RANTES G-CSF GM-CSF
wt PIV3 vs. mock
wt PIV3 vs. PIV3-cp45
PIV3-cp45 vs. mock
<.0001
0.0001
0.129
0.0063
0.0558
0.292
0.0009
0.074
0.0396
0.0349
0.0478
0.708
0.0002
0.0056
0.1024
<.0001
0.002
0.031
0.0009
0.0036
0.3845
<.0001
0.0024
0.0579
2D BEAS-2B Samples* IL-1β IL-6 IL-8 MIP-1α MIP-1β RANTES G-CSF GM-CSF
wt PIV3 vs. mock
wt PIV3 vs. PIV3-cp45
PIV3-cp45 vs. mock
0.0264
0.0454
0.758
<.0001
0.0067
0.0001
0.0004
0.1122
0.0059
0.8603
0.334
0.2681
0.098
0.3561
0.4114
0.2627
0.6652
0.4757
0.2487
0.2487
1.0000
0.2371
0.9464
0.262
mock = mock infected or uninfected
inc = inconclusive
* day 8 samples

12
Figure 5. Fold increases of representative cytokines secreted from wild type infected 3D HBE TLAs are
significantly higher than secreted levels from infections with attenuated strains. (a) Fold increases of cytokines
(IL-1-, IL-6), chemokines (IL-8, MIP-1α, RANTES) and colony-stimulating factors (G-CSF, GM-CSF) in nasal wash
samples collected from subjects shedding wtPIV3 and attenuated PIV3-cp45 were calculated relative to normal healthy
controls. Statistically significant differences in levels between nasal washes collected from subjects shedding wtPIV3 and
normal healthy controls is indicated (*); statistically significant differences in cytokine levels between nasal washes
collected from subjects shedding wtPIV3 and PIV3-cp45 is indicated(+). Cytokines (IL-1-, IL-6), chemokines (IL-8,
MIP-1α, RANTES), and colony-stimulating factor (G-CSF, GM-CSF) after infection with wild type and attenuated RSV
and PIV3 virus strains were plotted as fold increases relative to corresponding mock-infected cells or uninfected cells that
were treated similarly to infected cells without the virus; (b) Day 0-2 3D HBE TLAs (day 0 represents collection of a
sample just after virus adsorption); (c) Day 6-8 3D HBE TLAs; (d) Day 0-2 2D BEAS-2B cells; (e) Day 6-8 2D
BEAS-2B cells. A line was added to emphasize a twofold increase relative to mock. The fold increase in RANTES for
RSV-infected cultures is presented in inset (d) because of the different scales. One experiment was performed with
human nasal washes and a total of 6-8 experiments were performed in 2D BEAS-2B and 3D TLAs. The mean secretion
levels were determined in JMP software.
13
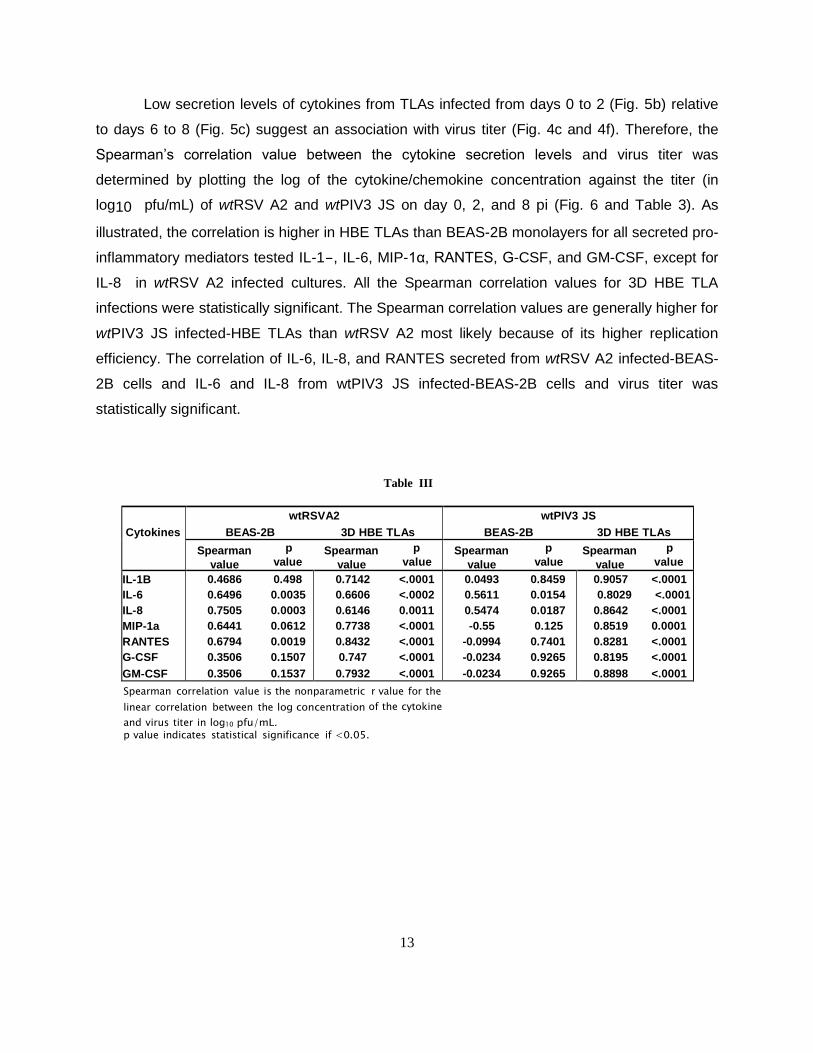
Low secretion levels of cytokines from TLAs infected from days 0 to 2 (Fig. 5b) relative
to days 6 to 8 (Fig. 5c) suggest an association with virus titer (Fig. 4c and 4f). Therefore, the
Spearman’s correlation value between the cytokine secretion levels and virus titer was
determined by plotting the log of the cytokine/chemokine concentration against the titer (in
log10 pfu/mL) of wtRSV A2 and wtPIV3 JS on day 0, 2, and 8 pi (Fig. 6 and Table 3). As
illustrated, the correlation is higher in HBE TLAs than BEAS-2B monolayers for all secreted pro-
inflammatory mediators tested IL-1-, IL-6, MIP-1α, RANTES, G-CSF, and GM-CSF, except for
IL-8 in wtRSV A2 infected cultures. All the Spearman correlation values for 3D HBE TLA
infections were statistically significant. The Spearman correlation values are generally higher for
wtPIV3 JS infected-HBE TLAs than wtRSV A2 most likely because of its higher replication
efficiency. The correlation of IL-6, IL-8, and RANTES secreted from wtRSV A2 infected-BEAS-
2B cells and IL-6 and IL-8 from wtPIV3 JS infected-BEAS-2B cells and virus titer was
statistically significant.
Table III
Cytokines
wtRSVA2
BEAS-2B 3D HBE TLAs wtPIV3 JS
BEAS-2B 3D HBE TLAs
Spearman p Spearman p
value value value value Spearman p Spearman p
value value value value IL-1B
IL-6
IL-8
MIP-1a
RANTES
G-CSF
GM-CSF
0.4686 0.498
0.6496 0.0035
0.7505 0.0003
0.6441 0.0612
0.6794 0.0019
0.3506 0.1507
0.3506 0.1537
0.7142 <.0001
0.6606 <.0002
0.6146 0.0011
0.7738 <.0001
0.8432 <.0001
0.747 <.0001
0.7932 <.0001
0.0493 0.8459
0.5611 0.0154
0.5474 0.0187
-0.55 0.125
-0.0994 0.7401
-0.0234 0.9265
-0.0234 0.9265
0.9057 <.0001
0.8029 <.0001
0.8642 <.0001
0.8519 0.0001
0.8281 <.0001
0.8195 <.0001
0.8898 <.0001 Spearman correlation value is the nonparametric r value for the
linear correlation between the log concentration of the cytokine
and virus titer in log10 pfu/mL. p value indicates statistical significance if <0.05.
14
2.0 Discussion
Lacking large-scale in vitro cell culture models and small animals that mimic human
respiratory virus infections and disease states has hindered the development of live attenuated
RSV and PIV3 vaccines. For example, although 4.2 log10 pfu/mL of cpts248/404 was shed on
average into the nasal cavities of 3- to 5-month-old infants receiving 105 pfu,[12] only 2.2 log10
pfu/mL[28] and 1.3 log10 pfu/mL[29] was shed by in mice and chimpanzees, respectively, after
receiving 106 pfu. 4.3 log10 pfu/mL of rRSVA2248/404ΔSH was shed on average into the nasal
cavities of seronegative children with a 105 pfu[30] and only 2.1 log10 pfu/mL in chimpanzees
with a 105 pfu.[31] 4.3 log10 pfu/mL of rRSVA2248/404/1030 was shed on average into nasal
cavities of seronegative children after a 105 pfu dose[30] and no rRSVA2248/404/1030 was
detected in nasal turbinates of mice after a 106 dose.[28] Therefore, we engineered a novel in
vitro model of the HRE to predict in vivo attenuation levels of cp, ts, host-range (hr), and gene
deleted viruses. As reported here, growth of two respiratory viruses in 3D HBE TLAs and the
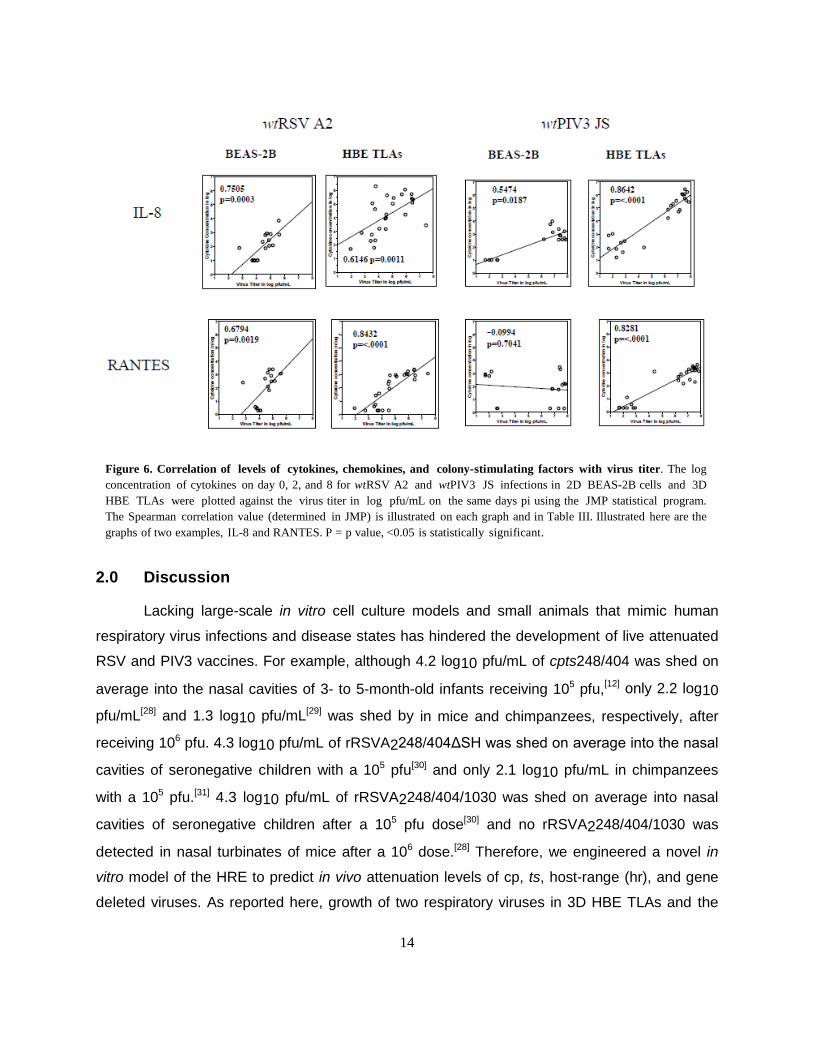
Figure 6. Correlation of levels of cytokines, chemokines, and colony-stimulating factors with virus titer. The log
concentration of cytokines on day 0, 2, and 8 for wtRSV A2 and wtPIV3 JS infections in 2D BEAS-2B cells and 3D
HBE TLAs were plotted against the virus titer in log pfu/mL on the same days pi using the JMP statistical program.
The Spearman correlation value (determined in JMP) is illustrated on each graph and in Table III. Illustrated here are the
graphs of two examples, IL-8 and RANTES. P = p value, <0.05 is statistically significant.
15
concomitant host response parallel infections of the HRE more closely than 2D epithelial cells.
Differences in structural organization and state of differentiation affect the physiology of
epithelial cells[32] grown as monolayers or TLAs. As in the HRE, the multiple cell types in the
TLAs are organized in layers. Intrinsic to the higher complexity of TLAs and different membrane
interactions is a cascade of events essential not only to architecture but also to differentiation.[19]
Therefore, TLAs display hallmarks of in vivo epithelia, express markers of differentiated
epithelial cells, and induce cell growth, and cell signaling pathways not present in 2D cells. Cell
communication through intercellular junctions, paracrine factors, and cell adhesion molecules
are important to epithelial function.[20] Thus, TLAs represent a more physiologically relevant
model of the HRE than 2D epithelial cells. One difference is that TLAs produce microvilli instead
of the cilia of the HRE. Since cilia play an important role in virus infection,[33] this difference
between the HBE TLAs and HRE may not be significant since virus infections in HBE TLAs
parallel in vivo RSV infections (Deatly et al, submitted).
This novel 3D HBE TLA model has some significant advantages with respect to existing
in vitro cultures of the HRE, such as primary cell and air liquid interface cultures. The capability
for large-scale production and prolonged culture and infection times provide the ability to
remove aliquots for multiple analyses at different times pi without terminating the experiment,
thus eliminating the cost and uncertainly of restarts. The ease of maintaining consistent cultures
allows comparison of data from experiments of different batches of HBE TLAs. Our polarized
multicellular HBE TLA model of cells from the human bronchi and tracheae better mimics the
upper respiratory tract than the 3D monoculture of alveolar A549 epithelial cells.[34]
A hallmark of RSV and PIV3 infection in traditional monolayer cultures is the formation of
syncytial or large multinucleated cells resulting from cell fusion. Syncytia are not always
detected in the respiratory tract of fatal RSV cases[35] and have not been observed by
Transmission Electron Microscopy of HBE TLA tissue sections or in the air liquid interface
culture infections.[33] In polarized epithelia, expression of the fusion protein is restricted to the
apical surface; therefore, it is not able to interact with adjacent cells. Syncytia formation may be
more prevalent in infections of monolayers or thin epithelial layers in vivo. Therefore, we
hypothesize paramyxovirus infections in HBE TLAs may mimic in vivo infections more closely
than infections in traditional monolayers.
Small Phase I clinical trials are performed to evaluate the safety and immunogenicity of
vaccine candidates. Three criteria of safety include attenuation, phenotypic/genetic stability,

16
and clinical symptoms of respiratory disease. In clinical trials, cpts248/404 and PIV3-cp45 were
attenuated and stable when 105 pfu were administered to children and infants.[12,13] rA2cpΔNS2
was over-attenuated in adults when intranasally administered even at 107 particle-forming
units.[14] The bPIV3 SF is attenuated in rhesus macaques[15] and most likely hr restricted in
humans as the bPIV3 Kansas strain.[36] Like in vivo, attenuated RSV and PIV3 strains produce
significantly lower titers than respective wild type viruses in TLAs at 35°C—the upper
temperature of the upper HBE.[11] Although attenuated RSV strains cpts248/404 and
rA2cpΔNS2 replicated at lower titers (0.5 and 0.9 log10 pfu/mL, respectively) than wtRSVA2 in
primary submerged human adenoid epithelial cells at 35°C,[37] virus titers of these strains were 2
to 3 log10 pfu/mL lower in HBE TLAs. Most likely improved cell communication and cell
signaling in TLAs facilitate the differentiation of replication levels of wild type and attenuated
viruses not observed in 2D cells or air liquid interface cultures.
A fundamental role of the HRE is to prevent microbial invasion. Pro-inflammatory
mediators in vivo[17] recruit inflammatory cells that clear the virus by phagocytosis. Similarities in
the profiles of pro-inflammatory mediators between epithelial cells in vitro and in vivo indicate
that epithelial cells are likely the primary secretors of these mediators even prior to microbial
invasion.
Although disease pathogenesis is generally associated with replication efficiency and
cytotoxicity of the pathogen, severe disease states resulting from RSV (and most likely PIV3)
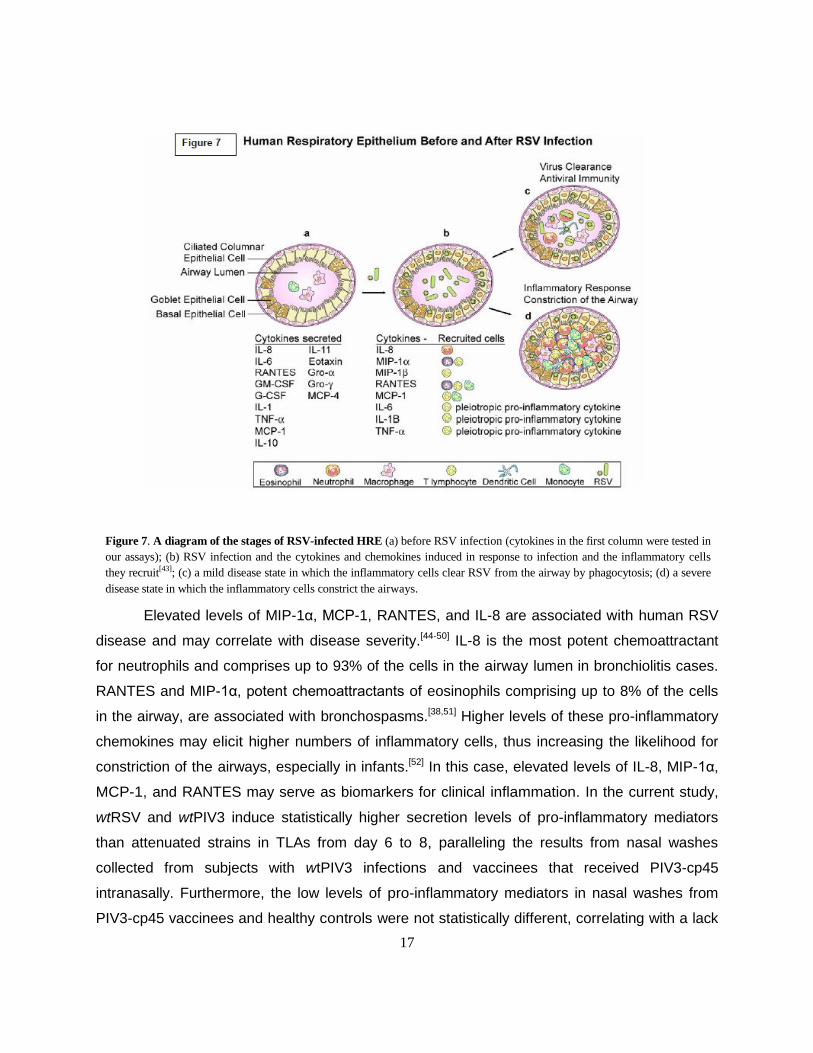
are due to the inflammatory response to the virus.[38] As illustrated in Fig. 7, the innate immune
response of the HRE to RSV results in secretion of cytokines (IL-1, TNF-α, IL-6, and IL-11), and
chemokines (IL-8, MIP-1α, RANTES, and MCP−1)[27,38-42] (Fig. 7b). These pro-inflammatory
mediators elicit inflammatory cells.[43] In mild disease states, inflammatory cells, primarily
neutrophils, eosinophils, and macrophages, phagocytose virus to clear the airway and as part of
the process produce an antiviral response (Fig. 7c). Severe disease states are characterized by
airways constricted with inflammatory cells (Fig. 7d), shed epithelial cells, and mucus
accumulation.
17
Elevated levels of MIP-1α, MCP-1, RANTES, and IL-8 are associated with human RSV
disease and may correlate with disease severity.[44-50] IL-8 is the most potent chemoattractant
for neutrophils and comprises up to 93% of the cells in the airway lumen in bronchiolitis cases.
RANTES and MIP-1α, potent chemoattractants of eosinophils comprising up to 8% of the cells
in the airway, are associated with bronchospasms.[38,51] Higher levels of these pro-inflammatory
chemokines may elicit higher numbers of inflammatory cells, thus increasing the likelihood for
constriction of the airways, especially in infants.[52] In this case, elevated levels of IL-8, MIP-1α,
MCP-1, and RANTES may serve as biomarkers for clinical inflammation. In the current study,
wtRSV and wtPIV3 induce statistically higher secretion levels of pro-inflammatory mediators
than attenuated strains in TLAs from day 6 to 8, paralleling the results from nasal washes
collected from subjects with wtPIV3 infections and vaccinees that received PIV3-cp45
intranasally. Furthermore, the low levels of pro-inflammatory mediators in nasal washes from
PIV3-cp45 vaccinees and healthy controls were not statistically different, correlating with a lack
Figure 7. A diagram of the stages of RSV-infected HRE (a) before RSV infection (cytokines in the first column were tested in
our assays); (b) RSV infection and the cytokines and chemokines induced in response to infection and the inflammatory cells
they recruit[43]; (c) a mild disease state in which the inflammatory cells clear RSV from the airway by phagocytosis; (d) a severe
disease state in which the inflammatory cells constrict the airways.
18
of clinical symptoms of inflammation of the vaccines.[12,13] Therefore, low cytokine secretion
levels from cpts248/404 and rA2cpΔNS2-infected TLAs are also consistent with clinical
observations in Phase I studies since these vaccinees also lacked symptoms of
inflammation.[12,14] Especially noteworthy are the significant differences in secretion levels of IL-
8, MIP-1α, and RANTES between wild type and attenuated strains in nasal washes since their
levels were associated with severity of RSV disease in humans. Statistically significant
differences between the cytokine levels in infected and uninfected TLAs are more similar to
infected and uninfected nasal washes than 2D BEAS-2B cells. One difference is the secretion of
GM-CSF from TLAs that is not detected in nasal washes collected from wtPIV3-infected
subjects. Since epithelial or mesenchymal cells secrete GM-CSF, perhaps a factor not
expressed in the TLAs inhibits induction of GM-CSF in the HRE.
Since attenuation level and low secretion levels of pro-inflammatory cytokines of
cpts248/404, rA2cpΔNS2, and PIV3-cp45 in TLAs correlate with safety in clinical trials, the low
replication efficiency and low secretion levels of pro-inflammatory mediators of bPIV3 SF in
TLAs predict that this strain would also be safe in humans. Indeed a similar strain, bPIV3
(Kansas), was safe in humans.[36] In contrast, similar replication efficiency and higher secretion
levels of MIP-1α and RANTES in infected BEAS-2B monolayers relative to wtPIV3 infections
would suggest that bPIV3 SF and rA2cpΔNS2 would not be safe in humans.
In summary, the parallels between cell physiology, viral growth kinetics, and pro-
inflammatory mediator profiles substantiate the physiological relevance of TLAs to human
respiratory epithelia compared to 2D BEAS-2B cells. The 3D HBE TLA model offers an
advantage over monolayer cultures in predicting the level of attenuation and the inflammatory
response of respiratory viruses in humans. Therefore, RSV and PIV3 infections in HBE TLAs
may mimic in vivo infections more closely than infections in traditional monolayers. The data
indicate HBE TLAs may be better suited to evaluate RSV and PIV3 vaccine candidates prior to
clinical trials.
19
3.0 Methods
Cells
Mesenchymal cells (HBTC) from human bronchi and tracheae were obtained from three
donors through Cambrex Biosciences (Walkersville, MD). LLC-MK2 and BEAS-2B epithelial
cells[53] were obtained from ATCC (Manassas, VA). BEAS-2B cells were used instead of
primary cells to provide consistency from batch to batch. BEAS-2B and HBTC cells were
maintained in GTSF-2 medium with 7% fetal bovine serum[9] in human fibronectin coated flasks
(BD Biosciences, San Jose, CA). Vero, HEp-2, and LLC-MK2 cells were grown at 37°C in
Eagle’s modified minimum essential medium supplemented with 2mM non-essential amino
acids, 100 units penicillin, 100 μg/ml streptomycin, 0.25 μg/ml amphotericin B, 10% fetal bovine
serum, 2mM L-glutamine, and 25mM HEPES buffer (Gibco-BRL, Gaithersburg, MD).
3D TLA cultures
To construct 3D HBE TLA cultures, HBTC cells from a monolayer culture were seeded at
2 x 10⁵ cells/mL into a 55-mL rotating wall vessel (RWV) (Synthecon, Houston, TX) with 4-5
mg/mL of Cytodex-3 microcarriers, type I collagen-coated cyclodextran microcarriers (Pharmacia,
Piscataway, NJ) at 35°C. Cultures were allowed to grow for a minimum of 48 hours before the
medium was changed. BEAS-2B cells were seeded at 2 x 10⁵ cells/mL 4 to 6 days after HBTC-
Cytodex 3 microcarrier aggregates were formed. Thereafter, approximately 65% of the media was
replaced every 20 to 24 hours. As metabolic requirements increased, the glucose concentration in
GTSF-2 medium was increased to 200 mg/dL. TLA cultures were grown in RWV to 1 to 2 mm in
diameter using the rotary cell culture system (Synthecon, Houston, TX) at 35°C with appropriate
rotation rate for aggregate suspension. Cell numbers were determined after treating the TLAs with
2000U/mL type I collagenase (Invitrogen, Carlsbad, CA) at 37°C for 10 minutes.
Viruses
wtRSV A2,[54] cpts248/404,[55] wtPIV3 JS,[56] and PIV3-cp45[56] have been previously
described. cpts248/404 contains five mutations in the biological strain derived by cold passage
(cp) and the 248 and 404 temperature sensitive (ts) mutations were produced by exposure to 5-
fluorouracil. The 404 ts mutation is in the gene start of the matrix M2 gene and 248 is in the L
polymerase gene.[57] The growth of cpts248/404 is restricted at 37°C (> 2 log10 pfu/mL lower
than the titer at 32°C). rA2cpΔNS2 virus was derived by deleting the NS2 (interferon antagonist)
gene from rA2cp.[31,58] PIV3-cp45 is a cold-adapted, ts virus that differs from wtPIV3 JS by 15

20
mutations.[59] bPIV3 SF is hr restricted in human cells. Recombinant bovine PIV3 SF was
constructed by inserting each of the individual genes into a modified Bluescript vector (pFLII,)
by RT-PCR (see Supplementary Methods online). Using modification of the protocol previously
described,[60] recombinant bPIV3 SF was recovered from cDNAs. This procedure facilitates
virus rescue from Vero cells without calcium phosphate precipitation or recombinant vaccinia
virus helper (Witko et al, personal communication). Plasmids encoding support proteins, N, P,
and L were based on PIV3-cp45 sequence rather than bPIV3 SF sequence and were the only
plasmids used for the rescue in addition to those containing the full-length clones and T7 RNA
polymerase. All viruses were purified by gradient ultracentrifugation described elsewhere.[60,61]
Scanning Electron Microscopy of 3D HBE TLAs
After removal from the reactor vessels, samples were washed once with calcium- and
magnesium-free PBS. Day 31 to 35 samples were suspended in a buffer containing 3%
glutaraldehyde and 2% paraformaldehyde in 0.1 M cacodylate buffer at pH 7.4[45] (Luna 1968),
then rinsed for 5 minutes with cacodylate buffer three times and post-fixed with 1% osmium
tetroxide (Electron Microscopy Sciences, Fort Washington, PA, USA) in cacodylate buffer for 1
hour. Samples were then rinsed three times for 5 minutes each with distilled water and then
treated for 10 minutes with a Millipore (Millipore Corp., Bedford, MA, USA) (0.2-μm)-filtered,
saturated solution of thiocarbohydrazide (Electron Microscopy Sciences), then washed five
times for 5 minutes each with distilled water and fixed with 1% buffered osmium tetroxide for 10
minutes. This last step was necessary to prevent the microcarriers from collapsing. Samples
were then rinsed with distilled water three times and dehydrated with increasing concentrations
of ethanol, followed by three changes in absolute methanol. After transfer to 1,1,1,3,3,3-
hexamethyldisilazane (Electron Microscopy Sciences), samples were allowed to soak for 10
minutes, drained, and air-dried overnight. Dried samples were sprinkled with a thin layer of
silver paint on a specimen stub, dried, coated by vacuum evaporation with platinum-palladium
alloy, and then examined in the JEOL T330 scanning electron microscopy at an accelerating
voltage of 5 to 10 kV.
Transmission Electron Microscopy of 3D HBE TLAs
Day 31 to day 35 HBE TLA samples were washed three times with 0.1 M sodium
cacodylate buffer pH 7.4 (#11652, Electron Microscopy Science, Port Washington, PA, USA)
then fixed in a solution of 2.5% gluteraldehyde-formaldehyde in 0.1 M sodium cacodylate
buffer (#15949, Electron Microscopy Science, Fort Washington, PA, USA) 0.3 M sucrose

21
(Sigma, St. Louis, MO, USA) – 1% DMSO (Sigma, St. Louis, MO, USA) pH 7.4 (Electron
Microscopy Science, Fort Washington, PA, USA) overnight at 4°C. The fixed tissue was washed
three times in 0.1 M sodium cacodylate buffer, pH 7.4 buffer, post-fixed stained in 0.1 M tannic
acid (#21700, Electron Microscopy Science, Port Washington, Pa, USA) in 0.1 M sodium
cacodylate pH 7.4 for 3 hours at room temperature. The tissue samples were washed three
times in buffer, and then fixed again in 1.0 M osmium tetroxide (#19152, Electron Microscopy
Science, Port Washington, PA, USA) in cacodylate buffer pH 7.4 for 1.5 hours at room
temperature. Samples were dehydrated in a series of graded ethanol, and then embedded in
EMbed - 812 resin (#14120, Electron Microscopy Science, Port Washington, PA, USA).
Samples were sectioned at yellow-silver (700 A), mounted on Ni grids and examined under a
JEOL JEM-1010 transmission electron microscope (JEOL, USA) at 80 kV.
Expression of epithelial markers by confocal microscopy
Normal human lung cryostat sections were obtained from BioChain Institute (Hayward,
CA). 2D BEAS-2B and 2D HBTC cells were seeded onto coverslips and fixed with 4%
paraformaldehyde (Electron Microscopy Sciences, Hatfield, PA, cat #15710) when 70% - 80%
confluent for 30 minutes. Day 35 3D HBE TLAs were fixed in 4% paraformaldehyde for 60
minutes. All cells/tissues were incubated with the primary antibodies including EMA (Dako
Cytomation, Carpinteria, CA cat #N1504), mouse anti-human cytokeratin 18, (Dako
Cytomation, Carpinteria, CA cat #M7010), mouse anti-human CD54 (intercellular adhesion
molecule-ICAM-1) (Dako Cytomation, Carpinteria, CA, cat #M7063, Clone 6.5B5) or mouse
anti-MAP2 (Chemicon, Temecula, CA, cat #MAB3418) overnight at 4°C. Fluorescein
isothiocyanate conjugated mouse anti-ZO-1 (Invitrogen – formerly Zymed, Eugene, OR, cat
#33-9111) was incubated at room temperature for 2 hours. After washing five times with 1 x
DPBS (Mediatech, Herndon, VA, cat #20-031-CV), the samples were incubated with the
secondary antibody Alexa Fluor 555 donkey anti-mouse IgG (H + L), (Invitrogen or Molecular
Probes, Eugene, OR, cat #A31570) or the Alexa Fluor 488 goat anti-mouse IgG (H + L),
(Invitrogen or Molecular Probes, Eugene, OR, cat #A11029). The samples were counterstained
with TO-PRO-3 iodide (Invitrogen or Molecular Probes, Eugene, OR, cat #T3605) to stain the
nuclei. 3% BSA (Sigma-Aldrich, St Louis, MO, cat #A2153-50G) and 0.25% Triton (Sigma-
Aldrich, St Louis, MO, cat #061K0126) in 1X PBS were used as Fc block and antibody diluents.
Samples were mounted onto microscope slides using coverslips and polyvinyl alcohol (PVA,
Sigma-Aldrich /Fluka, Biochemika, St Louis, MO, cat #10981) mounting medium. A Leica TCS
22
SL Confocal Scanner with Leica DMI RE2 inverted Microscope was used to scan all samples.
Expression of epithelial markers by immunohistochemistry
TLAs designated for histological and immunohistological staining were washed three
times with gentle agitation for 5 minutes each in 1x PBS without Mg+2 and Ca +2 (Cellox
Laboratories Inc, St. Paul, MN, USA) to remove foreign protein residues contributed by the
growth media. The TLAs were then transferred to 50 mL polystyrene tubes containing 10%
formalin buffered in PBS (Electron Microscopy Service, Ft. Washington, PA, USA). After an
overnight incubation at 4°C, the fixed cells were washed three times in PBS. The TLAs were
centrifuged at < 1000g to concentrate the bead-cell assembly, and 1 mL of warm noble agar
was added for additional stabilization. TLAs were embedded in paraffin blocks, and thin
sections were cut at 3-5 mm on a Micron HM315 microtome (Walldorf, Germany). The sections
were deparaffinized by standard procedure, and the antigens were retrieved by protein kinase
or citrate and blocked with a normal rabbit or mouse sera – 0.5% Tween 20 blocking solution.
The antibody for mucin was used neat and the antibody for ICAM-1 was diluted 1:100 in the
blocking solution and incubated on sections for 9 to 30 minutes, rinsed with distilled water and
either anti-mouse, anti-goat, or anti-rabbit-conjugated horse radish peroxidase secondary
antibody (Dako Envision System) was applied using an automated immunohistochemical
stainer (Dako, Carpintaria, CA, USA). Slides were examined by a Zeiss Axioskop (Hamburg,
Germany) microscope and images captured with a Kodak DC 290 Zoom (Rochester, NY, USA)
digital camera. Brown stain indicates positive peroxidase stains for ICAM-1. Pink stain for mucin
induces a positive mucicarmine stain. Immunocytochemistry of monolayer cultures were
prepared as outlined previously.[9] Briefly, glass microscope slides (Rite-On, Clay Adams cat
#3050) were placed in 150-mm Petri dishes (Fisher cat #25030-150). Cells were added (1x 10³
cells/mL) and incubated at 35.5°C for 48 hours. Slides were removed and washed two times
with calcium- and magnesium-free PBS (Cellos Laboratories, Inc., St. Paul, MN) and post-fixed
with 10% buffered formalin (Electron Microscopy Service, Ft. Washington, PA).
Host transcriptional profiling data analysis
RNA isolation, labeling, and hybridization: Total RNA was extracted from 3D HBE
TLAs (how many and what day post initiation) and BEAS-2B monolayers (how many and what
day post culture initiation) with TriZol reagent (Invitrogen, Carlsbad, CA) and further purified
with RNeasy mini kit (Qiagen, Valencia, CA) following the manufacturer’s protocol. Integrity of
the RNA was examined by electrophoresis in a 1% agarose gel, and the concentration was
23
determined by ultraviolet (UV) absorbance at 260 nm. Five μg of total RNA from virus- or mock-
infected samples was incubated at 70°C for 10 minutes with oligo-dT containing a T7 RNA
polymerase promoter sequence. The first strand cDNA was synthesized with SuperScript II for 1
hour at 50°C; the second strand with E. coli DNA polymerase, E. coli DNA ligase, and T4 DNA
polymerase for 3 hours at 16°C. Double-stranded (ds) cDNA was purified with MultiScreen
PCR filter plate (Millipore, Billerica, MA) and eluted with 25 μL 10mM Tris buffer. Twenty μL of
eluted ds cDNA was used to synthesize cRNA for 16 hours at 37°C with T7 RNA polymerase
(Epicenter, Madison, WI) and biotin-CTP/biotin-UTP (Perkin Elmer, Boston, MA). The cRNA
was purified with MultiScreen PCR filter plate and quantified by UV absorbance at 260 nm. Ten
μg of cRNA was fragmented and hybridized to Affymetrix HG-U133A chips according to the
Affymetrix GeneChip Expression Analysis Technical Manual. In brief, cRNA was hybridized to
the GeneChip for 16 hours at 45°C in a 200 μL Saline-Sodium Phosphate-EDTA buffer cocktail
containing herring sperm DNA, bovine serum albumin, and a known amount of standard curve
spike-in transcript pool.[62] GeneChips were stained with strepavidin-conjugated phycoerythrin
(SAPE, Invitrogen, Carlsbad, CA), followed by goat biotinylated anti-strepavidin (Vector
Laboratories, Burlingame, CA), and a second round of SAPE staining was performed for signal
amplification. After staining, fluorescent intensity was quantified using the Affymetrix GeneChip
Scanner; the array image was captured and processed into signal intensity with the Affymetrix
Microarray Suite 5.0.
Data filtering, analysis, and reduction: The fluorescent intensities of all unique gene
identifiers on the GeneChips were normalized based on the hybrid method of GeneChip scaled
average signal (with constant mean assumption) and spike-in standard curve transcripts.[62]
Unique identifiers were then filtered to those with normalized intensity higher than 10 ppm in at
least two of the triplicate samples for each treatment condition. For each identifier in the filtered
set, mean log-transformed expression levels for the treatment conditions were subject to
analysis of variance (ANOVA) methods. To control the false discovery rate (FDR), p-values of
each unique identifier were adjusted by a previously described algorithm.[63] Identifiers with FDR
≤ 0.05 and ≥ 1.95-fold change over mock-infected HBE TLAs were further analyzed for their
function with the Gene Ontology tool[64] in Spotfire 8.0 (Somerville, MA) or NETAFFX web tool
(Affymetrix, Santa Clara, CA).
The global functional analyses were generated through the use of Ingenuity Pathways
Analysis (Ingenuity® Systems, www.ingenuity.com). The Functional Analysis identified the

24
biological functions and/or diseases that were most significant to the data set and were
associated with biological functions and/or diseases in the Ingenuity Pathways Knowledge Base
were considered for the analysis. Fischer’s exact test was used to calculate a p-value
determining the probability that each biological function and/or disease assigned to that data set
is due to chance alone.
In vitro virus inoculation and titration
Confluent monolayer BEAS 2B and LLC-MK2 cultures were inoculated in T25 flasks with
indicated viruses at multiplicity of infection (MOI) of 1. Confluent monolayer Vero cell cultures
were inoculated at MOI of 0.1 since the plaquing efficiency is tenfold higher in Vero cells. The
outer layer of 20-day-old 3D HBE TLAs (1- to 2-mm diameter) represent about 10% of the tri-
culture. Therefore, TLAs were inoculated at a MOI of 0.1 to achieve an effective MOI of 1 for the
cells on the outer surface. After virus absorption at room temperature for 1 hour, monolayers
and TLA cultures were washed three times with DPBS (Invitrogen, Carlsbad, CA) and fed with
media specified above. All air bubbles were removed from the RWV before rotation to eliminate
shearing of the cells.[10] Approximately 65% of the culture media was replaced every 48 hours
for both monolayer and TLA cultures. For virus titration, samples were collected on days 0, 2, 5,
and 7 for Vero cultures, on days 0, 2, 4, 6, and 8 for LLC-MK2 and RSV-infected BEAS-2B
cells, and 0, 2, 4, 6, 8, and 10 for PIV3-infected BEAS-2B and 3D HBE TLAs. For RSV titration,
the entire monolayer cultures or 1 mL of the TLA cultures were flash-frozen with 1 x SPG. RSV
titer was determined by immunostaining infected HEp-2 cells at 32°C as previously described.
Titers of PIV3 viruses were determined in LLC-MK2 cells with medium overlay containing 0.8%
agar at 32°C as previously described[65] except that plaques were visualized by an immunostain
assay described previously[66] using anti-human PIV3 HN and F antibodies.
Human nasal wash samples
A clinical trial was performed to evaluate the transmission potential of PIV3-cp45 from
South African vaccinees 4 to 48 months of age to seronegative playmates. In this double-blind
study, subjects received 105 pfu of PIV3-cp45 or placebo by intranasal administration.[67] Nasal
washes (20 mL) were collected on days 0, 3, 5, 7, 10, 12, 14, 17, 19, and 21 and also on any
illness day. After completion of the virology analysis, a limited number of nasal wash samples
were available to test for cytokine expression. Nasal wash samples from two placebos and two
day 0 (samples collected right before immunization) samples from two vaccinees represent the
four normal healthy controls. Nasal washes collected from two vaccinees shedding virus on day
25
5 and 7 and 7 and 10 represent the vaccine samples. Nasal washes collected from three
subjects that developed illness from a natural wtPIV3 virus infection shed virus only on days 14,
17, and 19 (A); 7, 10, and 12 (B); and day 12 and 14 (C) represent wtPIV3 samples. Subject B
had an adenovirus infection on days 0, 3, and 5 and Subject C had an enterovirus infection on
day 0; however, wtPIV3 was the only adventitious agent detected in the samples tested for
cytokines. These three subjects shedding wtPIV3 presented symptoms of upper respiratory
tract infections, fevers, and coughs. No clinical symptoms or adventitious agents were reported
for the normal healthy controls or vaccinees on the days selected for cytokine analysis.
Quantifying cytokines
Cytokine concentrations of uninfected and infected 2D and 3D culture supernatants, as
well as nasal washes from healthy and PIV3-infected subjects, were determined using the
Bioplex 17plex human cytokine assay kit (BioRad, Hercules CA) following the manufacturer’s
protocol. These cytokines include IL-2, IL-4, IL-5, IL-6, IL-7, IL-8, IL-10, IL-12 (p70), IL-13 and
IL-17, TNF-α, IL-1β, MCP-1, MIP1-β, GM- CSF, G-CSF, and IFNγ. Concentrations of RANTES
(Regulated upon Activation, Normal T cell-Expressed and -Secreted) and MIP-1α (Macrophage
Inhibitory Factor 1-α) were determined by ELISA (R&D System, Minneapolis, MN). The
supernatants analyzed represent cytokine secretion in 48-hour periods collected on day 0, 2,
and 8 pi. The mean cytokine secretion concentration was determined in three experiments for
MIP-1α and at least six experiments for the other cytokines. The limit of detection in the assays
was 2 pg/mL for RANTES, 50 pg/mL for IL-6, G-CSF and GM-CSF, and 10 pg/mL for IL-1β, IL-
2, IL4, IL-5, IL-7, IL-8, IL-10, IL-12 (p70), IL-13, IL-17, MIP-1α, MIP-1β, MCP-1, INFγ, and TNF-
α. The cytokine concentrations were log10 transformed before analysis. Data were analyzed
with Spotfire 8.0 (Spotfire Inc, Somerville, MA) to determine consistency and reproducibility.
JMP 5.11 (SAS Institute Inc., Cary, NC) was used for statistical analysis. Cytokines from
uninfected cells were determined to be secreted if the concentrations of >50% of the assay
samples tested were above the detection limit. The fold increase of a cytokine was determined
by the ratio of the mean cytokine concentration secreted from infected cultures (or nasal
washes) to the corresponding mean cytokine concentration of uninfected cultures (or nasal
washes). Statistical significance of cytokine levels in nasal washes in the 3D HBE TLAs and 2D
BEAS- 2B cells illustrated in Table II were performed by SAS analysis.
26
4.0 Supplementary Methods
Construction of rbPIV3 Shipping Fever
The full-length cDNA clone of the bPIV3 SF genome was created from eight cDNA
fragments of the genome, corresponding to the six genes (N, P, M, F, HN, & L) as well as the 3’
leader and the 5’ trailer, which were cloned separately and then joined together in one
expression vector. All SF gene fragments (except L) were obtained as single fragments by RT-
PCR amplification using RNA extracted from LLC-MK2 cells (ATCC Number CCL-7) infected
with bovine parainfluenza virus 3, strain SF-4 (ATCC Number VR-281) as template. The
individual inserts were cloned into a modified Bluescript vector (pFLII, see below), except for the
SF L gene, which was amplified and cloned in three pieces into pBluescript SK+ prior to cloning
into the pFLII vector. The full-length clone was created by sequentially piecing the eight
fragments together using unique restriction enzyme (RE) sites that were engineered on to the
ends of the cDNA fragments during RT-PCR.
The first cDNA fragment, leader, encompassed genomic nucleotides 1 through 77 and
had T7 RNA polymerase promoter sequence placed directly prior to the first nucleotide, a Not I
RE site upstream of the promoter, and an Age I RE site at nucleotides 72 to 77 (seven
nucleotides after the N gene start signal) during RT-PCR. The second fragment, N,
encompassed nucleotides 72 through 1659, overlapped the leader fragment at the Age I RE
site, and contained a naturally occurring Spe I RE site at nucleotides 1654 to 1659 that
embodies the N translation stop signal. The third fragment, P, encompassed nucleotides 1654
through 3594, overlapped the N fragment at the SpeI RE site, and had an engineered SalI site
at nucleotides 3589 to 3594. The fourth fragment, M, encompassed nucleotides 3589 through
4831, overlapped the P fragment at the SalI RE site and had an engineered NheI RE site at
nucleotides 4826 to 4831. The fifth fragment, F, encompassed nucleotides 4826 through 6701,
overlapped the M fragment at the NheI RE site, and had an engineered NruI RE site at
nucleotides 6695 to 6700. The sixth fragment, HN, encompassed nucleotides 6695 through
8542, overlapped the F fragment at the NruI RE site, and had an engineered RsrII RE site at
nucleotides 8535 to 8541. The seventh fragment, L, once completed, encompassed nucleotides
8535 through 15371, overlapped the HN fragment the RsrII RE site, and had an engineered
AvrII RE site at nucleotides 15366 to 15371. The eight fragment, trailer, encompassed
nucleotides 15366 through 15456, overlapped the L fragment at the AvrII RE site, and had 26
27
nucleotides of a ribozyme site added downstream of the trailer with a NarI RE site after these 26
bases.
The majority of the fragments were amplified using primers of 29 to 38 nucleotides in
length that matched the published bPIV3 SF sequence (GenBank Assenssion Number
AF17865) at either end of the fragment except where indicated to create the RE sites mentioned
above. In most cases, no more than one nucleotide was changed, but to create the RsrII site,
three nucleotides were altered. The two exceptions with regard to the primer lengths were those
used to amplify the start of the leader and the end of the trailer. The leader primer was 64
nucleotides in length, and, as previously described, the 5’ end of that primer contained the T7
RNA polymerase promoter, sequence adjacent to the start of the bPIV3 SF genome, and a NotI
site upstream of the promoter sequence (AGATATGCGGCCGCTAATACGACTCACTATAGG).
The primer used to amplify the end of the trailer was 93 nucleotides in length and the 3’ end
contained part of the ribozyme sequence found in pFLII and the NarI site
(CCAGCCGGCGCCAGCGAGGAGGCTGGGACCATGCCGGCC). The T7 promoter sequence
and ribozyme where positioned so that RNA transcription with T7 and a cleavage of the RNA by
the ribozyme resulted in an RNA identical to the bPIV3 SF genome.
As mentioned previously, the L gene was cloned into pBluescript SK+ in three
fragments. These fragments, designated L1, L2, and L3, corresponded to genomic nucleotides
8535 through 11195, 11190 through 12969, and 12964 through 15371, respectively, and were
put together to recreate L within the framework of the Bluescript plasmid sequentially using the
RE sites in the following order: EagI – XbaI, XbaI – PstI, and PstI - KpnI. The XbaI and PstI RE
sites are naturally occurring within the L open reading frame at nucleotide positions 11190 to
11195 and 12964 to 12969, respectively. A second XbaI RE site occurs in the L open reading
frame at nucleotides 13753 to 13758 necessitating that the L3 fragment be placed into the L
clone last. The EagI RE site, with an RsrII RE site seven nucleotides downstream, and the KpnI
RE site, with an AvrII RE site 12 nucleotides downstream, were engineered into the cDNAs
during RT-PCR for use in cloning into pBluescript. The entire L fragment was then removed
from pBluescript using the RsrII and AvrII RE sites and placed into pFLII already containing the
trailer fragment. The vector used as the backbone plasmid for the full-length cDNA, pFLII, was
based on the previously described pFL vector used to clone full-length RSV.[60] The pFL vector
was altered to remove an AgeI site that occurred seven nucleotides after the T7 terminators by
digesting with AgeI RE enzyme, blunting the resultant digestion product with T4 DNA

28
polymerase, and re-ligating the plasmid. The pFLII multiple cloning site was introduced into pFL
through PCR using the age I RE minus plasmid as the template. The pFLII multiple cloning site
contains the following RE site I order Not I, Age I, Spe I, Sal I, Nhe I, Nru I, Rsr II, and Avr II.
5.0 Acknowledgments
We are grateful to Ms. L. Fasano in providing cells, V. Souza and J. Zhoa for help with
the BioPlex assay, and D. DeThomas for graphics. We acknowledge the contributors to the
PIV3-cp45 clinical trial, especially Drs. Peter Wright, Shabir Madhi, Jill Hackell, William Gruber,
and the National Institute of Virology/National Institute for Communicable Diseases for virus
culture and to the Paediatric Infectious Diseases Research Unit, Wits Health Consortium for
subject recruitment. We acknowledge scientific discussions with Drs. V. Randolph, A. Thakur,
and M. Pride and manuscript reviews by Drs. R. Zagursky, C. Parks, M. Hagen, D. Cooper, M.
Egan, and A. Howe. We especially appreciate the work of Mr. Michael Suderman for his
assistance on production of the electron micrographs.

29
6.0 References
1 Collins, P.L., R.M. Chanock, and B.R. Murphy. 2001. Respiratory Syncytial Virus. In Fields Virology.
D.M. Knipe, H. P.M., and D. Griffin, editors. 1443-1485.
2 Cotran, R., V. Kumar, and Collins, T, Robbins. 1999. Pathologic Basis of Disease. In Infectious
Diseases. WB Saunders Company, Philadelphia. p.347.
3 McIntosh, K. 1991. Pathogenesis of severe acute respiratory infections in the developing world:
respiratory syncytial virus and parainfluenza viruses. Rev Infect Dis 13 Suppl 6:S492-500.
4 Anderson, L.J., and C.A. Heilman. 1995. Protective and disease-enhancing immune responses to
respiratory syncytial virus. J Infect Dis 171:1-7.
5 Shay, D.K., R.C. Holman, G.E. Roosevelt, M.J. Clarke, and L.J. Anderson. 2001. Bronchiolitis-
associated mortality and estimates of respiratory syncytial virus- associated deaths among US
children, 1979-1997. J Infect Dis 183:16-22.
6 Welliver, R.C., D.T. Wong, M. Sun, and N. McCarthy. 1986. Parainfluenza virus bronchiolitis.
Epidemiology and pathogenesis. Am J Dis Child 140:34-40.
7 Glezen, W.P., Loda, F. A., and Denny, F. W. 1989. Parainfluenza viruses. In Viral infections of
humans: epidemiology and control. A.S.e.a. Evans, editor. New York Plenum Medical Book
Company, New York. 493-507.
8 Byrd, L.G., and G.A. Prince. 1997. Animal models of respiratory syncytial virus infection. Clin Infect
Dis 25:1363-1368.
9 Goodwin, T.J., et al., 1993. Rotating-wall vessel coculture of small intestine as a prelude to tissue
modeling: aspects of simulated microgravity. Proc Soc Exp Biol Med 202:181-192.
10 Goodwin, T.J., et al.1993, Reduced shear stress: a major component in the ability of mammalian tissues
to form three-dimensional assemblies in simulated microgravity. J Cell Biochem 51:301-311.
11 McFadden, E.R., Jr., B.M. Pichurko, H.F. Bowman, E. Ingenito, S. Burns, N. Dowling, and J. Solway.
1985. Thermal mapping of the airways in humans. J Appl Physiol 58:564-570.
12 Wright, P.F., R.A. Karron, R.B. Belshe, J. Thompson, J.E. Crowe, Jr., T.G.Boyce, L.L. Halburnt, G.W.
Reed, S.S. Whitehead, E.L. Anderson, A.E. Wittek, R. Casey, M. Eichelberger, B. Thumar, V.B.
Randolph, S.A. Udem, R.M. Chanock, and B.R. Murphy. 2000. Evaluation of a live, cold-
passaged, temperature-sensitive, respiratory syncytial virus vaccine candidate in infancy. J Infect
Dis 182:1331-1342.
13 Belshe, R.B., F.K. Newman, T.F. Tsai, R.A. Karron, K. Reisinger, D. Roberton, H. Marshall, R.
Schwartz, J. King, F.W. Henderson, W. Rodriguez, J.M. Severs, P.F. Wright, H. Keyserling,
G.A. Weinberg, K. Bromberg, R. Loh, P. Sly, P. McIntyre, J.B. Ziegler, J. Hackell, A. Deatly, A.
Georgiu, M. Paschalis, S.L. Wu, J.M. Tatem, B. Murphy, and E. Anderson. 2004. Phase 2
evaluation of parainfluenza type 3 cold passage mutant 45 live attenuated vaccine in healthy
children 6-18 months old. J Infect Dis 189:462-470.
14 Wright, P.F., R.A. Karron, S.A. Madhi, J.J. Treanor, J.C. King, A. O'Shea, M.R.Ikizler, Y. Zhu, P.L.
Collins, C. Cutland, V.B. Randolph, A.M. Deatly, J.G. Hackell, W.C. Gruber, and B.R. Murphy.
2006. The interferon antagonist NS2 protein of respiratory syncytial virus is an important
virulence determinant for humans. J Infect Dis 193:573-581.

30
15 van Wyke Coelingh, K.L., C.C. Winter, E.L. Tierney, W.T. London, and B.R. Murphy. 1988.
Attenuation of bovine parainfluenza virus type 3 in nonhuman primates and its ability to confer
immunity to human parainfluenza virus type 3 challenge. J Infect Dis 157:655-662.
16 Bals, R., and P.S. Hiemstra. 2004. Innate immunity in the lung: how epithelial cells fight against
respiratory pathogens. Eur Respir J 23:327-333.
17 Polito, A.J., and D. Proud. 1998. Epithelia cells as regulators of airway inflammation. J Allergy Clin
Immunol 102:714-718.
18 Garofalo, R.P., Welliver, R.C. and Ogra, P.L. 1999. Clinical Aspects of Bronchial Reactivity and Cell-
Virus Interaction. In Mucosal Immunology. P.L. Ogra, Lamm, M. E., Bienenstock, J., Mestecky,
Strobar, W. and McGhee, J. R., editor. Academic PRESS, San Diego. 1223-1237.
19 O'Brien, L.E., M.M. Zegers, and K.E. Mostov. 2002. Opinion: Building epithelial architecture: insights
from three-dimensional culture models. Nat Rev Mol Cell Biol 3:531-537.
20 Knight, D.A., and S.T. Holgate. 2003. The airway epithelium: structural and functional properties in
health and disease. Respirology 8:432-446.
21 Gibson, M.C., and N. Perrimon. 2003. Apicobasal polarization: epithelial form and function. Curr Opin
Cell Biol 15:747-752.
22 Fukamachi, H., T. Mizuno, and Y.S. Kim. 1986. Morphogenesis of human colon cancer cells with fetal
rat mesenchymes in organ culture. Experientia 42:312-315.
23 Kaye, G.I., R.R. Pascal, and N. Lane. 1971. The colonic pericryptal fibroblast sheath: replication,
migration, and cytodifferentiation of a mesenchymal cell system in adult tissue. 3. Replication
and differentiation in human hyperplastic and adenomatous polyps. Gastroenterology 60:515-
536.
24 Buset, M., S. Winawer, and E. Friedman. 1987. Defining conditions to promote the attachment of adult
human colonic epithelial cells. In Vitro Cell Dev Biol 23:403-412.
25 Daneker, G.W., Jr., A.M. Mercurio, L. Guerra, B. Wolf, R.R. Salem, D.J. Bagli, and G.D. Steele, Jr.
1987. Laminin expression in colorectal carcinomas varying in degree of differentiation. Arch
Surg 122:1470-1474.
26 Durban, E.M. 1990. Mouse submandibular salivary epithelial cell growth and differentiation in long-
term culture: influence of the extracellular matrix. In Vitro Cell Dev Biol 26:33-43.
27 Garofalo, R.P., and H. Haeberle. 2000. Epithelial regulation of innate immunity to respiratory syncytial
virus. Am J Respir Cell Mol Biol 23:581-585.
28 Whitehead, S.S., C.Y. Firestone, R.A. Karron, J.E. Crowe, Jr., W.R. Elkins, P.L. Collins, and B.R.
Murphy. 1999. Addition of a missense mutation present in the L gene of respiratory syncytial
virus (RSV) cpts530/1030 to RSV vaccine candidate cpts248/404 increases its attenuation and
temperature sensitivity. J Virol 73:871-877.
29 Crowe, J.E., Jr., P.T. Bui, G.R. Siber, W.R. Elkins, R.M. Chanock, and B.R. Murphy. 1995. Cold-
passaged, temperature-sensitive mutants of human respiratory syncytial virus (RSV) are highly
attenuated, immunogenic, and protective in seronegative chimpanzees, even when RSV
antibodies are infused shortly before immunization. Vaccine 13:847-855.

31
30 Karron, R.A., P.F. Wright, R.B. Belshe, B. Thumar, R. Casey, F. Newman, F.P. Polack, V.B.
Randolph, A. Deatly, J. Hackell, W. Gruber, B.R. Murphy, and P.L. Collins. 2005. Identification
of a recombinant live attenuated respiratory syncytial virus vaccine candidate that is highly
attenuated in infants. J Infect Dis 191:1093-1104.
31 Whitehead, S.S., A. Bukreyev, M.N. Teng, C.Y. Firestone, M. St Claire, W.R. Elkins, P.L. Collins, and
B.R. Murphy. 1999. Recombinant respiratory syncytial virus bearing a deletion of either the NS2
or SH gene is attenuated in chimpanzees. J Virol 73:3438-3442.
32 Unsworth, B.R., Lelkes, P.I. 2000. Tissue Assembly in Microgravity. In Principles of Tissue
Engineering. R.P. Lanza, Langer, R, Vacanti, J.P., editor. Academic Press. 157-164.
33 Zhang, L., M.E. Peeples, R.C. Boucher, P.L. Collins, and R.J. Pickles. 2002. Respiratory syncytial
virus infection of human airway epithelial cells is polarized, specific to ciliated cells, and without
obvious cytopathology. J Virol 76:5654-5666.
34 Carterson, A.J., K. Honer zu Bentrup, C.M. Ott, M.S. Clarke, D.L. Pierson, C.R. Vanderburg, K.L.
Buchanan, C.A. Nickerson, and M.J. Schurr. 2005. A549 lung epithelial cells grown as three-
dimensional aggregates: alternative tissue culture model for Pseudomonas aeruginosa
pathogenesis. Infect Immun 73:1129-1140.
35 MacDonald, N.E., C.B. Hall, S.C. Suffin, C. Alexson, P.J. Harris, and J.A. Manning. 1982. Respiratory
syncytial viral infection in infants with congenital heart disease. N Engl J Med 307:397-400.
36 Karron, R.A., P.F. Wright, S.L. Hall, M. Makhene, J. Thompson, B.A. Burns, S. Tollefson, M.C.
Steinhoff, M.H. Wilson, D.O. Harris, and et al. 1995. A live attenuated bovine parainfluenza
virus type 3 vaccine is safe, infectious, immunogenic, and phenotypically stable in infants and
children. J Infect Dis 171:1107-1114.
37 Wright, P.F., M.R. Ikizler, R.A. Gonzales, K.N. Carroll, J.E. Johnson, and J.A. Werkhaven. 2005.
Growth of respiratory syncytial virus in primary epithelial cells from the human respiratory tract.
J Virol 79:8651-8654.
38 McNamara, P.S., and R.L. Smyth. 2002. The pathogenesis of respiratory syncytial virus disease in
childhood. Br Med Bull 61:13-28.
39 Noah, T.L., F.W. Henderson, I.A. Wortman, R.B. Devlin, J. Handy, H.S. Koren, and S. Becker. 1995.
Nasal cytokine production in viral acute upper respiratory infection of childhood. J Infect Dis
171:584-592.
40 Welliver, R.C. 2003. Respiratory syncytial virus and other respiratory viruses. Pediatr Infect Dis J
22:S6-10; discussion S10-12.
41 Bonville, C.A., H.F. Rosenberg, and J.B. Domachowske. 1999. Macrophage inflammatory protein-
1alpha and RANTES are present in nasal secretions during ongoing upper respiratory tract
infection. Pediatr Allergy Immunol 10:39-44.
42 Sheeran, P., H. Jafri, C. Carubelli, J. Saavedra, C. Johnson, K. Krisher, P.J.Sanchez, and O. Ramilo.
1999. Elevated cytokine concentrations in the nasopharyngeal and tracheal secretions of children
with respiratory syncytial virus disease. Pediatr Infect Dis J 18:115-122.
43 2003. The Cytokine Handbook. Academic Press. 1536 pp.
44 Gern, J.E., M.S. Martin, K.A. Anklam, K. Shen, K.A. Roberg, K.T. Carlson- Dakes, K. Adler, S.
Gilbertson-White, R. Hamilton, P.A. Shult, C.J. Kirk, D.F. Da Silva, S.A. Sund, M.R. Kosorok,
and R.F. Lemanske, Jr. 2002. Relationships among specific viral pathogens, virus-induced
interleukin-8, and respiratory symptoms in infancy. Pediatr Allergy Immunol 13:386-393.

32
45 Harrison, A.M., C.A. Bonville, H.F. Rosenberg, and J.B. Domachowske. 1999. Respiratory syncytical
virus-induced chemokine expression in the lower airways:eosinophil recruitment and
degranulation. Am J Respir Crit Care Med 159:1918-1924.
46 Garofalo, R.P., J. Patti, K.A. Hintz, V. Hill, P.L. Ogra, and R.C. Welliver. 2001.Macrophage
inflammatory protein-1alpha (not T helper type 2 cytokines) is associated with severe forms of
respiratory syncytial virus bronchiolitis. J Infect Dis 184:393-399.
47 Noah, T.L., and S. Becker. 2000. Chemokines in nasal secretions of normal adults experimentally
infected with respiratory syncytial virus. Clin Immunol 97:43-49.
48 Tripp, R.A. 2004. Pathogenesis of respiratory syncytial virus infection. Viral Immunol 17:165-181.
49 McNamara, P.S., B.F. Flanagan, C.A. Hart, and R.L. Smyth. 2005. Production of chemokines in the
lungs of infants with severe respiratory syncytial virus bronchiolitis. J Infect Dis 191:1225-1232.
50 Mejias, A., S. Chavez-Bueno, and O. Ramilo. 2005. Respiratory syncytial virus pneumonia:
mechanisms of inflammation and prolonged airway hyperresponsiveness. Curr Opin Infect Dis
18:199-204.
51 Wang, S.Z., and K.D. Forsyth. 2000. The interaction of neutrophils with respiratory epithelial cells in
viral infection. Respirology 5:1-10.
52 McNamara, P.S., P. Ritson, A. Selby, C.A. Hart, and R.L. Smyth. 2003.Bronchoalveolar lavage
cellularity in infants with severe respiratory syncytial virus bronchiolitis. Arch Dis Child 88:922-
926.
53 Ke, Y., R.R. Reddel, B.I. Gerwin, M. Miyashita, M. McMenamin, J.F. Lechner, and C.C. Harris. 1988.
Human bronchial epithelial cells with integrated SV40 virus T antigen genes retain the ability to
undergo squamous differentiation. Differentiation 38:60-66.
54 Lewis, F.A., Rae, M.L., Lehman, N.I., and Ferris, A.A. 1961. A syncytial virus associated with
epidemic disease of the lower respiratory tract in infants and young children. Med. J. Aust. 2:932-
933.
55 Crowe, J.E., Jr., P.T. Bui, A.R. Davis, R.M. Chanock, and B.R. Murphy. 1994. A further attenuated
derivative of a cold-passaged temperature-sensitive mutant of human respiratory syncytial virus
retains immunogenicity and protective efficacy against wild-type challenge in seronegative
chimpanzees. Vaccine 12:783-790.
56 Belshe, R.B., and F.K. Hissom. 1982. Cold adaptation of parainfluenza virus type 3: induction of three
phenotypic markers. J Med Virol 10:235-242.
57 Whitehead, S.S., C.Y. Firestone, P.L. Collins, and B.R. Murphy. 1998. A single nucleotide substitution
in the transcription start signal of the M2 gene of respiratory syncytial virus vaccine candidate
cpts248/404 is the major determinant of the temperature-sensitive and attenuation phenotypes.
Virology 247:232-239.
58 Whitehead, S.S., K. Juhasz, C.Y. Firestone, P.L. Collins, and B.R. Murphy. 1998. Recombinant
respiratory syncytial virus (RSV) bearing a set of mutations from cold-passaged RSV is
attenuated in chimpanzees. J Virol 72:4467-4471.
59 Skiadopoulos, M.H., S. Surman, J.M. Tatem, M. Paschalis, S.L. Wu, S.A. Udem, A.P. Durbin, P.L.
Collins, and B.R. Murphy. 1999. Identification of mutations contributing to the temperature-
sensitive, cold-adapted, and attenuation phenotypes of the live-attenuated cold-passage 45 (cp45)
human parainfluenza virus 3 candidate vaccine. J Virol 73:1374-1381.

33
60 Elliott, M.B., K.S. Pryharski, Q. Yu, C.L. Parks, T.S. Laughlin, C.K. Gupta, R.A. Lerch, V.B.
Randolph, N.A. LaPierre, K.M. Dack, and G.E. Hancock. 2004. Recombinant respiratory
syncytial viruses lacking the C-terminal third of the attachment (G) protein are immunogenic and
attenuated in vivo and in vitro. J Virol 78:5773-5783.
61 Sanchez, A., and A.K. Banerjee. 1985. Studies on human parainfluenza virus 3: characterization of the
structural proteins and in vitro synthesized proteins coded by mRNAs isolated from infected
cells. Virology 143:45-54.
62 Hill, A.A., E.L. Brown, M.Z. Whitley, G. Tucker-Kellogg, C.P. Hunter, and D.K. Slonim. 2001.
Evaluation of normalization procedures for oligonucleotide array data based on spiked cRNA
controls. Genome Biol 2:RESEARCH0055.
63 Reiner, A., D. Yekutieli, and Y. Benjamini. 2003. Identifying differentially expressed genes using false
discovery rate controlling procedures. Bioinformatics 19:368-375.
64 Ashburner, M., C.A. Ball, J.A. Blake, D. Botstein, H. Butler, J.M. Cherry, A.P. Davis, K. Dolinski, S.S.
Dwight, J.T. Eppig, M.A. Harris, D.P. Hill, L. Issel- Tarver, A. Kasarskis, S. Lewis, J.C. Matese,
J.E. Richardson, M. Ringwald, G.M. Rubin, and G. Sherlock. 2000. Gene ontology: tool for the
unification of biology. The Gene Ontology Consortium. Nat Genet 25:25-29.
65 Karron, R.A., P.F. Wright, F.K. Newman, M. Makhene, J. Thompson, R. Samorodin, M.H. Wilson,
E.L. Anderson, M.L. Clements, B.R. Murphy, and et al.1995. A live human parainfluenza type 3
virus vaccine is attenuated and immunogenic in healthy infants and children. J Infect Dis
172:1445-1450.
66 Randolph, V.B., M. Kandis, P. Stemler-Higgins, M.S. Kennelly, Y.M. McMullen, D.J. Speelman, and
C. Weeks-Levy. 1994. Attenuated temperature-sensitive respiratory syncytial virus mutants
generated by cold adaptation. Virus Res 33:241-259.
67 Madhi, S.A., C. Cutland, Y. Zhu, J.G. Hackell, F. Newman, N. Blackburn, B.R. Murphy, R.B. Belshe,
R.A. Karron, A.M. Deatly, W.C. Gruber, D.I. Bernstein, and P.F. Wright. 2006. Transmissibility,
infectivity and immunogenicity of a live human parainfluenza type 3 virus vaccine (HPIV3cp45)
among susceptible infants and toddlers. Vaccine 24:2432-2439.

REPORT DOCUMENTATION PAGE Form Approved OMB No. 0704-0188
Public reporting burden for this collection of information is estimated to average 1 hour per response, including the time for reviewing instructions, searching existing data sources, gathering and
maintaining the data needed, and completing and reviewing the collection of information. Send comments regarding this burden estimate or any other aspect of this collection of information, including
suggestions for reducing this burden, to Washington Headquarters Services, Directorate for Information Operations and Reports, 1215 Jefferson Davis Highway, Suite 1204, Arlington, VA 22202-4302,
and to the Office of Management and Budget, Paperwork Reduction Project (0704-0188), Washington, DC 20503.
1. AGENCY USE ONLY (Leave Blank) 2. REPORT DATE 3. REPORT TYPE AND DATES COVERED
August 2012 NASA Technical Paper
4. TITLE AND SUBTITLE
5. FUNDING NUMBERS
Paramyxovirus Infection Mimics In Vivo Cellular Dynamics in Three-Dimensional Human
Bronchio-Epithelial Tissue-Like Assemblies
6. AUTHOR(S) Anne M. Deatly, Yen-Huei Lin, Maureen McCarthy, Wei Chen, Lynn Z. Miller, Jorge
Quiroz, Becky M. Nowak, Robert A. Lerch, Stephen A. Udem, Thomas J. Goodwin
7. PERFORMING ORGANIZATION NAME(S) AND ADDRESS(ES) 8. PERFORMING ORGANIZATION REPORT NUMBERS
Lyndon B. Johnson Space Center
Houston, Texas 77058
S-1125
9. SPONSORING/MONITORING AGENCY NAME(S) AND ADDRESS(ES) 10. SPONSORING/MONITORING
AGENCY REPORT NUMBER
National Aeronautics and Space Administration
Washington, DC 20546-0001
TP-2012-217363
11. SUPPLEMENTARY NOTES
12a. DISTRIBUTION/AVAILABILITY STATEMENT 12b. DISTRIBUTION CODE
Available from the NASA Center for AeroSpace Information (CASI) 7121 Standard Hanover, MD 21076-1320 Category: 52
13. ABSTRACT (Maximum 200 words)
Respiratory syncytial virus and parainfluenza virus cause severe respiratory disease, especially in infants, children, and the elderly. An
in vitro model that accurately mimics infection of the human respiratory epithelium would facilitate vaccine development greatly.
Monolayer cultures traditionally used to study these viruses do not accurately and precisely differentiate the replication efficiencies of
wild type and attenuated viruses. Therefore, we engineered novel three-dimensional tissue-like assemblies of human bronchio-
epithelial cells to produce a more physiologically relevant in vitro model of the human respiratory epithelium. Tissue-like assemblies
resemble human respiratory epithelium structurally and by expression of differentiated epithelial cell markers. Most significantly, wild
type viruses exhibited a clear growth advantage over attenuated strains in tissue-like assemblies unlike monolayer cultures. In addition,
the tissue-like assemblies responded to virus infection by secreting pro-inflammatory mediators similar to the respiratory epithelia of
infected children. These characteristics make the tissue-like assembly model a valuable platform technology to develop and evaluate
live, attenuated respiratory virus vaccine candidates for human use.
14. SUBJECT TERMS 15. NUMBER OF
PAGES
16. PRICE CODE
in vitro methods and tests; viruses; 3D in vitro human respiratory epithelia, respiratory
syncytial virus, parainfluenza virus type 3, virus attenuation, cytokine profile 42
17. SECURITY CLASSIFICATION
OF REPORT
18. SECURITY CLASSIFICATION
OF THIS PAGE
19. SECURITY CLASSIFICATION
OF ABSTRACT
20. LIMITATION OF ABSTRACT
Unclassified Unclassified Unclassified Unlimited
Standard Form 298 (Rev Feb 89) (MS Word Mar 97) Prescribed by ANSI Std. 239-18 298-102
NSN 7540-01-280-5500