paratransit transport in indonesia: characteristics and
TRANSCRIPT

Journal of the Eastern Asia Society for Transportation Studies, Vol.11, 2015
1346
Paratransit Transport in Indonesia: Characteristics and User Perceptions
Tri Basuki JOEWONO a, Djoen San SANTOSO b, Yusak O. SUSILO c
a Graduate Program, Parahyangan Catholic University, Bandung, Indonesia 40117; E-mail:
[email protected] b School of Engineering and Technology, Asian Institute of Technology,
Pathumthani 12120, Thailand; E-mail: [email protected] c Department of Transport Science, School of Architecture and the Built Environment, KTH
Royal Institute of Technology, 100 44 Stockholm, Sweden; E-mail: [email protected]
Abstract: Paratransit, well known as Angkutan Kota (Angkot) in Indonesia, has been a major
public transport mode in most developing countries. This mode offers public a frequent and
flexible service, regulated via a micro cooperation, and operated freely by individuals. The
study aims to elaborate the characteristics and user perceptions on the service attributes of
Angkot. Data was collected from three Indonesian major metropolitan areas: Bandung, Jakarta,
and Yogyakarta. Results show that Angkot has a specific market segment. Users experienced
that the services received less than their expectation. Security in using the mode has been the
priority concern for passengers in all three cities. Angkot shelters need to be improved,
organized, and maintained properly to provide acceptable service to passengers. Size and
economic development of a city may influence the level of service delivered by operators
and/or perceived by respondents.
Keywords: Paratransit; Angkot; Public transportation; Urban transportation; Service quality.
1. INTRODUCTION
The term of paratransit is a mix of two words, the Greek prefix 'para' (in the sense of beside,
or irregular) attached to the American term 'transit' (public transport, usually buses) (Silcock,
1981). Nowadays, the word of paratransit can be interpreted and applied to any form of public
transport which lies in the spectrum between conventional bus services and automobile
(Vuchic, 2007), where the difference manifests in terms of cost and quality of service
(Rimmer, 1980 in Loo, 2007). Since paratransit is not quite a full public transit, thus it has
some of the convenience features of private automobile operations (Grava, 2003). Flexibility
in routes, frequency, and fares are the important features of paratransit that differentiate it
from bus or rail services. In this article, the definition of paratransit will excludes shared taxi
types of operation and conventional taxis serving only single passengers or affinity groups.
Paratransit are typically available to everyone. Meanwhile, the term of paratransit in the US is
quite different, where it refers to demand responsive transport for specialized group of users
(see Grava, 2003 for more detail discussion).
Joewono and Kubota (2007a) used the term paratransit to refer to land based modes
owned and operated by private companies and individuals. It is known in Indonesia as
angkutan kota (Angkot) which is similar to jeepney in the Philippines, tuk-tuk and songtaew in
Thailand, dolmush in Istanbul, mammy wagons (converted trucks) and matatu (converted
vans) in some African countries. In many cities in Indonesia, Angkot uses local names and
refers to various types of cars, vans, and minibuses with a capacity of 12–16 seats. All of
these were referred as jitneys by Cervero (1998). In this article, the term of paratransit will be

Journal of the Eastern Asia Society for Transportation Studies, Vol.11, 2015
1347
used interchangeably with angkutan kota (Angkot), when it refers to the service in Indonesia.
There is a lifelong controversy about the role of Angkot in the transportation system. In
one side, Angkot has a main benefit, such as that Angkot provides affordable door-to-door
mobility services, especially for the poor or transportation disadvantaged people. Angkot
becomes an important feeder to other public transportation: public buses or rail. It also
expands the network of transportation, which is good for business and economic growth. The
system of Angkot is also able to run a lot of money from retribution or fee collected from each
unit operated paratransit. The operation of Angkot has also generated job opportunities for
people. In developed countries, such as Japan, where paratransit is not available,
transportation disadvantaged people can only rely on taxi as an alternative for travelling
besides non-motorized modes and public buses. Therefore, the option is very limited. This
shows the role of Angkot in helping mitigate or avoid social exclusion for transportation
disadvantaged people.
On the other hand, Angkot has been seen as a problem rather than a solution, since it
results traffic jam in many places as they frequently stop with very short distance in between.
In major metropolitan city in Indonesia, e.g. Jakarta and Bandung, this type of public
transport has been targeted to be replaced with more formal public transport such as bus or
bus rapid transit system, rather than to try to improve and better manage it (Joewono and
Kubota, 2007a). From the perspective of transit system, Vuchic (2005) stated that paratransit
does not represent a system that can be coordinated and upgraded by provision of transit lanes,
preferential signals, and higher-quality vehicles. Thus, its existence seems to be unsustainable
as a result of weak management, low government support, and competition with motorcycle.
Its sustainability may be questioned, i.e. in its ability to maintain its service in the future (to
win the competition with motorization, especially motorcycle), its feasibility in upgrading
financial and economic aspects, and its ability in adapting environmental (global warming)
and social change (globalization). Presumably, this is due to the authority’s lack of
understanding in the Angkot’s characteristics, system, and users’ needs, since at present the
paratransit are operated with very low intervention or help from the government. The
individual operation of Angkot rather than a formal business unit, which resulted in
competition among drivers or operators, implies the reason for informal style of service,
unregulated business, lack of coordination in service, or low service quality.
Studies about paratransit have been conducted in several countries. Silcock (1981)
studied paratransit in several developing countries in the era of 80s, while Lee (1989) and Loo
(2007) elaborated paratransit in Hong Kong. Regidor et al. (2009) discussed the
re-engineering of paratransit in the Philippines, while Thangphaisankun et al. (2010) studied
paratransit as the feeder system in Bangkok. Mateo-Babiano et al. (2011) elaborated the role
of paratransit as a potential component of the transport system in the drive towards climate
change adaptation. As a matter of fact, a study of Angkot in Indonesia is very limited with an
exception by Joewono and Kubota (2005) who described its operational characteristics.
Joewono and Kubota (2007abcd) also investigated in comprehensive way and using several
methods to elaborate the attributes to explained service quality and its causal relationship with
loyalty and other factors, such as negative experience. Tarigan et al. (2010) investigated the
causal relationship between negative experience and willingness to use paratransit. Li et al.
(2011) studied paratransit drivers’ stated job choice behaviour under various policy
interventions.
Even there are several studies regarding paratransit, discussions regarding its business
operation and its role in the transportation system in Indonesian cities are still rare.
Discussions are also needed to clarify the level of importance of paratransit services according
to the users, including clarifying the extent it is essential to different segments of society in

Journal of the Eastern Asia Society for Transportation Studies, Vol.11, 2015
1348
their daily life. Thus, the motivation of this research is to study the business operation and
characteristics of Angkot in the city of Bandung. Bandung is selected as a study location, as
more information regarding paratransit is available. Its number and business operation is also
able to represent Angkot in other cities in Indonesia. The objective of this study is to elaborate
the business operation of paratransit and to clarify the level of importance (as a way to
express the contribution) of the service of paratransit to the city’s transportation system as
well as to the specific segment of society. To present the level of importance of the service, an
exploration regarding the advantages and disadvantages of this mode based on evidence from
a primary data collection of the users and its users’ characteristics in three Indonesian major
metropolitan areas: Bandung, Jakarta, and Yogyakarta are employed.
A description of Angkot in Indonesia is provided in the next section. Then a discussions
regarding the characteristics, the system, and the users of Angkot will follow. Discussion
regarding the managerial transferability of Angkot and conclusion of study will close this
article.
2. ANGKOT AS PUBLIC TRANSPORTATION
Paratransit represents deliberate efforts to fill gaps in the transportation spectrum, and today
they are official modes under various governments and private programs (Grava, 2003). In
Indonesia, the advent of Angkot can be traced back to the early of this century. In the
beginning, it is non-motorized mode of transport, which provides service to the community.
As motorization was introduced, then this non-motorized gradually moved to motorized
vehicle. In the era of 60s, the automotive from Japan was introduced. It started the era of
motorization, which accelerated the existence of the service initiated by community.
Government provided service by providing more formal mode of transport (bus or rail). Small
car and non-motorized were left to the community. Thus, the existence of Angkot can be
judged as purely initiative of community, which in the last three decade the role of
cooperation becomes stronger. In fact, most developing countries have a variety of public
transport systems, where generally, that these systems have just grown, rather than resulting
from sophisticated transport plans (Silcock, 1981). Even it does not guarantee desirability in a
social context or ensure adequate standards of safety, the transport systems seem to perform
well with respect to local conditions and needs (Silcock, 1981).
Angkot is self-sustaining system. There are no government subsidies in any kind, except
that the government publishes the regulation and determine the fare. The government, i.e.
local government which is managed by Bureau of Road Traffic (DLLAJ), has several tasks,
such as to determine route and number of unit, to publish guidance to calculate fare and to
determine the fare, to collect retribution for using the terminal, or to collect retribution for
licensing. There is no systematic system to help the operation of Angkot, which places the
government as a regulator only without real support to improve the sustainability of
paratransit. Operators should manage and struggle to survive with their own capability.
Paratransit has flourished for a number of reasons (Iles, 2005), in term of vehicle,
operation and maintenance practice, cost, and driving skill. Paratransit is an answer to the
demand of mobility from the society. It emerges mostly in developing countries because of
incompetency and incapability of governments to provide necessary transportation services to
their people. Improper land use and transportation planning has made the situation worst.
The vehicles used as an Angkot, usually Japanese minibuses with typical capacity of
12-16 seats, are relatively easy to own. There are many dealers or retailers selling the product
around the city. In recent years, it is getting easier to find loan to buy a car from financial

Journal of the Eastern Asia Society for Transportation Studies, Vol.11, 2015
1349
institution with quite simple administration requirement and a long return period. A
permission or license from the cooperation is needed for the process.
Angkot operates individually and provides public passenger transportation with no
exclusive right-of-way. It has to mix with other road users, and with no fixed schedule
(Joewono and Kubota, 2007a). It operates without any coordination since its departure, in the
network, up to return to final destination. Usually they start their operation on 05.00 up to
18.00, while some of them have longer service period, i.e. up to 22.00.
There are specific terminals for Angkot at both ends of the designated route, which the
drivers need to follow from one end to another. However, there is always a bad apple in every
barrel so in some cases, drivers do not operate the vehicle until the end of the route. Angkot
does not have specific shelter for the users to wait then passengers can get on and get off in
anywhere along the route. Some group of drivers divide the route into several sub-routes that
makes the user have to transfer to another car and pay double. A practice in dividing official
route into sub-route or returning back without reaching final terminal is driver’s initiative as a
response to a fact of low passenger demand around the final terminal. Thus, driver will not
serve the area near the final terminal, especially in off-peak time (Menkimpraswil, 2002). This
practice increases the activity of informal shelter (i.e. places where Angkot waits passenger or
intersection between local and major road) and decrease the activity of formal final terminal.
Angkot is an efficient road travel mode, contributing only 18% of traffic flow but
transport more than 50% of passenger trips (Menkimpraswil, 2002). Although Angkot uses
roads efficiently, it creates congestion, as its units stop for access and egress anywhere, wait
for passengers, and make circular movements in dense areas. As Angkot stops practically
almost in every point and, additionally, there are seven routes of bus (DAMRI), unlicensed
Angkot, and deviation route (change the route that decided directly by the driver with and
without notification to passengers), the situation creates high density of public transport
service in this city. This deviation route is a driver’s decision to escape from traffic congestion,
or driver’s initiative to get wider catchment area and to collect more passenger. This high
density is also influenced by a current trend of traffic management in Bandung, i.e. one
direction in each road. It makes Angkot travels longer distance as they should travel in
one-directional traffic circulation. Average paratransit route length is 12.3 km with travel time
for round trip is 106 minutes. But, passenger usually travelled less than a half of the total
route length, i.e. 3.3 km with a variation between 1.3 up to 6 km. In the longest route (22 km),
passenger only travelled on average 2.5 km (Menkimpraswil, 2002).
3. METHOD OF DATA COLLECTION
In this part, the characteristics and perceptions of Angkot’s users in three cities (Jakarta,
Bandung, and Yogyakarta) are reported. Data was collected by distributing questionnaire.
These three cities represent metropolitan city, medium to large city, and small to medium city.
According to the National Census (BPS, 2010), number of population in 2010 in Jakarta,
Bandung, and Yogyakarta were 9.6 million, 2.4 million, and 0.4 million, respectively.
Population density of Jakarta, Bandung and Yogyakarta were around 78900, 13700 and 13300
inhabitants per square km, respectively.
Places of distribution were randomly selected to distribute the questionnaire and to
cover all possible users of public transportation modes under study, e.g. common meeting
places, terminals, stations, or bus stops. The respondents were limited to public transport users,
while public transport in this research refers to land-based public transport. The questionnaire
form and detailed questions can be found in Santosa et al. (2008).

Journal of the Eastern Asia Society for Transportation Studies, Vol.11, 2015
1350
After examining the completed questionnaires, the total numbers of valid questionnaires
that can be used for analysis are 494, 499, and 498 for Bandung, Jakarta and Yogyakarta,
respectively. From those numbers, the respondents who use Angkot as their main public
transport are 450, 217, and 182 for Bandung, Jakarta, and Yogyakarta. This statistic shows
that Angkot is dominant public transport in Bandung. From 494 respondents, 91.1% of them
are Angkot’s user, while taxi’s user and motorcycle taxi (ojek) are 3.2% and 2.6%, respectively.
Bus and other type of mode have very small share. In Yogyakarta, 182 out of 498 are Angkot’s
users. Bus is the dominant public transport with a share of 54.4%, while other modes of
transport have small share (less than 3%). In case of Jakarta, this city has more diverse mode
of transport. Angkot and bus are the dominant public transport with a share of 43.7% and
44.1%, respectively. Commuter rail and motorcycle taxi in Jakarta have very small share, i.e.
4.2% and 3.2%, respectively.
The questionnaire consists of fifty questions, which are contained in five parts, i.e.
respondent characteristics, usage of public transport, negative experiences while using public
transport, evaluation of service quality, and future situation of the mode. In the service quality
evaluation section, respondents were asked to rate aspects related to service quality based on
level of importance and level of satisfaction. For the level of importance, respondents could
choose highly important (1), important (2), not important (3), and absolutely not important (4).
The same weights of 1, 2, 3 and 4 were also assigned to satisfaction levels of very satisfied,
satisfied, not satisfied, and totally not satisfied, respectively. In the questions regarding
negative experiences, respondents were provided a rating from 1 to 4 to represent never,
sometime, frequent, and very often. Respondents were also asked to choose their preferences
regarding several situations of the mode: 1 represents preference to continue using the mode
and 2 represents preference to move to other mode.
4. DATA AND ANALYSIS
4.1 Sample Description
Discussion in the following section of this article will focus on the characteristics of Angkot’s
users and the evaluation of service quality.Users of Angkot in these three cities have similar
age, i.e. 18-29 years old (47-63%) and 17 years old or younger (14-34%). Female has bigger
proportion than male with a range of 54 to 66% in these three cities. Users are also single with
proportion around 80%. Family structure of the users is varied, where around 20 up to 40% of
them come from a family with a structure of couple and child. Around 50% of the respondents
are child in their family. The occupation of the users in Bandung and Yogyakarta are
dominated with student (around 70%), while in Jakarta the occupations are student (50%) and
working in private company (35%). Around 50% of the respondents have senior high school
as their highest education. It is interesting to note that 50% of respondent in Bandung and
around 66% of respondent in Jakarta and Yogyakarta did not own any driving license. Only
17% of respondent in Bandung have more than one type of driving license, while on the
contrary, only 6% and 3% of Angkot’s users have more than one of driving license. Detail
information regarding users’ demographic characteristics is presented in Table 1.
In terms of economic characteristics (Table 2), users in Yogyakarta have smaller
monthly income or stipend, where 64% of the users in Yogyakarta have less than a half
million rupiah. As information, the minimum average wage in Indonesian cities is one million
rupiah. In Bandung and Jakarta, around 60% of respondent have monthly income or stipend
less than one million rupiah. On the other side, only 7.7% of users in Yogyakarta have

Journal of the Eastern Asia Society for Transportation Studies, Vol.11, 2015
1351
monthly salary or stipend in a range of 2.5-5 million rupiah, while the same range is
possessed by 7 % (Bandung) and 11% (Jakarta). The allocation for monthly transport cost is
dominated by maximum 30%. Around 20% of them spend more than 30% of their monthly
income for transport. Users in Yogyakarta allocate less when compared to the other two cities.
Allocation as much as 30% is spent by around 30% of respondent in each city.
In general, users reside in home, which is owned by their parents (around 50%). It is
followed with 30% of them stay in rent house or dorm. It is in line with car ownership. 43%
of users in Bandung and 61% of users in Jakarta did not own any car in their household, while
it is found in 80% of users in Yogyakarta. The proportions of users who have one unit are
34%, 27%, and 17%, for Bandung, Jakarta, and Yogyakarta, respectively. Again, Yogyakarta
has smallest proportion. Different situation exists in the ownership of motorcycle. Similar
proportion (40%) of the users has one motorcycle in their household. Users in Yogyakarta
tend to have more motorcycle or non-motorized vehicle compared to the other two cities.
Around 43% of users in Bandung and Jakarta did not own any NMT, while 29% of them are
found in Yogyakarta. Detail description for each economic aspect is provided in Table 2.
Table 1. Descriptive statistics of demographic characteristics of paratransit’s users
Characteristics Proportion (%)*
Bandung Jakarta Yogyakarta
Age
17 years old or younger 21.3 14.3 33.5
18 - 29 years old 59.3 63.1 47.3
30 - 39 years old 7.8 11.1 9.9
40 - 49 years old 5.3 8.3 4.9
50 - 65 years old 5.8 3.2 3.3
65 years old or older 0.4 0.0 1.1
Gender Female 53.6 59.9 65.9
Male 46.2 40.1 34.1
Marital Status Single 79.8 77.4 80.2
Married 19.8 22.6 19.8
Family Structure
Alone 18.0 17.1 18.7
Couple without child 2.4 5.1 1.6
Couple with child 41.1 20.3 36.8
Couple with parents without child 2.4 2.3 1.1
Couple with parents with child 10.2 9.2 11.5
Living with friend or relative 13.1 13.8 18.1
Other 12.7 32.3 12.1
Role in family
Husband 8.4 9.2 8.8
Wife 11.8 11.5 11.5
Child 57.6 58.5 51.1
Relative 7.3 11.1 9.9
Other 14.9 9.7 18.1
Occupation
Student 67.1 50.2 70.9
Civil servant / military 3.3 1.4 3.8
Private company 16.4 34.6 9.9
Entrepreneur 5.3 9.2 11.0
Housewife 6.9 3.2 3.3
Retired/other 0.9 1.4 1.1
Highest Education
Elementary or less 2.7 4.1 8.8
Junior high school 15.8 11.5 25.3
Senior high school 58.2 48.4 50.5
Diploma 9.6 9.7 4.9
Undergraduate 13.6 24.9 10.4
Graduate 0.2 1.4 0.0
Driving License Did not own any 50.4 65.4 67.6

Journal of the Eastern Asia Society for Transportation Studies, Vol.11, 2015
1352
ownership License for small car 14.0 11.5 3.3
License for bus/truck 0.4 0.0 2.7
License for motorcycle 17.8 16.6 23.1
More than one type 17.3 6.5 3.3
*the total proportion may not be equal to 100% as a result of the existence of missing value.
Table 2. Descriptive statistics of economic characteristics of paratransit’s users
Characteristics Proportion (%)
Bandung Jakarta Yogyakarta
Monthly income
million IDR (1 USD equals to 9,666
IDR at the time of study)
Less than 0,5* 27.3 34.1 64.3
0.5 - 1 38.9 29.0 24.2
1 - 2.5 26.0 24.4 7.7
2.5 - 5 6.9 10.6 2.2
5 - 7.5 0.2 0.9 0.5
7.5 – 10 0.4 0.9 0.5
10 - 12.5 0.0 0.0 0.5
12.5 - 15 0.2 0.0 0.0
Allocation for
monthly transport cost
less than 10% 27.8 21.7 34.1
11% - 20% 33.6 31.3 30.2
21 % - 30% 23.6 22.1 11.5
31% - 40% 9.8 15.2 13.7
more than 40% 5.3 9.7 9.9
House ownership
Owned by him/herself 15.1 13.8 12.1
Rent 28.0 27.6 30.8
Owned by parent 52.9 53.0 46.2
Owned by relative 3.1 5.5 9.3
Owned by friend .2 0.0 0.0
Other .7 0.0 1.6
Car ownership
Did not own any car 43.1 60.8 80.2
One car 33.8 27.2 16.5
Two cars 15.8 10.1 3.3
Three cars or more 7.1 1.8 .0
Motorcycle
ownership
Did not own any motorcycle 30.0 30.4 21.4
One motorcycle 43.8 41.9 42.9
Two motorcycles 17.8 20.3 30.8
Three motorcycles or more 8.4 7.4 4.9
NMT ownership
Did not own any 42.7 44.2 28.6
One unit 36.9 38.7 42.9
Two units 17.1 11.1 19.2
Three units or more 3.3 6.0 9.3
*the total proportion may be not equal to 100% as a result of the existence of missing value.
4.2 Travel Characteristic
Angkot is a favourable mode for users (around 60% of respondent) with studying as their
main trip purpose for respondent in Bandung and Yogyakarta as shown in Figure 1. Working
and studying is the reason for selecting Angkot for respondent in Jakarta each with similar
percentage (around 40%). Other types of purpose have small percentage (less than 10%) in
these three cities. In Figure 2, it can be observed that frequency of using Angkot per day in
weekday is dominated by two times per day (around 50%), while frequency per week in
weekday is three times or more (around 70%). This finding appears in all three cities, where it
shows that they use Angkot for daily use. On weekend, the frequency distribution seems to
vary from not using at all up to three times or more per day, with not using the mode as the

Journal of the Eastern Asia Society for Transportation Studies, Vol.11, 2015
1353
dominant share for all three cities. This indicates that paratransit is mainly used for weekday
activities.
Figure 1. Trip purpose using paratransit in three cities
The unavailability of automobile in household is the main reason for selecting Angkot,
where it is the case for these three cities with similar percentage. The reason of cost, where
Angkot is perceived as cheaper than other mode, is the second reasons to select in Jakarta.
Practically in using the service is the second reason for users in Bandung and Yogyakarta. The
speed of Angkot is the last reasons to select in each city (less than 3%). On the other hand, the
reason of weather is the main reason for rejecting Angkot in Bandung and Yogyakarta.
Respondents in Jakarta report that the main reason for not selecting Angkot is the
un-convenience of the service. Traffic condition is the reason for not selecting it by 21%, 24%,
and 12% of respondent in Bandung, Jakarta, and Yogyakarta, respectively.
4.3 Perception on current condition and services
In this study, respondents were asked to rate fifteen aspects of Angkot’s service quality. The
ratings were based on two different levels, i.e. level of importance and level of satisfaction.
Table 3 presents descriptive statistics of rating based on level of importance from three cities.
In the city of Yogyakarta, respondent mostly perceived the aspects are important to very
important. Similar findings can be found in the City of Jakarta or Bandung.
Security in car is perceived to the most important aspect of Angkot for all three cities.
The mean values of this aspect can be easily noticed, as the difference is quite large even to
the second rank. News about crime inside Angkot can be read on daily basis. However, less
has been done to improve this security. Ad hoc actions from government can be read when
serious crime was on the news but no continuous supervision and strict regulation to prevent
crimes from happening. Government should have more attention on this important issue, not
only in the car but also security in shelters. This shelter’s security was ranked second in
Bandung and Jakarta. However, Yogyakarta’s respondents were more concerned about
driver’s skill than shelter’s security, may be due to different size and economic development.

Journal of the Eastern Asia Society for Transportation Studies, Vol.11, 2015
1354
(a) Number of usage per day
in weekday
(b) Number of usage per
week in weekday
(c) Number of usage per day
in weekend
Figure 2. Number of paratransit’s usage in three cities
Journal of the Eastern Asia Society for Transportation Studies, Vol.11, 2015
1355
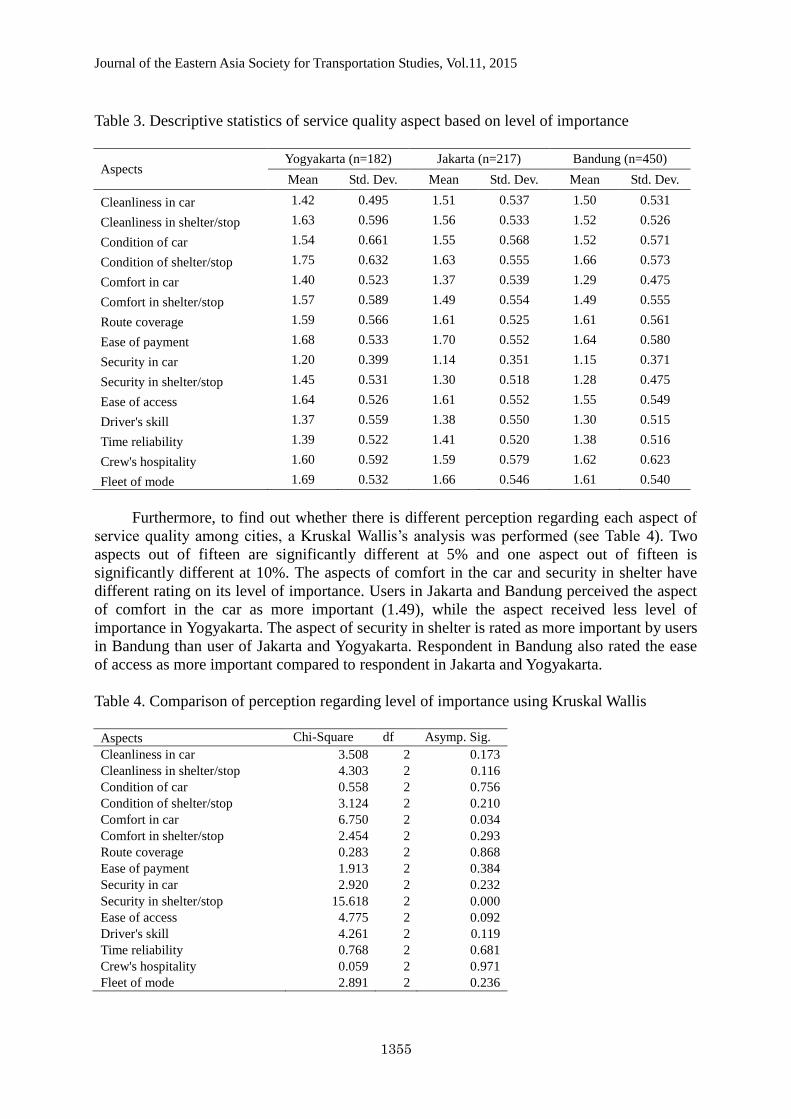
Table 3. Descriptive statistics of service quality aspect based on level of importance
Aspects Yogyakarta (n=182) Jakarta (n=217) Bandung (n=450)
Mean Std. Dev. Mean Std. Dev. Mean Std. Dev.
Cleanliness in car 1.42 0.495 1.51 0.537 1.50 0.531
Cleanliness in shelter/stop 1.63 0.596 1.56 0.533 1.52 0.526
Condition of car 1.54 0.661 1.55 0.568 1.52 0.571
Condition of shelter/stop 1.75 0.632 1.63 0.555 1.66 0.573
Comfort in car 1.40 0.523 1.37 0.539 1.29 0.475
Comfort in shelter/stop 1.57 0.589 1.49 0.554 1.49 0.555
Route coverage 1.59 0.566 1.61 0.525 1.61 0.561
Ease of payment 1.68 0.533 1.70 0.552 1.64 0.580
Security in car 1.20 0.399 1.14 0.351 1.15 0.371
Security in shelter/stop 1.45 0.531 1.30 0.518 1.28 0.475
Ease of access 1.64 0.526 1.61 0.552 1.55 0.549
Driver's skill 1.37 0.559 1.38 0.550 1.30 0.515
Time reliability 1.39 0.522 1.41 0.520 1.38 0.516
Crew's hospitality 1.60 0.592 1.59 0.579 1.62 0.623
Fleet of mode 1.69 0.532 1.66 0.546 1.61 0.540
Furthermore, to find out whether there is different perception regarding each aspect of
service quality among cities, a Kruskal Wallis’s analysis was performed (see Table 4). Two
aspects out of fifteen are significantly different at 5% and one aspect out of fifteen is
significantly different at 10%. The aspects of comfort in the car and security in shelter have
different rating on its level of importance. Users in Jakarta and Bandung perceived the aspect
of comfort in the car as more important (1.49), while the aspect received less level of
importance in Yogyakarta. The aspect of security in shelter is rated as more important by users
in Bandung than user of Jakarta and Yogyakarta. Respondent in Bandung also rated the ease
of access as more important compared to respondent in Jakarta and Yogyakarta.
Table 4. Comparison of perception regarding level of importance using Kruskal Wallis
Aspects Chi-Square df Asymp. Sig.
Cleanliness in car 3.508 2 0.173
Cleanliness in shelter/stop 4.303 2 0.116
Condition of car 0.558 2 0.756
Condition of shelter/stop 3.124 2 0.210
Comfort in car 6.750 2 0.034
Comfort in shelter/stop 2.454 2 0.293
Route coverage 0.283 2 0.868
Ease of payment 1.913 2 0.384
Security in car 2.920 2 0.232
Security in shelter/stop 15.618 2 0.000
Ease of access 4.775 2 0.092
Driver's skill 4.261 2 0.119
Time reliability 0.768 2 0.681
Crew's hospitality 0.059 2 0.971
Fleet of mode 2.891 2 0.236

Journal of the Eastern Asia Society for Transportation Studies, Vol.11, 2015
1356
Based on level of satisfaction, the users in these three cities have similar trend that they
were more concerned about the satisfaction than importance (see Table 5). It shows a gap
between the level of importance and level of satisfaction for the aspects of service quality. It
means users gave a high expectation on the aspects of service quality but they experience
something that gave them dissatisfaction. It is interesting to note that users in Bandung gave a
rating as more dissatisfied than users in the other two cities.
Contrast with the result of comparison based on level of importance, the comparison
among cities based on level of satisfaction results only three out of fifteen aspects are
experienced as not different (see Table 6). The three aspects, which are experienced as not
difference, are condition of car, ease of access, and fleet of the mode. It means twelve aspects
are experienced differently among users in Bandung, Jakarta, and Yogyakarta.
Table 5. Descriptive statistics of service quality aspect based on level of satisfaction
Aspects Yogyakarta (n=182) Jakarta (n=217) Bandung (n=450)
Mean Std. Dev. Mean Std. Dev. Mean Std. Dev.
Cleanliness in car 2.65 0.755 2.75 0.728 2.79 0.555
Cleanliness in shelter/stop 2.65 0.718 2.82 0.753 2.97 0.626
Condition of car 2.67 0.773 2.73 0.742 2.65 0.620
Condition of shelter/stop 2.55 0.694 2.78 0.692 2.90 0.615
Comfort in car 2.55 0.776 2.68 0.786 2.77 0.666
Comfort in shelter/stop 2.54 0.717 2.74 0.738 2.87 0.621
Route coverage 2.28 0.668 2.41 0.696 2.46 0.636
Ease of payment 2.25 0.639 2.37 0.654 2.60 0.677
Security in car 2.46 0.748 2.72 0.859 2.65 0.704
Security in shelter/stop 2.44 0.701 2.82 0.784 2.77 0.669
Ease of access 2.37 0.684 2.34 0.649 2.33 0.577
Driver's skill 2.32 0.703 2.49 0.752 2.67 0.702
Time reliability 2.75 0.781 2.74 0.745 2.88 0.738
Crew's hospitality 2.33 0.698 2.66 0.760 2.74 0.676
Fleet of mode 2.37 0.700 2.43 0.677 2.36 0.580
Table 6. Comparison of perception regarding level of satisfaction using Kruskal Wallis
Aspects Chi-Square df Asymp. Sig.
Cleanliness in car 5.876 2 0.053
Cleanliness in shelter/stop 30.362 2 0.000
Condition of car 2.205 2 0.332
Condition of shelter/stop 37.813 2 0.000
Comfort in car 11.871 2 0.003
Comfort in shelter/stop 29.876 2 0.000
Route coverage 9.201 2 0.010
Ease of payment 38.756 2 0.000
Security in car 13.654 2 0.001
Security in shelter/stop 38.943 2 0.000
Ease of access 0.567 2 0.753
Driver's skill 31.639 2 0.000
Time reliability 6.486 2 0.039
Crew's hospitality 41.993 2 0.000
Fleet of mode 2.374 2 0.305

Journal of the Eastern Asia Society for Transportation Studies, Vol.11, 2015
1357
Figure 3. Negative experiences in using paratransit in three cities

Journal of the Eastern Asia Society for Transportation Studies, Vol.11, 2015
1358
Besides exploration regarding users’ perception on the aspects of service quality, this
study also explores the negative experiences when using the mode (see Figure 3). Around
35% of users in Yogyakarta experiences long waiting time in several times, while 41%
experienced it as frequent. Users in Bandung seem to have higher negative experience in
waiting than others, with Jakarta in the second place. Similar pattern with the experience of
long waiting time appear in the aspect of lateness. The pattern of experiencing accident also
appears in the experience of loss of belonging, where it exists in three cities. Most of the users
never experiencing accident or loss of belonging, while most of them just sometime
experiencing them.
Negative experience about payment and information has a similarity, where it also
appears in these three cities. Around 50% of users sometimes have negative experience about
payment or difficulty in information. The possible reason for this finding is they are frequent
users in this system. This also appears as a reason for users in Bandung, Jakarta, and
Yogyakarta in experiencing the difficulty in service, such as not operating as there is a strike,
or they should transfer several times as the route did not connect very well.
It is important to observe that only one out of seven is significantly not different among
these three cities. Thus, six aspects are significantly different among cities at 5%. Detail
analysis results are provided in Table 7.
Table 7. Comparison of perception regarding negative experience using Kruskal Wallis
Aspects Chi-Square df Asymp. Sig.
Waiting 27.813 2 0.000
Lateness 12.152 2 0.002
Accident 3.200 2 0.202
Loss of belonging 6.955 2 0.031
Payment 19.068 2 0.000
Information 9.937 2 0.007
Difficulty in service 29.626 2 0.000
5. CONCLUSIONS
This article reports the characteristics of paratransit, which is well known as Angkutan Kota
(Angkot) and the users of Angkot from three cities. Angkot has flexibility in operation time,
where the number of unit operated in route, route coverage, and fare per kilometres has been
regulated by government. In practice, there is flexibility also in fare payment and route. This
system is self-sustaining, where there are almost no government supports. The owners and
drivers should struggle to survive by racing in road to get passenger, and personally adjust the
standard of maintenance. In long term, the existence of this mode become harder as they have
to compete with the growth of motorization, especially motorcycle.
Data were collected from three cities in Indonesia: Yogyakarta, Bandung, and Jakarta to
examine the users and travel characteristics of Angkot in these three cities. Perceptions on the
level of service based on importance and satisfactions were inquired. Negative experience
faced by users when using this service was also explored in the study.
Users of Angkot can be categorized as a young age group, who are student or young
professional. They use Angkot for daily usage in fulfilling mobility for working or studying.
Therefore, during weekend, less of them who use Angkot for their weekend activities,
probably they shift to another mode more convenient for family/group travel.
From fifteen aspects of Angkot, all have been identified to be important aspects for

Journal of the Eastern Asia Society for Transportation Studies, Vol.11, 2015
1359
passengers. Security in Angkot is ranked first for all three cities with outstanding mean value,
even when compared with the second important rank. In general, respondents in the three
cities equally perceived the importance of the attributes. The situation is on the opposite side
for satisfaction level, where only three aspects were similarly perceived among the three cities.
On the whole, respondents agreed that none of the aspects is satisfactory with respondents in
Yogyakarta relatively perceived to be less dissatisfied to the attributes may be due to the
different size and economic development of the city compared to Bandung and Jakarta.
Respondents in Jakarta and Bandung indicated similar opinions on the worst performance of
attributes, which do not have the same degree as perceived by respondents in Yogyakarta.
Perceptions on the negative experiences also support this notion.
As the success of the provision of public transport depends largely on the acceptance of
the market, thus a deep knowledge regarding the behaviour and attitude of users, in term of
travel and using public transport will increase the users’ loyalty. Flexibility and level of
adaptation of this mode in transportation system depends on how the service matches with the
local construct, which may be defined by the size and level of economic development of the
city. It also means that proposing service should consider the regulatory regime in local area.
In developing countries, where the system has not been working well, the introduction of
strict, inclusive, and transparent regulations become important.
The operation of paratransit needs to be planned to contribute to the objective of the
provision of public transport, i.e. in increasing accessibility for all people in the city and
providing mobility for all. It implies the potential contribution of paratransit to public
transport system in urban area. The potential contribution can generate positive impact when
the operation is planned with correct understanding to the unique characteristics of paratransit.
The flexible nature of paratransit service should be placed correctly according to the hierarchy
of service to produce integrated public transport services. It means paratransit should not be
placed at major or arterial road with high demand. With its characteristics, it is more
appropriate to operate paratransit in local or collector road, where paratransit can act as a
feeder to main service, or as a local mode in neighbourhood area. Understanding of the
characteristics and placing correctly the service will ensure positive impact, i.e. sustainability
and integrative public transport services in urban area. This kind of recommendation will not
produce a positive impact when there is no improvement in the business operation of the
mode. Individual operation paratransit, as exists at present, needs for adjustment by
introducing business unit rather than individual. Converting paratransit from individual to
business unit will provide many positive impacts as it is easier to manage and organize.
ACKNOWLEDGMENT
The authors express their thanks to the Ministry of Research and Technology, Republic of
Indonesia, for providing research fund through the Incentive Program for Applied Research
(Program Insentif Riset Terapan). This article is a part of the research project, i.e. The
Development of Transportation Policies based on Travel Behavior to Increase the Usage of
Public Transportation in Indonesia (Pengembangan Kebijakan Transportasi Berbasis Perilaku
Pelaku Perjalanan untuk Meningkatkan Penggunaan Angkutan Umum di Indonesia). The
authors also express their appreciation to Prof. Wimpy Santosa for providing permission to
use the data.
REFERENCES

Journal of the Eastern Asia Society for Transportation Studies, Vol.11, 2015
1360
BPS (Badan Pusat Statistik) (2009) Number of motor vehicle by types in Indonesia, Online,
http://dds.bps.go.id/eng/tab_sub/view.php?tabel=1&daftar=1&id_subyek=17¬ab=12
Accessed 20 October 2011
BPS (Badan Pusat Statistik) (2010) Sensus Penduduk Nasional, Online
http://sp2010.bps.go.id/ Accessed 11 July 2015.
Cervero, R. (1998) The transit metropolis: a global inquiry. Island Press, Washington, DC
DLLAJ (Traffic and Road Transport Agency) (2001) The guide of passenger public
transportation price calculation with fixed routes in urban areas, West Java, Bandung (In
Indonesian)
Grava, S. (2003) Urban transportation system: choices for communities, McGraw-Hill, New
York
Ileas, R. (2005) Public transport in developing countries, Elsevier, Amsterdam.
Joewono, T.B., and Kubota, H. (2005) The characteristics of paratransit and non-motorized
transport in Bandung, Indonesia. Journal of the Eastern Asia Society for Transportation
Studies 6, 262–277
Joewono, T.B., Kubota, H., (2007a) User satisfaction with paratransit in competition with
motorization in indonesia: anticipation of future implications. Transportation 34, 337–354
Joewono, T.B, Kubota, H. (2007b) Exploring negative experiences and user loyalty in
paratransit, Transportation Research Record, No. 2034, 134-142.
Joewono, T.B., Kubota, H. (2007c) User perceptions of private paratransit operation in
Indonesia, Journal of Public Transportation, Vol. 10, No. 4. 99-118
Joewono, T.B., Kubota, H. (2007d) The multigroup analysis regarding user perception of
paratransit service, Journal of the Eastern Asia Society for Transportation Studies, Vol. 7,
1651-1663.
Kaltheier, R.M. (2002) Urban Transport and Poverty in Developing Countries: Analysis and
Options for Transport Policy and Planning, Deutsche Gesellschaft für Technische
Zusammenarbeit (GTZ) GmbH, Eschborn.
Lee, E.S.W. (1989) Planning and control of paratransit services in Hong Kong, Transport
Reviews 9:4, 279 — 303
Li, G., Zhang, J., Nugroho, S.B., Linh, T.N., Fujiwara, A., (2011) Analysis of paratransit
drivers’ stated job choice behaviour under various policy interventions incorporating the
influence of captivity: a case study in Jabodetabek metropolitan area, Indonesia,
Proceedings of the Eastern Asia Society for Transportation Studies, Vol.8, 2011
Loo, B.P.Y. (2007) The role of paratransit: some reflections based on the experience of
resident’s coach services in HongKong, Transportation 34, 471-486
Mateo-Babiano, I.B., Susilo, Y.O., Guillen, M.D.V., Joewono, T.B. (2011) Indigenous
transport futures: a strategy for Asian cities toward climate change adaptation, Proceedings
of the Eastern Asia Society for Transportation Studies Vol.10
Midgley, P. (1994) Urban transport in Asia: an operational agenda for the 1990s, World Bank
Technical Paper Number 224, Asia Technical Department Series, Washington, D.C.
Ministry of Settlement and Regional Infrastructure (Menkimpraswil) (2002) The refinement
and the implementation of urban public transport policies (UPTP) in Bandung, Final
Report. (The Louis Berger Group, Inc. and Eskapindo Matra C.V.), Bandung
Regidor, J.R.F., Vergel, K.N., Napalang, M.S. (2009) Environment friendly paratransit:
re-engineering the jeepney, Proceedings of the Eastern Asia Society for Transportation
Studies Vol. 7
Rimmer, (1980) Paratransit: a commentary, Environmental Planning A 12:8, 937-944.
Santosa, W., Joewono, T.B., Susilo, Y.O. (2008) Pengembangan Kebijakan Transportasi

Journal of the Eastern Asia Society for Transportation Studies, Vol.11, 2015
1361
Berdasarkan Perilaku Pelaku Perjalanan Dalam Rangka Meningkatkan Pengunaan
Transportasi Publik di Indonesia. Kementrian Riset dan Teknologi, Jakarta, Republik
Indonesia. (in Indonesian)
Silcock, D.T. (1981) Urban paratransit in the developing world, Transport Reviews 1: 2,
151-168
Susilo, Y.O., Joewono, T.B., Santosa, W., Parikesit, D. (2007) A reflection of motorization and
public transport in Jakarta Metropolitan Area. Journal of International Association of
Traffic and Safety Sciences (IATSS) Research Vol. 31, No. 1, 59-68.
Tarigan, A. K. M., Susilo, Y. O. , Joewono, T. B. (2010) Negative experiences and willingness
to use paratransit in Bandung, Indonesia: An exploration with ordered probit model,
Compendium of Papers CD-ROM, the 89th Annual Meeting of the Transportation
Research Board, Washington, D.C., January 10-14
Thangphaisankun, A., Nakamura, F., Okamura, T. (2010) Influences of paratransit as a feeder
of mass transit system in developing countries based on commuter satisfaction, Journal of
Eastern Asia Society for Transportation Study 8, 1341- 1356
The Government of Republic of Indonesia (2009) Law No 22 Year 2009 regarding road traffic,
Jakarta.
Vuchic, V.R. (2005) Urban transit: operations, planning, and economics, John Wiley & Sons,
Inc., New Jersey
Vuchic, V.R. (2007) Urban transit: systems and technology, John Wiley & Sons, Inc., New
Jersey