parcc results · 3rd 4th 5th 6th 7th 8th alg i geom alg ii. comparison of west milford’s 2015...
TRANSCRIPT

PARCC Results:Spring 2018
Administrations
West Milford TownshipOctober 3, 2018
Measuring College and Career Readiness
1

2
FOUR YEAR PARCC DATA – ELA% OF STUDENTS SCORING 4 OR 5

3
FOUR YEAR PARCC DATA – ELA% OF STUDENTS SCORING 4 OR 5
20.00%
25.00%
30.00%
35.00%
40.00%
45.00%
50.00%
55.00%
60.00%
65.00%
2015 2016 2017 2018
3rd 4th 5th 6th 7th 8th 9th 10th 11th

Math 2015 2016 2017 2018 Change
3rd 51.8 58.3 56.9 60.4 +8.6%
4th 35.3 52.3 49.0 49.6 +14.3%
5th 29.2 45.7 47.3 44.8 +15.6%
6th 40.8 42.0 41.4 41.5 +0.7%
7th 24.2 28.7 31.7 34.1 +9.9%
8th 9.8 17.6 14.8 20.8 +11.0%
Alg. I 25.1 29.1 23.5 31.0 +5.9%
Geom. 15.3 21.3 14.4 16.2 +0.9
Alg. II 24.2 22.4 30.4 20.8 -3.4%
4
FOUR YEAR PARCC DATA – MATH% OF STUDENTS SCORING 4 OR 5

5
FOUR YEAR PARCC DATA – MATH% OF STUDENTS SCORING 4 OR 5
5.00%
15.00%
25.00%
35.00%
45.00%
55.00%
65.00%
2015 2016 2017 2018
3rd 4th 5th 6th 7th 8th Alg I Geom Alg II

Comparison of West Mi l ford’s 2015 – 2018PARCC Administrat ions
Engl ish Language Arts - Percentages
GradeLevel 1 2015
Level 1 2018
Level 2 2015
Level 22018
Level 42015
Level 42018
Level 52015
Level 52018
Change in Level 1 and 2 2015 to 2018
Change in Level 4 and 5
2015 to 2018**
3 6.7 3.5 14.3 12.4 47.3 52.7 3.6 6.6 -5.1 +8.4
4 6.8 3.6 13.7 8.7 39.0 47.6 9.8 15.5 -8.2 +14.3
5 3.9 6.9 15.7 9.0 47.5 50.2 0.5 4.9 -3.7 +7.1
6 5.2 5.2 8.8 9.3 54.1 48.8 4.1 6.9 +0.5 -2.5
7 13.5 5.2 19.7 12.7 32.0 39.7 6.2 18.3 -15.3 +19.8
8 11.9 4.0 15.5 9.3 39.9 41.7 9.3 18.2 -14.1 +10.7
9 22.5 6.8 26.5 16.1 26.5 36.5 7.9 10.4 -26.1 +12.5
10 42.5 18.5 20.4 17.3 20.4 31.7 3.5 10.3 -27.1 +18.1
11* 17.3 30.7 16.3 14.9 37.8 26.0 10.2 3.3 +12.0 -18.7*Grade 11 does not include students who took an AP/IB test.Notes: Percentages may not total 100 due to rounding.- The plus sign (+) indicates an increase of the % change from the previous year where a minus sign (-) arrow shows a decrease of the % change from the previous year. 6

Comparison of West Mi l ford’s 2015 – 2018PARCC Administrat ions
Mathematics - Percentages
GradeLevel 1 2015
Level 1 2018
Level 2 2015
Level 22018
Level 42015
Level 42018
Level 52015
Level 52018
Change in Level 1 and 2 2015 to 2018
Change in Level 4 and 5
2015 to 2018**
3 3.1 1.3 15.2 11.9 47.8 49.8 4.0 10.6 -5.1 +8.6
4 3.9 4.7 28.4 15.7 32.4 45.3 2.9 4.3 -11.9 +14.3
5 4.0 6.1 25.2 18.0 28.2 42.4 1.0 2.4 -5.1 +15.6
6 5.2 3.6 17.0 18.5 38.7 39.1 2.1 2.4 -0.1 +0.7
7 11.2 6.0 25.8 17.9 23.6 31.7 0.6 2.4 -13.1 +9.9
8* 24.2 18.2 32.6 22.4 9.8 20.3 0.0 0.5 -16.2 +11.0
ALG I 16.6 8.3 27.4 32.1 25.1 29.8 0.0 1.2 -3.6 +5.9
GEO 18.9 11.9 45.0 43.1 15.3 15.4 0.0 0.8 -8.9 +0.9
ALG II 21.2 26.6 19.7 25.9 22.7 20.1 1.5 0.7 +11.6 -3.4*Approximately 30,000 New Jersey students in grade 8 participated in the PARCC Algebra I assessment. Thus, PARCC Math 8 outcomes are not representative of grade 8 performance as a whole. **Level 4 and Level 5 is an indication a student is on pace to be college and career ready.Notes: Data shown is preliminary. Percentages may not total 100 due to rounding.ALG 1 Is Algebra 1; GEO is Geometry; ALG II is Algebra 2.
7

Number of Students Tested Spr ing 2015 & Spr ing 2018 PARCC Administrat ions
Engl ish Language Arts/L iteracy
Grade Students Tested 2015 Students Tested 2018Difference between number of
students tested in 2015 and 2018
3 224 226 +2
4 205 252 +47
5 204 245 +41
6 194 248 +54
7 178 252 +74
8 193 247 +54
9 151 249 +98
10 113 243 +130
11* 98 215 +117
TOTAL 1560 2177 +617*Grade 11 does not include students who took an AP/IB test.Note: “Students Tested” represents individual valid test scores for English Language Arts/Literacy.
8

Number of Students TestedSpr ing 2015 & Spr ing 2018 PARCC Administrat ions
Math emat ics
Grade Students Tested 2015 Students Tested 2018Difference between number of
students tested in 2015 and 2018
3 224 227 +3
4 204 254 +50
5 202 245 +43
6 194 248 +54
7 178 252 +74
8* 132 192 +60
Algebra I 175 252 +77
Geometry 111 253 +142
Algebra II 66 139 +73
TOTAL 1486 2062 +576*Some students in grade 8 participated in the PARCC Algebra I assessment in place of the 8th grade Math assessment. Thus, PARCC Math 8 outcomes are not representative of grade 8 performance as a whole.Notes: “Students Tested” represents individual valid test scores for Mathematics.
9

Comparison of West Mi l ford’s Sp r in g 2018 PARCC Ad min ist rat ion s
En g l ish Lan gu age Arts/L i te racy to New J e rseyPe rc entages fo r 2018
Grade Level 1, District
Level 1, State
Level 2, District
Level 2, State
Level 3, District
Level 3, State
Level 4, District
Level 4, State
Level 5, District
Level 5, State
3 3.5 13.5 12.4 13.5 24.8 21.4 52.7 43.5 6.6 8.1
4 3.6 7.6 8.7 12.3 24.6 22.1 47.6 39.1 15.5 18.9
5 6.9 6.9 9.0 12.6 29.0 22.4 50.2 47.2 4.9 10.8
6 5.2 6.2 9.3 13.6 29.8 24.0 48.8 41.3 6.9 14.9
7 5.2 8.6 12.7 10.2 24.2 18.5 39.7 34.1 18.3 28.6
8 4.0 8.7 9.3 11.1 26.7 19.8 41.7 39.9 18.2 20.4
9 6.8 12.3 16.1 12.5 30.1 21.1 36.5 38.0 10.4 16.1
10 18.5 18.3 17.3 12.8 22.2 19.0 31.7 31.8 10.3 18.1
11* 30.7 23.1 14.9 16.6 25.1 22.2 26.0 29.1 3.3 9.0
*Grade 11 does not include students who took an AP/IB test.Notes: Percentages may not total 100 due to rounding.
10

Comparison of West Mi l ford’s Spr ing 2018 PARCC Admin ist rat ions
Math emat ics to New J e rsey Pe rc entages fo r 2018
Grade Level 1, District
Level 1, State
Level 2, District
Level 2, State
Level 3, District
Level 3, State
Level 4, District
Level 4, State
Level 5, District
Level 5, State
3 1.3 8.0 11.9 15.3 26.4 23.7 49.8 37.8 10.6 15.2
4 4.7 7.5 15.7 16.8 29.9 26.3 45.3 41.8 4.3 7.6
5 6.1 7.5 18.0 17.0 31.0 26.7 42.4 38.5 2.4 10.4
6 3.6 8.5 18.5 20.1 36.3 27.9 39.1 35.6 2.4 8.0
7 6.0 7.7 17.9 20.3 42.1 28.6 31.7 36.0 2.4 7.4
8* 18.2 22.0 22.4 22.7 38.5 27.1 20.3 27.2 0.5 1.0
Algebra I 8.3 11.3 32.1 18.6 28.6 24.3 29.8 39.3 1.2 6.5
Geometry 11.9 9.4 43.1 31.5 28.9 29.6 15.4 24.6 0.8 4.9
Algebra II 26.6 31.0 25.9 22.4 26.6 18.0 20.1 24.6 0.7 4.0
*Some students in grade 8 participated in the PARCC Algebra I assessment in place of the 8th grade Math assessment. Thus, PARCC Math 8 outcomes are not representative of grade 8 performance as a whole.Notes: Percentages may not total 100 due to rounding.
11

Comparison of Apshawa’sSpr ing 2018 Administrat ion
Engl ish Language Arts/L iteracy to West Mil ford’s Percentages in 2018
GradeLevel 1, School
Level 1, District
Level 2, School
Level 2,District
Level 3, School
Level 3, District
Level 4, School
Level 4, District
Level 5, School
Level 5, District
3 4.0 4.0 16.0 12.0 16.0 25.0 52.0 53.0 12.0 7.0
4 7.0 4.0 9.0 9.0 40.0 25.0 35.0 48.0 9.0 15.0
5 3.0 7.0 5.0 9.0 38.0 29.0 50.0 50.0 5.0 5.0
6 9.0 5.0 7.0 9.0 28.0 30.0 48.0 49.0 9.0 7.0
*Grade 11 does not include students who took an AP/IB test.Notes: Percentages may not total 100 due to rounding.
12

Comparison of Maple Road’sSpr ing 2018 Administrat ion
Engl ish Language Arts/L iteracy to West Mil ford’s Percentages in 2018
GradeLevel 1, School
Level 1, District
Level 2, School
Level 2,District
Level 3, School
Level 3, District
Level 4, School
Level 4, District
Level 5, School
Level 5, District
3 0.0 4.0 17.0 12.0 46.0 25.0 37.0 53.0 0.0 7.0
4 8.0 4.0 3.0 9.0 25.0 25.0 50.0 48.0 14.0 15.0
5 3.0 7.0 0.0 9.0 24.0 29.0 62.0 50.0 10.0 5.0
6 3.0 5.0 8.0 9.0 14.0 30.0 76.0 49.0 0.0 7.0
*Grade 11 does not include students who took an AP/IB test.Notes: Percentages may not total 100 due to rounding.
13

Comparison of Marshal l Hi l l ’sSpr ing 2018 Administrat ion
Engl ish Language Arts/L iteracy to West Mil ford’s Percentages in 2018
GradeLevel 1, School
Level 1, District
Level 2, School
Level 2,District
Level 3, School
Level 3, District
Level 4, School
Level 4, District
Level 5, School
Level 5, District
3 4.0 4.0 7.0 12.0 14.0 25.0 61.0 53.0 14.0 7.0
4 0.0 4.0 5.0 9.0 26.0 25.0 38.0 48.0 31.0 15.0
5 11.0 7.0 14.0 9.0 14.0 29.0 58.0 50.0 3.0 5.0
6 3.0 5.0 22.0 9.0 35.0 30.0 38.0 49.0 3.0 7.0
*Grade 11 does not include students who took an AP/IB test.Notes: Percentages may not total 100 due to rounding.
14

Comparison of Paradise Knol l ’sSpr ing 2018 Administrat ion
Engl ish Language Arts/L iteracy to West Mil ford’s Percentages in 2018
GradeLevel 1, School
Level 1, District
Level 2, School
Level 2,District
Level 3, School
Level 3, District
Level 4, School
Level 4, District
Level 5, School
Level 5, District
3 11.0 4.0 17.0 12.0 30.0 25.0 39.0 53.0 2.0 7.0
4 2.0 4.0 11.0 9.0 32.0 25.0 43.0 48.0 11.0 15.0
5 10.0 7.0 8.0 9.0 31.0 29.0 44.0 50.0 8.0 5.0
6 5.0 5.0 10.0 9.0 31.0 30.0 43.0 49.0 12.0 7.0
*Grade 11 does not include students who took an AP/IB test.Notes: Percentages may not total 100 due to rounding.
15

Comparison of Upper Greenwood Lake’sSpr ing 2018 Administrat ion
Engl ish Language Arts/L iteracy to West Mil ford’s Percentages in 2018
GradeLevel 1, School
Level 1, District
Level 2, School
Level 2,District
Level 3, School
Level 3, District
Level 4, School
Level 4, District
Level 5, School
Level 5, District
3 0.0 4.0 6.0 12.0 10.0 25.0 73.0 53.0 10.0 7.0
4 3.0 4.0 13.0 9.0 20.0 25.0 58.0 48.0 8.0 15.0
5 13.0 7.0 11.0 9.0 29.0 29.0 44.0 50.0 2.0 5.0
6 7.0 5.0 7.0 9.0 30.0 30.0 47.0 49.0 9.0 7.0
*Grade 11 does not include students who took an AP/IB test.Notes: Percentages may not total 100 due to rounding.
16

Comparison of Westbrook’sSpr ing 2018 Administrat ion
Engl ish Language Arts/L iteracy to West Mil ford’s Percentages in 2018
GradeLevel 1, School
Level 1, District
Level 2, School
Level 2,District
Level 3, School
Level 3, District
Level 4, School
Level 4, District
Level 5, School
Level 5, District
3 2.0 4.0 11.0 12.0 30.0 25.0 52.0 53.0 5.0 7.0
4 2.0 4.0 10.0 9.0 8.0 25.0 60.0 48.0 20.0 15.0
5 2.0 7.0 13.0 9.0 34.0 29.0 48.0 50.0 4.0 5.0
6 5.0 5.0 5.0 9.0 40.0 30.0 44.0 49.0 7.0 7.0
*Grade 11 does not include students who took an AP/IB test.Notes: Percentages may not total 100 due to rounding.
17

Comparison of Apshawa’s Spr ing 2018 Administrat ion
Mathematics to West Mil ford’sPercentages for 2018
GradeLevel 1, School
Level 1, District
Level 2, School
Level 2,District
Level 3, School
Level 3, District
Level 4, School
Level 4, District
Level 5, School
Level 5, District
3 0.0 1.0 12.0 12.0 24.0 26.0 48.0 50.0 16.0 11.0
4 9.0 5.0 40.0 16.0 33.0 30.0 19.0 45.0 0.0 4.0
5 0.0 6.0 18.0 18.0 30.0 31.0 48.0 42.0 5.0 2.0
6 4.0 4.0 15.0 19.0 30.0 36.0 48.0 39.0 2.0 2.0
in the PARCC Algebra I assessment in place of the 8th grade Math assessment. Thus, PARCC Math 8 outcomes are not representative of grade 8 performance as a whole.*Some students in grade 8 participated
Notes: Percentages may not total 100 due to rounding. 18

Comparison of Maple Road’s Spr ing 2018 Administrat ion
Mathematics to West Mil ford’sPercentages for 2018
GradeLevel 1, School
Level 1, District
Level 2, School
Level 2,District
Level 3, School
Level 3, District
Level 4, School
Level 4, District
Level 5, School
Level 5, District
30.0 1.0 26.0 12.0 34.0 26.0 40.0 50.0 0.0 11.0
43.0 5.0 14.0 16.0 31.0 30.0 50.0 45.0 3.0 4.0
53.0 6.0 7.0 18.0 31.0 31.0 52.0 42.0 7.0 2.0
60.0 4.0 14.0 19.0 41.0 36.0 43.0 39.0 3.0 2.0
in the PARCC Algebra I assessment in place of the 8th grade Math assessment. Thus, PARCC Math 8 outcomes are not representative of grade 8 performance as a whole.*Some students in grade 8 participated
Notes: Percentages may not total 100 due to rounding. 19

Comparison of Marshal l Hi l l ’s Spr ing 2018 Administrat ion
Mathematics to West Mil ford’sPercentages for 2018
GradeLevel 1, School
Level 1, District
Level 2, School
Level 2,District
Level 3, School
Level 3, District
Level 4, School
Level 4, District
Level 5, School
Level 5, District
3 0.0 1.0 4.0 12.0 14.0 26.0 54.0 50.0 29.0 11.0
4 0.0 5.0 15.0 16.0 26.0 30.0 56.0 45.0 3.0 4.0
5 6.0 6.0 17.0 18.0 28.0 31.0 50.0 42.0 0.0 2.0
6 0.0 4.0 16.0 19.0 49.0 36.0 35.0 39.0 0.0 2.0
in the PARCC Algebra I assessment in place of the 8th grade Math assessment. Thus, PARCC Math 8 outcomes are not representative of grade 8 performance as a whole.*Some students in grade 8 participated
Notes: Percentages may not total 100 due to rounding. 20

Comparison of Paradise Knol l ’s Spr ing 2018 Administrat ion
Mathematics to West Mil ford’sPercentages for 2018
GradeLevel 1, School
Level 1, District
Level 2, School
Level 2,District
Level 3, School
Level 3, District
Level 4, School
Level 4, District
Level 5, School
Level 5, District
3 2.0 1.0 13.0 12.0 37.0 26.0 46.0 50.0 2.0 11.0
4 2.0 5.0 7.0 16.0 41.0 30.0 43.0 45.0 7.0 4.0
5 13.0 6.0 15.0 18.0 21.0 31.0 51.0 42.0 0.0 2.0
6 2.0 4.0 24.0 19.0 33.0 36.0 38.0 39.0 2.0 2.0
in the PARCC Algebra I assessment in place of the 8th grade Math assessment. Thus, PARCC Math 8 outcomes are not representative of grade 8 performance as a whole.*Some students in grade 8 participated
Notes: Percentages may not total 100 due to rounding. 21
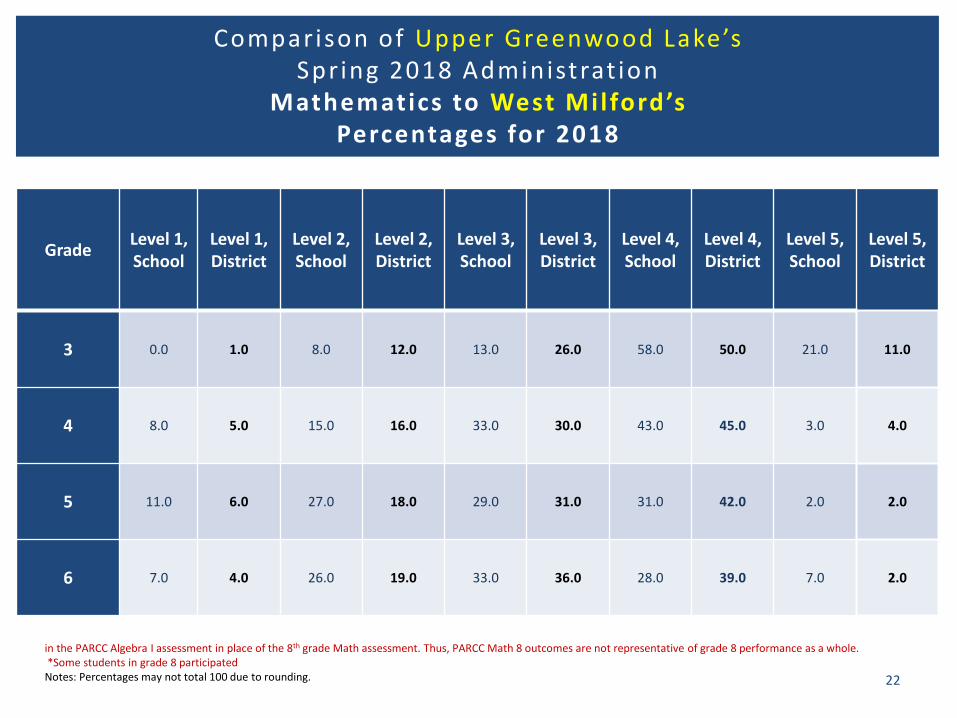
Comparison of Upper Greenwood Lake’s Spr ing 2018 Administrat ion
Mathematics to West Mil ford’sPercentages for 2018
GradeLevel 1, School
Level 1, District
Level 2, School
Level 2,District
Level 3, School
Level 3, District
Level 4, School
Level 4, District
Level 5, School
Level 5, District
3 0.0 1.0 8.0 12.0 13.0 26.0 58.0 50.0 21.0 11.0
4 8.0 5.0 15.0 16.0 33.0 30.0 43.0 45.0 3.0 4.0
5 11.0 6.0 27.0 18.0 29.0 31.0 31.0 42.0 2.0 2.0
6 7.0 4.0 26.0 19.0 33.0 36.0 28.0 39.0 7.0 2.0
in the PARCC Algebra I assessment in place of the 8th grade Math assessment. Thus, PARCC Math 8 outcomes are not representative of grade 8 performance as a whole.*Some students in grade 8 participated
Notes: Percentages may not total 100 due to rounding. 22

Comparison of Westbrook’sSpr ing 2018 Administrat ion
Mathematics to West Mil ford’sPercentages for 2018
GradeLevel 1, School
Level 1, District
Level 2, School
Level 2,District
Level 3, School
Level 3, District
Level 4, School
Level 4, District
Level 5, School
Level 5, District
3 4.0 1.0 9.0 12.0 33.0 26.0 51.0 50.0 2.0 11.0
4 6.0 5.0 6.0 16.0 19.0 30.0 60.0 45.0 10.0 4.0
5 4.0 6.0 20.0 18.0 43.0 31.0 32.0 42.0 2.0 2.0
6 7.0 4.0 16.0 19.0 35.0 36.0 42.0 39.0 0.0 2.0
in the PARCC Algebra I assessment in place of the 8th grade Math assessment. Thus, PARCC Math 8 outcomes are not representative of grade 8 performance as a whole.*Some students in grade 8 participated
Notes: Percentages may not total 100 due to rounding. 23