parks victoria technical paper series no. 68 · web viewthe twofold shelf bioregion extends from...
TRANSCRIPT

Parks Victoria Technical Paper Series No. 68
Victorian Subtidal Reef Monitoring Program:
The Reef Biota within the Twofold Shelf Bioregion
Matt Edmunds Katharine Pritchard
Kim Stewart
Australian Marine Ecology Pty Ltd
June 2011

Parks Victoria Technical Series No. 68 Twofold Shelf Subtidal Reef Monitoring
II
EXECUTIVE SUMMARYShallow reef habitats cover extensive areas along the Victorian coast and are dominated by
seaweeds, mobile invertebrates and fishes. These reefs are known for their high biological
complexity, species diversity and productivity. They also have significant economic value
through commercial and recreational fishing, diving and other tourism activities. To effectively
manage and conserve these important and biologically rich habitats, the Victorian
Government has established a long-term Subtidal Reef Monitoring Program (SRMP). Over
time the SRMP will provide information on the status of Victorian reef flora and fauna and
determine the nature and magnitude of trends in species populations and species diversity
through time.
The Subtidal Reef Monitoring Program is established throughout Victoria for all relevant
marine protected areas. This report describes the 2009 survey of the Twofold Shelf Bioregion
sites associated with the Beware Reef Marine Sanctuary, Point Hicks Marine National Park
and Cape Howe Marine National Park.
The Subtidal Reef Monitoring Program uses standardised underwater visual census methods
to survey algae, macro-invertebrates and fish. This report aims to:
• Provide general descriptions of the biological communities and species populations at each monitoring site in February - March 2010;
• Identify any unusual biological phenomena such as interesting communities and species;• Ecologically significant temporal changes in comparison with reference areas; and• Identify any introduced species at the monitoring locations.
The surveys were along a 200 m transect line. Each transect was surveyed for:
• Abundance and size structure of large fishes;• Abundance of cryptic fishes and benthic invertebrates;• Percentage cover of macroalgae; and• Density of string kelp species.
There have been five surveys in the Twofold Shelf Bioregion Marine Sanctuaries over the
past ten years: February 2001; March 2004; February 2006; March 2009; and February
2010.

3
Parks Victoria Technical Series No. 68 Twofold Shelf Subtidal Reef Monitoring
Cape Howe Marine National ParkCape Howe Marine National Park (MNP) is located adjacent to the NSW border. The four MNP sites are situated on low to moderate relief reef in the northern corner of the MNP. Two reference sites are located at Iron Prince Reef, in a 3 km2 excision from the park. The other reference sites are located on granite reefs on the eastern side of Gabo Island. Key findings for the Cape Howe region during the monitoring program are:• There was some confounding of interpretation of temporal trends through changes in the
site locations inside and outside the Marine National Park in 2009.• The macroalgal community composition had changed inside the MNP, particularly at
Howe West and Howe Central, however the deviations were not beyond the 90 % confidence intervals. This included a substantial decrease in the cover of crayweed Phyllospora comosa.
• For invertebrate community composition significant deviations were observed at Howe West inside the MNP and at Iron Prince outside the MNP.
• There was significant deviation in fish community structure at Howe West inside the MNP.• There was increasing trend in algal species richness and species diversity within the
Cape Howe MNP.• There were increase in fish species richness and diversity inside Cape Howe MNP.• There was a substantial decline in Phyllospora comosa over the monitoring period from
approximately 75 % to 45 % cover.• The long-spined sea urchin Centrostephanus rodgersii did not change substantially in
abundance.• The blacklip abalone Haliotis rubra declined in abundance from 2001 to 2006 with an
increase back to baseline abundances in 2010.• The abundances of both the blue throated wrasse Notolabrus tetricus and the purple
wrasse N. fucicola have increased considerably inside the MNP between 2006 and 2009.• Banded morwong Cheilodactylus spectabilis abundances steadily increased from
baseline levels to triple the abundances by 2009, after which there was a substantial decrease to 2010.
• For seaweed functional groups there was a halving of canopy formers over the monitoring period, with a coincident increase in smaller browns, coralline algae and thallose red algae. There were no trends in crustose coralline algae cover.
• There were no temporal patterns for invertebrate functional groups.• Both fish foragers and fish hunters increase from baseline levels until 2009 with a rapid
decline to below baseline levels in 2010. The fish planktivore abundances increased to markedly higher levels in 2009 and 2010.
• There was a decrease in cold water algal abundance consistent with the decline in P. comosa. There was an increase in cold water fish species richness and abundance throughout the monitoring period.
• Eastern invertebrate species doubled in abundance to 2009. There was a general increasing trend in eastern fish species richness. Eastern fish species abundance also increased to 2009 but declined in 2010.
• The mean size and proportion of legal sized blacklip abalone Haliotis rubra was consistently lower inside the Park.
• The density of fished species was considerably higher inside the Park in 2009 and 2010.

Parks Victoria Technical Series No. 68 Twofold Shelf Subtidal Reef Monitoring
4
Point Hicks Marine National ParkFor Point Hicks Marine National Park (MNP), the four MNP sites and two of the reference sites are situated on the granite slopes, boulders and outcrops around the Point Hicks headland. Two other reference sites are located several kilometres to the east on moderate relief reefs at Müller’s Reef and Petrel Point. Key findings for Point Hicks region during the monitoring program are:• A change in seaweed community structure at Krafts Garden from both baseline
conditions and recent survey conditions.• Changes in invertebrate community structure at Krafts Garden, Durvillaea Flats, Old Jetty
Bay and Point Hicks Joggle.• Changes in fish community structure at Old Jetty Bay, Point Hicks Southwest, Müller Reef
and Durvillaea Flats. There were overall changes inside the Park from baseline conditions and prior conditions.
• Seaweed species richness is higher than baseline conditions both inside and outside the MNP. There were no changes in invertebrate and fish indices.
• The cover of the canopy forming crayweed Phyllospora comosa and common kelpEcklonia radiata was constant over time.
• There was a decline in the brown Cystophora moniliformis in the reference area.• Blacklip abalone Haliotis rubra rapidly increased in density from 2009 to 2010 inside the
MNP, from below reference densities to well above.• The sea urchins Heliocidaris erythrogramma and Centrostephanus rodgersii were very
low in abundance inside the Park at all times. Densities outside the park were relatively consistent except for a slight dip in 2009.
• There was a decline in density of the red bait crab Plagusia chabrus both inside and outside the MNP from 2006 to 2010.
• There was a slight decrease in blue throated wrasse Notolabrus tetricus inside the park between 2009 and 2010.
• Densities of purple wrasse N. fucicola declined considerably between 2004 and 2006, both inside and outside the MNP.
• Herring cale Odax cyanomelas had a considerable increasing trend inside and outside the Park to 2006, with a reverse trend to 2010.
• The banded morwong Cheilodactylus spectabilis did not have clear patterns, although there was a potential decrease inside the Park.
• Canopy browns changed little in cover over the monitoring period. There was an increasing trend of sediment cover.
• There were no major trend in cold water species richness and total abundance.• The string kelp Macrocystis pyrifera was present in Old Jetty Bay in 2001 and 2004,
providing significant habitat structure. This species was not observed subsequently. There was no apparent change in bull kelp Durvillaea potatorum abundance.
• There was a substantial decline in biomass of fished species over 200 mm in length, decreasing by approximately 75 %, both inside and outside the MNP.
• No marked changes were observed in mean fish size over the monitoring period.• The mean size of black lip abalone Haliotis rubra was consistently higher inside the park,
by at least 10 mm. There is also a 20 % higher proportion of legal sized abalone within the park.

5
Parks Victoria Technical Series No. 68 Twofold Shelf Subtidal Reef Monitoring
CONTENTS
Executive Summary ............................................................................................................ . II
Index of figures and tables ............................................................................................... VII
1 Introduction............................................................................................................................... 11
1.1 SUBTIDAL REEF ECOSYSTEMS OF THE TWOFOLD BIOREGION..................................11
1.2 SUBTIDAL REEF MONITORING PROGRAM.......................................................................16
1.2.1 OBJECTIVES........................................................................................................................ 16
1.2.2 MONITORING PROTOCOLS AND LOCATIONS.................................................................18
1.2.3 MONITORING IN THE TWOFOLD SHELF BIOREGION.....................................................18
2 Methods..........................................................................................................................19
2.1 SITE SELECTION AND SURVEY TIMES.............................................................................19
2.2 CENSUS METHOD...............................................................................................................22
2.2.1 TRANSECT LAYOUT...........................................................................................................22
2.2.2 SURVEY DESIGN................................................................................................................22
2.2.3 METHOD 1 – MOBILE FISHES AND CEPHALOPODS.......................................................23
2.2.4 METHOD 2 – INVERTEBRATES AND CRYPTIC FISHES..................................................24
2.2.5 METHOD 3 – MACROALGAE AND SESSILE INVERTEBRATES.......................................24
2.2.6 METHOD 4 – MACROCYSTIS.............................................................................................24
2.2.7 METHOD 5 – FISH STEREO VIDEO...................................................................................25
2.3 DATA ANALYSIS - CONDITION INDICATORS ...…………………………………………………32
2.3.1 APPROACH…... ………………………………………………………………………………………32
2.3.2 BIODIVERSITY…… . …………………………………………………………………………………32
2.3.3 ECOSYSTEM FUNCTIONAL COMPONENTS………………………… ... ………………………34
2.3.4 INTRODUCED SPECIES……………………… ....…………………………………………………35
2.3.5 CLIMATE CHANGE………… ..………………………………………………………………………36
2.3.6 FISHING………… .……………………………………………………………………………………38

6
Parks Victoria Technical Series No. 68 Twofold Shelf Subtidal Reef Monitoring3 Cape Howe Marine National Park........................................................................................40
3.1 SITE DESCRIPTIONS...........................................................................................................40
3.2 BIODIVERSITY...................................................................................................................... 42
3.2.1 COMMUNITY STRUCTURE................................................................................................................42
3.2.2 SPECIES RICHNESS AND DIVERSITY..............................................................................................49
3.2.3 ABUNDANCES OF SELECTED SPECIES..........................................................................................53
3.3 ECOSYSTEM COMPONENTS..............................................................................................61
3.4 INTRODUCED SPECIES......................................................................................................69
3.5 CLIMATE CHANGE...............................................................................................................69
3.6 FISHING................................................................................................................................ 76
3.6.1 ABALONE............................................................................................................................................ 76
3.6.2 ROCK LOBSTER................................................................................................................................. 76
3.6.3 FISHES 76
4 Point Hicks Marine National Park........................................................................................86
4.1 SITE DESCRIPTIONS...........................................................................................................86
4.2 BIODIVERSITY...................................................................................................................... 88
4.2.1 COMMUNITY STRUCTURE................................................................................................................88
4.2.2 SPECIES RICHNESS AND DIVERSITY..............................................................................................95
4.2.3 ABUNDANCES OF SELECTED SPECIES..........................................................................................99
4.3 ECOSYSTEM COMPONENTS............................................................................................108
4.4 INTRODUCED SPECIES....................................................................................................115
4.5 CLIMATE CHANGE.............................................................................................................115
4.6 FISHING.............................................................................................................................. 123
4.6.1 ABALONE.......................................................................................................................................... 123
4.6.2 ROCK LOBSTER............................................................................................................................... 123
4.6.3 FISHES............................................................................................................................... 123
5 References.............................................................................................................................. 133
6 Acknowledgments................................................................................................................. 135
7 Appendix A – Site Details ......................................................................................... . A1

VII
Parks Victoria Technical Series No. 68 Twofold Shelf Subtidal Reef Monitoring
INDEX OF FIGURES AND TABLES
FIGURES
Figure 1.1. Examples of macroalgae, sessile invertebrates and substratum types present on subtidal reefs in the Twofold Shelf bioregion.....................................................................................................12Figure 1.2. Examples of invertebrate species present on subtidal reefs in the Twofold Shelf bioregion................................................................................................................................................................ 14Figure 1.3. Examples of fish species present on subtidal reefs in the Twofold Shelf bioregion...........15Figure 1.4 An example plot depicting change in an environmental, population or community variable over time (days, months or years) and potential patterns from isolated observations.........................17Figure 2.1. Location of sites for the Subtidal Reef Monitoring Program in the Twofold Shelf bioregion. Coordinate system is Map Grid of Australia 1996 (MGA).....................................................................21Figure 2.2. Biologist diver with transect reel........................................................................................23Figure 2.3. The cover of macrophytes is measured by the number of points intersecting each species on the quadrat grid............................................................................................................................... 24Figure 3.1. Location of monitoring sites inside and outside Cape Howe Marine National Park (shaded area)................................................................................................................................................... 381Figure 3.2. MDS plot of algal assemblage structure inside and outside Cape Howe Marine National Park in March 2010. Kruskal stress = 12.30. ……………………………………………………………… 43Figure 3.3. Control chart of algal assemblage structure inside and outside the Cape Howe Marine National Park...................................................................................................................................... 414Figure 3.4. MDS plot of invertebrate assemblage structure inside and outside the Cape Howe Marine National Park in March 2010. Kruskal stress = 12.53...........................................................................45Figure 3.5. Control chart of invertebrate assemblage structure inside and outside the Cape Howe Marine National Park............................................................................................................................ 46Figure 3.6. MDS plot of fish assemblage structure inside and outside the Cape Howe Marine National Park in March 2010. Kruskal stress = 12.35. ……………………………………………………………….47Figure 3.7. Control chart of fish assemblage structure inside and outside the Cape Howe Marine National Park........................................................................................................................................ 48Figure 3.8. Algal species diversity inside and outside the Cape Howe Marine National Park.............50Figure 3.9. Invertebrate species diversity inside and outside the Cape Howe Marine National Park.. 51Figure 3.10. Fish species diversity inside and outside the Cape Howe Marine National Park............52Figure 3.11. Percent cover of predominant algal species inside and outside the Cape Howe Marine National Park. Note: crustose coralline algae were not surveyed in 2001............................................55Figure 3.11 (continued). Percent cover of predominant algal species inside and outside the Cape Howe Marine National Park.................................................................................................................. 56Figure 3.12. Site abundance (per 200 m2) of predominant invertebrate species inside and outside the Cape Howe Marine National Park........................................................................................................57Figure 3.12 (continued). Site abundance (per 200 m2) of predominant invertebrate species inside and outside the Cape Howe Marine National Park...............................................................................58Figure 3.13. Site abundance (number per 2000 m2) of predominant fish species inside and outside the Cape Howe Marine National Park..................................................................................................59Figure 3.13 (continued). Site abundance (number per 2000 m2) of predominant fish species inside and outside the Cape Howe Marine National Park...............................................................................60Figure 3.14. Seaweed functional groups inside and outside the Cape Howe Marine National Park. .. 63Figure 3.14 (continued). Seaweed functional groups inside and outside the Cape Howe Marine National Park........................................................................................................................................ 64Figure 3.15. Mean abundance of invertebrate functional groups inside and outside the Cape Howe Marine National Park............................................................................................................................ 65

8
Parks Victoria Technical Series No. 68 Twofold Shelf Subtidal Reef Monitoring
Figure 3.15 (continued). Mean abundance of invertebrate functional groups inside and outside the Cape Howe Marine National Park .......................................................................................................66Figure 3.16. Mean abundance of fish functional groups inside and outside the Cape Howe Marine National Park ....................................................................................................................................... 67Figure 3.16 (continued). Mean abundance of fish functional groups inside and outside the Cape Howe Marine National Park ................................................................................................................. 68Figure 3.17. Mean cover (± Standard Error) of sediment inside and outside the Cape Howe Marine National Park ....................................................................................................................................... 68Figure 3.18. Abundance of Maugean algal species inside and outside the Cape Howe Marine National Park ....................................................................................................................................... 70Figure 3.19. Abundance of Maugean invertebrate species inside and outside the Cape Howe Marine National Park ....................................................................................................................................... 71Figure 3.20. Abundance of Maugean fish species inside and outside the Cape Howe Marine National Park ..................................................................................................................................................... 72Figure 3.21. Abundance of Eastern algal species inside and outside the Cape Howe Marine National Park ..................................................................................................................................................... 73Figure 3.22. Abundance of Eastern invertebrate species inside and outside the Cape Howe Marine National Park ....................................................................................................................................... 74Figure 3.23. Abundance of Eastern fish species inside and outside the Cape Howe Marine National Park ..................................................................................................................................................... 75Figure 3.24. Size of blacklip abalone Haliotis rubra inside and outside the Cape Howe Marine National Park. ……………………………………………………………………………………………………………..77Figure 3.25. Density of southern rock lobster Jasus edwardsii inside and outside the Cape Howe Marine National Park. ………………………………………………………………………………………….78Figure 3.26. Density of packhorse lobster Jasus verreauxi inside and outside the Cape Howe Marine National Park. …………………………………………………………………………………………………..78Figure 3.27. Fish size spectra inside and outside the Cape Howe Marine National Park ..................79Figure 3.28. Biomass of fished species inside and outside the Cape Howe Marine National Park ...80Figure 3.29. Density of all fished species inside and outside the Cape Howe Marine National Park. . 81Figure 3.30. Size of blue throat wrasse Notolabrus tetricus inside and outside the Cape Howe Marine National Park ....................................................................................................................................... 82Figure 3.31. Size of purple wrasse Notolabrus fucicola inside and outside the Cape Howe Marine National Park ....................................................................................................................................... 83Figure 3.32. Size of senator wrasse Pictilabrus laticlavius inside and outside the Cape Howe Marine National Park ....................................................................................................................................... 84Figure 3.33. Size of banded morwong Cheilodactylus spectabilis inside and outside the Cape Howe Marine National Park ........................................................................................................................... 85Figure 4.1. Location of monitoring sites associated with Point Hicks Marine National Park. The park area is shaded blue. Coordinate system is Map Grid of Australia 1996 (MGA) ..................................87Figure 4.2. MDS plot of algal assemblage structure inside and outside the Point Hicks Marine National Park in March 2010. Kruskal stress = 13.28 ..........................................................................89Figure 4.3. Control chart of algal assemblage structure inside and outside the Point Hicks Marine National Park ....................................................................................................................................... 90Figure 4.4. MDS plot of invertebrate assemblage structure inside and outside the Point Hicks Marine National Park in March 2010. Kruskal stress = 10.24 ..........................................................................91Figure 4.5. Control chart of invertebrate assemblage structure inside and outside the Point Hicks Marine National Park ........................................................................................................................... 92Figure 4.6. MDS plot of fish assemblage structure inside and outside the Point Hicks Marine National Park in March 2010. Kruskal stress = 15.59 ........................................................................................93Figure 4.7. Control chart of fish assemblage structure inside and outside the Point Hicks Marine National Park ....................................................................................................................................... 94

9
Parks Victoria Technical Series No. 68 Twofold Shelf Subtidal Reef Monitoring
Figure 4.8. Mean abundance of algal functional groups inside and outside the Point Hicks Marine National Park ....................................................................................................................................... 96Figure 4.9. Mean abundance of invertebrate functional groups inside and outside the Point Hicks Marine National Park ........................................................................................................................... 97Figure 4.10. Mean abundance of fish functional groups inside and outside the Point Hicks Marine National Park ....................................................................................................................................... 98Figure 4.11. Percent cover of predominant algal species inside and outside the Point Hicks Marine National Park ..................................................................................................................................... 101Figure 4.11 (continued). Percent cover of predominant algal species inside and outside the Point Hicks Marine National Park ...............................................................................................................102Figure 4.12. Site abundance (per 200 m2) of predominant invertebrate species inside and outside the Point Hicks Marine National Park ......................................................................................................103Figure 4.12. (continued). Site abundance (per 200 m2) of predominant invertebrate species inside and outside the Point Hicks Marine National Park ............................................................................104Figure 4.12. (continued). Site abundance (per 200 m2) of predominant invertebrate species inside and outside the Point Hicks Marine National Park ............................................................................105Figure 4.13. Site abundance (number per 2000 m2) of predominant fish species inside and outside the Point Hicks Marine National Park ................................................................................................106Figure 4.13 (continued). Site abundance (number per 2000 m2) of predominant fish species inside and outside the Point Hicks Marine National Park ............................................................................107Figure 4.14. Seaweed functional groups inside and outside the Point Hicks Marine National Park.. 109Figure 4.14 (continued). Seaweed functional groups inside and outside the Point Hicks Marine National Park ..................................................................................................................................... 110Figure 4.15. Mean abundance of invertebrate functional groups inside and outside the Point Hicks Marine National Park .........................................................................................................................111Figure 4.15 (continued). Mean abundance of invertebrate functional groups inside and outside the Point Hicks Marine National Park ......................................................................................................112Figure 4.16. Mean abundance of fish functional groups inside and outside the Point Hicks Marine National Park ..................................................................................................................................... 113Figure 4.16 (continued). Mean abundance of fish functional groups inside and outside the Point Hicks Marine National Park ...............................................................................................................114Figure 4.17. Percent cover of sediments inside and outside the Point Hicks Marine National Park.. 114Figure 4.18. Abundance of Maugean algal species inside and outside the Point Hicks Marine National Park ................................................................................................................................................... 116Figure 4.19. Abundance of Maugean invertebrate species inside and outside the Point Hicks Marine National Park ..................................................................................................................................... 117Figure 4.20. Abundance of Maugean fish species inside and outside the Point Hicks Marine National Park ................................................................................................................................................... 118Figure 4.21. Abundance of Eastern algal species inside and outside the Point Hicks Marine National Park ................................................................................................................................................... 119Figure 4.22. Abundance of Eastern invertebrate species inside and outside the Point Hicks Marine National Park ..................................................................................................................................... 120Figure 4.23. Abundance of Eastern fish species inside and outside the Point Hicks Marine National Park ................................................................................................................................................... 121Figure 4.24. Percent cover of algal species of interest string kelp Macrocystis pyrifera and bull kelpDurvillaea potatorum inside and outside the Point Hicks Marine National Park ................................122Figure 4.25. Sizes of blacklip abalone Haliotis rubra inside and outside the Point Hicks Marine National Park ..................................................................................................................................... 124Figure 4.26. Proportion of eastern rock lobster Jasus verreauxi inside and outside the Point Hicks Marine National Park. ………………………………………………………………………………………..125Figure 4.27. Fish size spectra inside and outside the Point Hicks Marine National Park .................126Figure 4.28. Biomass of fished species inside and outside the Point Hicks Marine National Park... 127

10
Parks Victoria Technical Series No. 68 Twofold Shelf Subtidal Reef Monitoring
Figure 4.29. Density of fished species inside and outside the Point Hicks Marine National Park ....128Figure 4.30. Size of blue throat wrasse Notolabrus tetricus inside and outside the Point Hicks Marine National Park ..................................................................................................................................... 129Figure 4.31. Size of purple wrasse Notolabrus fucicola inside and outside the Point Hicks Marine National Park ..................................................................................................................................... 130Figure 4.32. Size of senator wrasse Pictilabrus laticlavius inside and outside the Point Hicks Marine National Park...................................................................................................................................... 121Figure 4.33. Size of banded morwong Cheilodactylus spectabilis inside and outside the Point Hicks Marine National Park .........................................................................................................................132
TABLES
Table 2.1. Subtidal reef monitoring sites and survey times in the Twofold Shelf bioregion.................20Table 2.2. Mobile fish (Method 1) surveyed in the Twofold bioregion..................................................26Table 2.3. Invertebrates and cryptic fish (Method 2) surveyed on the in the Twofold Shelf bioregion. 27Table 2.4. Macroalgae (Method 3) surveyed on the in the Twofold Shelf bioregion ...........................28

11
Parks Victoria Technical Series No. 68 Twofold Shelf Subtidal Reef Monitoring
1 INTRODUCTION1.1 Subtidal Reef Ecosystems of the Twofold
BioregionThe Twofold Shelf Bioregion extends from east of Wilsons Promontory to Tathra in southern
New South Wales. The western portion of the Twofold Shelf bioregion is largely comprised of
long sandy beaches (Ninety Mile Beach) with extensive areas of inshore and offshore sandy
beds with some small offshore reefs. The sandy habitats of the far eastern coastline are
punctuated by rocky headlands and localised outcrops of granite and metamorphic rocks,
such as at Cape Conran, Point Hicks, Rame Head, Gabo Island and Iron Prince at Cape
Howe. Sea temperatures are warmer in the Twofold Shelf region compared to elsewhere in
Victoria because of incursions of the East Australia current bringing warmer water down the
east coast of the continent. The continental slope is quite close to the far eastern Victorian
shore and cold-water upwellings are frequent. These upwellings provide nutrients to the
inshore ecosystems, contributing to high productivity. The biota of this region has a high
component of eastern temperate species, in addition to many southern temperate and
cosmopolitan species.
A prominent biological component of all Victorian shallow reefs is kelps and other seaweeds
(Figure 1.1). Large species of brown algae, such as the common kelp Ecklonia radiata and
crayweed Phyllospora comosa, are usually present along the open coast in dense stands.
The production rates of dense seaweed beds are equivalent to the most productive habitats
in the world, including seagrass beds and terrestrial grasslands, with approximately 2 kg of
plant material produced per square metre per year. These stands may have 10-30 kg of plant
material per square metre. The biomass of seaweeds is greater where giant species such as
string kelp Macrocystis angustifolia and bull kelp Durvillaea potatorum occur.
Seaweeds provide important habitat structure for other organisms on the reef. This habitat
structure varies considerably, depending on the type of seaweed species present. Tall
vertical structures in the water column are formed by Macrocystis angustifolia, which
sometimes forms a dense layer of fronds floating on the water surface. Other species with
large, stalk-like stipes, such as Ecklonia radiata, Phyllospora comosa and Durvillaea
potatorum, form a canopy 0.5-2 m above the rocky substratum. Lower layers of structure are
formed by: foliose macroalgae typically 10-30 cm high, such as the green Caulerpa and red
Plocamium species; turfs (to 10 cm high) of red algae species, such as Pterocladia
capillacea; and hard encrusting layers of pink coralline algae. The nature and composition of
these structural layers varies considerably within and between reefs, depending on the
biogeographical region, depth, exposure to swell and waves, currents, temperature range,

12
Parks Victoria Technical Series No. 68 Twofold Shelf Subtidal Reef Monitoringwater clarity and presence of sand.

Parks Victoria Technical Series No. 68 Twofold Shelf Subtidal Reef Monitoring
13
a. Coralline algae Amphiroa anceps. b. Peacock-weed Lobophora variegata.
c. Soft coral Capnella gaboensis. d. Mixed red and brown algae.
e. Caulerpa trifaria. f. Urchin barren.
Figure 1.1. Examples of macroalgae, sessile invertebrates and substratum types present on subtidal reefs in the Twofold Shelf bioregion.

Parks Victoria Technical Series No. 68 Twofold Shelf Subtidal Reef Monitoring
14
Grazing and predatory mobile invertebrates are prominent animal inhabitants of the reef
(Figure 1.2). An important invertebrate of the eastern Twofold Shelf bioregion is the long-
spined sea urchin Centrostephanus rodgersii. Centrostephanus forms large grazing
aggregations which denude the reef of erect algal species, forming ‘sea urchin barrens’.
Removal of large seaweeds by Centrostephanus causes substantial changes to subtidal reef
community structure on reefs in eastern temperate Australia.
Other common invertebrate grazers found at Twofold Shelf reefs include blacklip abalone
Haliotis rubra, the eastern temperate gastropod Astralium tentoriformis, warrener Turbo
undulatus and sea urchin Heliocidaris erythrogramma. Predatory invertebrates include
dogwhelks Dicathais orbita, eastern rock lobster Jasus verreauxi, octopus Octopus moarum
and a wide variety of seastar species. Other large reef invertebrates include mobile filter
feeding animals such as feather stars Comanthus trichoptera and sessile (attached) species
such as sponges, corals, bryozoans, hydroids and ascidians.
Fish are also a dominant component of reef ecosystems, in terms of both biomass and
ecological function (Figure 1.3). Reef fish assemblages include roaming predators such as
blue-throated wrasse Notolabrus tetricus, herbivores such as herring cale Odax cyanomelas,
planktivores such as sea sweep Scorpis aequipinnis and picker-feeders such as six-spined
leatherjacket Meuschenia freycineti. The type and abundance of each fish species varies
considerably, depending on exposure to swell and waves, depth, currents, reef structure,
seaweed habitat structure and many other ecological variables. Many fish species play a
substantial ecological role in the functioning and shaping of the ecosystem. For example,
breeding aggregations of herring cale Odax cyanomelas at certain times of the year can
increase patchiness in algal assemblages by concentrating herbivory on kelps in small areas
for short periods of time.
Although shallow reef ecosystems in Victoria are dominated by seaweeds, mobile
invertebrates and fishes, in terms of biomass and production, there are many other important
biological components to the reef ecosystem. These include small species of crustaceans
and molluscs from 0.1 to 10 mm in size, occupying various niches as grazers, predators or
foragers. At the microscopic level, films of microalgae and bacteria on the reef surface are
also very important.

Parks Victoria Technical Series No. 68 Twofold Shelf Subtidal Reef Monitoring
15
a. Sea urchin Heliocidaris erythrogramma. b. Sea urchin Centrostephanus rodgersii.
c. Nudibranch Hypselodoris bennetti. d. Pencil urchin Phyllacanthus parvispinus.
e. Black-lipped abalone Haliotis rubra. f. Feather star Comanthus trichoptera.
Figure 1.2. Examples of invertebrate species present on subtidal reefs in the Twofold Shelf Bioregion.

Parks Victoria Technical Series No. 68 Twofold Shelf Subtidal Reef Monitoring
16
a. Six-spined Leatherjacket b. White-ear Parma
microlepis. Meuschenia freycineti.
c. Maori wrasse Ophthalmolepis lineolatus, d. Purple wrasse Notolabrus fucicola (left),
Blue-throat wrasse Notolabrus tetricus (rear). Banded morwong Cheilodactylus spectabilis
(right).
e. Eastern hulafish Trachinops taeniatus. f. Trevally Pseudocaranx georgianus.
Figure 1.3. Examples of fish species present on subtidal reefs in the Twofold Shelf Bioregion.

Parks Victoria Technical Series No. 68 Twofold Shelf Subtidal Reef Monitoring
17
Victoria’s shallow reefs are a very important component of the marine environment because
of their high biological complexity, species diversity and productivity. Subtidal reef habitats
also have important social and cultural values, which incorporate aesthetic, recreational,
commercial and historical aspects. Shallow subtidal reefs also have significant economic
value, through commercial fishing of reef species such as wrasses, morwong, rock lobster,
abalone and sea urchins, as well as recreational fishing, diving and other tourism activities.
1.2 Subtidal Reef Monitoring Program
1.2.1 ObjectivesAn important aspect of the management and conservation of Victorian marine natural
resources and assets is assessing the condition of the ecosystem and how this changes over
time. Combined with an understanding of ecosystem processes, this information can be used
to manage any threats or pressures on the environment to ensure ecosystem sustainability.
Consequently, the Victorian Government has established a long-term Subtidal Reef
Monitoring Program (SRMP). The primary objective of the SRMP is to provide information on
the status of Victorian reef flora and fauna (focussing on macroalgae, macroinvertebrates
and fish). This includes monitoring the nature and magnitude of trends in species
abundances, species diversity and community structure. This is achieved through regular
surveys at locations throughout Victoria, encompassing both representative and unique
habitats and communities.
Information from the SRMP allows managers to better understand and interpret long-term
changes in the population and community dynamics of Victoria’s reef flora and fauna. As a
longer time series of data are collected, the SRMP will allow managers to:
• Compare changes in the status of species populations and biological communities
between highly protected marine national parks and marine sanctuaries and other
Victorian reef areas (e.g. Edgar and Barrett 1997, 1999);
• Determine associations between species and between species and environmental
parameters (e.g. depth, exposure, reef topography) and assess how these associations
vary through space and time (e.g. Edgar et al. 1997; Dayton et al. 1998; Edmunds, Roob
and Ferns 2000);
• Provide benchmarks for assessing the effectiveness of management actions, in
accordance with international best practice for quality environmental management
systems (Holling 1978; Meredith 1997); and
• Determine the responses of species and communities to unforeseen and unpredictable
events such as marine pest invasions, mass mortality events, oil spills, severe storm

P
Parks Victoria Technical Series No. 68 Twofold Shelf Subtidal Reef Monitoring
18
events and climate change (e.g. Ebeling et al. 1985; Edgar 1998; Roob et al. 2000;
Sweatman et al. 2003).
A monitoring survey gives an estimate of population abundance and community structure at
a small window in time. Patterns seen in data from periodic surveys are unlikely to exactly
match changes in the real populations over time or definitively predict the size and nature of
future variation. Plots of changes over time are unlikely to match the changes in real
populations because changes over shorter time periods and actual minima and maxima may
not be adequately sampled (e.g. Figure 1.4). Furthermore, because the nature and
magnitude of environmental variation is different over different time scales, variation over
long periods may not be adequately predicted from shorter-term data. Sources of
environmental variation can operate at the scale of months (e.g. seasonal variation,
harvesting), years (e.g. El Niño), decades (e.g. pollution, extreme storm events) or even
centuries (e.g. tsunamis, global warming). Other studies indicate this monitoring program will
begin to adequately reflect average trends and patterns as the surveys continue over longer
periods (multiple years to decades). Results of this monitoring need to be interpreted within
the context of the monitoring frequency and duration.
Time
Figure 1.4 An example plot depicting change in an environmental, population or community variable over time (days, months or years) and potential patterns from isolated observations.

Parks Victoria Technical Series No. 68 Twofold Shelf Subtidal Reef Monitoring
19
1.2.2 Monitoring Protocols and LocationsThe SRMP uses standardised underwater visual census methods based on an approach
developed and applied in Tasmania by Edgar and Barrett (1997). Details of standard
operational procedures and quality control protocols for Victoria’s SRMP are described in
Edmunds and Hart (2003).
The SRMP was initiated in May 1998 with 15 sites established on subtidal reef habitats in the
vicinity of Port Phillip Heads Marine National Park. In 1999 the SRMP was expanded to reefs
in the vicinity of the Bunurong Marine National Park, Phillip Island and Wilsons Promontory
Marine National Park.
In 2003 and 2004, the Subtidal Reef Monitoring Program was expanded to include Marine
National Parks and Marine Sanctuaries throughout Victoria.
1.2.3 Monitoring in the Twofold Shelf Bioregion
This report describes the Subtidal Reef Monitoring Program and results from the five surveys
of subtidal reefs in the Twofold Shelf bioregion, including at Point Hicks and Cape Howe
Marine National Parks and Beware Reef Marine Sanctuary. The objectives of this report
were to:
• Provide an overview of the methods used for the SRMP;
• Provide general descriptions of the biological communities and species populations at
each monitoring site up to March 2010;
• Describe changes and trends that have occurred over the monitoring period;
• Identify any unusual biological phenomena such as interesting or unique communities
or species; and
• Identify any introduced species at the monitoring locations.

Parks Victoria Technical Series No. 68 Twofold Shelf Subtidal Reef Monitoring
20
2 METHODS2.1 Site Selection and Survey
TimesSubtidal reefs were quantitatively surveyed in the Cape Howe and Point Hicks regions in
2001, before the current marine protected areas were gazetted (Edmunds et al. 2001).
These sites were located on available subtidal reefs inside and outside the current marine
protected area boundaries. Consequently, it was considered appropriate to incorporate some
of these surveyed sites into the formal Subtidal Reef Monitoring Program that commenced in
2004 (data courtesy of Australian Marine Ecology).
In 2001, seven sites were surveyed at the Point Hicks region and eight sites in the Cape
Howe region (Edmunds et al. 2001). Although the objectives of the earlier study were
different to this one, the same survey method was used and many of these sites were
appropriate for the Parks Victoria long-term monitoring program. Some of the sites were
unsuitable for the SRMP because of their depth or representativeness. Nine of these sites
were initially selected as part of the long-term Subtidal Reef Monitoring Program. Some of
these sites were subsequently removed from the program.
Since the commencement of the SRMP, eight sites at Point Hicks Marine National Park and
at least eight sites at Cape Howe Marine National Park have been surveyed on five
occasions:
1. March 2004;
2. February 2006;
3. March-May 2009 and
4. March 2010 (Figure 2.1; Table 2.1).
At Cape Howe, four sites inside and four sites outside the marine national park were
surveyed in 2004 and 2006. In 2009, three of these sites were discontinued and three new
sites were established. Under the direction of Parks Victoria, two reference sites dominated
by sea urchin barrens were substituted for two sites with seaweeds. One site in the MNP,
Site 3220, was deemed too close to the others so this was replaced by a more distant, but
deeper site, Site 3227. A non-SRMP site, Site 11 Gabo Harbour, was resurveyed
opportunistically during the 2009 survey, being previously surveyed in 2001.
At Point Hicks, the same four sites inside and four sites the marine national park have been
surveyed on all four occasions (Figure 2.1; Table 2.1).

20
Parks Victoria Technical Series No. 68 Twofold Shelf Subtidal Reef Monitoring
Descriptions of the monitoring sites are presented in the following sections for each marine
protected area.
During the 2010 survey, the western Point Hicks sites at Southwest and Old Jetty Bay were
visited on 18 March 2010 but were affected by a plankton bloom, producing very low
underwater visibility. This low visibility was also present on 20 March 2010 and this bloom
was worsening and affecting the whole of the Twofold coast so surveys of these sites was
postponed for another excursion. Suitable conditions were limited in the following months
and the sites were not surveyed until 21 June 2010.
Table 2.1. Subtidal reef monitoring sites and survey times in the Twofold Shelf bioregion.
Notes: (1) discontinued as deemed too close to other sites; (2) replacement MPA site offshore and deeper than other sites; (3) discontinued as sea urchin barrens deemed not representative enough for statistical analysis purposes; (4) not part of the SRMP but opportunistically resurveyed because of high conservation values; and (5) new reference sites with seaweed rather than urchin barrencommunities.
Site No. Site Name
MPA/Referenc e
Depth (m)
Survey 1
Survey 2
Survey 3
Survey 4
Survey 5
Point Hicks MNP
3204 Old Jetty Bay MPA 4 06/02/01
17/03/04
08/02/06
20/03/09
21/06/10
3221 Hicks Southwest MPA 8 25/03/04
12/02/06
19/03/09
21/06/10
3222 Hicks Joggle MPA 5 25/03/04
12/02/06
19/03/09
18/03/10
3206 HicksLighthouse MPA 5 10/02/0
119/03/04
15/02/06
19/03/09
18/03/10
3207 Krafts Garden Reference 5 10/02/0
117/03/04
15/02/06
22/03/09
18/03/10
3216 Durvillaea Flats Reference 4 17/03/0
415/02/06
22/03/09
18/03/10
3217 Müller Reef Reference 7 19/03/0
416/02/06
22/03/09
20/03/10
3218 Petrel Point Referenc e 8 19/03/0
415/02/06
22/03/09
20/03/10
Cape Howe MNP
3220 HowePerpendicular1 MPA 10 21/03/0
414/02/06
3227 Howe Outer2 MPA 14 05/05/09
21/03/10
3213 Howe West MPA 7 09/02/01
20/03/04
09/02/06
18/03/09
16/03/10
3214 Howe Central MPA 8 09/02/01
20/03/04
09/02/06
18/03/09
16/03/10
3215 Howe Border MPA 10 11/02/01
20/03/04
09/02/06
18/03/09
16/03/10
3208 TullabergaDeep3
Reference 7 07/02/0
123/03/04
14/02/06
3210 GaboMonument3
Reference 6 07/02/0
123/03/04
14/02/06

Parks Victoria Technical Series No. 68 Twofold Shelf Subtidal Reef Monitoring
21
3211 Gabo Harbour4 Reference 5 07/02/0
124/03/09
3225 Gabo NEGulch5
Reference 7 23/03/0
917/03/10
3226 Gabo Boulder Bay5
Referenc e 9 24/03/0
917/03/10
3212 Iron Prince West Reference 5 09/02/0
121/03/04
16/02/06
23/03/09
17/03/10
3219 Prince Wreck Reference 6 21/03/0
412/02/06
23/03/09
21/03/10
Figure 2.1. Location of sites for the Subtidal Reef Monitoring Program in the Twofold Shelf bioregion. Coordinate system is Map Grid of Australia 1996 (MGA).

Parks Victoria Technical Series No. 68 Twofold Shelf Subtidal Reef Monitoring
22
2.2 Census Method
2.2.1 Transect LayoutThe visual census methods of Edgar and Barrett (Edgar and Barrett 1997, 1999; Edgar et al. 1997)
are used for this monitoring program. These are non-destructive and provide quantitative data on a
large number of species and the structure of the reef communities. The Edgar-Barrett method is also
used in Tasmania, New South Wales, South Australia and Western Australia. The adoption of this
method in Victoria provides a systematic and comparable approach to monitoring reefs in southern
Australia. The survey methods include practical and safety considerations for scientific divers and are
designed to maximise the data returns per diver time underwater. The surveys in Victoria are in
accordance with a standard operational procedure to ensure long-term integrity and quality of the data
(Edmunds and Hart 2003).
At most monitoring locations in Victoria, surveying along the 5 m depth contour is considered
optimal because diving times are not limited by decompression schedules and these reefs
are of interest to natural resource managers. However, the actual depth that can be surveyed
varies with reef extent, geomorphology and exposure. Monitoring sites in the Twofold Shelf
Bioregion vary between 4 and 14 metres. Monitoring sites were established in deeper water
in this area because many sites were exposed to large swells and turbulent conditions.
2.2.2 Survey DesignEach site was located using differential GPS and marked with a buoy or the boat anchor. A
100 m numbered and weighted transect line is run along the appropriate depth contour either
side of the central marker (Figure 2.2). The resulting 200 m of line was divided into four
contiguous 50 m sections (T1 to T4). The orientation of transect was the same for each
survey, with T1 generally toward the north or east (i.e. anticlockwise along the open coast).
For each transect line, four different census methods were used to obtain adequate
descriptive information on reef communities at different spatial scales. These involved the
census of: (1) the abundance and size structure of large fishes; (2) the abundance of cryptic
fishes and benthic invertebrates; (3) the percent cover of macroalgae and sessile
invertebrates; and (4) the density of string-kelp Macrocystis angustifolia plants (where
present). In 2010, a new diver-operated stereo video method (Method 6) was implemented
as a trial to assess its efficacy for monitoring fish diversity, abundances and sizes. The
stereo video system enables precise measurements of fish lengths and sample volume or
area for density estimates.
The depth, horizontal visibility, sea state and cloud cover are recorded for each site.
Horizontal visibility was gauged by the distance along the transect line to detect a 100 mm
long fish. All field observations are recorded on underwater paper.

Parks Victoria Technical Series No. 68 Twofold Shelf Subtidal Reef Monitoring
23
Figure 2.2. Biologist diver with transect reel.
2.2.3 Method 1 – Mobile Fishes and CephalopodsThe densities of mobile large fishes and cephalopods are estimated by a diver swimming up
one side of each of a 50 m section of the transect, and then back along the other side. The
predominant fish species observed are listed in Table 2.3. The diver records the number and
estimated size-class of fish, within 5 m of each side of the line (50 x 10 m area). The size-
classes for fish were 25, 50, 75, 100, 125, 150, 200, 250, 300, 350, 375, 400, 500, 625, 750,
875 and 1000+ mm. Each diver had size-marks on an underwater slate to enable calibration
of their size estimates. Four 10 x 50 m sections of the 200 m transect are censured for
mobile fish at each site. The data for easily sexed species are recorded separately for males
and female/juveniles. Such species include the blue-throated wrasse Notolabrus tetricus,
herring cale Odax cyanomelas, barber perch Caesioperca rasor, rosy wrasse Pseudolabrus
rubicundus and some leatherjackets.

Parks Victoria Technical Series No. 68 Twofold Shelf Subtidal Reef Monitoring
24
2.2.4 Method 2 – Invertebrates and Cryptic Fishes
Cryptic fishes and mobile megafaunal invertebrates (e.g. large molluscs, echinoderms,
crustaceans) are counted along the transect lines used for the fish survey. A diver counts
animals within 1 m of one side of the line (a total of four 1 x 50 m sections of the 200 m
transect). A known arm span of the diver is used to standardise the 1 m distance. The
predominantly observed species are listed in Table 2.4. The maximum length of abalone and
the carapace length and sex of rock lobsters were measured in situ using vernier callipers
whenever possible. Selected specimens are photographed or collected for identification and
preservation in a reference collection.
2.2.5 Method 3 – Macroalgae and Sessile Invertebrates
The area covered by macroalgal and sessile invertebrate species is quantified by placing a2
0.25 m quadrate at 10 m intervals along the transect line and determining the percent cover
of the all plant species (Figure 2.3). The predominantly observed seaweed species are listed
in Table 2.5. The quadrat is divided into a grid of 7 x 7 perpendicular wires, giving 50 points,
including one corner. Cover is estimated by counting the number of points covering a species2
(1.25 m for each of the 50 m sections of the transect line). Selected specimens are
photographed or collected for identification and preservation in a reference collection.
2.2.6 Method 4 – Macrocystis
Where present, the densities of Macrocystis pyrifera plants are estimated. While swimming
along the transect line between quadrate positions for Method 3, a diver counts all
observable plants within 5 m either side of the line. Counts are recorded for each 10 m
section of the transect (giving counts for 100 m2 sections of the transect).

Parks Victoria Technical Series No. 68 Twofold Shelf Subtidal Reef Monitoring
25
Figure 2.3. The cover of macrophytes is measured by the number of points intersecting each species on the quadrat grid.

Parks Victoria Technical Series No. 68 Twofold Shelf Subtidal Reef Monitoring
26
2.2.7 Method 5 – Fish Stereo VideoA diver operated stereo video system (DOVS; SeaGIS design) was used to supplement the diver UVC
fish surveys. The videos were Canon HG21 Handycams recording to SD card in 1080p format. The
cameras were calibrated in a pool before and after the excursion using a SeaGIS calibration cube and
SeaGIS CAL software for calibration of internal and external camera parameters. The cameras were
mounted permanently fixed to a diver frame. A flashing LED mounted on a pole in front of the frame
was used for synchronisation of paired images from each camera.
The stereo camera system was used by a single diver who did the UVC fish survey at the same time
(Method 1). The camera system was pointed parallel with the transect line with the diver swimming
2.5 m to one side of the transect and then returning on the other side of the transect, 2.5 m from
the transect line. The camera unit was tilted vertically (up or down) according to the fish seen to
ensure adequate footage for size measurements. Lateral movement of the unit was minimised. The
survey speed was 10 m per minute (0.16 m s-1).
In the laboratory, the stereo video footage was converted from MTS to AVI format. The SeaGIS
EventMeasure and PhotoMeasure software were then used for extracting and recording fish density
and fish length estimates from the stereo video footage. Measured fish were those without body
flexure and orientated transverse to the camera, as well as with the measurement points visible.
Standard lengths (SL) were measured (tip of snout to end of caudal fin ray). The original video footage
and frames used for fish length measurements were archived. The results of this method were
archived for future analysis and were not reported here.

Parks Victoria Technical Series No. 68 Twofold Shelf Subtidal Reef Monitoring
27
Table 2.2. Mobile fish (Method 1) surveyed in the Twofold bioregion.Method 1Cephalopoda Mobile Bony Fishes Mobile Bony FishesOctopus maorum Upeneichthys lineatus Dotalabrus aurantiacus
Upeneichthys vlaminghii Eupetrichthys angustipesSharks and Rays Pempheris multiradiata Notolabrus gymnogenisHeterodontus portusjacksoni Kyphosus sydneyanus Notolabrus tetricusParascyllium ferrugineum Girella tricuspidata Notolabrus fucicolaCephaloscyllium laticeps Girella elevata Pseudolabrus rubicundusOrectolobus maculatus Girella zebra Pseudolabrus luculentusDasyatis brevicaudata Scorpis aequipinnis Pictilabrus laticlaviusMyliobatis australis Scorpis lineolata Odax acroptilusUrolophus cruciatus Atypichthys strigatus Odax cyanomelasUrolophus paucimaculatus Enoplosus armatus Neoodax balteatusTrygonoptera testacea Pentaceropsis recurvirostris Bovichtus angustifrons
Parma victoriae Cristiceps australisMobile Bony Fishes Parma microlepis Acanthaluteres vittigerScorpaena papillosa Chromis hypsilepis Meuschenia australisCaesioperca lepidoptera Chironemus marmoratus Meuschenia flavolineataCaesioperca rasor Aplodactylus arctidens Meuschenia freycinetiHypoplectrodes maccullochi Aplodactylus lophodon Meuschenia hippocrepisTrachinops taeniatus Cheilodactylus fuscus Eubalichthys bucephalusDinolestes lewini Cheilodactylus nigripes Eubalichthys mosaicusPseudocaranx georgianus Cheilodactylus spectabilis Contusus brevicaudusTrachurus novaezelandiae Nemadactylus douglasii Tetractenos glaberTrachurus declivis Dactylophora nigricans Diodon nichthemerusArripis georgianus Latridopsis forsteriArripis spp. Sphyraena novaehollandiae MammalsParequula melbournensis Achoerodus viridis Arctocephalus pusillusPagrus auratus Ophthalmolepis lineolata

Parks Victoria Technical Series No. 68 Twofold Shelf Subtidal Reef Monitoring
28
Table 2.3. Invertebrates and cryptic fish (Method 2) surveyed on the in the Twofold Shelf bioregion.
Method 2Polychaete Worms Crustacea Cryptic FishesSabellastarte australiensis Jasus edwardsii Cephaloscyllium laticeps
Jasus verreauxi Orectolobus maculatusMolluscs Paguristes frontalis Urolophus cruciatusChitons Strigopagurus strigimanus Heterodontus portusjacksoniHaliotis rubra Nectocarcinus tuberculatus Lotella rhacinaScutus antipodes Plagusia chabrus Pseudophycis bachusPhasianotrochus eximius Pagurid spp Pseudophycis barbataPhasianella australis Scorpaena papillosaPhasianella ventricosa Echinoderms Centropogon australisTurbo undulatus Comanthus trichoptera Helicolenus percoidesTurbo jourdani Comanthus tasmaniae Hypoplectrodes maccullochiAstralium tentoriformis Tosia magnifica Pempheris multiradiataCharonia lampas rubicunda Tosia australis Pempheris compressaCabestana spengleri Nectria ocellata Parma victoriaeCabestana tabulata Nectria multispina Parma microlepisArgobuccinium vexillum Meridiastra calcar Gymnothorax prasinusRanella australasia Coscinasterias muricata Chromis hypsilepisDicathais orbita Astrostole scabra Chironemus marmoratusPenion maxima Goniocidaris tubaria Eupetrichthys angustipesCominella lineolata Phyllacanthus parvispinus Bovichtus angustifronsTambja verconis Heliocidaris erythrogramma Trinorfolkia clarkeiNeodoris chrysoderma Centrostephanus rodgersii Heteroclinus perspicillatusHypselodoris bennetti Amblypneustes spp. Contusus brevicaudusOctopus berrima Holopneustes inflatus Diodon nichthemerusOctopus tetricus Holopneustes purpurascensOctopus spp.

Parks Victoria Technical Series No. 68 Twofold Shelf Subtidal Reef Monitoring
29
Table 2.4. Macroalgae (Method 3) surveyed on the in the Twofold Shelf bioregion.Method 3Chlorophyta (green algae) Phaeophyta (brown algae) Rhodophyta (red algae)Ulva spp Phyllospora comosa Plocamium dilatatumChaetomorpha sp Cystophora moniliformis Plocamium leptophyllumChaetomorpha coliformis Cystophora monilifera Plocamium costatumCodium duthieae Cystophora retorta Mychodea acanthymeniaCodium galeatum Cystophora siliquosa Asparagopsis armataCaulerpa scalpelliformis Acrocarpia paniculata Delisea pulchraCaulerpa trifaria Sargassum spp Gracilaria secundataCaulerpa hodgkinsoniae Sargassum verruculosum Curdiea angustata
Sargassum vestitum Amphiroa ancepsPhaeophyta (brown algae) Brown algal turf Corallines unidentifiedHalopteris spp Arthrocardia wardiiCladostephus spongiosus Rhodophyta (red algae) Haliptilon roseumDictyota dichotoma Galaxaura marginata Rhodymenia australisDictyota diemensis Pterocladia lucida Rhodymenia leptophyllaDilophus spp Gelidium australe Rhodymenia linearisDilophus marginatus Gelidium spp Rhodymenia obtusaDictyopteris acrostichoides Pterocladia capillacea Rhodymenia stenoglossaDictyopteris muelleri Pterocladiella capillacea Rhodymenia wilsoniPadina sp. Nizymenia australis Cordylecladia furcellataHomeostrichus sinclairii Peyssonelia novaehollandiae Champia viridisZonaria angustata Halymenia plana Ballia callitrichaZonaria crenata Grateloupia filicina Ceramium sppZonaria spp Polyopes constrictus Griffithsia sp
Zonaria turnerianaPolyopes tasmanicus(S. tasmanica) Hemineura frondosa
Distromium spp Callophyllis lambertii Dictymenia harveyanaExallosorus olsenii Callophyllis rangiferina Dictymenia tridensLobophora variegata Plocamium angustum Lenormandia marginataCarpomitra costata Plocamium mertensii Other thallose red algaSporochnus sp Plocamium patagiatum Red turfing algaeColpomenia peregrina Phacelocarpus complanatus Encrusting corallinesColpomenia sinuosa Phacelocarpus peperocarpos Filamentous red algaeEcklonia radiata Acrotylus australis Lophurella pericladosMacrocystis angustifolia Plocamium cartilagineum Nemastoma feredayaeDurvillaea potatorum

Parks Victoria Technical Series No. 68 Twofold Shelf Subtidal Reef Monitoring
30
2.3 Data Analysis - Condition indicators
2.3.1 ApproachReef quality indicators were developed to encompass key features of MPA performance
assessment and management interest. The selection of indicators for reef ecosystem
management were reviewed by (Turner et al. 2006) and further theoretical and field
considerations are provided by Thrush et al. (2009). Both reviews suggest a variety of
indicators, of both ecosystem structure and function, should be used. Rapport (1992) noted
that it is easier to recognise adverse changes of an ecosystem from stressors than systems
in the natural range or in ‘good health’. Adverse changes to an ecosystem include:
• A shift to smaller organisms;
• Reduced diversity with loss of sensitive species;
• Increased dominance by weedy and exotic species;
• Shortened food chain lengths;
• Altered energy flows and nutrient cycling;
• Increased disease prevalence; and
• Reduced stability/increased variability (Rapport et al. 1995).
A suite of indicators was developed for the Tasmanian reef monitoring program, which uses
the same Edgar-Barrett underwater visual census methods (Stuart-Smith et al. 2008). The
indicators are grouped into the general categories: biodiversity; ecosystem functions;
introduced pests, climate change and fishing. The Stuart-Smith indicators were followed and
adapted for the Victorian SRMP. These indices are consistent with the reviews mentioned
above. Key adaptations were the use of absolute values rather than proportions, as the
Victorian data had considerable concurrent variation in the numerator and denominator of
many indices, making proportional indices difficult to interpret. The Stewart-Smith approach
for examining community changes was extended by using the multivariate control charting
method of Anderson and Thompson (2004).
The indicators were calculated separately for the three survey components, fishes,
invertebrates and algae.
The indicators presented in this report provide a basis for assessment and further refinement
of indicators for marine protected area performance assessment and management.
2.3.2 BiodiversityCommunity StructureThe hyper-dimensional information in the dissimilarity matrix was simplified and depicted
using non-metric multidimensional scaling (MDS; Clarke 1993). This ordination method finds
the representation in fewer dimensions that best depicts the actual patterns in the hyper-

30
Parks Victoria Technical Series No. 68 Twofold Shelf Subtidal Reef Monitoring
dimensional data (i.e. reduces the number of dimensions while depicting the salient
relationships between the samples). The MDS results were then depicted graphically to show
differences between the replicates at each location. The distance between points on the
MDS plot is representative of the relative difference in community structure.
Kruskal stress is an indicator statistic calculated during the ordination process and indicates
the degree of disparity between the reduced dimensional data set and the original hyper-
dimensional data set. A guide to interpreting the Kruskal stress indicator is given by (Clarke
1993): (< 0.1) a good ordination with no real risk of drawing false inferences; (< 0.2) can lead
to a usable picture, although for values at the upper end of this range there is potential to
mislead; and (> 0.2) likely to yield plots which can be dangerous to interpret. These
guidelines are simplistic and increasing stress is correlated with increasing numbers of
samples. Where high stress was encountered with a two-dimensional data set, three-
dimensional solutions were sort to ensure adequate representation of the higher-dimensional
patterns.
Trends in Community StructureMultivariate control charting was used to examine the degree of changes in community
structure over time. Two criteria were assessed, the first being the deviation in community
structure at a time t from the centroid of baseline community structures. This criterion is more
sensitive to the detection of gradual changes over time away from the baseline conditions. In
this case, the first 5 surveys were used for the baseline centroid (recognising there were 6
baseline surveys for 8 sites and 5 baseline surveys for 4 sites). The second criterion was the
deviation in community structure at time t to the centroid of all previous times (t-1). This
criterion is more sensitive at detecting abrupt or pulse changes.
Control charts were prepared for each site as well as on a regional basis for combined sites
inside the marine protected area and for reference sites. The regional analysis used average
species abundances across sites within each region. The analysis used the methods of
(Anderson and Thompson 2004) and calculations were done using the software
ControlChart.exe (Anderson 2008). The analysis used the Bray-Curtis dissimilarity coefficient
and the same data transformations described above. Bootstrapping was used to provide
control-chart limits for identifying changes that are ‘out of the ordinary’. In this case, a 90th
percentile statistic was calculated from 10 000 bootstrap samples as a provisional limit or
trigger line. The 50th percentile was also presented to assist in interpreting the control charts.

Parks Victoria Technical Series No. 68 Twofold Shelf Subtidal Reef Monitoring
31
Species DiversityThe total number of individuals, N, was calculated as the sum of the abundance of all
individuals across species. This index is used to show any simultaneous depression of
abundances across all species.
Species richness, S, is given as the number of species observed at each site. Cryptic,
pelagic and non-resident reef fishes were not included.
Species diversity, as a measure of the distribution of individuals among the species, was
indicated using Hill’s N2 statistic (which is equivalent to the reciprocal of Simpson’s index).
The value varies between 1 and S (i.e. the total number of species in the sample) with higher
values indicating higher diversity. In general, Hills N2 gives an indication of the number of
dominant species within a community. Hills N2 provides more weighting for common species,
in contrast to indices such as the Shannon-Weiner Index (Krebs 1999), which weights the
rarer species.
The diversity statistics were averaged across sites to for the marine protected area and
reference regions.
Abundances of Selected SpeciesMean abundance of selected species was plotted over time for the marine protected area
and reference regions. The species presented included abundant or common species as well
as any with unusual changes over time.
2.3.3 Ecosystem Functional ComponentsPlant Habitat and ProductionBiogenic habitat and standing stocks of primary producers was indicated by the pooled
abundances of macrophyte groups:
• Crustose coralline algae;
• Canopy browns – defined here as Ecklonia radiata, Undaria pinnatifida, Lessonia
corrugata, Macrocystis pyrifera (which includes the M. “angustifolia” ecomorph),
Durvillaea potatorum, Phyllospora comosa, Seirococcus axillaris, Acrocarpia
paniculata, Cystophora platylobium, C. moniliformis, C. pectinata, C. monilifera, C.
retorta and C. retroflexa;
• Smaller browns (all other brown species except Ectocarpales);
• Erect coralline algae;
• Thallose red algae (except filamentous species);
• Green algae; and
• seagrass Amphibolis Antarctica.

Parks Victoria Technical Series No. 68 Twofold Shelf Subtidal Reef Monitoring
32
The index of summed species points-cover does not equate to a total cover estimate in some
cases as using species cover can be overlapping with other species at different heights.
Invertebrate GroupsThe abundance of invertebrates was pooled into the functional groups:
• Grazers and habitat modifiers, including gastropods and sea urchins;
• Filter feeders, including fanworms and feather stars;
• Predators, including gastropods, crabs and lobsters but excluding seastars; and
• Seastars, which are mostly predators, although Meridiastra gunnii may also be a
detritus feeder.
Fish GroupsThe abundance of fishes was also pooled into trophic groups:
• Herbivores and omnivorous grazers;
• Foraging predators, including pickers and foragers of stationary, benthic prey such as
amphipods, crabs and gastropods;
• Hunter predators, including fishes that hunt mobile prey, particularly other fishes, as
chasers and ambushers; and
• Planktivores, including feeders of zooplankton and small fish in the water column.
Sediment CoverThe percentage cover of sand and sediment on the survey transect (using Method 3) is the
only relevant abiotic parameter measured for the SRMP. This index may indicate changes in
hydrodynamic or coastal processes.
2.3.4 Introduced speciesThe status of introduced species is initially reported as presence-absence of species. Where
a species is established and the SRMP measures the abundance of that species, indicators
of status are:
• Number of introduced species;
• Total abundance of introduced species; and
• Where the data is suitable, time series of abundance of selected introduced species –
noting the timing of surveys may influence the time series.

Parks Victoria Technical Series No. 68 Twofold Shelf Subtidal Reef Monitoring
33
2.3.5 Climate changeSpecies CompositionClimate change is likely to cause changes to current strengths and circulation patterns which
affect both the ambient temperature regime and the dispersion and recruitment of propagules
or larvae. In Victoria, there may be increased incursions of the East Australia Current into
eastern Victoria and the South Australia Current into western Victoria and Bass Strait.
Biological responses to such changes are potentially indicated by biogeographical changes
in the species composition, toward that of adjacent, warmer bioregions. For this analysis,
each species was assigned a nominal geographical range:
• Coldwater species, reflecting the ‘Maugean’ province, from approximately Kangaroo
Island in South Australia, around Tasmania and into southern New South Wales;
• Western species, reflecting the ‘Flindersian’ province, from southern Western
Australia, along the Great Australian Bight and South Australia to western Victoria;
• Eastern species, reflecting the ‘Peronian’ province, encompassing New South Wales
and into eastern Victoria;
• Southern species, including species ranging widely along the southern Australian
coast; and
• Northern species, including warm temperate and tropical species in Western Australia
and New South Wales and northward.
The number of species and total number of individuals was calculated for the coldwater,
western and eastern groups.
Macrocystis pyriferaThe string kelp Macrocystis pyrifera (which includes the former species M. angustifolia,
Macaya and Zuccarello 2010) is considered potentially vulnerable to climate change through
reduced nutrient supply from drought and nutrient poorer warmer waters (Edyvane 2003).
The mean abundance of string kelp Macrocystis pyrifera was plotted using densities from
Method 4, or cover estimates from Method 4 where density data were unavailable.
Macrocystis provides considerable vertical structure to reef habitats and can also attenuate
water currents and wave motion. The loss of Macrocystis habitats are likely to reflect
ecosystem functional changes.
Centrostephanus rodgersiiThe long-spined sea urchin Centrostephanus rodgersii has been increasing its range
conspicuously over the past decades (Johnson et al. 2005). This grazing species can cause
considerable habitat modification, decreasing seaweed canopy cover and increasing area of
‘urchin barrens’. Abundances are determined using Method 2 and average abundances are

Parks Victoria Technical Series No. 68 Twofold Shelf Subtidal Reef Monitoring
34
plotted through time. The abundances of C. rodgersii are also influenced by interactions with
abalone as competitors for crevice space, abalone divers, who may periodically ‘cull’ urchins
within a reef patch and by sea urchin harvesters.
Durvillaea potatorumThe bull kelp Durvillaea potatorum is a coldwater species that is likely to be vulnerable to
increased ambient temperatures. There is anecdotal evidence of a decline in range down the
New South Wales coast by approximately 80 km. Most of the SRMP sites specifically avoid
Durvillaea habitats as these occur on highly wave-affected and turbulent reefs. Some sites
contain Durvillaea stands, providing limited data on population status. Durvillaea potatorum is
potentially two species, having genetically and morphologically distinct eastern and western
forms (Fraser et al. 2009).

Parks Victoria Technical Series No. 68 Twofold Shelf Subtidal Reef Monitoring
35
2.3.6 FishingAbaloneIndicators of changed population structure from harvesting pressure on abalone were mean
density and the proportion of legal sized individuals. The size-frequency histograms were
also examined. The indicators were calculated for the blacklip abalone Haliotis rubra in most
regions and for the greenlip abalone H. laevigata where present in suitable densities (in
central and western Victoria).
Rock LobsterThe southern rock lobster Jasus edwardsii is present throughout Victoria and the packhorse
lobster Jasus verreauxi is present in the Twofold Shelf region. The SRMP transects generally
did not traverse rock lobster microhabitats, however abundances and sizes are reported for
suitable data.
FishesPotential fishing impacts or recovery of fishing impacts within marine protected areas were
indicated by:
Abundances of selected fished species;
• Mean size and size-frequency histograms of selected fished species;
• Total abundance of fishes > 200 mm length, this being the approximate legal
minimum size for most fished species;
• Biomass of fishes > 200 mm length, calculated using length-weight relationships; and
• Parameters of the size-spectra of all fishes.
The size spectrum of all fishes at a site was first centred and linearised. Size frequencies for
each field size class were aggregated into classes centred on 87.5 mm (classes 1-6), 200
mm (class 7); 275 mm (classes 8-9); 356.25 mm (classes 10-11); 400 mm (class 12); 500
mm (class 13); 625 mm (class 14); and 750+ mm (class 15). The frequencies and size
classes were loge(x +1) and the size classes are centred by subtracting the mean. Linear
regression was used to estimate the slope and intercept (which is also the half-height of the
slope) of the log-transformed spectrum.
Biomass was calculated for selected species ≥ 300 mm. Lengths were converted to weights
using published conversion factors for the power relationship: weight(grams)=a x
Length(cm)b. The weight estimations used the coefficients compiled by Lyle and Campbell
(1999). The selected species were the most common species under heaviest fishing
pressure (where present):
• Banded morwong Cheilodactylus spectabilis (a = 0.0629, b = 2.881);
• Bastard trumpeter Latridopsis forsteri (a = 0.0487, b = 3.14);

Parks Victoria Technical Series No. 68 Twofold Shelf Subtidal Reef Monitoring
36
• Blue throated wrasse Notolabrus tetricus (a = 0.0539, b = 2.17);
• Purple wrasse Notolabrus fucicola (a = 0.0539, b = 2.17);
• Crimson banded wrasse Notolabrus gymnogenis (a = 0.0539, b = 2.17); and
• Eastern blue groper Achoerodus viridis (a = 0.0539, b = 2.17).

Parks Victoria Technical Series No. 68 Twofold Shelf Subtidal Reef Monitoring
37
3 CAPE HOWE MARINE NATIONAL PARK
3.1 Site DescriptionsThree sites, Sites 13, 14 and 15, were positioned over the main shallow reef area within the
Cape Howe Marine National Park, which is present only in the north eastern region of the
park (Figure 3.1). These sites were varied slightly in substratum structure, with lower relief
reef present in the western area (Howe West) and larger bombies, holes and drop-offs
present at Howe Border. The monitoring program stipulated four sites within the MNP,
however the limited reef area within shallow waters meant any fourth site could not be well
separated from the others. For 2004 and 2006, Site 20 was established perpendicular to, and
crossing the Howe West Site. This was later deemed statistically inappropriate so, in 2009,
this site was replaced by Site 27, set parallel to Howe Central, 75 m apart. This new site was
considerably deeper (10-12 m) and has a different seaweed community.
Two of the original reference sites for the Cape Howe Marine National Park were located on
sea urchin barrens on the west coasts of Tullaberga and Gabo Islands. These sites were
selected as they represent an alternative state of reef habitat within the region, as opposed
to kelp bed habitat. The Gabo Island site was also recognised as having conservation value
in terms of the fish assemblages.
The two urchin barren reference sites on Tullaberga and Gabo Islands were later deemed
inappropriate for statistical purposes, with a preference for reference sites with similar habitat
types to those present at the sites inside the Marine National Park. In 2009, these sites were
substituted by two sites on the eastern side of Gabo Island. Representative Phyllospora
habitat was not found, with the two new reference sites being dominated by a mixture of
Phyllospora comosa, Acrocarpia paniculata, smaller brown algae such as Halopteris and
Zonaria spp, erect coralline algae and crustose coralline algae. The substratum at these sites
consisted of steep drop-offs from the shore to 7 m depth with boulder fields, rocky outcrops
and steps at the base.
Two other reference sites were positioned on Iron Prince Reef. These two sites have similar
reef substrata to that observed at sites within the Cape Howe Marine National Park: having
larger boulders of moderate relief (1-2 m) with patches of relatively flat, slab reef. Occasional
steps/ledges, drop-offs/wall and cavern habitat are also present. The Iron Prince and Cape
Howe sites were dominated by a tall canopy of Phyllospora comosa on the higher reef
patches.

Parks Victoria Technical Series No. 68 Twofold Shelf Subtidal Reef Monitoring
38
Figure 3.1. Location of monitoring sites inside and outside Cape Howe Marine National Park (shaded area).

Parks Victoria Technical Series No. 68 Twofold Shelf Subtidal Reef Monitoring
39
3.2 Biodiversity3.2.1 Community StructureMacroalgae
The algal composition at Cape Howe was dominated by monospecific stands of the
crayweed Phyllospora comosa. Other dominant species were the brown algae Halopteris
spp., crustose coralline algae, and the coralline red Haliptilon roseum.
The non-metric MDS plot indicated algal assemblage structure had a similar level of
variability between times at each site. The Iron Prince and Cape Howe sites overlapping in
community structure between times. The two new eastern Gabo Island sites were
moderately distinct from the mainland sites (Figure 3.2).
The multivariate control charts indicated slight deviations of algal assemblages at Howe
Central to be at or above the 90th percentile confidence limit, in terms of deviation from
centroids of both the baseline period and all previous times (Figure 3.3). The control charts
indicated substantial deviations of the mean reference condition for the past two surveys.
This is likely to be driven by the change of reference sites in 2009 (Figure 3.3).
Invertebrates
There were typically higher abundances of large herbivorous invertebrates at Cape Howe.
These included the sea urchin Centrostephanus rodgersii, blacklip abalone Haliotis rubra,
and the periwinkle Turbo undulatus.
The nMDS plot indicated relative stability in invertebrate assemblages within each site, with
relative differences between being maintained through time (Figure 3.4).
The multivariate control charts indicated two sites had deviated significantly in 2010: Site 12
Iron Prince and Site 15 Howe Border (Figure 3.5). The control charts indicated substantial
deviations of the mean reference condition for the past two surveys. This is likely to be driven
by the change of reference sites in 2009 (Figure 3.5).
Fish
The predominant fish species at Cape Howe were the blue throat wrasse Notolabrus tetricus,
the purple wrasse Notolabrus fucicola. The overall abundance of wrasses was lower at Cape
Howe than at Point Hicks, however there was a greater variety of wrasse species present,
including the Maori wrasse Ophthalmolepis lineolata. Fish that were more abundant in the
Cape Howe region included herring cale Odax cyanomelas, banded morwong Cheilodactylus
spectabilis, kelpfish Aplodactylus lophodon, striped mado Atypichthys strigatus and the
damselfishes Parma microlepis and Chromis hypsilepis.

40
Parks Victoria Technical Series No. 68 Twofold Shelf Subtidal Reef Monitoring
The nMDS plot indicated distinction in fish assemblages between sites, although there was
some overlap in assemblage structure for some sites and times (Figure 3.6). The time trend
for Site 13 Howe West followed a consistent trajectory between each of the surveys. The
assemblage during the 2010 survey was outside the 90th percentile confidence limit for
deviation from both the baseline centroid and the prior surveys centroid (Figure 3.7). The
average regional assemblage structure for the marine protected area and references were
within the control chart limits (Figure 3.7).
nMDS - Algae
ref - 25 Gabo NE Gulch ref - 26 Gabo Boulder Bay ref - 12 Iron Princeref - 19 Prince Wreckmpa - 13 Howe West mpa - 14 Howe Central mpa - 15 Howe Border mpa - 27 Howe Outer
Figure 3.2. MDS plot of algal assemblage structure inside and outside the Cape Howe Marine
National Park in March 2010. Kruskal stress = 12.30.

Dev
iatio
n20
3
040
5
0D
evia
tion
3040
5060
6020
Dev
iatio
n20
3
040
5
0D
evia
tion
30
40
50
6
0 70
6020
Parks Victoria Technical Series No. 68 Twofold Shelf Subtidal Reef Monitoring
41
Control Chart - Algaea. Sites - Baseline
Centroidb. Sites - Prior Times Centroid
2004 2005 2006 2007 2008 2009 2010 2011 2004 2005 2006 2007 2008 2009 2010 2011
c. Regions - Baseline Centroid
d. Regions - Prior Times Centroid
2004 2005 2006 2007 2008 2009 2011 2004 2005 2006 2007 2008 2009 2011Year Year
ref - 12 Iron Prince ref - 19 Prince Wreck mpa - 13 Howe Westmpa - 14 Howe Central mpa - 15 Howe Border region - MPAregion - Reference
Figure 3.3. Control chart of algal assemblage structure inside and outside the Cape Howe Marine National Park.

Parks Victoria Technical Series No. 68 Twofold Shelf Subtidal Reef Monitoring
42
nMDS - Invertebrates
ref - 25 Gabo NE Gulch ref - 26 Gabo Boulder Bay ref - 12 Iron Princeref - 19 Prince Wreckmpa - 13 Howe West mpa - 14 Howe Central mpa - 15 Howe Border mpa - 27 Howe Outer
Figure 3.4. MDS plot of invertebrate assemblage structure inside and outside the Cape Howe Marine National Park in March 2010. Kruskal stress = 12.53.

Dev
iatio
n20
3
040
5
0D
evia
tion
2030
4060
1050
Dev
iatio
n20
3040
Dev
iatio
n20
3040
1050
1050
Parks Victoria Technical Series No. 68 Twofold Shelf Subtidal Reef Monitoring
43
Control Chart - Invertebrates
a. Sites - Baseline Centroid
b. Sites - Prior Times Centroid
2004 2005 2006 2007 2008 2009 2010 2011 2004 2005 2006 2007 2008 2009 2010 2011
c. Regions - Baseline Centroid
d. Regions - Prior Times Centroid
2004 2005 2006 2007 2008 2009 2011 2004 2005 2006 2007 2008 2009 2011Year Year
ref - 12 Iron Prince ref - 19 Prince Wreck mpa - 13 Howe Westmpa - 14 Howe Central mpa - 15 Howe Border region - MPAregion - Reference
Figure 3.5. Control chart of invertebrate assemblage structure inside and outside the Cape Howe Marine National Park.

Parks Victoria Technical Series No. 68 Twofold Shelf Subtidal Reef Monitoring
44
nMDS - Fishes
ref - 25 Gabo NE Gulch ref - 26 Gabo Boulder Bay ref - 12 Iron Princeref - 19 Prince Wreckmpa - 13 Howe West mpa - 14 Howe Central mpa - 15 Howe Border mpa - 27 Howe Outer
Figure 3.6. MDS plot of fish assemblage structure inside and outside the Cape Howe Marine National
Park in March 2010. Kruskal stress = 12.35.

Dev
iatio
n15
2535
Dev
iatio
n25
3545
4515
Dev
iatio
n 20
3
0
40
50
Dev
iatio
n20
3040
5060
7
0
Parks Victoria Technical Series No. 68 Twofold Shelf Subtidal Reef Monitoring
45
Control Chart - Fishes
a. Sites - Baseline Centroid
b. Sites - Prior Times Centroid
2004 2005 2006 2007 2008 2009 2010 2011 2004 2005 2006 2007 2008 2009 2010 2011
c. Regions - Baseline Centroid
d. Regions - Prior Times Centroid
2004 2005 2006 2007 2008 2009 2011 2004 2005 2006 2007 2008 2009 2011Year Year
ref - 12 Iron Prince ref - 19 Prince Wreck mpa - 13 Howe Westmpa - 14 Howe Central mpa - 15 Howe Border region - MPAregion - Reference
Figure 3.7. Control chart of fish assemblage structure inside and outside the Cape Howe Marine National Park.

Parks Victoria Technical Series No. 68 Twofold Shelf Subtidal Reef Monitoring
46
3.2.2 Species Richness and DiversityMacroalgae
The total algal abundance was relatively stable over time for both the marine protected area
and reference regions (Figure 3.8a). There was a slight increasing trend in algal species
richness within the Cape Howe Marine National Park. The change in reference sites in 2009
resulted in a large increase in species richness, reflecting the high diversity on eastern Gabo
Island (Figure 3.8b). The Hill’s N2 diversity index showed a clearer increasing trend within the
Cape Howe Marine National Park (Figure 3.9c).
Invertebrates
Invertebrate total abundances have generally declined both inside and outside the Cape
Howe Marine National Park to approximately half the levels of the baseline survey (Figure
3.9a). There have been fluctuations in both species richness and species diversity over the
monitoring period with levels of both regions in 2010 being similar to baseline levels (Figures
3.9b and 3.9c).
Fish
Total fish abundance has not changed markedly within the Cape Howe Marine National Park,
although there was a slight decline between 2009 and 2010 (Figure 3.10a). There was a
considerable peak in fish abundance at the reference sites in 2004 (Figure 3.10a). Fish
species richness and fish diversity increased considerably between 2001 and 2004 and
again between 2006 and 2009. These levels were sustained to 2010 (Figures 3.10b and
3.10c).
Total abundance of fish at the reference areas peaked in 2004, decreasing in subsequent
surveys. During 2010 survey abundances were the lowest recorded (Figure 3.10a).
Abundances at the MNP area were variable over time.
Fish species richness and species diversity followed similar patterns at both the MNP and
the reference areas. There had been slight increasing trend in species richness over time
(Figure 3.10b). During 2009 there was a peak in species diversity reaching the highest levels
recorded. During 2010 the MNP areas remained high and the reference areas dropped to
original levels (Figure 3.10c). Increases in diversity were also apparent at the reference sites
during recent surveys, with this likely to be influenced by the change in monitoring sites
(Figure 3.10c).

Hill
s N
2N
o. S
peci
es
1015
2025
01
23
45
60
5
Parks Victoria Technical Series No. 68 Twofold Shelf Subtidal Reef Monitoring
47
b. Algal Species Richness
MNPref
2002 2004 2006 2008 2010
Yearc. Algal Diversity
MNPref
2002 2004 2006 2008 2010
YearFigure 3.8. Algal species diversity inside and outside the Cape Howe Marine National Park.

)) 22̂̂mm 000022rree pp(( D
ensi
ty (p
er 2
00 m
2 )H
ills
N2
No.
Spe
cies
01
23
40
24
68
10
120
200
600
1000
Parks Victoria Technical Series No. 68 Twofold Shelf Subtidal Reef Monitoring
48
a.Invertebrate Total Abundance
MNPref
2002 2004 2006 2008 2010
Year
b. Invertebrate Species Richness
MNPref
2002 2004 2006 2008 2010
Year
c. Invertebrate Diversity
MNPref
2002 2004 2006 2008 2010
YearFigure 3.9. Invertebrate species diversity inside and outside the Cape Howe Marine National Park.

)) 22̂̂mm 00000022rree pp((
Den
sity
(per
200
0 m
2 )H
ills
N2
4
No.
Spe
cies
02
68
05
1015
200
200
600
1000
Parks Victoria Technical Series No. 68 Twofold Shelf Subtidal Reef Monitoring
49
a. Fish Total Abundance
MNPref
2002 2004 2006 2008 2010
Year
b. Fish Species Richness
MNP ref
2002 2004 2006 2008 2010
Year
c. Fish Diversity
MNPref
2002 2004 2006 2008 2010
YearFigure 3.10. Fish species diversity inside and outside the Cape Howe Marine National Park.

50
Parks Victoria Technical Series No. 68 Twofold Shelf Subtidal Reef Monitoring
3.2.3 Abundances of Selected Species
PrefaceThe reference sites were changed in 2009 so trends in overall means need to be interpreted
carefully alongside site abundances, which are not presented here. The following reporting
focuses on trends within the marine protected area. One site within the Marine National Park
was changed from Howe Perpendicular to Howe Deep in 2009. This is likely to affect some
of the apparent temporal trends with habitat differences occurring with depth.
Macroalgae
Within the Cape Howe Marine National Park, the abundance of crayweed Phyllospora
comosa declined by approximately 25 % cover between 2004 and 2009 (Figure 3.11a). Over
the same period, there was an apparent increase in the abundances of the small brown
algae Halopteris spp and the erect coralline alga Haliptilon roseum (Figure 3.11b and 3.11d).
There was no apparent trend in the abundance of crustose coralline algae (Figure 3.11c –
note this group was not measured during the first survey).
Invertebrates
Over the monitoring period there was a slight, but statistically insignificant, increase in the
abundance of the long-spined urchin Centrostephanus rodgersii within the Cape Howe
Marine National Park (Figure 3.12a). There was a relatively large decline in abundances of
the periwinkle Turbo undulatus and blacklip abalone Haliotis rubra to 2006 remained low
while there was increase of H. rubra to back to baseline abundance level by 2010 (Figure
3.12.b and 3.12c). There was a consistent decline in abundance of the common sea urchin
Heliocidaris erythrogramma over the monitoring period in the Cape Howe Marine National
Park (Figure 3.12d). This decline was contrary to abundances in the reference areas, with a
peak in abundance occurring in 2006. The abundance of the whelk Cabestana spengleri was
generally low within the Cape Howe Marine National Park compared with the reference areas
(Figure 3.12e).
Fish
The abundances of both the blue throated wrasse Notolabrus tetricus and the purple wrasse
Notolabrus fucicola have increased considerably inside the Cape Howe Marine National Park
between 2006 and 2009 (Figures 3.13a and 3.13b).
The abundance of herring cale Odax cyanomelas oscillated between surveys with the
abundance during the 2010 survey appearing to be at the lower levels as observed
previously (Figure 3.13c).

Parks Victoria Technical Series No. 68 Twofold Shelf Subtidal Reef Monitoring
51
For the banded morwong Cheilodactylus spectabilis, abundances steadily increased from
baseline levels of 5 per 2000 m2 up to 15 per 2000 m2 in 2009 inside Cape Howe Marine
National Park. There was a subsequent decrease in 2010 (Figure 3.13d).
The eastern kelp fish Aplodactylus lophodon was similar in abundance from the baseline
surveys until 2006. There was a spike in abundance during 2009, with a subsequent decline
to less than baseline levels in 2010 (Figure 3.13e).

cc.. CCrruussttoossee ccoorraalllliinnee aallggaaee
bb.. HHaalloopptteerriiss sspppp
Cov
er (%
)C
over
(%)
Cov
er (%
)
05
1015
2025
02
46
810
020
4060
80
100
Parks Victoria Technical Series No. 68 Twofold Shelf Subtidal Reef Monitoring
52
a. Phyllospora com osa
MNPref
2002 2004 2006 2008 2010
Year
b. Halopteris spp
MNPref
2002 2004 2006 2008 2010
Year
c. Crustose coralline algae
MNPref
2002 2004 2006 2008 2010
Year
Figure 3.11. Percent cover of predominant algal species inside and outside the Cape Howe Marine National Park. Note: crustose coralline algae were not surveyed in 2001.

Cov
er (%
)
02
46
Parks Victoria Technical Series No. 68 Twofold Shelf Subtidal Reef Monitoring
53
d. Haliptilon roseum
MNPref
2002 2004 2006 2008 2010
Year
Figure 3.11 (continued). Percent cover of predominant algal species inside and outside the Cape Howe Marine National Park.

)) 22̂̂mm 000022rreepp ((
)) 22̂̂mm 000022rreepp ((
)) 22̂̂mm 000022rreepp ((
Den
sity
(per
200
m2 )
Den
sity
(per
200
m2 )
Den
sity
(per
200
m2 )
050
100
150
0
5015
025
00
50
150
250
Parks Victoria Technical Series No. 68 Twofold Shelf Subtidal Reef Monitoring
54
a. Centrostephanus rodgersii
MNPref
2002 2004 2006 2008 2010
Year
b. Turbo undulatus
MNPref
2002 2004 2006 2008 2010
Year
c. Haliotis rubra
MNPref
2002 2004 2006 2008 2010
Year
Figure 3.12. Site abundance (per 200 m2) of predominant invertebrate species inside and outside the Cape Howe Marine National Park.

)) 22̂̂mm 000022rreepp ((
)) 22̂̂mm 000022rreepp ((
Den
sity
(per
200
m2 )
Den
sity
(per
200
m2 )
010
2030
400
2040
6080
Parks Victoria Technical Series No. 68 Twofold Shelf Subtidal Reef Monitoring
55
d. Heliocidaris erythrogram m a
MNPref
2002 2004 2006 2008 2010
Year
e. Cabestana spengleri
MNPref
2002 2004 2006 2008 2010
Year
Figure 3.12 (continued). Site abundance (per 200 m2) of predominant invertebrate species inside and outside the Cape Howe Marine National Park.

)) 22̂̂mm 00000022rreepp
)) 22̂̂mm 00000022rreepp
)) 22̂̂mm 00000022rreep D
ensi
ty (p
er 2
000
m2 )
Den
sity
(per
200
0 m
2 )D
ensi
ty (p
er 2
000
m2 )
0
1030
5070
010
2030
4050
010
2030
4050
Parks Victoria Technical Series No. 68 Twofold Shelf Subtidal Reef Monitoring
56
a. Notolabrus tetricus
MNPref
2002 2004 2006 2008 2010
Year
b. Notolabrus fucicola
MNPref
2002 2004 2006 2008 2010
Year
c. Odax cyanom elas
MNPref
2002 2004 2006 2008 2010
Year
Figure 3.13. Site abundance (number per 2000 m2) of predominant fish species inside and outside the Cape Howe Marine National Park.

)) 22̂̂mm 00000022rreepp
)) 22̂̂mm 00000022rreepp
Den
sity
(per
200
0 m
2 )D
ensi
ty (p
er 2
000
m2 )
051
0
15
20
25
30
05
1015
20
Parks Victoria Technical Series No. 68 Twofold Shelf Subtidal Reef Monitoring
57
d. Cheilodactylus spectabilis
MNPref
2002 2004 2006 2008 2010
Year
e. Aplodactylus lophodon
MNPref
2002 2004 2006 2008 2010
Year
Figure 3.13 (continued). Site abundance (number per 2000 m2) of predominant fish species inside and outside the Cape Howe Marine National Park.

Parks Victoria Technical Series No. 68 Twofold Shelf Subtidal Reef Monitoring
58
3.3 Ecosystem Components
PrefaceThe reference sites were changed in 2009 so trends in overall means need to be interpreted
carefully alongside site abundances, which are not presented here. The following reporting
focuses on trends within the marine protected area. One site within the Marine National Park
was changed from Howe Perpendicular to Howe Deep in 2009. This is likely to affect some
of the apparent temporal trends with habitat differences occurring with depth.
Habitat and Production
As described previously, there were no apparent trends in cover of crustose coralline algae
(Figure 3.14a).
There was an apparent decline in canopy brown algae from 2002 to 2006, which continued
through 2009 and 2010, with a decline from approximately 80% to 40% cover (Figure 3.14b).
Some of the decline in 2009 and 2010 is likely to be an artefact from the change in site
location from Howe Central to Howe Deep.
The seaweed microhabitat of smaller brown algae, erect coralline algae and thallose red
algae have similar trends with increases post park declaration to highest abundances
occurring in 2009 and 2010 (Figures 3.14b to 3.14e).
Green algae remained low in abundance throughout the monitoring period (Figure 3.14f).
Invertebrate Groups
The invertebrate grazers within the Cape Howe MNP followed the same trend as blacklip
abalone Haliotis rubra, having a decline to 2006 with a subsequent increase to 2010 (Figure
3.15a). The densities of invertebrate filter feeders and seastars were generally low with no
apparent trends (Figures 3.15b and 3.15d). There were no apparent trends in invertebrate
predators during the monitoring period (Figure 3.15c).
Fish Groups
The fish grazers followed the variable pattern of herring cale Odax cyanomelas (Figure
3.16a). Fish foragers, such as morwong and wrasses, increased steadily from the baseline
abundance until 2009. There was a decline to below baseline abundance in 2010 (Figure
3.16b). The same pattern occurred for fish hunters, including fishes such as long finned pike
Dinolestes lewini (Figure 3.16c).
The abundance of fish planktivores, such as sweep, was relatively constant from the
baseline to 2006, after which there were considerably higher densities (Figure 3.16d).

Parks Victoria Technical Series No. 68 Twofold Shelf Subtidal Reef Monitoring
59
Sediment Cover
Sediment cover was not recorded during the first survey in 2001. Sediment cover remained
relatively low at Cape Howe over the surveys (Figure 3.17).

60
Cov
er (%
)
10
Cov
er (%
)C
over
(%)
05
150
2040
6080
100
05
10
2030
Parks Victoria Technical Series No. 68 Twofold Shelf Subtidal Reef Monitoring
a. Crustose Coralline Algae
MNPref
2002 2004 2006 2008 2010
Year
b. Canopy Browns
MNPref
2002 2004 2006 2008 2010
Year
c. Smaller Browns
MNPref
2002 2004 2006 2008 2010
YearFigure 3.14. Seaweed functional groups inside and outside the Cape Howe Marine National Park.

Cov
er (%
)C
over
(%)
Cov
er (%
)
01
23
45
60
510
1520
05
1015
20
Parks Victoria Technical Series No. 68 Twofold Shelf Subtidal Reef Monitoring
61
d. Erect Coralline Algae
MNPref
2002 2004 2006 2008 2010
Year
e. Thallose Red Algae
MNPref
2002 2004 2006 2008 2010
Yearf. Green Algae
MNPref
2002 2004 2006 2008 2010
YearFigure 3.14 (continued). Seaweed functional groups inside and outside the Cape Howe Marine National Park.

)) 22̂^mm 000022rree pp
)) 22̂^mm 000022rree pp
)) 22̂^mm 000022rree ppD
ensi
ty (p
er 2
00 m
2 )
10
20
30
40
50
60
Den
sity
(per
200
m2 )
Den
sity
(per
200
m2 )
200
400
60
0 8
000
05
1015
200
Parks Victoria Technical Series No. 68 Twofold Shelf Subtidal Reef Monitoring
62
a.Invertebrate Grazers
MNPref
2002 2004 2006 2008 2010
Year
b. Invertebrate Filter Feeders
MNPref
2002 2004 2006 2008 2010
Year
c. Invertebrate Predators
MNPref
2002 2004 2006 2008 2010
Year
Figure 3.15. Mean abundance of invertebrate functional groups inside and outside the Cape Howe Marine National Park.

)) 22̂^mm 000022rree pp(( D
ensi
ty (p
er 2
00 m
2 )
0.0
0.5
1.0
1.5
Parks Victoria Technical Series No. 68 Twofold Shelf Subtidal Reef Monitoring
63
d. Seastars
MNPref
2002 2004 2006 2008 2010
Year
Figure 3.15 (continued). Mean abundance of invertebrate functional groups inside and outside the Cape Howe Marine National Park.

)) 22̂̂mm 00000022rree p
)) 22̂^mm 00000022rree
)) 22̂^mm 00000022rree p
Den
sity
(per
200
0 m
2 )D
ensi
ty (p
er 2
000
m2 )
Den
sity
(per
200
0 m
2 )
010
3050
020
040
060
080
00
2040
6080
Parks Victoria Technical Series No. 68 Twofold Shelf Subtidal Reef Monitoring
64
a. Fish Grazers
MNPref
2002 2004 2006 2008 2010
Year
b. Fish Foragers
MNPref
2002 2004 2006 2008 2010
Year
c. Fish Hunters
MNPref
2002 2004 2006 2008 2010
Year
Figure 3.16. Mean abundance of fish functional groups inside and outside the Cape Howe Marine National Park.

)) 22̂̂mm 00000022rree
Cov
er (%
)D
ensi
ty (p
er 2
000
m2 )
5010
0 1
50
200
02
46
80
Parks Victoria Technical Series No. 68 Twofold Shelf Subtidal Reef Monitoring
65
d. Fish Planktivores
MNPref
2002 2004 2006 2008 2010
Year
Figure 3.16 (continued). Mean abundance of fish functional groups inside and outside the Cape Howe Marine National Park.
Sediment Cover
MNPref
2002 2004 2006 2008 2010
YearFigure 3.17. Mean cover (± Standard Error) of sediment inside and outside the Cape Howe Marine National Park.
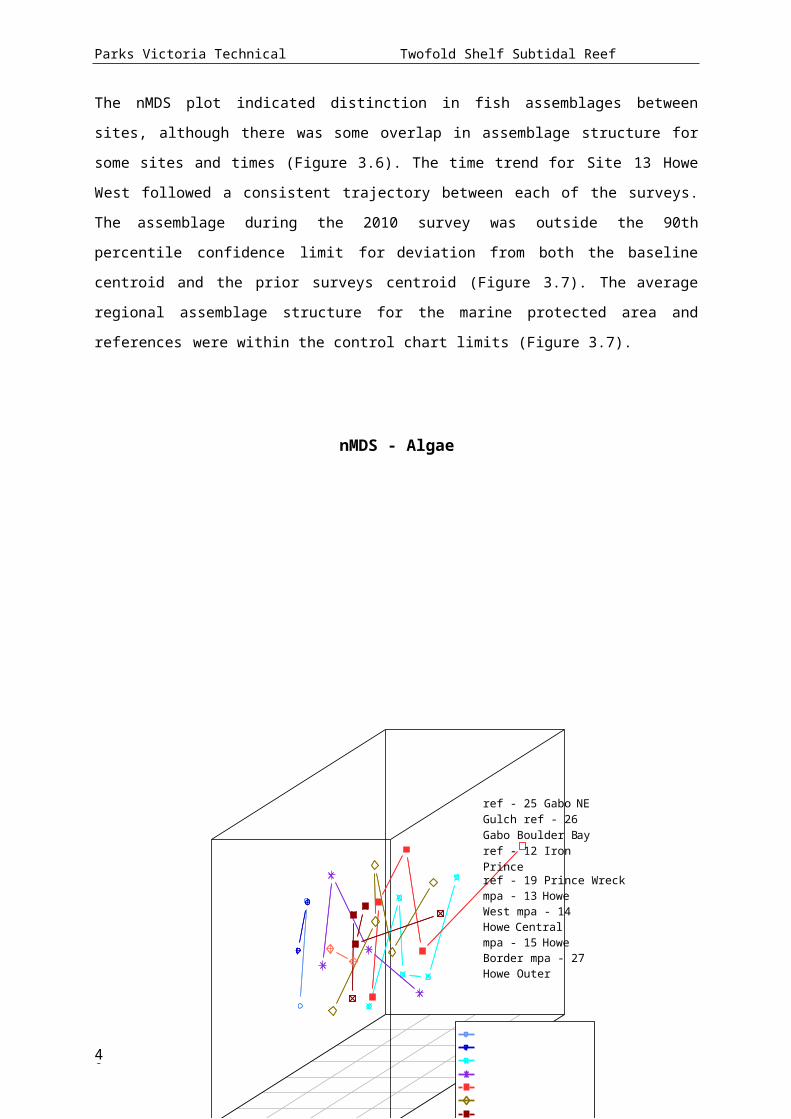
Parks Victoria Technical Series No. 68 Twofold Shelf Subtidal Reef Monitoring
66
3.4 Introduced SpeciesThere were no introduced species detected for these sites.
3.5 Climate Change
There was only a low number of, colder water, Maugean algal species within the Cape Howe
region; the most conspicuous of these being crayweed Phyllospora comosa. There were no
marked trends over the monitoring period apart from the decline in P. comosa (Figure 3.18).
The cold water, Maugean invertebrate species in the Cape Howe region were no well
represented at any one time (Figure 3.19). There was an increase in Maugean-classified fish
species and abundance over the monitoring period (Figure 3.20).
Eastern algal species were not well represented in the Cape Howe region (Figure 3.21).
There were no apparent trends in eastern invertebrate species richness throughout the
monitoring period (Figure 3.22a). Abundance of eastern invertebrates increased
considerably, almost doubling, from baseline to 2009 (Figure 3.22b).
The eastern fish species richness was relatively stable from 2001 to 2006, after which there
was a marked increase to 2009, persisting to 2010 (Figure 3.23a). There was also an
increase in eastern fish abundances to 2009, however there was a large decline to below
baseline levels in 2010 (Figure 3.23b).

Poi
nts
Inde
x
600
No.
Spe
cies
020
010
000.
01.
02.
03.
0
Parks Victoria Technical Series No. 68 Twofold Shelf Subtidal Reef Monitoring
67
a. Maugean Algal Species
MNPref
2002 2004 2006 2008 2010
Year
b. Maugean Algal Abundance
MNPref
2002 2004 2006 2008 2010
YearFigure 3.18. Abundance of Maugean algal species inside and outside the Cape Howe Marine National Park.

)) 22̂̂mm 000022rree pp((y
No.
Spe
cies
Den
sity
(per
200
m2 )
0.00
.51.
01.5
2.02
.50.
00.
51.
01.
5
Parks Victoria Technical Series No. 68 Twofold Shelf Subtidal Reef Monitoring
68
a. Maugean Invertebrate Species
MNPref
2002 2004 2006 2008 2010
Year
b. Maugean Invertebrate Abundance
MNPref
2002 2004 2006 2008 2010
Year
Figure 3.19. Abundance of Maugean invertebrate species inside and outside the Cape Howe Marine National Park.

)) 22̂^mm 00000022rree p D
ensi
ty (p
er 2
000
m2 )
2040
6080
No.
Spe
cies
00
510
15
Parks Victoria Technical Series No. 68 Twofold Shelf Subtidal Reef Monitoring
69
a. Maugean Fish Species
MNPref
2002 2004 2006 2008 2010
Year
b. Maugean Fish Abundance
MNPref
2002 2004 2006 2008 2010
Year
Figure 3.20. Abundance of Maugean fish species inside and outside the Cape Howe Marine National Park.

70
Poi
nts
Inde
xN
o. S
peci
es
0.00
.2
0.4
0.
6
0.81
.00
1020
3040
Parks Victoria Technical Series No. 68 Twofold Shelf Subtidal Reef Monitoring
a. Eastern Algal Species
MNPref
2002 2004 2006 2008 2010
Year
b. Eastern Algal Abundance
MNPref
2002 2004 2006 2008 2010
Year
Figure 3.21. Abundance of Eastern algal species inside and outside the Cape Howe Marine National Park.

)) 22̂̂mm 000022rree ppD
ensi
ty (p
er 2
00 m
2 )
2004
0060
0800
No.
Spe
cies
00
24
68
Parks Victoria Technical Series No. 68 Twofold Shelf Subtidal Reef Monitoring
71
a. Eastern Invertebrate Species
MNPref
2002 2004 2006 2008 2010
Year
b. Eastern Invertebrate Abundance
MNPref
2002 2004 2006 2008 2010
Year
Figure 3.22. Abundance of Eastern invertebrate species inside and outside the Cape Howe Marine National Park.

)) 22̂^mm 00000022rree p D
ensi
ty (p
er 2
000
m2 )
2004
0060
0800
No.
Spe
cies
00
510
1520
25
Parks Victoria Technical Series No. 68 Twofold Shelf Subtidal Reef Monitoring
72
a. Eastern Fish Species
MNPref
2002 2004 2006 2008 2010
Year
b. Eastern Fish Abundance
MNPref
2002 2004 2006 2008 2010
Year
Figure 3.23. Abundance of Eastern fish species inside and outside the Cape Howe Marine National Park.

Parks Victoria Technical Series No. 68 Twofold Shelf Subtidal Reef Monitoring
73
3.6 Fishing3.6.1 AbaloneBoth the mean size and proportion of legal sized blacklip abalone Haliotis rubra were lower
inside the park, throughout the monitoring period (Figure 3.24).
3.6.2 Rock LobsterAbundances of both southern rock lobster Jasus edwardsii and packhorse lobster Jasus
verreauxi were low and sporadically observed during the monitoring period (Figures 3.25 and
3.26).
3.6.3 FishesWith respect to the total size spectrum of fishes, there was a trend of increasing dominance
of smaller fish and decreasing dominance of larger fishes from 2001 to 2009. This trend was
largely reversed between 2009 and 2010 (Figure 3.27).
Variations in biomass of fished species on the survey transects was largely driven by fishes
over 200 mm in length. There were no apparent trends over the monitoring period (Figure
3.28). The density of fished species over 200 mm spiked in 2009 but did not persist to 2010
(Figure 3.29).
At this stage of the monitoring program, there are no discernable changes in the size
structure of fished reef species (Figures 3.30 to 3.33).

aa.. MMeeaann SSiizzee -- HHaalliioottiiss rruubbrraa
bb.. PPrrooppoorrttiioonn ooff LLeeggaall SSiizzeedd AAbbaalloonnee
Pro
portio
n
(%)
Leng
th
(mm
)Fr
eque
ncy
0
10
30
50
70
80
90
10
01 20
Freq
uenc
y
Parks Victoria Technical Series No. 68 Twofold Shelf Subtidal Reef Monitoring
74
a. Mean Size- Haliotis rubra
MNPref
2002 2004 2006 2008 2010
Year
b. Proportion of Legal Sized Abalone
MNPref
2002 2004 2006 2008 2010
Year
c. Size Frequency- Haliotis rubra
MNP Reference
6040
3040
2020 10
0 0
50 100 150200
50 100 150 200
Length(mm) Length(mm

Parks Victoria Technical Series No. 68 Twofold Shelf Subtidal Reef Monitoring
75
)Figure 3.24. Size of blacklip abalone Haliotis rubra inside and outside the Cape Howe Marine
National Park.

)) 22̂̂mm 000022rree pp
)) 22̂̂mm 000022rree pp D
ensi
ty (p
er 2
00 m
2 )D
ensi
ty (p
er 2
00 m
2 )
0.0
0.4
0.8
1.2
0.0
0.5
1.0
1.5
Parks Victoria Technical Series No. 68 Twofold Shelf Subtidal Reef Monitoring
76
Jasus edwardsii
MNPref
2002 2004 2006 2008 2010
Year
Figure 3.25. Density of southern rock lobster Jasus edwardsii inside and outside the Cape Howe Marine National Park.
Jasus verreauxi
MNPref
2002 2004 2006 2008 2010
Year
Figure 3.26. Density of packhorse lobster Jasus verreauxi inside and outside the Cape Howe Marine National Park.

Spe
ctru
m
inte
rcep
tS
pect
rum
slo
pe
01
23
4-2
.5-1
.5-0
.5
Parks Victoria Technical Series No. 68 Twofold Shelf Subtidal Reef Monitoring
77
a. Fish Size Spectrum Slope
MNPref
2002 2004 2006 2008 2010
Year
b. Fish Size SpectrumIntercept
MNPref
2002 2004 2006 2008 2010
Year
Figure 3.27. Fish size spectra inside and outside the Cape Howe Marine National Park.

Bio
mas
s (k
g)B
iom
ass
(kg)
05
1015
200
510
2030
Parks Victoria Technical Series No. 68 Twofold Shelf Subtidal Reef Monitoring
78
Biomass of Fished Species - Total
MNPref
2002 2004 2006 2008 2010
Year
Biomass of Fished Species - over 200 mm
MNPref
2002 2004 2006 2008 2010
Year
Figure 3.28. Biomass of fished species inside and outside the Cape Howe Marine National Park.

)) 22̂̂mm 00000022rree p
Den
sity
(per
200
0 m
2 )
051
020
30
Parks Victoria Technical Series No. 68 Twofold Shelf Subtidal Reef Monitoring
79
Density of Fished Species - over 200 mm
MNPref
2002 2004 2006 2008 2010
Year
Figure 3.29. Density of all fished species inside and outside the Cape Howe Marine National Park.

MMeeaann SSiizzee -- NNoottoollaabbrruuss
Den
sity
Leng
th
(mm
)0
50
150
250
350
Den
sity
Parks Victoria Technical Series No. 68 Twofold Shelf Subtidal Reef Monitoring
80
Mean Size – Notolabrus tetricus
MNPref
2002 2004 2006 2008 2010
Year
Size Frequency- Notolabrus tetricus
MNP Reference
0.005
0.004
0.003
0.002
0.001
0.006
0.004
0.002
0.000 0.000
0 100 200 300 400 500
0 100 200 300 400 500
Length(mm) Length(mm
)
Figure 3.30. Size of blue throat wrasse Notolabrus tetricus inside and outside the Cape Howe Marine National Park.

80
MMeeaann SSiizzee -- NNoottoollaabbrruuss
Den
sity
Leng
th (m
m)
050
10
020
0
Den
sity
Parks Victoria Technical Series No. 68 Twofold Shelf Subtidal Reef Monitoring
Mean Size – Notolabrus fucicola
MNPref
2002 2004 2006 2008 2010
Year
Size Frequency- Notolabrus fucicola
MNP Reference
0.010
0.008
0.006
0.004
0.010
0.008
0.006
0.004
0.002 0.002
0.000 0.000
0 100 200 300 400 500
0 100 200 300 400 500
Length(mm) Length(mm
)
Figure 3.31. Size of purple wrasse Notolabrus fucicola inside and outside the Cape Howe Marine National Park.

MMeeaann SSiizzee -- PPiiccttiillaabbrruuss
Den
sity
Leng
th (m
m)
5010
0 1
50
200
250
0
Den
sity
Parks Victoria Technical Series No. 68 Twofold Shelf Subtidal Reef Monitoring
81
Mean Size – Pictilabrus laticlavius
MNPref
2002 2004 2006 2008 2010
Year
Size Frequency- Pictilabrus laticlavius
MNP Reference
0.008 0.008
0.006 0.006
0.004 0.004
0.002 0.002
0.000 0.000
0 100 200 300 400 500
0 100 200 300 400 500
Length(mm) Length(mm
)
Figure 3.32. Size of senator wrasse Pictilabrus laticlavius inside and outside the Cape Howe Marine National Park.

MMeeaann SSiizzee -- CChheeiillooddaaccttyylluuss
Den
sity
Leng
th (m
m)
0
5015
025
035
0
Den
sity
Parks Victoria Technical Series No. 68 Twofold Shelf Subtidal Reef Monitoring
82
Mean Size – Cheilodactylus spectabilis
MNPref
2002 2004 2006 2008 2010
Year
Size Frequency- Cheilodactylus spectabilis
MNP Reference
0.008
0.006
0.004
0.008
0.006
0.004
0.0020.002
0.000 0.000
0 100 200 300 400 500
0 100 200 300 400 500
Length(mm) Length(mm
)
Figure 3.33. Size of banded morwong Cheilodactylus spectabilis inside and outside the Cape Howe Marine National Park.

Parks Victoria Technical Series No. 68 Twofold Shelf Subtidal Reef Monitoring
83
4 POINT HICKS MARINE NATIONAL PARK
4.1 Site DescriptionsThe reef substratum within the Point Hicks Marine National Park consisted of granite slopes,
boulders and outcrops. There are four sites within the Point Hicks Marine National Park: Old
Jetty Bay (Site 4), Hicks Southwest (Site 21), Hicks Joggle (Site 22) and Hicks Lighthouse
(Site 6).
Old Jetty Bay (Site 4; Figure 4.1) is located on the western side of the point where it is
relatively sheltered and shallow and consists of flat rock slabs with low boulders with
occasional bombies. Some areas of boulders and cobble were interspersed with sand.
The three other sites within the Marine National Park were highly exposed to swell and seas.
Hicks Southwest (Site 21) has both low and moderate relief (1-1.5 m), with steps, bombies
and reef flats. There are patches of sand in the rock gullies and over rock flats.
Hicks Joggle (Site 22) is situated beneath the lighthouse and is highly exposed, but has a
small barrier reef in front of it which breaks up smaller swell waves. Larger waves continue
over this reef and break on the steep shore. While the barrier reef protects the inner reef to
some extent, a current frequently flows along the coast, between the barrier reef and the
shore. This interacts with swells and backwash from the shore to make it a turbulent area
(hence the name). The site is characterised by moderate to high granite boulders and
outcrops (1.5-2 m) with low relief boulder habitat in the western end, where there are also
large sand patches.
Hicks Lighthouse (Site 6) is situated on the eastern side of the point and is fully exposed to
easterly swells. Although the aspect of this site is sheltered from westerly swells, the waves
refract around the point and break over the site.
The reference sites for Point Hicks Marine National Park are all situated to the east, where
the closest suitable reefs were present. Krafts Garden and Durvillaea Flats (Sites 7 and 16)
are close together along a rocky reef outcrop immediately to the east of Point Hicks. Both
sites consisted of gently sloping low-profile reef punctuated by bombies and outcrops 1-2 m
high and interspersed with sandy patches. Ground swell surge is particularly strong at these
sites, with sand continually being resuspended in the water column, reducing visibility.
The habitats at Müllers Reef and Petrel Point (Sites 17 and 18) consisted of reef with 1-2 m
high ridges with gullies in between. Some areas of low-profile reef were also observed. Both
of these sites are prone to strong ground surge and high wave action.

Parks Victoria Technical Series No. 68 Twofold Shelf Subtidal Reef Monitoring
84
Figure 4.1. Location of monitoring sites associated with Point Hicks Marine National Park. The park area is shaded blue. Coordinate system is Map Grid of Australia 1996 (MGA).

Parks Victoria Technical Series No. 68 Twofold Shelf Subtidal Reef Monitoring
85
4.2 Biodiversity4.2.1 Community Structure
MacroalgaeThe algal composition at Point Hicks had a mixed algal canopy of Phyllospora comosa and
common kelp Ecklonia radiata. Other dominant species were fucalean species, such as
Cystophora spp and Sargassum spp, and fleshy thallose red algae.
The non-metric MDS plot indicated algal assemblage structure had a similar level of
variability between times at each site. Exceptions were Hicks Light (Site 6) inside Point Hicks
Marine National Park and Krafts Garden (Site 7) outside the Park (Figure 4.2).
The multivariate control charts indicate a significant deviation at Krafts Garden (Site 7) from
both the baseline centroid and prior times centroid conditions during 2010. There were no
significant regional deviations from baseline and prior time centroids during the monitoring
period (Figure 4.3).
InvertebratesIn general, sites at Point Hicks were characterised by high abundances of the featherstar
Comanthus trichoptera, the seastar Meridiastra calcar and moderate abundances of the
predatory gastropod Cabestana spengleri, blacklip abalone Haliotis rubra and the common
sea urchin Heliocidaris erythrogramma.
The nMDS plot indicated considerable overlap between sites and times in invertebrate
assemblage structure for Point Hicks Joggle (Site 22), Krafts Garden (Site 7), Petrel Point
(Site 18) and Meullers Reef (Site 17). There was also overlap between sites and times for
structure between Hicks Light (Site 6), Point Hicks Southwest (Site 21) and Old Jetty Bay
(Site 4). The Durvillaea Flats (Site 16) community had elements of similarity between both
groups (Figure 4.4).
The multivariate control charts indicated significant deviations from the baseline centroid for
Krafts Garden (Site 7), Durvillaea Flats (Site 16) and Old Jetty Bay (Site 4) in 2010. These
sites were also significantly deviant from the prior time centroid, along with Point Hicks
Joggle (Site 22; Figure 4.5). The combined regional data remained within the control chart
limits.
FishThe predominant fish species at Point Hicks were blue throated wrasse Notolabrus tetricus
and purple wrasse Notolabrus fucicola. Other abundant species were the banded morwong

Parks Victoria Technical Series No. 68 Twofold Shelf Subtidal Reef Monitoring
86
Cheilodactylus spectabilis, herring cale Odax cyanomelas, and the eastern kelpfish
Aplodactylus lophodon.
The nMDS plot indicated fish assemblage structure had a similar level of variability between
times at each site. Sites were overlapping in community structure between times (Figures
4.6).
There was a deviation in fish community structure from the baseline centroid at Old Jetty Bay
(Site 4), Point Hicks Southwest (Site 21) and Meullers Reef (Site 17). Old Jetty Bay and
Durvillaea Flats (Site 16) were significantly deviant from the prior times centroid, indicating
an abrupt change from the previous survey. The Point Hicks Marine National Park regional
data had a significant shift from the baseline centroid and the prior times centroid in 2010,
indicating overall shift in community structure inside the park (Figure 4.7).
nMDS - Algae
mpa - 4 Old Jetty Bay mpa - 21 Pt Hicks SWmpa - 22 Point Hicks Jogglempa - 6 Hicks Lightref - 7 Krafts Garden ref - 16 Durvillaea Flats ref - 17 Meuller Reef ref - 18 Petrel Point
Figure 4.2. MDS plot of algal assemblage structure inside and outside the Point Hicks

Parks Victoria Technical Series No. 68 Twofold Shelf Subtidal Reef Monitoring
87
Marine National Park in March 2010. Kruskal stress = 13.28.

Dev
iatio
n 15
2
0
25
30
Dev
iatio
n25
30
35
40
45
35
40
15
20
Dev
iatio
n 25
35D
evia
tion
30
405
0
60
1545
20
Parks Victoria Technical Series No. 68 Twofold Shelf Subtidal Reef Monitoring
88
Control Chart - Algaea. Sites - Baseline
Centroidb. Sites - Prior Times Centroid
2004 2005 2006 2007 2008 2009 2010 2011 2004 2005 2006 2007 2008 2009 2010 2011
c. Regions - Baseline Centroid
d. Regions - Prior Times Centroid
2004 2005 2006 2007 2008 2009 2011 2004 2005 2006 2007 2008 2009 2011Year Year
mpa - 4 Old Jetty Bay mpa - 21 Pt Hicks SWmpa - 22 Point Hicks Jogglempa - 6 Hicks Light ref - 7 Krafts Gardenref - 16 Durvillaea Flatsref - 17 Meuller Reef ref - 18 Petrel Point region - MPAregion - Reference
Figure 4.3. Control chart of algal assemblage structure inside and outside the Point Hicks Marine National Park.

Parks Victoria Technical Series No. 68 Twofold Shelf Subtidal Reef Monitoring
89
nMDS - Invertebrates
mpa - 4 Old Jetty Bay mpa - 21 Pt Hicks SWmpa - 22 Point Hicks Jogglempa - 6 Hicks Lightref - 7 Krafts Garden ref - 16 Durvillaea Flats ref - 17 Meuller Reef ref - 18 Petrel Point
Figure 4.4. MDS plot of invertebrate assemblage structure inside and outside the Point Hicks Marine National Park in March 2010. Kruskal stress = 10.24.

Dev
iatio
n5
102
030
Dev
iatio
n20
25
30
35
40
45
4015
Dev
iatio
n20
4060
Dev
iatio
n20
30
405
080
10
Parks Victoria Technical Series No. 68 Twofold Shelf Subtidal Reef Monitoring
90
Control Chart - Invertebrates
a. Sites - Baseline Centroid
b. Sites - Prior Times Centroid
2004 2005 2006 2007 2008 2009 2010 2011 2004 2005 2006 2007 2008 2009 2010 2011
c. Regions - Baseline Centroid
d. Regions - Prior Times Centroid
2004 2005 2006 2007 2008 2009 2011 2004 2005 2006 2007 2008 2009 2011Year Year
mpa - 4 Old Jetty Bay mpa - 21 Pt Hicks SWmpa - 22 Point Hicks Jogglempa - 6 Hicks Light ref - 7 Krafts Gardenref - 16 Durvillaea Flatsref - 17 Meuller Reef ref - 18 Petrel Point region - MPAregion - Reference
Figure 4.5. Control chart of invertebrate assemblage structure inside and outside the Point Hicks Marine National Park.

90
Parks Victoria Technical Series No. 68 Twofold Shelf Subtidal Reef Monitoring
nMDS - Fishes
mpa - 4 Old Jetty Bay mpa - 21 Pt Hicks SWmpa - 22 Point Hicks Jogglempa - 6 Hicks Lightref - 7 Krafts Garden ref - 16 Durvillaea Flats ref - 17 Meuller Reef ref - 18 Petrel Point
Figure 4.6. MDS plot of fish assemblage structure inside and outside the Point Hicks Marine National Park in March 2010. Kruskal stress = 15.59.

Dev
iatio
n
2025
3035
Dev
iatio
n30
4050
6040
20
Dev
iatio
n15
2
0
25
30
35
Dev
iatio
n25
30
35
40
45
50
4020
Parks Victoria Technical Series No. 68 Twofold Shelf Subtidal Reef Monitoring
91
Control Chart - Fishes
a. Sites - Baseline Centroid
b. Sites - Prior Times Centroid
2004 2005 2006 2007 2008 2009 2010 2011 2004 2005 2006 2007 2008 2009 2010 2011
c. Regions - Baseline Centroid
d. Regions - Prior Times Centroid
2004 2005 2006 2007 2008 2009 2011 2004 2005 2006 2007 2008 2009 2011Year Year
mpa - 4 Old Jetty Bay mpa - 21 Pt Hicks SWmpa - 22 Point Hicks Jogglempa - 6 Hicks Light ref - 7 Krafts Gardenref - 16 Durvillaea Flatsref - 17 Meuller Reef ref - 18 Petrel Point region - MPAregion - Reference
Figure 4.7. Control chart of fish assemblage structure inside and outside the Point Hicks Marine National Park.

Parks Victoria Technical Series No. 68 Twofold Shelf Subtidal Reef Monitoring
92
4.2.2 Species Richness and Diversity
MacroalgaeAlgal species richness was generally higher inside Point Hicks MNP post commissioning.
There has been a gradual decline from 2004 to 2010. The reference sites had similar
changes over time (Figure 4.8b). Seaweed diversity did not change markedly over time for
both the Park and reference areas, with the exception of higher diversity inside the park from
2004 to 2006 (Figure 4.8c).
InvertebratesThere have been no marked changes in invertebrate species richness and diversity over time
with similar levels inside and outside the Park (Figures 4.9b and 4.9c).
FishThere has been a general decline in fish total abundance both inside and outside the MNP
over the monitoring period (Figure 4.10a). There were no trends in fish species richness and
fish diversity, except for a minor peak in 2006 (Figures 4.10b and 4.10c).

Hill
s N
2N
o. S
peci
esTo
tal P
oint
s
600
01
23
45
05
1015
200
200
1000
Parks Victoria Technical Series No. 68 Twofold Shelf Subtidal Reef Monitoring
93
a. Algal Abundance Index
MNP ref
2002 2004 2006 2008 2010
Year
b. Algal Species Richness
MNPref
2002 2004 2006 2008 2010
Year
c. Algal Diversity
MNPref
2002 2004 2006 2008 2010
YearFigure 4.8. Mean abundance of algal functional groups inside and outside the Point Hicks Marine National Park.

)) 22̂̂mm 000022rree pp((y
Den
sity
(per
200
m2 )
Hill
s N
2N
o. S
peci
es
01
23
45
05
1015
0500
1500
2500
Parks Victoria Technical Series No. 68 Twofold Shelf Subtidal Reef Monitoring
94
a.Invertebrate Total Abundance
MNPref
2002 2004 2006 2008 2010
Year
b. Invertebrate Species Richness
MNPref
2002 2004 2006 2008 2010
Year
c. Invertebrate Diversity
MNPref
2002 2004 2006 2008 2010
YearFigure 4.9. Mean abundance of invertebrate functional groups inside and outside the Point Hicks Marine National Park.

)) 22̂^mm 00000022rree
Hill
s N
2N
o. S
peci
esD
ensi
ty (p
er 2
000
m2 )
01
23
45
60
510
1501
0030
050
0
Parks Victoria Technical Series No. 68 Twofold Shelf Subtidal Reef Monitoring
95
a. Fish Total Abundance
MNPref
2002 2004 2006 2008 2010
Year
b. Fish Species Richness
MNPref
2002 2004 2006 2008 2010
Year
c. Fish Diversity
MNPref
2002 2004 2006 2008 2010
Year
Figure 4.10. Mean abundance of fish functional groups inside and outside the Point Hicks Marine National Park.

Parks Victoria Technical Series No. 68 Twofold Shelf Subtidal Reef Monitoring
96
4.2.3 Abundances of Selected Species
MacroalgaeThe crayweed Phyllospora comosa and the common kelp Ecklonia radiata were the most
abundant algal species at Point Hicks. Phyllospora comosa did not have any marked trends
over the monitoring period both inside and outside Point Hicks MNP (Figure 4.11a). The
abundance of E. Radiata was exceptionally consistent over time inside and outside the Park.
The plots indicate an increase between 2001 and 2004, however this is largely driven by the
inclusion of new sites in 2004 (Figure 4.11b).
The strap weed Cystophora moniliformis had an apparent decline in abundance in the
reference areas however there is considerable variability during this decline (Figure 4.11c).
The abundance of the red alga Rhodymenia linearis was remarkably consistent through time
(note: this was not measured during the first survey; Figure 4.11d). Crustose coralline algae
was not measured during the first survey but had similar abundances both inside and outside
the Park at most times, with the exception of a peak in 2006 (Figure 4.11e).
InvertebratesThe featherstar Comanthus trichoptera had very high abundances in the reference areas
during the 2004 and 2006 surveys, with reduced abundances during 2009 and 2010.
Featherstar C. trichoptera was not abundant inside the Park (Figure 4.12a).
The seastar Meridiastra calcar had similar temporal patterns both inside and outside the
Park, with abundances inside the Park consistently higher than outside. Abundances during
the baseline survey were substantially greater than subsequent surveys, both inside and
outside the Park (Figure 4.12b). Densities of the trumpet shell Cabestana spengleri
fluctuated over time with densities inside the Park being similar to densities outside the Park
between 2004 and 2010 (Figure 4.12c).
Densities of the blacklip abalone Haliotis rubra had remained relatively constant over time
outside the Park. Inside the Park, densities declined slightly between 2001 and 2004, then
increased above baseline levels during 2006 onwards. There was a marked increase in
density between 2009 and 2010, with densities well above baseline surveys (Figure 4.12d).
The abundances of sea urchins Heliocidaris erythrogramma and Centrostephanus rodgersii
remained very low inside the Point Hicks Marine National Park. The abundances of these
two species in the reference areas had similar temporal patterns, which consisted of a slight
drop in abundances in 2009 (Figures 4.12e and 4.12g; note: abundances appear lower in
2001 due to the different sites).

Parks Victoria Technical Series No. 68 Twofold Shelf Subtidal Reef Monitoring
97
Abundances of the red bait crab Plagusia chabrus followed similar patterns inside and
outside the Park, with the exception of the 2004 survey where there was a drop in the
reference area. From 2006 to 2010 there has been a decline in densities both inside and
outside the MNP (Figure 4.12f). The turban shell Turbo undulatus had consistently higher
abundances in the reference area. There were no clearly discernable trends inside or outside
the Park (Figure 4.12h).
FishFor most of the abundant fish the temporal patterns were similar both inside and outside the
MNP (Figure 4.13). The abundances of blue throated wrasse Notolabrus tetricus did not
have any marked changes over time although there was a slight decrease inside the Park
between 2009 and 2010 (Figure 4.13a). There was a considerable decline in purple wrasse
Notolabrus fucicola abundance between 2004 and 2006, with no major changes there after
(Figure 4.13b).
For herring cale Odax cyanomelas, there was a consistent increase in density from 2001 to a
marked peak in 2006 after which there was an equivalent decline from 2006 to 2010. This
pattern was mirrored inside and outside the MNP (Figure 4.13c).
The banded morwong Cheilodactylus spectabilis did not have clear pattern of change over
time both inside and outside the MNP, although there is potentially a slight decreasing trend
in abundance inside the Park (Figure 4.13d). Inside the Park, the abundance of eastern
kelpfish Aplodactylus lophodon was originally relatively high from 2001 to 2004, after which
there was a gradual decline to very low abundances in 2010 (Figure 4.13e).

Cov
er (%
)C
over
(%)
Cov
er (%
)
02
46
80
1020
3040
500
10
3050
70
Parks Victoria Technical Series No. 68 Twofold Shelf Subtidal Reef Monitoring
98
a. Phyllospora com osa
MNPref
2002 2004 2006 2008 2010
Year
b. Ecklonia radiata
MNPref
2002 2004 2006 2008 2010
Year
c. Cystophora m oniliform is
MNPref
2002 2004 2006 2008 2010
Year
Figure 4.11. Percent cover of predominant algal species inside and outside the Point Hicks Marine National Park.

Cov
er (%
)C
over
(%)
02
46
80
24
68
10
Parks Victoria Technical Series No. 68 Twofold Shelf Subtidal Reef Monitoring
99
d. Rhodym enia linearis
MNPref
2002 2004 2006 2008 2010
Year
e. Crustose coralline algae
MNPref
2002 2004 2006 2008 2010
Year
Figure 4.11 (continued). Percent cover of predominant algal species inside and outside the Point Hicks Marine National Park.

100
)) 22̂̂mm 000022rreepp ((yy tt
)) 22̂̂mm 000022rreepp ((yy tt
)) 22̂̂mm 000022rreepp ((yy
2D
ensi
ty (p
er 2
00 m
2 )D
ensi
ty (p
er 2
00 m
)D
ensi
ty (p
er 2
00 m
2 )
050
100
15
0
200
0
500
1500
2500
0500
1500
2500
Parks Victoria Technical Series No. 68 Twofold Shelf Subtidal Reef Monitoring
a. Com anthus trichoptera
MNPref
2002 2004 2006 2008 2010
Year
b. Meridiastra calcar
MNPref
2002 2004 2006 2008 2010
Year
c. Cabestana spengleri
MNPref
2002 2004 2006 2008 2010
Year
Figure 4.12. Site abundance (per 200 m2) of predominant invertebrate species inside and outside the Point Hicks Marine National Park.

)) 22̂̂mm 000022rreepp ((yy
)) 22̂̂mm 000022rreepp ((yy
)) 22̂̂mm 000022rreepp (( D
ensi
ty (p
er 2
00 m
2 )D
ensi
ty (p
er 2
00 m
2 )D
ensi
ty (p
er 2
00 m
2 )
05
1015
020
4060
0
2060
100
140
Parks Victoria Technical Series No. 68 Twofold Shelf Subtidal Reef Monitoring
101
d. Haliotis rubra
MNPref
2002 2004 2006 2008 2010
Year
e. Heliocidaris erythrogram m a
MNPref
2002 2004 2006 2008 2010
Year
f. Plagusia chabrus
MNPref
2002 2004 2006 2008 2010
Year
Figure 4.12. (continued). Site abundance (per 200 m2) of predominant invertebrate species inside and outside the Point Hicks Marine National Park.

)) 22̂̂mm 000022rreepp ((yy tt
)) 22̂̂mm 000022rreepp (( D
ensi
ty (p
er 2
00 m
2 )D
ensi
ty (p
er 2
00 m
2 )
051
0
15
20
25
010
2030
40
Parks Victoria Technical Series No. 68 Twofold Shelf Subtidal Reef Monitoring
102
g. Centrostephanus rodgersii
MNPref
2002 2004 2006 2008 2010
Year
h. Turbo undulatus
MNPref
2002 2004 2006 2008 2010
Year
Figure 4.12. (continued). Site abundance (per 200 m2) of predominant invertebrate species inside and outside the Point Hicks Marine National Park.

)) 22̂̂mm 00000022rreepp ((
)) 22̂̂mm 00000022rreepp ((
)) 22̂̂mm 00000022rreepp ((
2D
ensi
ty (p
er 2
000
m )
Den
sity
(per
200
0 m
2 )D
ensi
ty (p
er 2
000
m2 )
05
1015
2025
020
4060
80
100
010
2030
40
Parks Victoria Technical Series No. 68 Twofold Shelf Subtidal Reef Monitoring
103
a. Notolabrus tetricus
MNPref
2002 2004 2006 2008 2010
Year
b. Notolabrus fucicola
MNPref
2002 2004 2006 2008 2010
Year
c. Odax cyanom elas
MNPref
2002 2004 2006 2008 2010
Year
Figure 4.13. Site abundance (number per 2000 m2) of predominant fish species inside and outside the Point Hicks Marine National Park.

)) 22̂̂mm 00000022rreepp ((yy
)) 22̂̂mm 00000022rreepp ((yy
Den
sity
(per
200
0 m
2 )D
ensi
ty (p
er 2
000
m2 )
05
1015
05
1015
20
Parks Victoria Technical Series No. 68 Twofold Shelf Subtidal Reef Monitoring
104
d. Cheilodactylus spectabilis
MNPref
2002 2004 2006 2008 2010
Year
e. Aplodactylus lophodon
MNPref
2002 2004 2006 2008 2010
Year
Figure 4.13 (continued). Site abundance (number per 2000 m2) of predominant fish species inside and outside the Point Hicks Marine National Park.

Parks Victoria Technical Series No. 68 Twofold Shelf Subtidal Reef Monitoring
105
4.3 Ecosystem Components
Habitat and ProductionAs described previously, the abundance was very similar inside and outside the Park during
most times with the exception of a peak during 2006 (Figure 4.14a).
The cover of canopy browns and thallose red algae were similar inside and outside the Park
and changed little over time (Figures 4.14b and 4.14e). The total abundance of smaller
brown algae was variable over time inside the MNP. Outside the Park there was a clear
decrease in abundance between 2001 and 2006 (Figure 4.14c). The abundances of erect
coralline algae were insignificant in the Point Hicks region (less than < 1 %; Figure 4.14d).
Although green algae were low in abundance at all times (less than 4 %), there was a
gradual decline both inside and outside the MNP between 2001 and 2010 (Figure 4.14f).
The densities of invertebrate grazers and invertebrate filter feeders were higher outside the
Park (Figure 4.15b). Invertebrate predators and seastars are following similar patterns both
inside and outside the MNP area (Figure 4.15c and 4.15d).
The fish grazer patterns were driven by a peak in abundance of herring cale Odax
cyanomelas during 2006 (Figure 4.16a). For fish foragers and fish hunters there were no
marked trends over time (Figure 4.16b and 4.16c). Fish planktivores were observed in both
reference and park areas in moderate densities during 2001, however densities were very
low in both areas during subsequent surveys (Figure 4.15d).
Sediment CoverFor both inside and outside the Park, there was an overall increasing trend between 2004
and 2010 (note: sediment cover was not measured during the first 2001 survey; Figure 4.17).

Cov
er (%
)C
over
(%)
Cov
er (%
)
02
46
810
020
4060
8010
00
24
68
Parks Victoria Technical Series No. 68 Twofold Shelf Subtidal Reef Monitoring
106
a. Crustose Coralline Algae
MNPref
2002 2004 2006 2008 2010
Yearb. Canopy Browns
MNP ref
2002 2004 2006 2008 2010
Year
c. Smaller Browns
MNPref
2002 2004 2006 2008 2010
YearFigure 4.14. Seaweed functional groups inside and outside the Point Hicks Marine National Park.

Cov
er (%
)
3456
7
Cov
er (%
)
10
Cov
er (%
)
012
05
1520
0.0
0.2
0.4
0.6
Parks Victoria Technical Series No. 68 Twofold Shelf Subtidal Reef Monitoring
107
d. Erect Coralline Algae
MNPref
2002 2004 2006 2008 2010
Year
e. Thallose Red Algae
MNPref
2002 2004 2006 2008 2010
Year
f. Green Algae
MNPref
2002 2004 2006 2008 2010
YearFigure 4.14 (continued). Seaweed functional groups inside and outside the Point Hicks Marine National Park.

)) 22̂̂mm 000022rree pp((y
)) 22̂̂mm 000022rree pp((y
)) 22̂̂mm 000022rree pp((y
2D
ensi
ty (p
er 2
00 m
2 )D
ensi
ty (p
er 2
00 m
)D
ensi
ty (p
er 2
00 m
2 )
050
100
150
050
015
0025
000
5010
0
150
200
Parks Victoria Technical Series No. 68 Twofold Shelf Subtidal Reef Monitoring
108
a.Invertebrate Grazers
MNPref
2002 2004 2006 2008 2010
Year
b. Invertebrate Filter Feeders
MNPref
2002 2004 2006 2008 2010
Year
c. Invertebrate Predators
MNPref
2002 2004 2006 2008 2010
YearFigure 4.15. Mean abundance of invertebrate functional groups inside and outside the Point Hicks Marine National Park.

)) 22̂̂mm 000022rree pp(( D
ensi
ty (p
er 2
00 m
2 )
050
010
00
1500
Parks Victoria Technical Series No. 68 Twofold Shelf Subtidal Reef Monitoring
109
d. Seastars
MNPref
2002 2004 2006 2008 2010
YearFigure 4.15 (continued). Mean abundance of invertebrate functional groups inside and outside the Point Hicks Marine National Park.

110
)) 22̂̂mm 00000022rree pp
)) 22̂^mm 00000022rree pp((
)) 22̂^mm 00000022rree pp((
2D
ensi
ty (p
er 2
000
m )
Den
sity
(per
200
0 m
2 )D
ensi
ty (p
er 2
000
m2 )
10
20
30
40
50
600
1020
3040
010
030
050
00
Parks Victoria Technical Series No. 68 Twofold Shelf Subtidal Reef Monitoring
a. Fish Grazers
MNPref
2002 2004 2006 2008 2010
Year
b. Fish Foragers
MNPref
2002 2004 2006 2008 2010
Year
c. Fish Hunters
MNPref
2002 2004 2006 2008 2010
YearFigure 4.16. Mean abundance of fish functional groups inside and outside the Point Hicks Marine National Park.

)) 22̂̂mm 00000022rree pp((
Cov
er (%
)D
ensi
ty (p
er 2
000
m2 )
05
1015
200
2040
6080
Parks Victoria Technical Series No. 68 Twofold Shelf Subtidal Reef Monitoring
111
d. Fish Planktivores
MNPref
2002 2004 2006 2008 2010
YearFigure 4.16 (continued). Mean abundance of fish functional groups inside and outside the Point Hicks Marine National Park.
Sediment Cover
MNPref
2002 2004 2006 2008 2010
YearFigure 4.17. Percent cover of sediments inside and outside the Point Hicks Marine National Park.

Parks Victoria Technical Series No. 68 Twofold Shelf Subtidal Reef Monitoring
112
4.4 Introduced SpeciesThere were no introduced species detected for these sites.
4.5 Climate Change
Species compositionThere are no major trends in cold water, Maugean algal and fish species richness or total
abundance over the monitoring period (Figures 4.18 and 4.20). Cold water invertebrate
species were not well represented in the Point Hicks region at any time (Figure 4.19).
Eastern algal species were not well represented at Point Hicks at any time over the
monitoring period (Figure 4.21). Eastern invertebrate species richness and abundance did
not have any marked trends over time (Figure 4.22). Eastern fish species had richness
decreased slightly between 2009 and 2010 (Figure 4.23).
The string kelp Macrocystis pyrifera formed beds in Old Jetty Bay (Site 4) in 2001 and 2004,
but have not been observed at any sites during subsequent surveys (Figure 4.24a). The bull
kelp Durvillaea potatorum is predominantly surveyed at Durvillaea Flats (Site 16), there have
been no indications of changes over the monitoring period (Figure 4.24b).

Poi
nts
Inde
xN
o. S
peci
es
020
040
060
00
12
34
56
Parks Victoria Technical Series No. 68 Twofold Shelf Subtidal Reef Monitoring
113
a. Maugean Algal Species
MNPref
2002 2004 2006 2008 2010
Year
b. Maugean Algal Abundance
MNPref
2002 2004 2006 2008 2010
YearFigure 4.18. Abundance of Maugean algal species inside and outside the Point Hicks Marine National Park.

)) 22̂̂mm 000022rree pp((y
Den
sity
(per
200
m2 )
No.
Spe
cies
02
46
8
100.
01.
02.
03.
0
Parks Victoria Technical Series No. 68 Twofold Shelf Subtidal Reef Monitoring
114
a. Maugean Invertebrate Species
MNPref
2002 2004 2006 2008 2010
Year
b. Maugean Invertebrate Abundance
MNPref
2002 2004 2006 2008 2010
YearFigure 4.19. Abundance of Maugean invertebrate species inside and outside the Point Hicks Marine National Park.

)) 22̂̂mm 00000022rree pp(( D
ensi
ty (p
er 2
000
m2 )
No.
Spe
cies
050
100
150
05
1015
Parks Victoria Technical Series No. 68 Twofold Shelf Subtidal Reef Monitoring
115
a. Maugean Fish Species
MNPref
2002 2004 2006 2008 2010
Year
b. Maugean Fish Abundance
MNPref
2002 2004 2006 2008 2010
YearFigure 4.20. Abundance of Maugean fish species inside and outside the Point Hicks Marine National Park.

Poi
nts
Inde
xN
o. S
peci
es
0.00
.20.
40.6
0.81
.00
24
68
10
Parks Victoria Technical Series No. 68 Twofold Shelf Subtidal Reef Monitoring
116
a. Eastern Algal Species
MNPref
2002 2004 2006 2008 2010
Year
b. Eastern Algal Abundance
MNPref
2002 2004 2006 2008 2010
YearFigure 4.21. Abundance of Eastern algal species inside and outside the Point Hicks Marine National Park.

)) 22̂̂mm 000022rree pp((yy
No.
Spe
cies
Den
sity
(per
200
m2 )
010
2030
4050
01
23
4
Parks Victoria Technical Series No. 68 Twofold Shelf Subtidal Reef Monitoring
117
a. Eastern Invertebrate Species
MNPref
2002 2004 2006 2008 2010
Year
b. Eastern Invertebrate Abundance
MNPref
2002 2004 2006 2008 2010
YearFigure 4.22. Abundance of Eastern invertebrate species inside and outside the Point Hicks Marine National Park.

)) 22̂̂mm 00000022rree pp(( D
ensi
ty (p
er 2
000
m2 )
No.
Spe
cies
0
5015
025
035
00
24
68
Parks Victoria Technical Series No. 68 Twofold Shelf Subtidal Reef Monitoring
118
a. Eastern Fish Species
MNPref
2002 2004 2006 2008 2010
Year
b. Eastern Fish Abundance
MNPref
2002 2004 2006 2008 2010
YearFigure 4.23. Abundance of Eastern fish species inside and outside the Point Hicks Marine National Park.

Cov
er (%
)C
over
(%)
0.0
0.5
1.0
1.5
0.0
1.0
2.0
Parks Victoria Technical Series No. 68 Twofold Shelf Subtidal Reef Monitoring
119
Macrocystis pyrifera
MNPref
2002 2004 2006 2008 2010
Year
Durvillaea potatorum
MNPref
2002 2004 2006 2008 2010
YearFigure 4.24. Percent cover of algal species of interest string kelp Macrocystis pyrifera and bull kelp Durvillaea potatorum inside and outside the Point Hicks Marine National Park.

120
Parks Victoria Technical Series No. 68 Twofold Shelf Subtidal Reef Monitoring
4.6 Fishing4.6.1 AbaloneThe length of blacklip abalone Haliotis rubra has gradually increased in both inside and
outside the Park, with the mean size inside the park being consistently greater than outside
(Figure 4.25a). The proportion of legal size abalone followed a similar trend (Figure 4.25b).
4.6.2 Rock LobsterObservations of the packhorse lobster Jasus verreauxi have been low. This species has
been more commonly observed inside the MNP over the survey period (Figure 4.26).
4.6.3 FishesThe fish size spectrum indicated a decline in larger individuals between 2001 and 2006
inside the Park. There was a subsequent decline to baseline levels between 2006 and 2010
(Figure 4.27).
Both inside and outside the Park, there was a gradual decline in biomass of fished species
over 200 mm length from 2001 to 2010. The overall decline is approximately 75 % over this
period (Figure 4.28). The density of larger fished species followed the same pattern (Figure
4.29).
There are no differences in the mean size of blue throated wrasse Notolabrus tetricus and
purple wrasse Notolabrus fucicola inside and outside the MNP. Sizes have fluctuated little,
remaining stable over the survey period (Figure 4.30 and 4.31).
The size of senator wrasse Pictilabrus laticlavius has oscillated throughout the monitoring
period, with similar abundances inside and outside the Park (Figure 4.32). Mean size of
banded morwong Cheilodactylus spectabilis decreased outside the Park between 2001 and
2004. There was a slight increase in mean size inside the Park between 2009 and 2010
(Figure 4.33).

aa.. MMeeaann SSiizzee -- HHaalliioottiiss rruubbrraa
bb.. PPrrooppoorrttiioonn ooff LLeeggaall SSiizzeedd
Freq
uenc
yP
ropo
rtio
n
(%)
Leng
th
(mm
)0
20
40
60
80
80
9
011
013
0
Freq
uenc
y
Parks Victoria Technical Series No. 68 Twofold Shelf Subtidal Reef Monitoring
121
a. Mean size- Haliotis rubra
MNPref
2002 2004 2006 2008 2010
Year
b. Proportion of legal sized abalone
MNPref
2002 2004 2006 2008 2010
Year
c. Size Frequency- Haliotis rubra
MNP Reference
3050
2540
2030 1520 1010 50 0
50 100 150200
50 100 150 200
Length(mm) Length(mm
)
Figure 4.25. Sizes of blacklip abalone Haliotis rubra inside and outside the Point Hicks Marine National Park.

)) 22̂̂mm 000022rree pp((y
Den
sity
(per
200
m2 )
01
23
Parks Victoria Technical Series No. 68 Twofold Shelf Subtidal Reef Monitoring
122
Jasus verreauxi
MNPref
2002 2004 2006 2008 2010
YearFigure 4.26. Proportion of eastern rock lobster Jasus verreauxi inside and outside the Point
Hicks Marine National Park.

Spe
ctru
m
inte
rcep
tS
pect
rum
slo
pe
01
23
4-2
.5-1
.5-0
.5
Parks Victoria Technical Series No. 68 Twofold Shelf Subtidal Reef Monitoring
123
a. Fish Size Spectrum Slope
MNPref
2002 2004 2006 2008 2010
Year
b. Fish Size SpectrumIntercept
MNPref
2002 2004 2006 2008 2010
YearFigure 4.27. Fish size spectra inside and outside the Point Hicks Marine National Park.

Bio
mas
s (k
g)
510
15
20
25
30
Bio
mas
s (k
g)
00
1020
3040
Parks Victoria Technical Series No. 68 Twofold Shelf Subtidal Reef Monitoring
124
Biomass of Fished Species - Total
MNPref
2002 2004 2006 2008 2010
Year
Biomass of Fished Species - over 200 mm
MNPref
2002 2004 2006 2008 2010
YearFigure 4.28. Biomass of fished species inside and outside the Point Hicks Marine National Park.

)) 22̂̂mm 00000022rree pp((
)) 22̂̂mm 00000022rree pp(( D
ensi
ty (p
er 2
000
m2 )
Den
sity
(per
200
0 m
2 )
010
2030
4050
050
100
150
Parks Victoria Technical Series No. 68 Twofold Shelf Subtidal Reef Monitoring
125
Density of Fished Species - Total
MNPref
2002 2004 2006 2008 2010
Year
Density of Fished Species - over 200 mm
MNPref
2002 2004 2006 2008 2010
YearFigure 4.29. Density of fished species inside and outside the Point Hicks Marine National Park.

MMeeaann SSiizzee -- NNoottoollaabbrruuss tteettrriiccuuss
Den
sity
Leng
th (m
m)
150
050
250
Den
sity
Parks Victoria Technical Series No. 68 Twofold Shelf Subtidal Reef Monitoring
126
Mean Size- Notolabrus tetricus
MNPref
2002 2004 2006 2008 2010
Year
Size Frequency- Notolabrus tetricus
MNP Reference
0.008
0.006
0.004
0.002
0.006
0.004
0.002
0.000 0.000
0 100 200 300 400 500
0 100 200 300 400 500
Length(mm) Length(mm
)
Figure 4.30. Size of blue throat wrasse Notolabrus tetricus inside and outside the Point Hicks Marine National Park.

MMeeaann SSiizzee -- NNoottoollaabbrruuss ffuucciiccoollaa
Den
sity
Leng
th (m
m)
050
1001
5020
0
Den
sity
Parks Victoria Technical Series No. 68 Twofold Shelf Subtidal Reef Monitoring
127
Mean Size- Notolabrus fucicola
MNP ref
2002 2004 2006 2008 2010
Year
Size Frequency- Notolabrus fucicola
MNP Reference
0.008
0.006
0.004
0.008
0.006
0.004
0.0020.002
0.000 0.000
0 100 200 300 400 500
0 100 200 300 400 500
Length(mm) Length(mm
)
Figure 4.31. Size of purple wrasse Notolabrus fucicola inside and outside the Point Hicks Marine National Park.

MMeeaann SSiizzee -- PPiiccttiillaabbrruuss
Den
sity
Leng
th (m
m)
100
150
20
00
50
Den
sity
Parks Victoria Technical Series No. 68 Twofold Shelf Subtidal Reef Monitoring
128
Mean Size- Pictilabrus laticlavius
MNPref
2002 2004 2006 2008 2010
Year
Size Frequency- Pictilabrus laticlaviusMNP R
eference
0.010
0.008
0.006
0.004
0.002
0.000
0.012
0.010
0.008
0.006
0.004
0.002
0.000
0 100 200 300 400 500
0 100 200 300 400 500
Length(mm) Length(mm
)
Figure 4.32. Size of senator wrasse Pictilabrus laticlavius inside and outside the Point Hicks Marine National Park.

MMeeaann SSiizzee -- CChheeiillooddaaccttyylluuss
Den
sity
Leng
th (m
m)
010
020
030
040
0
Den
sity
Parks Victoria Technical Series No. 68 Twofold Shelf Subtidal Reef Monitoring
129
Mean Size- Cheilodactylus spectabilis
MNPref
2002 2004 2006 2008 2010
Year
Size Frequency- Cheilodactylus spectabilis
MNP Reference
0.006
0.005
0.004
0.003
0.002
0.001
0.000
0.006
0.005
0.004
0.003
0.002
0.001
0.000
0 100 200 300 400 500
0 100 200 300 400 500
Length(mm) Length(mm
)
Figure 4.33. Size of banded morwong Cheilodactylus spectabilis inside and outside the Point Hicks Marine National Park.

130
Parks Victoria Technical Series No. 68 Twofold Shelf Subtidal Reef Monitoring
5 REFERENCESAnderson M. J. (2008) ControlChart: a FORTRAN computer program for calculating control charts for multivariate response data through time, based on a chosen resemblance measure. Department of Statistics, University of Auckland, New Zealand.
Anderson M. J. and Thompson A. A. (2004) Multivariate control charts for ecological and environmental monitoring. Ecological Applications 14, 1921-1935.
Clarke K. R. (1993) Non-parametric multivariate analyses of changes in community structure.Australian Journal of Ecology 18: 117-143.
Dayton P. K., Tegner M. J., Edwards P. B. and Riser K. L. (1998) Sliding baselines, ghosts, and reduced expectations in kelp forest communities. Ecological Applications 8: 309-322.
Ebeling A. W., Laur D. R. and Rowley R. J. (1985) Severe storm disturbances and reversal of community structure in a southern California kelp forest. Marine Biology 84: 287-294.
Edgar G. J. (1998) Impact on and recovery of subtidal reefs. In: Iron Barron Oil Spill, July 1995: Long Term Environmental Impact and Recovery. Tasmanian Department of Primary Industries and Environment, Hobart, pp273-293.
Edgar G. J., Barrett N. S. (1997) Short term monitoring of biotic change in Tasmanian marine reserves. Journal of Experimental Marine Biology and Ecology 213: 261-279.
Edgar G. J. and Barrett N. S. (1999) Effects of the declaration of marine reserves on Tasmanian reef fishes, invertebrates and plants. Journal of Experimental Marine Biology and Ecology 242: 107-144.
Edgar G. J., Moverly J., Barrett N. S., Peters D., and Reed C. (1997) The conservation- related benefits of a systematic marine biological sampling program: the Tasmanian reef bioregionalisation as a case study. Biological Conservation 79: 227-240.
Edmunds M. and Hart S. (2003) Parks Victoria Standard Operating Procedure: Biological Monitoring of Subtidal Reefs. Parks Victoria Technical Series No. 9, Parks Victoria, Melbourne.
Edmunds M., Roob R. and Ferns L. (2000) Marine Biogeography of the Central Victoria and Flinders Bioregions – a Preliminary Analysis of Reef Flora and Fauna. In: L. W. Ferns and D. Hough (eds). Environmental Inventory of Victoria’s Marine Ecosystems Stage 3 (Volume 2). Parks, Flora and Fauna Division, Department of Natural Resources and Environment, East Melbourne. Australia.
Edmunds M., Roob R. and Ferns L. (2001) Biological Assessment of Proposals for Marine Protected Areas in the Twofold Shelf Bioregion. Report to Abalone Fishermens Cooperative Ltd. Australian Marine Ecology Report 122. Melbourne.
Edyvane K. (2003) Conservation, Monitoring and Recovery of Threatened Giant Kelp (Macrocystis pyrifera) beds in Tasmania – Final Report. Report to Environment Australia (Marine Species Protection Program), Tasmanian Department of Primary Industries, Water and Environment, Hobart.
Faith D., Minchin P. and Belbin L. (1987) Compositional dissimilarity as a robust measure of ecological distance. Vegetation 69: 57-68.
Fraser C. I. , Spencer H. G. and Waters J. M. (2009) Glacial oceanographic contrasts explain phylogeography of Australian bull kelp. Molecular Ecology 18, 2287-2296.
Holling C. S. (1978) Adaptive Environmental Assessment and Management. Wiley, Chichester.

Parks Victoria Technical Series No. 68 Twofold Shelf Subtidal Reef Monitoring
131
Johnson C., Ling S., Ross J., Shepherd S. and Miller K. (2005) Establishment of the Long- Spined Sea Urchin (Centrostephanus rodgersii) in Tasmania: First Assessment of Potential Threats to Fisheries. FRDC Project No 2001/044. Tasmanian Aquaculture and Fisheries Institute, Hobart.
Kraft G. T. (2001) A Survey of Subtidal Marine Benthic Algae from the Point Hicks Region of East Gippsland. Report prepared for the Abalone Fishermens Cooperative Ltd, Mallacoota. School of Botany, University of Melbourne.
Krebs C. J. (1999) Ecological Methodology, Second Edition. Benjamin/Cummings, Menlo Park.
Lyle J. M. and Campbell D. A. (1999). Species and Size Composition of Recreational Catches, with Particular Reference to Licensed Fishing Methods. Final Report to the Marine Recreational Fishery Advisory Committee. Tasmania Aquaculture and Fisheries Institute, Hobart.
Macaya E. C. and Zuccarello G. C. (2010) DNA barcoding and genetic divergence in the giant kelp Macrocystis (Laminariales). Journal of Phycology, published online: May 13 2010 5:00pm, DOI: 10.1111/j.1529-8817.2010.00845.x.
McCullagh P. and Nelder J. A. (1989) Generalized Linear Models, Second Edition. Monographs on Statistics and Applied Probability 37. Chapman and Hall, London.
Rapport D. J. (1992) Evaluating ecosystem health. Journal of Aquatic Ecosystem Health 1, 15-24.
Meredith C. (1997) Best Practice in Performance Reporting in Natural Resource Management. Department of Natural Resources and Environment, Melbourne.
Rapport D. J., Gaudet C. L. and Calow P. (1995) Evaluating and Monitoring the Health of large-scale Ecosystems. Springer Verlag, Berlin.
Roob R., Edmunds M. and Ball D. (2000) Victorian Oil Spill Response Atlas: Biological resources. Macroalgal Communities in Central Victoria. Unpublished report to Australian Marine Safety Authority, Australian Marine Ecology Report No. 19, Melbourne.
Stuart-Smith R., Barrett N., Crawford C., Edgar G. and Frusher S. (2008) Condition of Rocky Reef Communities: A Key Marine Habitat around Tasmania. NRM/NHT Final Report. Tasmanian Aquaculture and Fisheries Institute, Hobart.
Sweatman H., Cheal A., Coleman G., Fitzpatrick B., Miller I., Ninio R., Osborne K., Page C., Ryan D., Thompson A. and Tomkins P. (2000) Long-term Monitoring of the Great Barrier Reef. Status Report Number 4. Australian Institute of Marine Science, Townsville.
Sweatman H., Abdo D., Burgess S., Cheal A., Coleman G., Delean S., Emslie M., Miller I., Osborne K., Oxley W., Page C. and Thompson A. (2003) Long-term Monitoring of the Great Barrier Reef. Status Report Number 6. Australian Institute of Marine Science, Townsville.
Thrush S. F., Hewitt J. E., Dayton P. K., Coco G., Lohrer A. M., Norkko A., Norkko J. and Chiantore M. (2009) Forecasting the limits of resilience: integrating empirical research with theory. Proceedings of the Royal Society B 276, 3209-3217.
Turner D. J., Kildea T. N., Murray-Jones S. (2006) Examining the health of subtidal reef environments in South Australia, Part 1: Background review and rationale for the development of the monitoring program. South Australian Research and Development Institute (Aquatic Sciences), Adelaide. 62 pp. SARDI Publication Number RD03/0252-3.

Parks Victoria Technical Series No. 68 Twofold Shelf Subtidal Reef Monitoring
132
6 ACKNOWLEDGMENTSThis project was funded by Parks Victoria and supervised by Steffan Howe. We are grateful
for the field assistance and technical support of Reinhart Strauss and crew from Wilderness
Coast Charters.

A1
Parks Victoria Technical Series No. 68 Twofold Shelf Subtidal Reef Monitoring
7 APPENDIX A – SITE DETAILS
Beware Reef Marine Sanctuary
Beware Reef – Site 3223
Site Description
Beware Reef marine sanctuary is a small isolated reef located approximately 4 km offshore from
Cape Conran. The reef profile in the shallower water consists of small gullies, slopes and flats down
to the ten meter isobath, where the reef generally drops off steeply into deeper water.
Transect Layout
The Beware Reef monitoring site (Site 23) was positioned along the 8 m isobath over small gullies and
flats. The central position is located on the eastern side of an emergent rock, with transects 1 and 2
along the northern side of the island and transects 3 and 4 along the southern side (forming a ‘v’).
Appendix A Figure 1.1. Site dive transects for Beware Reef (site 3223) in Beware Reef Marine
Sanctuary.
Appendix A Table 1.1. Site details for Beware Reef (site 3223) in Beware Reef Marine Sanctuary.
GDA
latitude GDA longitude Zone MGA Easting MGA Northing Depth (m) Ab100 MPA/Ref
-37.820251 148.78686 55 657270 5812624 10 N MPA

Parks Victoria Technical Series No. 68 Twofold Shelf Subtidal Reef Monitoring
A2
Beware Reef Marine Sanctuary
Pearl Point – Site 3224
Site Description
Pearl Point is a reference site for Beware Reef Marine Sanctuary. The habitat structure at Pearl Point
was similar to Müller’s Reef and Petrel Point, consisting of ridges of reef 1-2 m high with gullies in
between.
Transect Layout
The Pearl Point reference site is at 7-8 m depth. T2 and T1 head in a straight line to the northeast
from the marker, and T3 and T4 in a southwest direction.
Appendix A Figure 1.2. Site dive transects for Pearl Point (site 3224), the reference site for Beware
Reef Marine Sanctuary.
Appendix A Table 1.2. Site details for Pearl Point (site 3224), the reference site for Beware Reef
Marine Sanctuary.
GDA
latitude GDA longitude Zone MGA Easting MGA Northing Depth (m) Ab100 MPA/Ref
-37.794192 148.88321 55 665809 5815349 8 N Ref

Parks Victoria Technical Series No. 68 Twofold Shelf Subtidal Reef Monitoring
A3
Point Hicks Marine National Park
Old Jetty Bay – Site 3204
Site Description
Old Jetty Bay is located within the MNP, on the western side of Point Hicks, and is relatively sheltered
and shallow. The substratum consists of flat rock slabs with low boulders and occasional bombies.
Some areas of boulders and cobble were interspersed with sand.
Transect Layout
T2 and T1 head in a straight line to the south from the marker, and T3 and T4 in a northerly direction,
parallel to shore.
Appendix A Figure 1.3. Site dive transects for Old Jetty Bay (site 3204) in Point Hicks Marine National
Park.
Appendix A Table 1.3. Site details for Old Jetty Bay (site 3204) in Point Hicks Marine National Park.
GDA
latitude GDA longitude Zone MGA Easting MGA Northing Depth (m) Ab100 MPA/Ref
-37.795762 149.26623 55 699533 5814426 4 N MPA

Parks Victoria Technical Series No. 68 Twofold Shelf Subtidal Reef Monitoring
A4
Point Hicks Marine National
Park Hicks Southwest – Site
3221 Site Description
Hicks Southwest is highly exposed to swell and has both low and moderate relief reef (1-1.5 m), with
steps, bombies and reef flats. There are patches of sand in the rock gullies and over rock flats.
Transect Layout
The areas of reef is short, so the transect curves to fit. T2 heads east from the marker, curving south
in to T1. T3 heads west and T4 in a south-southwest direction.
Appendix A Figure 1.4. Site dive transects for Hicks Southwest (site 3221) in Point Hicks Marine
National Park.
Appendix A Table 1.4. Site details for Hicks Southwest (site 3221) in Point Hicks Marine National Park.
GDA
latitude GDA longitude Zone MGA Easting MGA Northing Depth (m) Ab100 MPA/Ref
-37.800317 149.26602 55 699502 5813921 8 N MPA

Parks Victoria Technical Series No. 68 Twofold Shelf Subtidal Reef Monitoring
A5
Point Hicks Marine National Park
Hicks Joggle– Site 3222
Site Description
Hicks Joggle (Site 22) is situated beneath the lighthouse and is highly exposed, but has a small barrier
reef in front of it which breaks up smaller swell waves. Larger waves continue over this reef and break
on the steep shore. While the barrier reef protects the inner reef to some extent, a current frequently
flows along the coast, between the barrier reef and the shore. This interacts with swells and backwash
from the shore to make it a turbulent area (hence the name). The site is characterised by moderate to
high granite boulders and outcrops (1.5-2 m) with low relief boulder habitat in the western end, where
there are also large sand patches.
Transect Layout
The transect follows the curve of the bay. T2 and T1 head southeast from the marker, and T3 and T4
curve from northwest at the marker to southwest at the end of T4.
Appendix A Figure 1.5. Site dive transects for Hicks Joggle (site 3222) in Point Hicks Marine National
Park.
Appendix A Table 1.5. Site details for Hicks Joggle (site 3222) in Point Hicks Marine National Park.
GDA
latitude GDA longitude Zone MGA Easting MGA Northing Depth (m) Ab100 MPA/Ref
-37.803567 149.27414 55 700208 5813543 5 N MPA

Parks Victoria Technical Series No. 68 Twofold Shelf Subtidal Reef Monitoring
A6
Point Hicks Marine National
Park Hicks Lighthouse – Site
3206 Site Description
Hicks Lighthouse (Site 6) is situated on the eastern side of the point and is fully exposed to easterly
swells. Although the aspect of this site is sheltered from westerly swells, the waves refract around the
point and break over the site.
Transect Layout
T2 and T1 head northeast from the marker, meandering parallel to the shoreline and offshore from a
submerged bombie. T3 and T4 head in a southerly direction, also parallel to shore.
Appendix A Figure 1.6. Site dive transects for Hicks Lighthouse (site 3206) in Point Hicks Marine
National Park.
Appendix A Table 1.6. Site details for Hicks Lighthouse (site 3206) in Point Hicks Marine National
Park.
GDA
latitude GDA longitude Zone MGA Easting MGA Northing Depth (m) Ab100 MPA/Ref
-37.802027 149.27735 55 700495 5813707 5 Y MPA

GDA
latitude
-37.79748
GDA longitude
149.28785
Zone MGA Easting MGA Northing
5814189
Depth (m)
5
Ab100
N
MPA/Ref
Ref55 701432
A7
Parks Victoria Technical Series No. 68 Twofold Shelf Subtidal Reef Monitoring
Point Hicks Marine National Park
Krafts Garden – Site 3207
Site Description
Krafts Garden in a reference site for Point Hicks Marine National Park. Situated along a rocky reef
outcrop immediately to the east of Point Hicks, Krafts Garden consists of gently sloping low-profile
reef punctuated by bombies and outcrops 1-2 m high and interspersed with sandy patches. This
site is particularly exposed to ground swell surge and sand continually being resuspended in the
water column, reducing visibility.
Transect Layout
The marker is located within a sand patch. T2 and T1 head to the northeast from the marker, curving
to the east on T1. T3 and T4 head in a southwest direction.
Appendix A Figure 1.7. Site dive transects for Krafts Garden (site 3207), a reference site for Point
Hicks Marine National Park.
Appendix A Table 1.7. Site details for Krafts Garden (site 3207), a reference site for Point Hicks

GDA
latitude
-37.79748
GDA longitude
149.28785
Zone MGA Easting MGA Northing
5814189
Depth (m)
5
Ab100
N
MPA/Ref
Ref55 701432
A7
Parks Victoria Technical Series No. 68 Twofold Shelf Subtidal Reef MonitoringMarine National Park.

GDA
latitude
-37.795994
GDA longitude
149.28778
Zone MGA Easting MGA Northing
5814354
Depth (m)
4
Ab100
N
MPA/Ref
Ref55 701430
A8
Parks Victoria Technical Series No. 68 Twofold Shelf Subtidal Reef Monitoring
Point Hicks Marine National Park
Durvillaea Flats – Site 3216
Site Description
Durvillaea Flats is a reference site for Point Hicks Marine National Park. The site is on rocky reef
outcrop on the eastern side of Point Hicks. The gently sloping low-profile reef is punctuated by
bombies and outcrops 1-2 m high and interspersed with sandy patches. There is strong ground swell
surge at this site, with sand continually being resuspended in the water column, reducing visibility.
Transect Layout
The transects are situated on the inshore side of the reef following the shape of the reef outcrop. T2
heads north-northeast from the marker and then T1 curves to the west, and T3 and T4 in a west-
southwest direction.
Appendix A Figure 1.8. Site dive transects for Durvillaea (site 3216), a reference site for Point Hicks
Marine National Park.
Appendix A Table 1.8. Site details for Durvillaea (site 3216), a reference site for Point Hicks Marine
National Park.

A9
Parks Victoria Technical Series No. 68 Twofold Shelf Subtidal Reef Monitoring
Point Hicks Marine National Park
Müller Reef – Site 3217
Site Description
Müller Reef is a reference site for Point Hicks Marine National Park. Müller Reef is rocky reef with 1-2
m high ridges with gullies in between. Some areas of low-profile reef were also observed. This site is
prone to strong ground surge and high wave action.
Transect Layout
T2 and T1 head in a straight line to the north-northeast from the marker, and T3 and T4 in a south-
southwest direction.
Appendix A Figure 1.9. Site dive transects for Müller Reef (site 3217), a reference site for Point Hicks
Marine National Park.
Appendix A Table 1.9. Site details for Müller Reef (site 3217), a reference site for Point Hicks Marine
National Park.
GDA
latitude GDA longitude Zone MGA Easting MGA Northing Depth (m) Ab100 MPA/Ref
-37.78607 149.32244 55 704509 5815380 7 N Ref

A10
Parks Victoria Technical Series No. 68 Twofold Shelf Subtidal Reef Monitoring
Point Hicks Marine National Park
Petrel Point – Site 3218
Site Description
Petrel Point is a reference site for Point Hicks Marine National Park. It is situated on rocky reef with 1-
2 m high ridges with gullies in between. Some areas of low-profile reef were also observed. This site is
prone to strong ground surge and high wave action.
Transect Layout
T2 and T1 head in a straight line to the north-northeast from the marker, and T3 and T4 in a south-
southwest direction.
Appendix A Figure 1.10. Site dive transects for Petrel Point (site 3218), a reference site for Point Hicks
Marine National Park.
Appendix A Table 1.10. Site details for Petrel Point (site 3218), a reference site for Point Hicks Marine
National Park.
GDA
latitude GDA longitude Zone MGA Easting MGA Northing Depth (m) Ab100 MPA/Ref
-37.782085 149.38478 55 710011 5815684 8 N Ref

A11
Parks Victoria Technical Series No. 68 Twofold Shelf Subtidal Reef Monitoring
Cape Howe Marine National Park
Howe Perpendicular – Site 3220
Site Description
Howe Perpendicular was situated on low relief reef with 02.m to 0.5 m steps and ridges. There were
areas of flat reef and sand patches. The transect ran perpendicular to shore, consequently depth
ranged from 5 m at the near-shore end to 12 m at the offshore end of the transect.
Transect Layout
T2 heads in a straight line to the northwest from the marker, and T1 heads slightly west of north from
the end of T2. T3 and T4 head in a southerly direction from the shot.
Survey Notes
This site was not surveyed in 2009 and 2010.
Appendix A Figure 1.11. Site dive transects for Howe Perpendicular (site 3220) in Cape Howe Marine
National Park.
Appendix A Table 1.11. Site details for Howe Perpendicular (site 3220) in Cape Howe Marine National
Park.
GDA
latitude GDA longitude Zone MGA Easting MGA Northing Depth (m) Ab100 MPA/Ref
-37.510074 149.97356 55 762829 5844386 10 N MPA

Parks Victoria Technical Series No. 68 Twofold Shelf Subtidal Reef Monitoring
A12
Cape Howe Marine National Park
Howe Outer – Site 3227
Site Description
This site was a new site in 2009. Located within the Cape Howe Marine National Park, it is situated
parallel to, and further offshore from, Howe Central (site 3214). These two sites are approximately 75
m apart. This new site was considerably deeper (10-12 m).
Transect Layout
T2 and T1 head in a straight line to the northeast from the marker, and T3 and T4 in a southwest
direction.
Appendix A Table 1.12. Site details for Howe Outer (site 3227) in Cape Howe Marine National Park.
GDA
latitude GDA longitude Zone MGA Easting MGA Northing Depth (m) Ab100 MPA/Ref
-37.50853 149.976.10 55 763059 5844551 14 N MPA

Parks Victoria Technical Series No. 68 Twofold Shelf Subtidal Reef Monitoring
A13
Cape Howe Marine National Park
Howe West – Site 3213
Site Description
Howe West was on moderate relief reef with gullies and depressions. Dense beds of Phyllospora
comosa were present on reef tops and there were patches of urchin barren.
Transect Layout
T2 and T1 head in a straight line to the northeast from the marker, and T3 and T4 in a southwest
direction.
Appendix A Figure 1.12. Site dive transects for Howe West (site 3213) in Cape Howe Marine National
Park.
Appendix A Table 1.13. Site details for Howe West (3213) in Cape Howe Marine National Park.
GDA
latitude GDA longitude Zone MGA Easting MGA Northing Depth (m) Ab100 MPA/Ref
-37.509868 149.97349 55 762823 5844409 7 Y MPA

Parks Victoria Technical Series No. 68 Twofold Shelf Subtidal Reef Monitoring
A14
Cape Howe Marine National Park
Howe Central – Site 3214
Site Description
Howe central was on low to moderate relief reef with some gullies and ridges. Dense beds
of Phyllospora comosa were present on reef tops and there were several areas of urchin barren.
Transect Layout
T2 and T1 head in a straight line to the northeast from the marker, and T3 and T4 in a southwest
direction.
Appendix A Figure 1.13. Site dive transects for Howe Central (site 3214) in Cape Howe Marine
National Park.
Appendix A Table 1.14. Site details for Howe Central (3214) in Cape Howe Marine National Park.
GDA
latitude GDA longitude Zone MGA Easting MGA Northing Depth (m) Ab100 MPA/Ref
-37.507847 149.97609 55 763060 5844626 8 Y MPA

Parks Victoria Technical Series No. 68 Twofold Shelf Subtidal Reef Monitoring
A15
Cape Howe Marine National Park
Howe Border – Site 3215
Site Description
There was moderate relief reef, with some larger bombies, holes and drop-offs present at Howe
Border. This site initially had a high cover of crayweed Phyllospora comosa, but in recent surveys the
area and number of urchin barren patches has increased.
Transect Layout
T2 and T1 head in a straight line to the northeast from the marker, and T3 and T4 in a southwest
direction.
Appendix A Figure 1.14. Site dive transects for Howe Border (site 3215) in Cape Howe Marine
National Park.
Appendix A Table 1.15. Site details for Howe Border (site 3215) in Cape Howe Marine National Park.
GDA
latitude GDA longitude Zone MGA Easting MGA Northing Depth (m) Ab100 MPA/Ref
-37.507127 149.97857 55 763282 5844699 10 Y MPA

Parks Victoria Technical Series No. 68 Twofold Shelf Subtidal Reef Monitoring
A16
Cape Howe Marine National Park
Tullaberga Deep – Site 3208
Site Description
This site was 5-7 m deep and was characterised by moderate to high relief bedrock outcrops at the
southern end, with lower relief rock slabs at the northern end. There were occasional patches of
boulders and rubble, providing interstitial spaces. Much of the Tullaberga site was sea urchin barren
habitat with high abundances of Centrostephanus rodgersii and encrusting coralline algae. Crayweed
Phyllospora comosa was present on occasional boulder tops.
A predominant feature was the high abundance of white ear damselfish Parma microlepis and one
spot puller Chromis hypsilepis.
Transect Layout
T2 and T1 head south from the marker, and T3 and T4 in a northerly direction.
Survey Notes
This site was not surveyed in 2009 and 2010.
Appendix A Table 1.16. Site details for Tullaberga Deep (site 3208), a reference site for Cape Howe
Marine National Park.
GDA
latitude GDA longitude Zone MGA Easting MGA Northing Depth (m) Ab100 MPA/Ref
-37.557676 149.84232 55 751066 5839462 7 N Ref

Parks Victoria Technical Series No. 68 Twofold Shelf Subtidal Reef Monitoring
A17
Cape Howe Marine National Park
Gabo Monument – Site 3210
Site Description
Gabo Monument site (near the pump house) was all sea urchin barren on a substratum of large
granite boulders with a large amount of interstitial space. Small Phyllospora comosa clumps were
present on the tops of occasional large boulders.
Transect Layout
T2 and T1 head in a straight line to the south-southwest from the marker, and T3 and T4 in a
northwest direction.
Survey Notes
This site was not surveyed in 2009 and 2010
Appendix A Figure 1.15. Site dive transects for Gabo Monument (site 3210), a reference site for Cape
Howe Marine National Park.
Appendix A Table 1.17. Site details for Gabo Monument (site 3210), a reference site for Cape Howe
Marine National Park.
GDA
latitude GDA longitude Zone MGA Easting MGA Northing Depth (m) Ab100 MPA/Ref
-37.564001 149.90485 55 756569 5838591 6 N Ref

Parks Victoria Technical Series No. 68 Twofold Shelf Subtidal Reef Monitoring
A18
Cape Howe Marine National Park
Gabo Harbour – Site 3211
Site Description
A non-SRMP site, Site 11 Gabo Harbour, was resurveyed opportunistically during the 2009 survey,
being previously surveyed in 2001. This site was shallow and protected from swell. It was all urchin
barren on granite boulder reef.
Transect Layout
T2 and T1 head in a straight line to the south-southwest from the marker, and T3 and T4 in a
northwest direction.
Survey Notes
This site was not surveyed in 2010.
Appendix A Figure 1.16. Site dive transects for Gabo Harbour (site 3211), a reference site for Cape
Howe Marine National Park.
Appendix A Table 1.18. Site details for Gabo Harbour (site 3211), a reference site for Cape Howe
Marine National Park.
GDA
latitude GDA longitude Zone MGA Easting MGA Northing Depth (m) Ab100 MPA/Ref
-37.5556 149.9076 55 756844 5839511 5 N Ref

Parks Victoria Technical Series No. 68 Twofold Shelf Subtidal Reef Monitoring
A19
Cape Howe Marine National Park
Gabo NE Gulch – Site 3225
Site Description
This site was a new site in 2009 and is a reference site for Cape Howe Marine National Park. It is
located on the eastern side of Gabo Island.
The substratum at is site consisted of a steep drop-off from the shore to 7 m depth with boulder fields,
rocky outcrops and steps at the base. At the end of transect 4 there were patches of urchin barren.
Transect Layout
The transect ran parallel to shore. T2 and T1 headed in a straight line to the northwest from the
marker, and T3 and T4 in a southeast direction, finishing just past a steep dropoff.
Survey Notes
This site was established in 2009.
Appendix A Table 1.19. Site details for Gabo NE Gulch (site 3225), a reference site for Cape Howe
Marine National Park.
GDA
latitude GDA longitude Zone MGA Easting MGA Northing Depth (m) Ab100 MPA/Ref
-37.5532 149.912 55 757234 5839776 7 N Ref

A20
Parks Victoria Technical Series No. 68 Twofold Shelf Subtidal Reef Monitoring
Cape Howe Marine National Park
Gabo Boulder Bay – Site 3226
Site Description
This site was a new site in 2009 and is a reference site for Cape Howe Marine National Park. It is
located on the eastern side of Gabo Island.
Similar to Gabo NE Gulch (site 3225), it is dominated by a mixture of Phyllospora comosa, Acrocarpia
paniculata, smaller brown algae, erect coralline algae and crustose coralline algae. The substratum
consisted of steep dropoffs from the shore with boulder fields and rocky outcrops.
Transect Layout
T2 and T1 curved parallel to shore, from north at the marker to northwest at the end of T1. and T3
and T4 headed in a southerly direction.
Survey Notes
This site was established in 2009.
Appendix A Table 1.20. Site details for Gabo Boulder Bay (site 3226), a reference site for Cape Howe
Marine National Park.
GDA
latitude GDA longitude Zone MGA Easting MGA Northing Depth (m) Ab100 MPA/Ref
-37.564 149.9179 55 757722 5838557 9 N Ref

Parks Victoria Technical Series No. 68 Twofold Shelf Subtidal Reef Monitoring
A21
Cape Howe Marine National Park
Iron Prince West – Site 3212
Site Description
Larger boulders of moderate relief (1-2 m) with patches of relatively flat, slab reef. Occasional
steps/ledges, dropoffs/wall and cavern habitat are also present. The Iron Prince sites are dominated
by a tall canopy of Phyllospora comosa.
Transect Layout
T2 heads east from the marker, with T1 curving northeast from the end of T2. T3 and T4 head in a
southwest direction.
Appendix A Figure 1.7. Site dive transects for Iron Prince West (site 3212), a reference site for Cape
Howe Marine National Park.
Appendix A Table 1.21. Site details for Iron Prince West (site 3212), a reference site for Cape Howe
Marine National Park.
GDA
latitude GDA longitude Zone MGA Easting MGA Northing Depth (m) Ab100 MPA/Ref
-37.519333 149.96295 55 761858 5843388 5 Y Ref

Parks Victoria Technical Series No. 68 Twofold Shelf Subtidal Reef Monitoring
A22
Cape Howe Marine National Park
Prince Wreck – Site 3219
Site Description
Larger boulders of moderate relief (1-2 m) with patches of relatively flat, slab reef. Occasional
steps/ledges, dropoffs/wall and cavern habitat are also present. The Iron Prince sites are dominated
by a tall canopy of Phyllospora comosa.
Transect Layout
T2 and T1 head in a straight line to the northwest from the marker, and T3 and T4 in a southeast
direction.
Appendix A Figure 1.8. Site dive transects for Prince Wreck (site 3219), a reference site for Cape
Howe Marine National Park.
Appendix A Table 1.22. Site details for Prince Wreck (site 3219), a reference site for Cape Howe
Marine National Park.
GDA
latitude GDA longitude Zone MGA Easting MGA Northing Depth (m) Ab100 MPA/Ref
-37.52067 149.96428 55 761971 5843236 6 N Ref

Parks Victoria is responsible for managing the Victorian protected area network, which ranges from wilderness areas to metropolitan parks and includes both marine and terrestrial components. Our role is to protect the natural and cultural values of the parks and other assets we manage, while providing a great range of outdoor opportunities for all Victorians and visitors.
A broad range of environmental research and monitoring activities supported by Parks Victoria provides information to enhance park management decisions. This Technical Series highlights some of the environmental research and monitoring activities done within Victoria's protected area network.
Healthy Parks Healthy People
For more information contact the Parks Victoria Information Centre on 13 1963, or visitwww.parkweb.vic.gov.au

Parks Victoria is responsible for managing the Victorian protected
area network, which ranges from wilderness areas to metropolitan
parks and includes both marine and terrestrial components.
Our role is to protect the natural and cultural values of the
parks and other assets we manage, while providing a great
range of outdoor opportunities for all Victorians and visitors.
A broad range of environmental research and monitoring activities
supported by Parks Victoria provides information to enhance park
management decisions. This Technical Series highlights some of
the environmental research and monitoring activities done within
Victoria’s protected area network.
Healthy Parks Healthy People
For more information contact the Parks Victoria Information Centre
on 13 1963, or visit www.parkweb.vic.gov.au