part ii processing and treatment
TRANSCRIPT

Part II
Processing and Treatment

CHAPTER VI. MATERIALS RECOVERY AND RECYCLING
A. Introduction
The processing of mixed wastes and of source-separated wastes to recover materials involves a series of unit processes. The number of unit processes depends upon the degree of source separation of the wastes, as well as the types of materials to be recovered. In this chapter, waste processing facilities are discussed that process mixed municipal solid waste (MSW), source-separated materials, or both.
The nature and design of each unit process accommodate the physical and chemical characteristics of the particular materials or types of materials for which each is intended. Because most discarded materials have certain characteristics in common, basic processing principles (e.g., those pertaining to size reduction, air classification, and screening) usually are non-specific with respect to the materials in a category. However, the details of equipment design, size, degree of complexity, and cost of individual unit processes are strongly influenced by the nature and utility of the material to be recovered, and the extent and degree of source separation. The gradation also depends upon the function being served, e.g., recovery from the waste stream, readying the recovered material for reuse.
The basic types and principles of unit processes are described and discussed in the first part of this chapter. The discussion of unit processes is in the general sense. Therefore, the discussion focuses on mixed waste of which source-separated materials are a subset. Subsequently, the design of processing systems is discussed, i.e., the arrangement and sequence of unit processes to attain particular goals. This discussion includes the design of systems to process source-separated materials.
In this chapter, unit processes include both manual and mechanical processes. Mechanical processes include electromagnetic, fluid dynamic, pneumatic, and others. Of the categories of unit processes applicable to waste processing, those related to physical separation and removal from the waste stream of a particular type of material or mixtures of types of materials are the cornerstones of process design. The unit processes involving separation differ from the other unit processes in that they can be either manual or mechanical, or a combination of the two.
Resource recovery (primarily through scavenging) plays an important role in the economies of developing nations and in the economies of thousands of families. However, in most developing countries, the working conditions of scavengers are substandard. The following sections are presented in the hope that the concepts will be used to design systems in which the working conditions of the scavengers are substantially improved.
Some of the processing concepts and system designs described in this chapter have been instituted in industrialised countries and are predicated on the delivery of relatively clean mixtures of source-separated recyclable materials (e.g., containers or yard debris) to the processing location. The collection of source-separated materials and the mechanical and manual processing of them are popular and pervasive in many areas of North America. However, this method of collection and processing of wastes may not be readily instituted as a new system in developing countries, nor readily incorporated into the existing waste management systems. Economical institution of these recycling systems in North America has been a challenge as systems based historically on mixed waste collection and disposal are converted to an equal emphasis or greater emphasis placed on recycling. The problem of instituting similar recycling
131
programs in developing countries in an economical manner is several-fold worse due to lack of, and competition for, financial resources.
The feasibility of processing source-separated materials has a partial grounding in the need for separation of materials by the generator and the storage of the materials on the generator’s premises. To fulfil this need, not only must the generator be motivated and trained in the separation of materials, but he or she must also have a separate container and space to store it. In North America, in many cases, the containers are provided at no cost to residential generators, as part of the motivational process. The supply of containers to householders in developing countries, the additional storage space requirement, and behaviour modification are among the reasons that collection and processing (the subject of this chapter) will have limited application in the short term for many developing nations.
Also confounding the feasibility and application of the processing of source-separated materials in developing nations is the circumstance that some of the highly mechanised designs presented in this chapter may be too costly and complex for many communities. However, despite the current limitations of applicability of highly mechanised designs, the concepts and designs are presented in this chapter for completeness and because the design process is relevant to less complex source separated programs, e.g., waste separated into wet (i.e., putrescible) and dry (i.e., non-putrescible) fractions. Communities in some developing countries are testing or have instituted forms of wet/dry collection and processing of wastes, e.g., Guatemala and the Philippines.
B. Manual separation
In the case of mixed waste processing, bulky items (appliances, furniture, etc.) and specified contaminants (e.g., hazardous waste) generated in some of the industrialising economies can be, and oftentimes are, manually removed from the waste prior to mechanical processing. With few exceptions, a completely manual separation of materials from mixed waste beyond this initial separation is reserved for small operations, i.e., less than 20 Mg/day. Manual separation is also applicable to the removal of contaminants from source-separated materials. (Here, “contaminants” refers to components other than the materials specified for separate collection.)
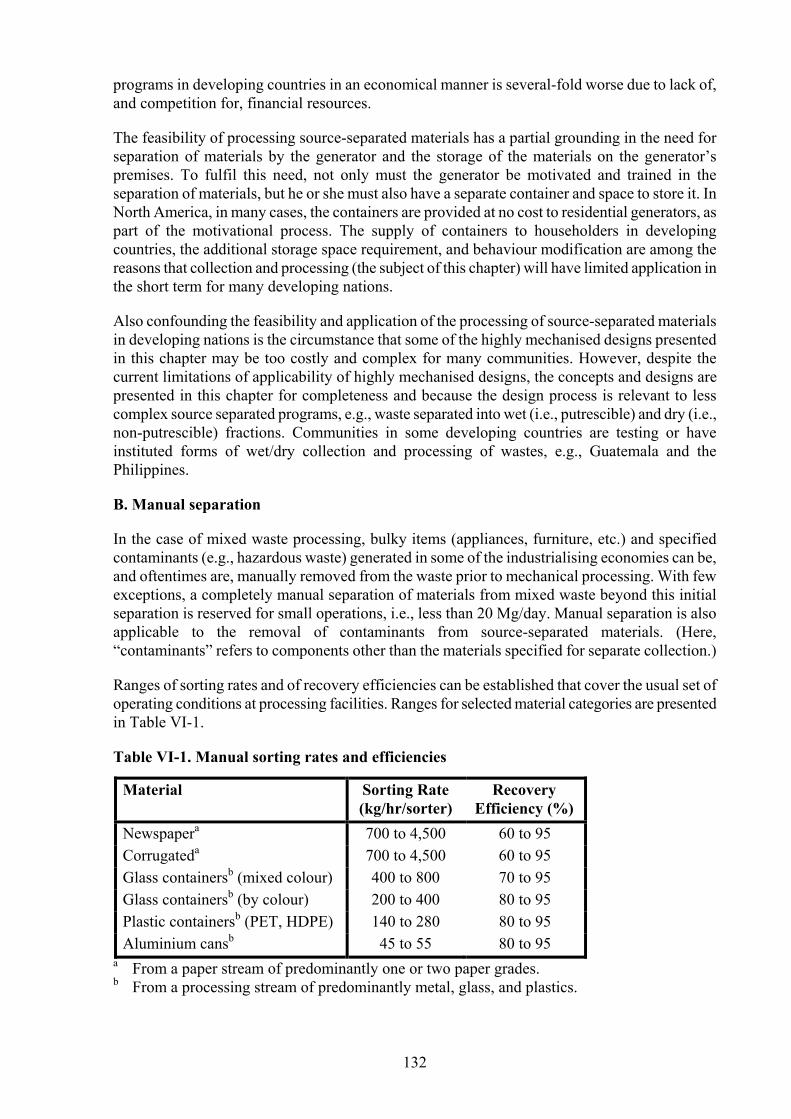
Ranges of sorting rates and of recovery efficiencies can be established that cover the usual set of operating conditions at processing facilities. Ranges for selected material categories are presented in Table VI-1.
Table VI-1. Manual sorting rates and efficiencies
Material Sorting Rate (kg/hr/sorter)
Recovery Efficiency (%)
Newspapera 700 to 4,500 60 to 95 Corrugateda 700 to 4,500 60 to 95 Glass containersb (mixed colour) 400 to 800 70 to 95 Glass containersb (by colour) 200 to 400 80 to 95 Plastic containersb (PET, HDPE) 140 to 280 80 to 95 Aluminium cansb 45 to 55 80 to 95
a From a paper stream of predominantly one or two paper grades. b From a processing stream of predominantly metal, glass, and plastics.
132
Equipment involved in manual separation of materials usually includes a sorting belt or table, which contains a mixture of materials. Workers (“sorters”) are stationed on one or both sides of the belt or table. Hoppers or other receptacles for receiving removed items are positioned within easy reach of the sorters.
The design of processes that rely on manual separation requires a good understanding of basic principles of time and motion, of the composition of the waste, and of the comfort and safety requirements of the sorters. The application of simple, labour-intensive designs does not imply a disregard for safety and environmental control within the facilities.
The incorporation of manual separation into the design of resource recovery facilities is presented elsewhere in this chapter.
C. Mechanical separation
Mechanical separation usually involves the use of several types of unit processes, five of which are size reduction, screening, air classification, magnetic separation, and non-ferrous (e.g., aluminium) separation [1-5]. Table VI-2 lists unit processes relevant to separation, as well as most of the types of mechanical unit processes that have been incorporated into waste processing facilities implemented to date.
Table VI-2. Mechanical unit processes used in waste processing facilities
• Size reduction • Glass separation • Air classification • Non-ferrous separation • Screening • Densification • Magnetic separation • Conveyors
The sequence of the processes for mixed waste processing varies, although either size reduction or a preliminary screening (trommel) usually is the first step. Process design is described later in this chapter. The intent of this section is to present a brief overview of the equipment; in-depth discussions can be found in Reference 1.
C1. SIZE reduction
The term “size reduction” has a number of synonyms in solid waste management, including “shredding” and “grinding”. The term “shredding” has been widely adopted in reference to size reducing mixed waste. In the case of processing source-separated materials, size reduction using granulators and grinders is sometimes practiced for certain types of plastics and for glass, respectively.
Size reduction usually is an essential step in mechanical processing of mixed wastes. The operation reduces bulky items to particles, the sizes of which are compatible with the processing equipment. Size reduction also brings about a degree of uniformity in terms of the maximum particle size of the diverse components or of particle size distribution of the incoming waste stream. This uniformity is a requirement of some mechanical sorting systems [1].
Since source-separated materials typically have a relatively small maximum particle size, a narrow particle size distribution, or both, they do not generally require size reduction prior to entering mechanical or manual sorting systems. In many system designs, some form of size reduction of the sorted materials is exercised after sorting to prepare the materials for marketing.
133
Coarse or primary shredding, usually to a maximum particle size of about 10 cm, is typical of many mixed waste processing facilities. Secondary and even tertiary shredding are introduced whenever a particle size significantly smaller than 10 cm is specified (e.g., the production of a refuse-derived fuel of small particle size [4]). Other circumstances that may dictate a small particle size are the recovery and processing of ferrous metals, aluminium, plastic, and glass in order to meet user specifications.
C1.1. Types of shredders
The hammermill is a type of high-speed shredder frequently used for size reducing solid waste [3,6]. Low-speed, high-torque; flail mill-type shredders; and shear shredders are also used in some cases for size reducing solid waste. However, the utilisation usually is for coarse shredding.
C1.1.1. Hammermills
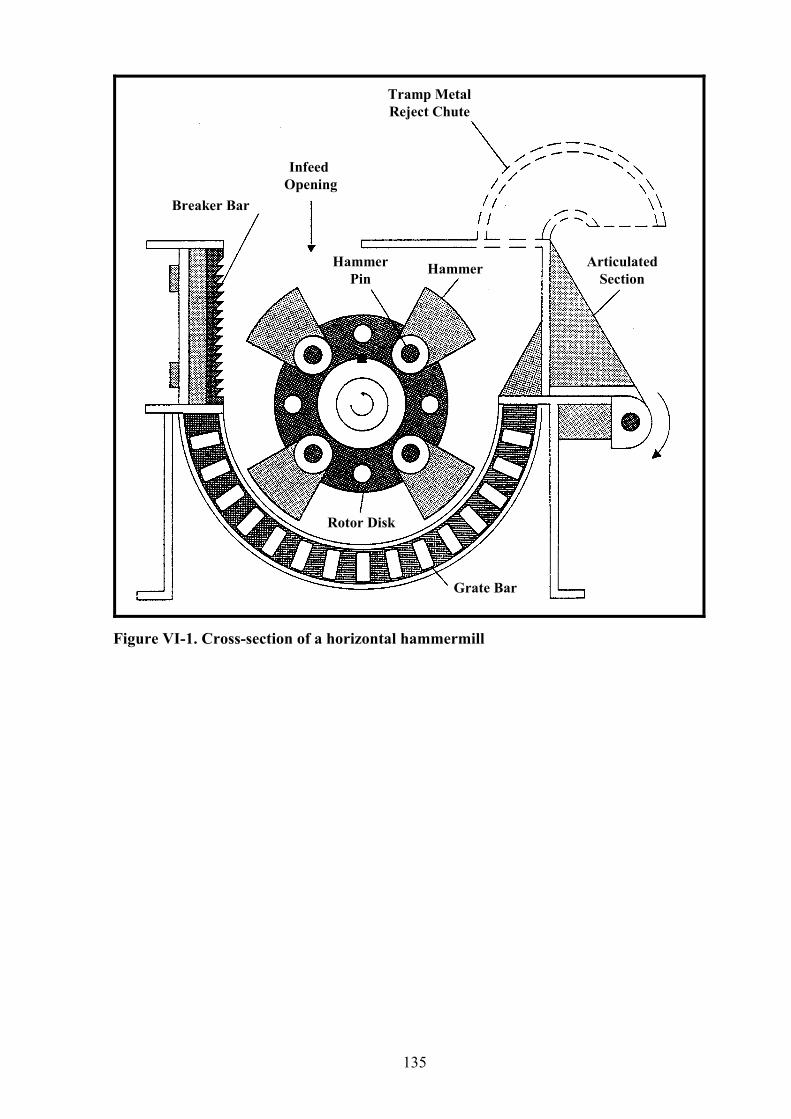
Hammermills can be divided into two generic types on the basis of orientation of the rotor -- namely, horizontal and vertical. Both types have hammers that rotate within the shredder and cause particle size reduction through collision with the infeed material. The hammers may be mounted to the shredder rotor in a fixed or freely swinging manner. The horizontal swing hammermill is commonly used in mixed waste processing. Its principal parts are the rotor, hammers, grates, frame, and flywheel. Its rotor and flywheel are mounted through bearings to the frame. A set of grate bars or cages through which size-reduced materials exit the machine is held in the bottom of the frame. A diagrammatic sketch of a horizontal hammermill is shown in Figure VI-1.
In a horizontal hammermill, designed for mixed waste processing applications, the rotational speed of the rotor is usually in the range of 1,000 to 1,500 rpm. Objects to be size reduced are introduced into the infeed opening of the machine. They then interact with the hammers and each other until at least one of their dimensions reaches a size small enough for the particle to fall through the grates at the bottom of the machine.
Residence time of the material in the mill and the size distribution of the size-reduced product are largely determined by grate spacing. Other factors that affect product size distribution are feed rate, moisture content, and hammer speed (i.e., velocity of the tip of the hammer).
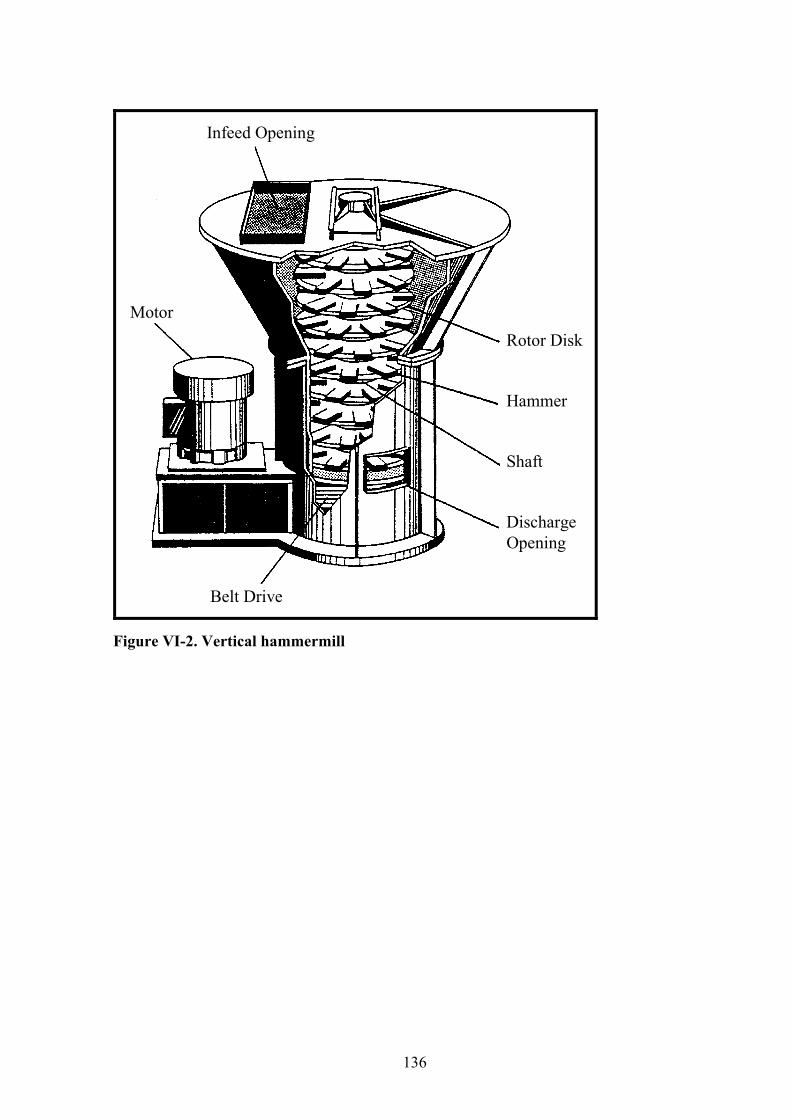
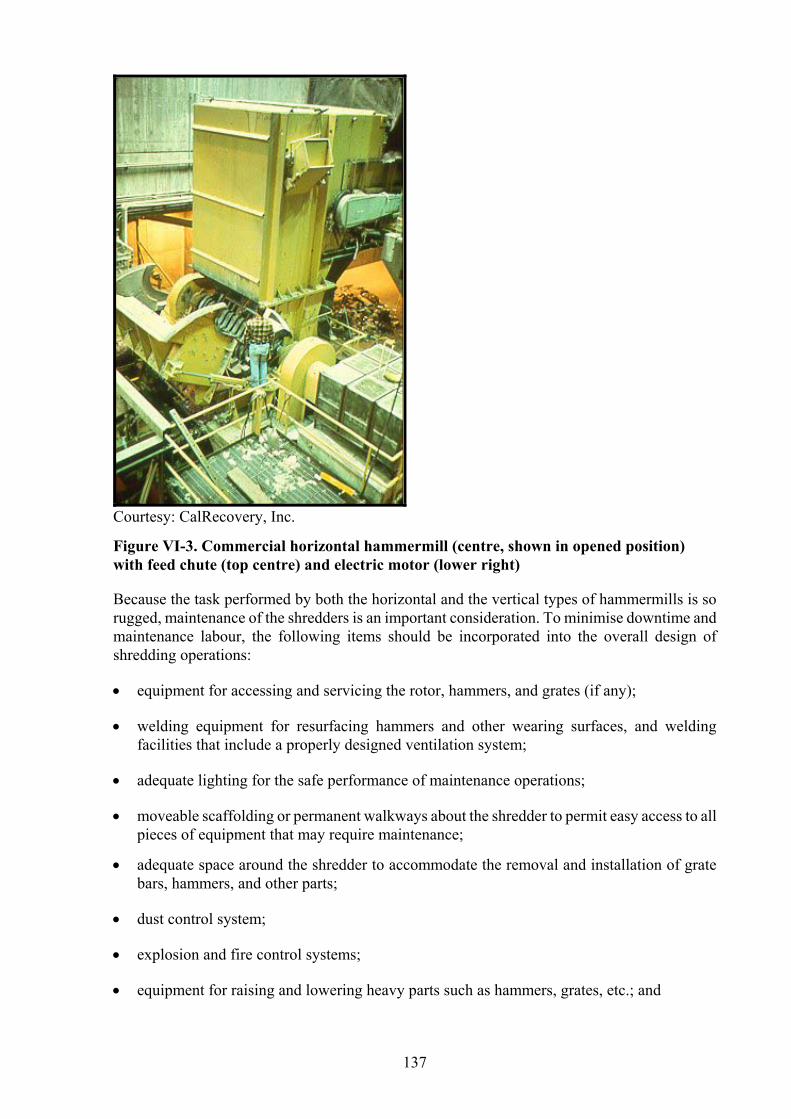
A diagrammatic sketch of the vertical type of hammermill is presented in Figure VI-2. As is indicated in the figure, the axis of the rotor is in the vertical position. The infeed material drops parallel to the shaft axis and is exposed to the action of the rotating hammers. It is shredded by the time it is discharged at the bottom of the machine. A photo of a commercial horizontal hammermill, including the infeed hopper, is shown in Figure VI-3, with the hammers exposed for maintenance.
134
Grate Bar
ArticulatedSection
HammerHammerPin
Rotor Disk
Infeed Opening
Breaker Bar
Tramp MetalReject Chute
Figure VI-1. Cross-section of a horizontal hammermill
135
Infeed Opening
MotorRotor Disk
Hammer
Shaft
DischargeOpening
Belt Drive
Figure VI-2. Vertical hammermill
136
Courtesy: CalRecovery, Inc.
Figure VI-3. Commercial horizontal hammermill (centre, shown in opened position) with feed chute (top centre) and electric motor (lower right)
Because the task performed by both the horizontal and the vertical types of hammermills is so rugged, maintenance of the shredders is an important consideration. To minimise downtime and maintenance labour, the following items should be incorporated into the overall design of shredding operations:
• equipment for accessing and servicing the rotor, hammers, and grates (if any);
• welding equipment for resurfacing hammers and other wearing surfaces, and welding facilities that include a properly designed ventilation system;
• adequate lighting for the safe performance of maintenance operations;
• moveable scaffolding or permanent walkways about the shredder to permit easy access to all pieces of equipment that may require maintenance;
• adequate space around the shredder to accommodate the removal and installation of grate bars, hammers, and other parts;
• dust control system;
• explosion and fire control systems;
• equipment for raising and lowering heavy parts such as hammers, grates, etc.; and
137

• an inventory of the manufacturer’s recommended spare parts, including those that are required for bearing and rotor replacement or overhaul, and for the removal and reinstallation of hammers, liners, wear plates, breaker bars, and grate bars or cages.
C1.1.2. Shear shredders
As mentioned earlier, the “shear” shredder is also used to size reduce mixed waste. This size reduction device is characterised by its high torque and low rpm. A drawing of a shear shredder is presented in Figure VI-4. As shown in the figure, the unit consists of two horizontal, counter-rotating shafts. Each shaft contains cutters to tear and shear the material. In shear shredders, shear and deformation are the primary mechanisms of particle size reduction. The cutters typically operate within a range of 20 to 70 rpm. Because of the shearing action and high torque, shear shredders are commonly used to size reduce items that are difficult to shred, such as tires. They generally perform poorly when fed long, pliable, stringy materials, which tend to wrap around the cutter shafts.
C1.2. Characteristics of size-reduction processes
Size reduction of solid waste and its components is an energy- and maintenance-intensive operation. Energy requirements for size reducing some solid waste fractions in one type of hammermill shredder are indicated in Figure VI-5. In the figure, specific energy (i.e., kWh/Mg processed) is plotted as a function of degree of size reduction. Degree of size reduction (zo) is defined as unity minus the ratio of characteristic product size (xo) to the feedstock characteristic size (fo) [3]. The characteristic particle size is the screen size on a size distribution curve corresponding to 63.2% cumulative weight passing. (Values of zo of zero and unity refer to no size reduction and infinite (though not achievable in practice) size reduction, respectively.) The curves in the figure clearly demonstrate that composition of the material influences the energy requirements for size reduction. For example, screened light fraction (primarily paper and plastic) requires more energy (on a unit basis) to achieve a given degree of size reduction than does mixed waste.
Energy requirements for the size reduction of mixed waste vary depending on the type and design of the size reduction equipment. The requirements for size reducing mixed waste to various product sizes using different types of horizontal hammermills are illustrated in Figure VI-6. The curves shown in the figure are the results of the field testing of a variety of size-reduction devices. Evident from the figure is the fact that the energy requirement increases dramatically if product sizes less than 1 to 2 cm are required. In terms of average gross power requirements for shredding mixed wastes, the requirement is calculated as the product of the specific energy requirement and the average design throughput, with an appropriate assumption to accommodate for the power needed to freewheel the machine. Average gross power requirements are shown as a function of nominal size of shredded product in Figure VI-7.
138

Gear Reducer
Cutters
Figure VI-4. Diagram of a shear shredder
139

0
20
40
60
80
100
120
140
0 0 0 1 1 1 1
Spec
ific
Ener
gy (k
Wh/
Mg)
(0.76) (0.76)
(1.78)
(2.54)(2.54)
(4.83)
Screened Light Fraction Air Classified LightsRaw Mixed Waste
( ) = Grate Opening, cm
Screened Light Fraction Air Classified LightsRaw Mixed Waste
( ) = Grate Opening, cm
Degree of Size Reduction [ z0 = (f0 – x0) / f0 ]
0 0.2 0.4 0.6 0.8 1
Sources: References 1, 3.
Figure VI-5. Energy requirements for various solid waste fractions using a 187 kW horizontal hammermill
0
5
10
15
20
25
30
35
40
0.1 1 10 100
Product Size (cm)
Spec
ific
Ene
rgy
(kW
h/M
g)
x 0 x 90
Sources: References 1, 3.
Figure VI-6. Specific energy requirements (wet wt basis) for size reduction of mixed waste as a function of product size
140

100
1,000
10,000
1 10
Ave
rage
Gro
ss P
ower
Est
imat
e (k
W)
10080
60
40
20
Mg/hr
Nominal Particle Size (x90) (cm)
Sources: References 1, 3.
Figure VI-7. Average gross power requirements for size reduction of mixed waste as a function of throughput (Mg/hr) and nominal size of product given free wheel power/gross power = 0.1
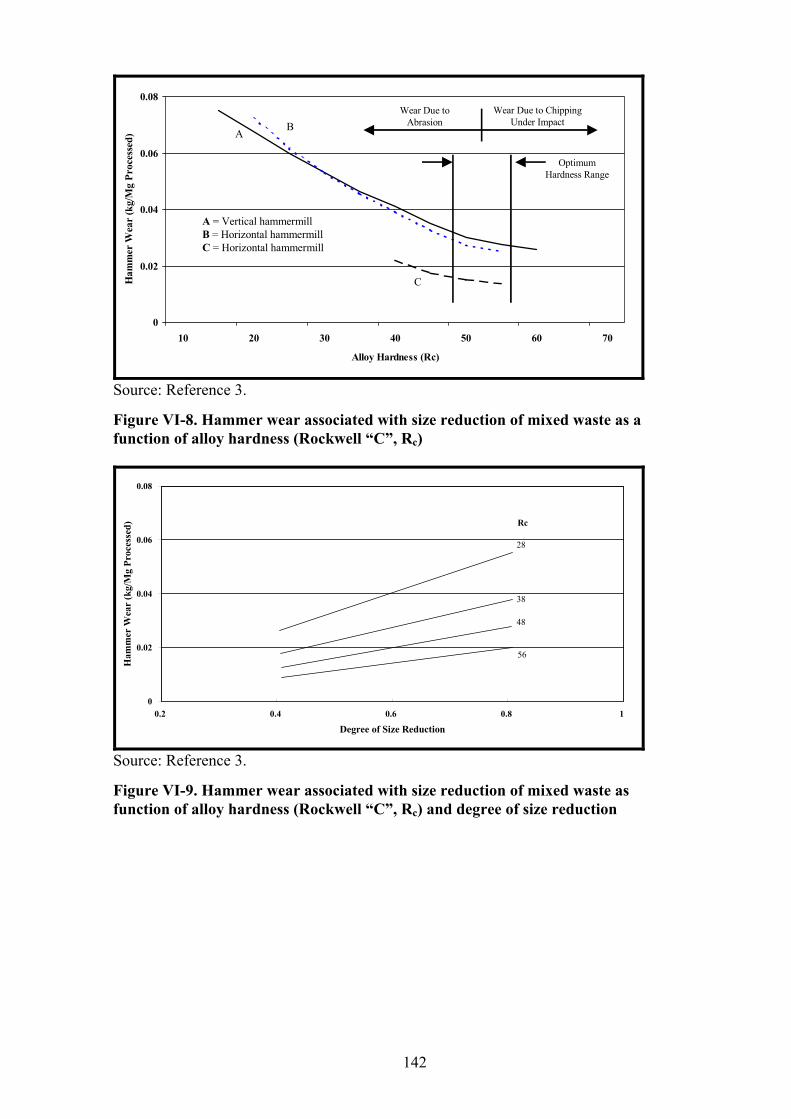
Hammer wear represents a substantial operating element and expense of size reduction of solid waste. Wear of other parts, such as the rotor and wear plates, also represents a cost, but to a somewhat lesser degree than that associated with hammer wear. However, wear and its associated costs can be controlled if the properties of the waste, operating characteristics of the size-reduction device, and metallurgy of the hammers and other wearing surfaces are taken into consideration.
Selection of the base (parent) metal for the hammer and hardfacing metallurgy based on the properties of the feedstock and on operating conditions can minimise hammer wear. As illustrated in Figures VI-8 and VI-9, for the size reduction of mixed waste using vertical and horizontal hammermills, relatively hard surface materials have been shown to exhibit substantially less wear than softer (and often standardly supplied) commercial metallurgical formulations for base hammer material and for hardfacings.
141
0
0.02
0.04
0.06
0.08
10 20 30 40 50 60 70
Alloy Hardness (Rc)
Ham
mer
Wea
r (k
g/M
g Pr
oces
sed)
A = Vertical hammermillB = Horizontal hammermillC = Horizontal hammermill
Wear Due toAbrasion
Wear Due to ChippingUnder Impact
OptimumHardness Range
C
A B
Source: Reference 3.
Figure VI-8. Hammer wear associated with size reduction of mixed waste as a function of alloy hardness (Rockwell “C”, Rc)
0
0.02
0.04
0.06
0.08
0.2 0.4 0.6 0.8 1
Degree of Size Reduction
Ham
mer
Wea
r (k
g/M
g Pr
oces
sed)
28
38
48
56
Rc
Source: Reference 3.
Figure VI-9. Hammer wear associated with size reduction of mixed waste as function of alloy hardness (Rockwell “C”, Rc) and degree of size reduction
142
C2. AIR classification
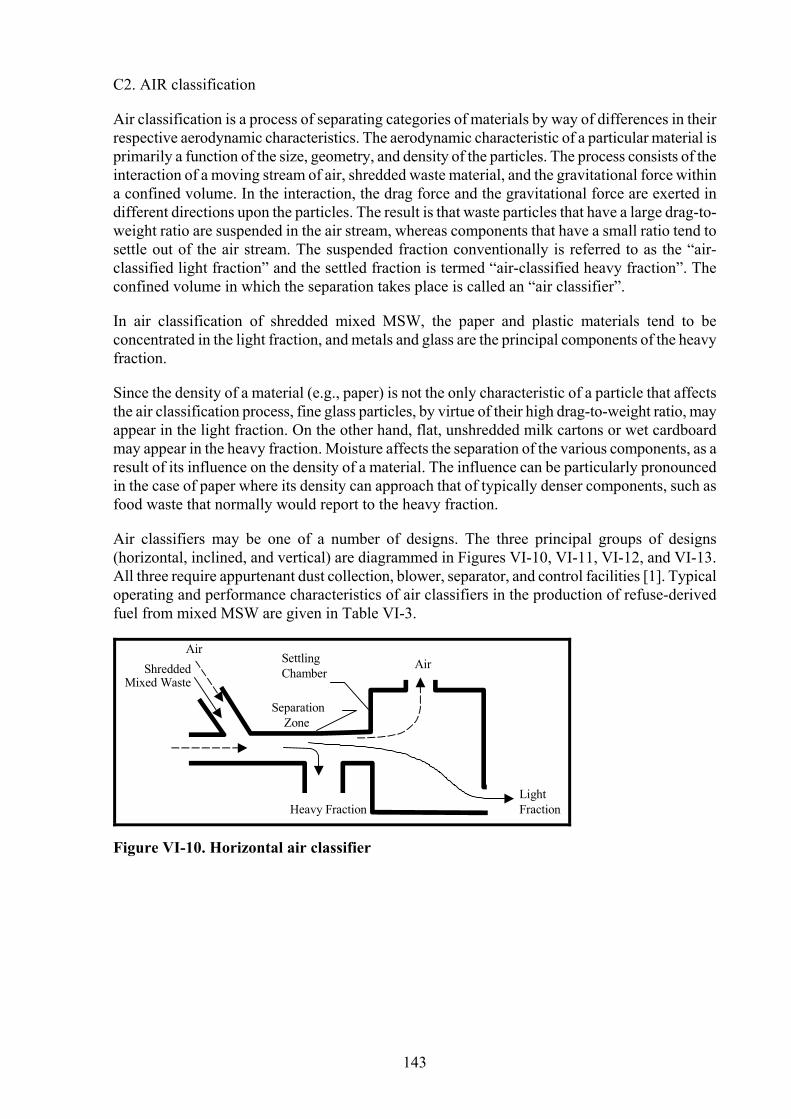
Air classification is a process of separating categories of materials by way of differences in their respective aerodynamic characteristics. The aerodynamic characteristic of a particular material is primarily a function of the size, geometry, and density of the particles. The process consists of the interaction of a moving stream of air, shredded waste material, and the gravitational force within a confined volume. In the interaction, the drag force and the gravitational force are exerted in different directions upon the particles. The result is that waste particles that have a large drag-to-weight ratio are suspended in the air stream, whereas components that have a small ratio tend to settle out of the air stream. The suspended fraction conventionally is referred to as the “air-classified light fraction” and the settled fraction is termed “air-classified heavy fraction”. The confined volume in which the separation takes place is called an “air classifier”.
In air classification of shredded mixed MSW, the paper and plastic materials tend to be concentrated in the light fraction, and metals and glass are the principal components of the heavy fraction.
Since the density of a material (e.g., paper) is not the only characteristic of a particle that affects the air classification process, fine glass particles, by virtue of their high drag-to-weight ratio, may appear in the light fraction. On the other hand, flat, unshredded milk cartons or wet cardboard may appear in the heavy fraction. Moisture affects the separation of the various components, as a result of its influence on the density of a material. The influence can be particularly pronounced in the case of paper where its density can approach that of typically denser components, such as food waste that normally would report to the heavy fraction.
Air classifiers may be one of a number of designs. The three principal groups of designs (horizontal, inclined, and vertical) are diagrammed in Figures VI-10, VI-11, VI-12, and VI-13. All three require appurtenant dust collection, blower, separator, and control facilities [1]. Typical operating and performance characteristics of air classifiers in the production of refuse-derived fuel from mixed MSW are given in Table VI-3.
Shredded Mixed Waste
AirSettlingChamber
LightFractionHeavy Fraction
SeparationZone
Air
Figure VI-10. Horizontal air classifier
143

Air
VibratoryMotion
Heavy Fraction
Air
AirLightFractionShredded
Mixed Waste
Air
Figure VI-11. Vibrating inclined air classifier
Air
Settling Chamber
Rotary Drum
Light FractionHeavy Fraction
Air
ShreddedMixed Waste
Figure VI-12. Inclined air classifier
144

Light Fraction
Shredded Mixed Waste
AirHeavy Fraction
Shredded Mixed Waste
Heavy Fraction Air
Light Fraction
Air
Air
Figure VI-13. Types of vertical air classifiers
145
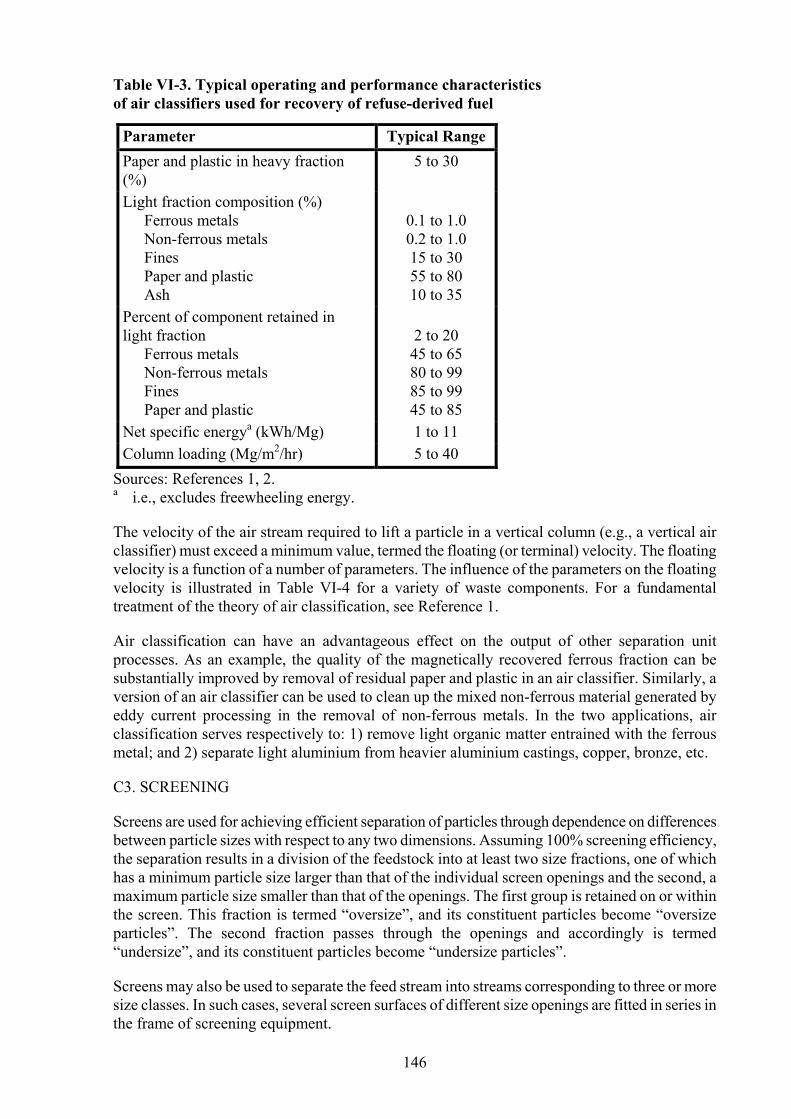
Table VI-3. Typical operating and performance characteristics of air classifiers used for recovery of refuse-derived fuel
Parameter Typical Range Paper and plastic in heavy fraction (%)
5 to 30
Light fraction composition (%) Ferrous metals Non-ferrous metals Fines Paper and plastic Ash
0.1 to 1.0 0.2 to 1.0 15 to 30 55 to 80 10 to 35
Percent of component retained in light fraction Ferrous metals Non-ferrous metals Fines Paper and plastic
2 to 20 45 to 65 80 to 99 85 to 99 45 to 85
Net specific energya (kWh/Mg) 1 to 11 Column loading (Mg/m2/hr) 5 to 40
Sources: References 1, 2. a i.e., excludes freewheeling energy.
The velocity of the air stream required to lift a particle in a vertical column (e.g., a vertical air classifier) must exceed a minimum value, termed the floating (or terminal) velocity. The floating velocity is a function of a number of parameters. The influence of the parameters on the floating velocity is illustrated in Table VI-4 for a variety of waste components. For a fundamental treatment of the theory of air classification, see Reference 1.
Air classification can have an advantageous effect on the output of other separation unit processes. As an example, the quality of the magnetically recovered ferrous fraction can be substantially improved by removal of residual paper and plastic in an air classifier. Similarly, a version of an air classifier can be used to clean up the mixed non-ferrous material generated by eddy current processing in the removal of non-ferrous metals. In the two applications, air classification serves respectively to: 1) remove light organic matter entrained with the ferrous metal; and 2) separate light aluminium from heavier aluminium castings, copper, bronze, etc.
C3. SCREENING
Screens are used for achieving efficient separation of particles through dependence on differences between particle sizes with respect to any two dimensions. Assuming 100% screening efficiency, the separation results in a division of the feedstock into at least two size fractions, one of which has a minimum particle size larger than that of the individual screen openings and the second, a maximum particle size smaller than that of the openings. The first group is retained on or within the screen. This fraction is termed “oversize”, and its constituent particles become “oversize particles”. The second fraction passes through the openings and accordingly is termed “undersize”, and its constituent particles become “undersize particles”.
Screens may also be used to separate the feed stream into streams corresponding to three or more size classes. In such cases, several screen surfaces of different size openings are fitted in series in the frame of screening equipment.
146
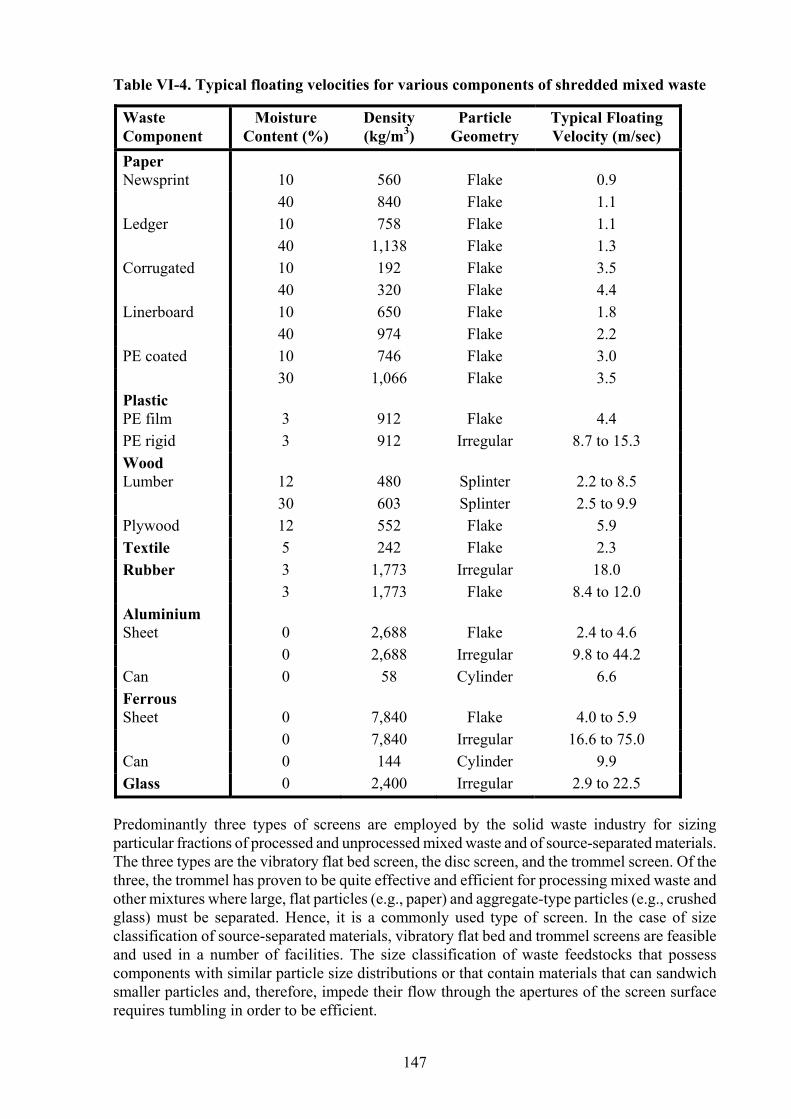
Table VI-4. Typical floating velocities for various components of shredded mixed waste
Waste Component
Moisture Content (%)
Density (kg/m3)
Particle Geometry
Typical Floating Velocity (m/sec)
Paper Newsprint
10
560
Flake
0.9
40 840 Flake 1.1 Ledger 10 758 Flake 1.1 40 1,138 Flake 1.3 Corrugated 10 192 Flake 3.5 40 320 Flake 4.4 Linerboard 10 650 Flake 1.8 40 974 Flake 2.2 PE coated 10 746 Flake 3.0 30 1,066 Flake 3.5 Plastic PE film
3
912
Flake
4.4
PE rigid 3 912 Irregular 8.7 to 15.3 Wood Lumber
12
480
Splinter
2.2 to 8.5
30 603 Splinter 2.5 to 9.9 Plywood 12 552 Flake 5.9 Textile 5 242 Flake 2.3 Rubber 3 1,773 Irregular 18.0 3 1,773 Flake 8.4 to 12.0 Aluminium Sheet
0
2,688
Flake
2.4 to 4.6
0 2,688 Irregular 9.8 to 44.2 Can 0 58 Cylinder 6.6 Ferrous Sheet
0
7,840
Flake
4.0 to 5.9
0 7,840 Irregular 16.6 to 75.0 Can 0 144 Cylinder 9.9 Glass 0 2,400 Irregular 2.9 to 22.5
Predominantly three types of screens are employed by the solid waste industry for sizing particular fractions of processed and unprocessed mixed waste and of source-separated materials. The three types are the vibratory flat bed screen, the disc screen, and the trommel screen. Of the three, the trommel has proven to be quite effective and efficient for processing mixed waste and other mixtures where large, flat particles (e.g., paper) and aggregate-type particles (e.g., crushed glass) must be separated. Hence, it is a commonly used type of screen. In the case of size classification of source-separated materials, vibratory flat bed and trommel screens are feasible and used in a number of facilities. The size classification of waste feedstocks that possess components with similar particle size distributions or that contain materials that can sandwich smaller particles and, therefore, impede their flow through the apertures of the screen surface requires tumbling in order to be efficient.
147

C3.1. Trommel
The trommel is a downwardly inclined, rotary, cylindrical screen. Its screening surface is either a wire mesh or a perforated plate. An illustration of a trommel screen is presented in Figure VI-14. The trommel can be used to process raw mixed waste prior to size reduction (“pre-trommeling”), as well as to process shredded mixed waste (“post-trommeling”). With either option, the characteristic tumbling action imparted by the rotating screen results in efficient separation [7,8].
Courtesy: The Heil Company.
Figure VI-14. End view of a trommel screen
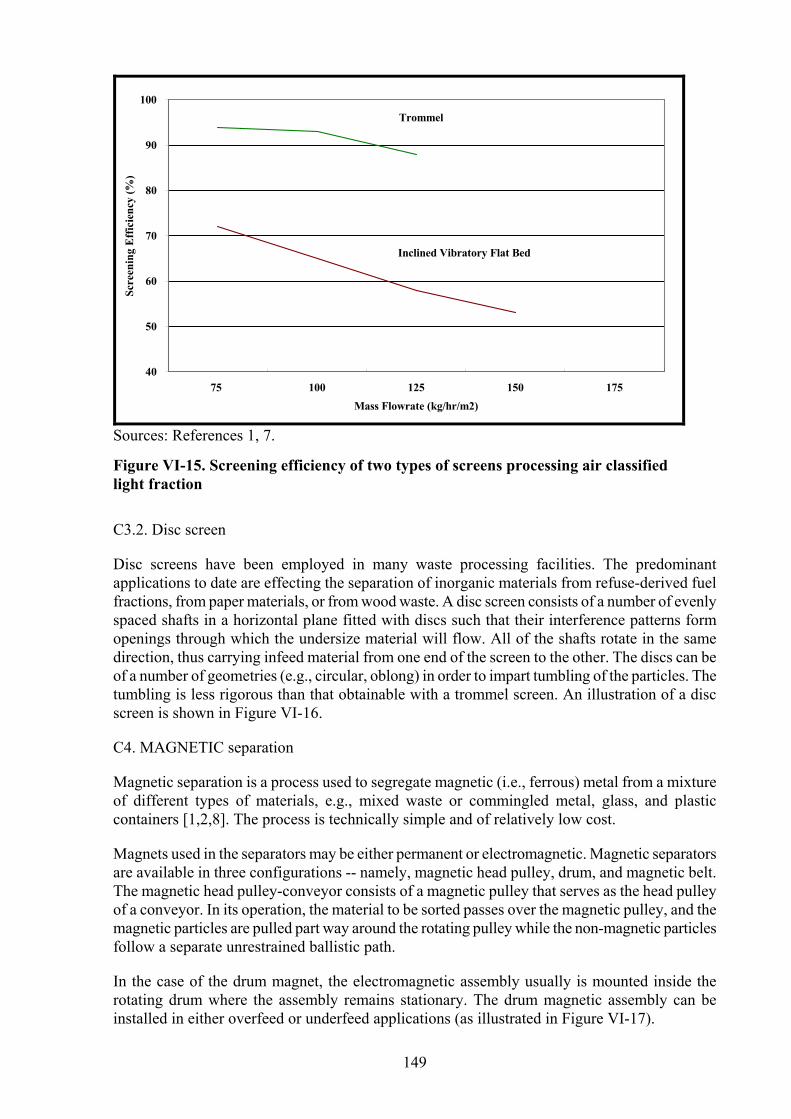
The tumbling action efficiently separates adhering items, “sandwiched” undersize particles, or an item from its contents. The tumbling action is essential in the screening of mixed waste because of the need for a high degree of screening efficiency, coupled with a minimum of screening surface. An example of the greater screening efficiency achieved by a trommel screen, in comparison to that of a vibratory flat bed screen, is given in Figure VI-15.
When installed ahead of the primary shredder, the trommel can be designed to achieve one or more of the following four objectives: 1) the removal of most of the fine abrasive inorganic materials, such as dirt and stones; 2) the tearing and opening of bundles of paper and bags of waste; 3) a coarse separation of metal, glass, and plastic containers from corrugated, ledger, and newspaper; and 4) elimination of the passage of materials through the shredder that already meet the maximum particle size specification of the shredder discharge product. In meeting the latter objective, wear on shredder components and size reduction energy requirements are minimised, and a primary shredder of smaller capacity can be used in the system. If installed downstream of the primary shredder, the trommel can be designed to remove pulverised glass, dirt, heavy food particles, and other organic materials; an important function for certain recovery applications. Because the shredded particles of mixed waste generally have lesser weights than those of raw mixed waste, a smaller and lighter trommel can be used than if raw mixed waste is screened.
148
40
50
60
70
80
90
100
75 100 125 150 175Mass Flowrate (kg/hr/m2)
Scre
enin
g E
ffic
ienc
y (%
)Trommel
Inclined Vibratory Flat Bed
Sources: References 1, 7.
Figure VI-15. Screening efficiency of two types of screens processing air classified light fraction
C3.2. Disc screen
Disc screens have been employed in many waste processing facilities. The predominant applications to date are effecting the separation of inorganic materials from refuse-derived fuel fractions, from paper materials, or from wood waste. A disc screen consists of a number of evenly spaced shafts in a horizontal plane fitted with discs such that their interference patterns form openings through which the undersize material will flow. All of the shafts rotate in the same direction, thus carrying infeed material from one end of the screen to the other. The discs can be of a number of geometries (e.g., circular, oblong) in order to impart tumbling of the particles. The tumbling is less rigorous than that obtainable with a trommel screen. An illustration of a disc screen is shown in Figure VI-16.
C4. MAGNETIC separation
Magnetic separation is a process used to segregate magnetic (i.e., ferrous) metal from a mixture of different types of materials, e.g., mixed waste or commingled metal, glass, and plastic containers [1,2,8]. The process is technically simple and of relatively low cost.
Magnets used in the separators may be either permanent or electromagnetic. Magnetic separators are available in three configurations -- namely, magnetic head pulley, drum, and magnetic belt. The magnetic head pulley-conveyor consists of a magnetic pulley that serves as the head pulley of a conveyor. In its operation, the material to be sorted passes over the magnetic pulley, and the magnetic particles are pulled part way around the rotating pulley while the non-magnetic particles follow a separate unrestrained ballistic path.
In the case of the drum magnet, the electromagnetic assembly usually is mounted inside the rotating drum where the assembly remains stationary. The drum magnetic assembly can be installed in either overfeed or underfeed applications (as illustrated in Figure VI-17).
149

Courtesy: Rader Resource Recovery, Inc.
Figure VI-16. Disc screen
Magnetic Belt -First Stage
Magnetic Belt -Second Stage
Ferrous Ferrous
Non-Ferrous Non-Ferrous
Non-Ferrous Collection Conveyor
Mixed Waste orCommingledContainers Clean Ferrous M
aterials
Figure VI-17. Multiple stages of magnetic separators
150
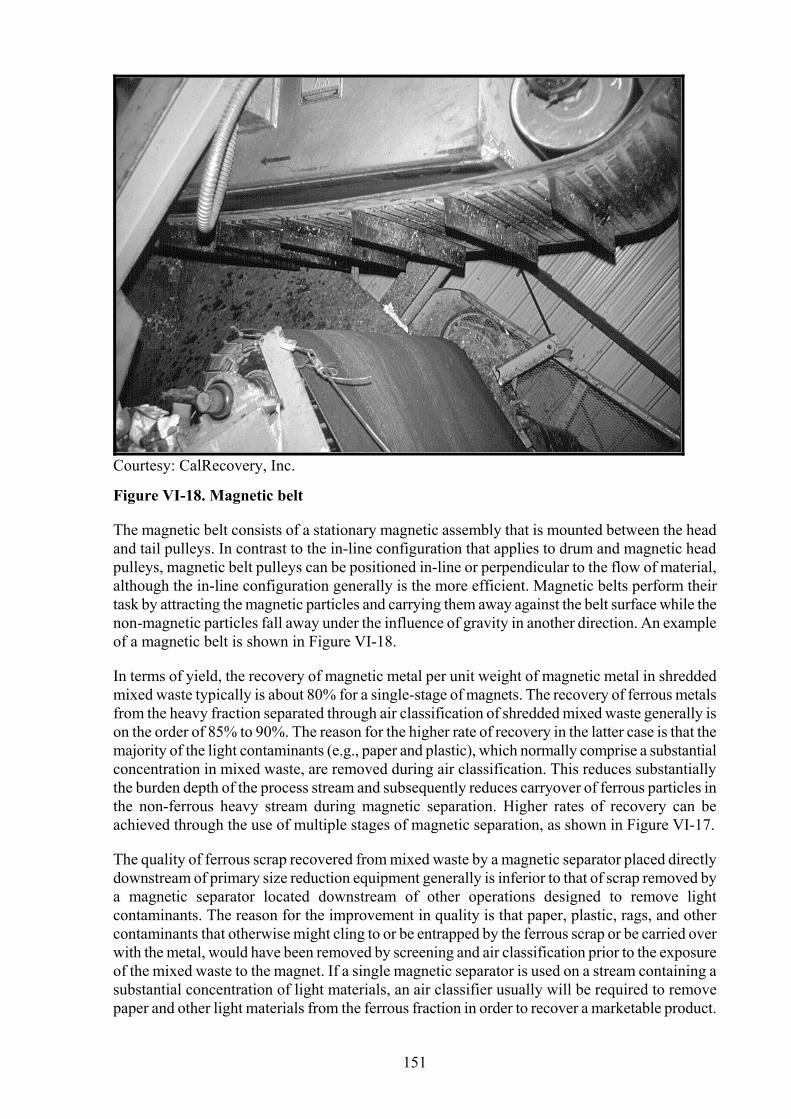
Courtesy: CalRecovery, Inc.
Figure VI-18. Magnetic belt
The magnetic belt consists of a stationary magnetic assembly that is mounted between the head and tail pulleys. In contrast to the in-line configuration that applies to drum and magnetic head pulleys, magnetic belt pulleys can be positioned in-line or perpendicular to the flow of material, although the in-line configuration generally is the more efficient. Magnetic belts perform their task by attracting the magnetic particles and carrying them away against the belt surface while the non-magnetic particles fall away under the influence of gravity in another direction. An example of a magnetic belt is shown in Figure VI-18.
In terms of yield, the recovery of magnetic metal per unit weight of magnetic metal in shredded mixed waste typically is about 80% for a single-stage of magnets. The recovery of ferrous metals from the heavy fraction separated through air classification of shredded mixed waste generally is on the order of 85% to 90%. The reason for the higher rate of recovery in the latter case is that the majority of the light contaminants (e.g., paper and plastic), which normally comprise a substantial concentration in mixed waste, are removed during air classification. This reduces substantially the burden depth of the process stream and subsequently reduces carryover of ferrous particles in the non-ferrous heavy stream during magnetic separation. Higher rates of recovery can be achieved through the use of multiple stages of magnetic separation, as shown in Figure VI-17.
The quality of ferrous scrap recovered from mixed waste by a magnetic separator placed directly downstream of primary size reduction equipment generally is inferior to that of scrap removed by a magnetic separator located downstream of other operations designed to remove light contaminants. The reason for the improvement in quality is that paper, plastic, rags, and other contaminants that otherwise might cling to or be entrapped by the ferrous scrap or be carried over with the metal, would have been removed by screening and air classification prior to the exposure of the mixed waste to the magnet. If a single magnetic separator is used on a stream containing a substantial concentration of light materials, an air classifier usually will be required to remove paper and other light materials from the ferrous fraction in order to recover a marketable product.
151
C5. ALUMINIUM and glass separation
Several technologically complex processes have been utilised or proposed for non-ferrous and glass separation. The predominant non-ferrous metal represented in the waste stream is usually aluminium, and it is oftentimes a target for recovery. In the case of aluminium, heavy media and eddy current separation are possibilities. Of these two processes, eddy current separation is, at present, the more commercially feasible. Separation is brought about by the ejection of aluminium particles (and potentially other non-ferrous metals, if present) from a moving waste stream due to the force exerted on the metallic particles as they pass through an electromagnetic flux generated by the equipment. Contamination of aluminium recovered by the eddy current separator by other non-ferrous (ONF) metals is primarily a function of the concentration of ONF in the feedstock stream, size distribution of the types of materials in the feedstock stream, and the operating conditions of the eddy current separator.
Froth flotation and optical electronic sorting have both been used for glass removal. Neither of these technologies has been shown to be economical. Efficient and highly productive mechanical processes for separation of aluminium and of glass (by colour or mixed colour) are costly and complex [1].
C6. DRYING and densification
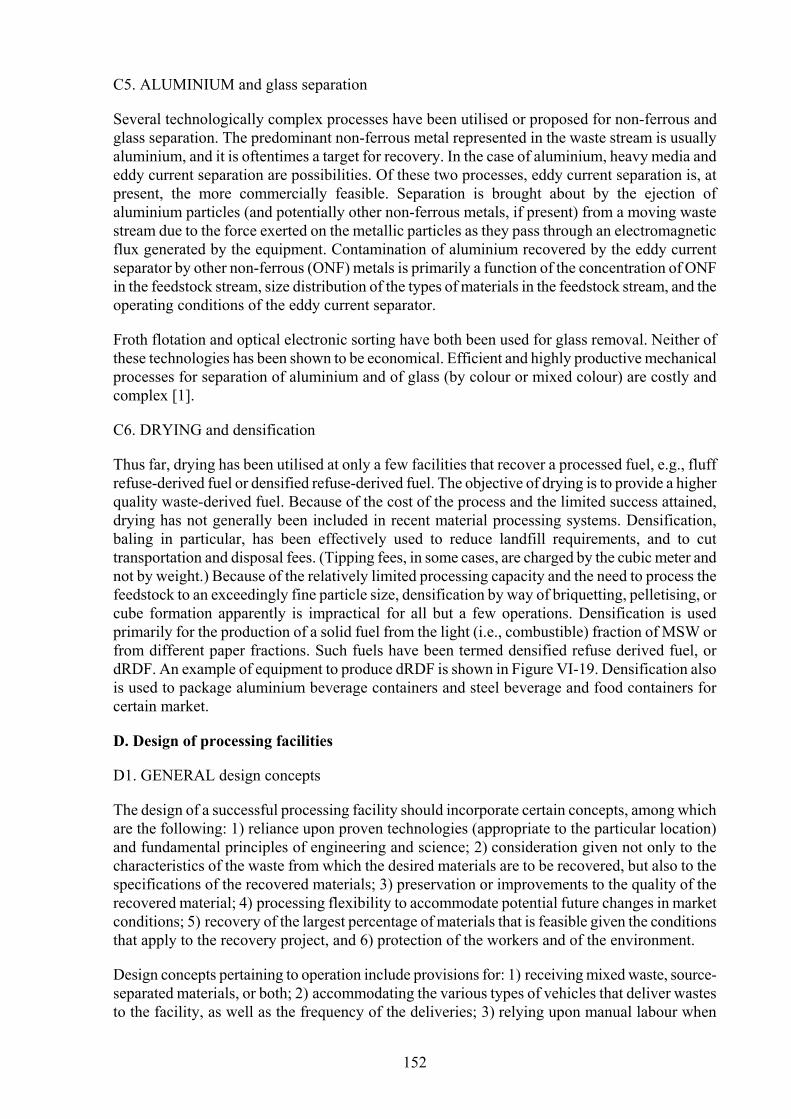
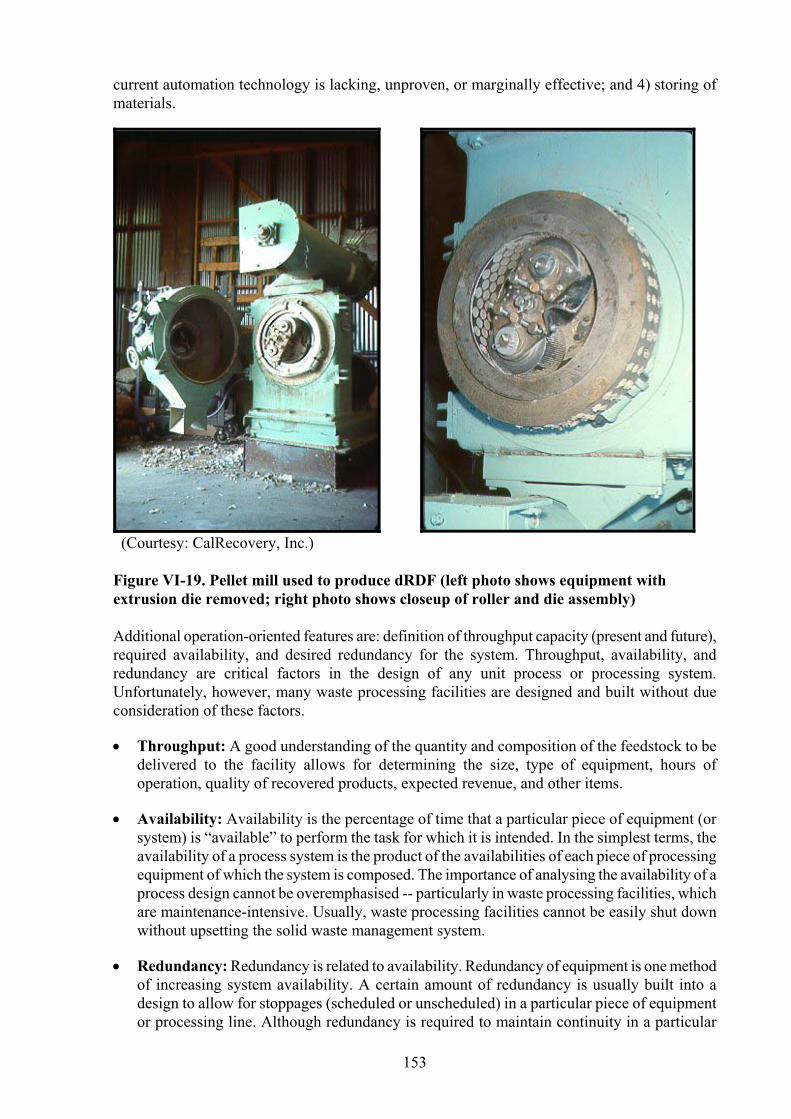
Thus far, drying has been utilised at only a few facilities that recover a processed fuel, e.g., fluff refuse-derived fuel or densified refuse-derived fuel. The objective of drying is to provide a higher quality waste-derived fuel. Because of the cost of the process and the limited success attained, drying has not generally been included in recent material processing systems. Densification, baling in particular, has been effectively used to reduce landfill requirements, and to cut transportation and disposal fees. (Tipping fees, in some cases, are charged by the cubic meter and not by weight.) Because of the relatively limited processing capacity and the need to process the feedstock to an exceedingly fine particle size, densification by way of briquetting, pelletising, or cube formation apparently is impractical for all but a few operations. Densification is used primarily for the production of a solid fuel from the light (i.e., combustible) fraction of MSW or from different paper fractions. Such fuels have been termed densified refuse derived fuel, or dRDF. An example of equipment to produce dRDF is shown in Figure VI-19. Densification also is used to package aluminium beverage containers and steel beverage and food containers for certain market.
D. Design of processing facilities
D1. GENERAL design concepts
The design of a successful processing facility should incorporate certain concepts, among which are the following: 1) reliance upon proven technologies (appropriate to the particular location) and fundamental principles of engineering and science; 2) consideration given not only to the characteristics of the waste from which the desired materials are to be recovered, but also to the specifications of the recovered materials; 3) preservation or improvements to the quality of the recovered material; 4) processing flexibility to accommodate potential future changes in market conditions; 5) recovery of the largest percentage of materials that is feasible given the conditions that apply to the recovery project, and 6) protection of the workers and of the environment.
Design concepts pertaining to operation include provisions for: 1) receiving mixed waste, source-separated materials, or both; 2) accommodating the various types of vehicles that deliver wastes to the facility, as well as the frequency of the deliveries; 3) relying upon manual labour when
152
current automation technology is lacking, unproven, or marginally effective; and 4) storing of materials.
(Courtesy: CalRecovery, Inc.) Figure VI-19. Pellet mill used to produce dRDF (left photo shows equipment with extrusion die removed; right photo shows closeup of roller and die assembly) Additional operation-oriented features are: definition of throughput capacity (present and future), required availability, and desired redundancy for the system. Throughput, availability, and redundancy are critical factors in the design of any unit process or processing system. Unfortunately, however, many waste processing facilities are designed and built without due consideration of these factors.
• Throughput: A good understanding of the quantity and composition of the feedstock to be delivered to the facility allows for determining the size, type of equipment, hours of operation, quality of recovered products, expected revenue, and other items.
• Availability: Availability is the percentage of time that a particular piece of equipment (or system) is “available” to perform the task for which it is intended. In the simplest terms, the availability of a process system is the product of the availabilities of each piece of processing equipment of which the system is composed. The importance of analysing the availability of a process design cannot be overemphasised -- particularly in waste processing facilities, which are maintenance-intensive. Usually, waste processing facilities cannot be easily shut down without upsetting the solid waste management system.
• Redundancy: Redundancy is related to availability. Redundancy of equipment is one method of increasing system availability. A certain amount of redundancy is usually built into a design to allow for stoppages (scheduled or unscheduled) in a particular piece of equipment or processing line. Although redundancy is required to maintain continuity in a particular
153
process, it has the effect of increasing capital costs. Consequently, redundancy in waste processing design often is ignored or minimised in order to maintain costs to a minimum.
Low availability and the lack of redundancy are two factors that have played key roles in the closure or inefficiency of waste processing facilities throughout the world. These factors are particularly important in waste processing due to the lack of reliable, quantitative information on the performance of equipment and the systems used.
A fundamental consideration in the overall design of a processing facility is whether or not the input municipal solid waste (MSW) is mixed (not separated prior to collection) or is source separated. Obviously, mixed MSW contains many types of materials (i.e., components) with varying particle size distributions. Conversely, source-separated wastes refer to wastes that have been separated into individual components (e.g., tin cans) at the site of generation and are kept separated throughout collection and transport. In practice, the term has been broadened to include components in commingled form, i.e., specified mixtures of a few individual categories. An example of a commingled group is one consisting of metal and glass containers, or one composed of metal, glass, plastic containers, and paper grades.
In a properly implemented program, source-separated recyclable materials are accompanied by less contamination in the form of food wastes and other objectionable materials than would accompany them in municipal mixed waste. It follows that, if all other conditions are similar, the lower degree of contamination significantly raises the percentage recovery of materials in the form of products and raises the quality of the products.
A variety of material categories serve as feedstocks for processing facilities designed to deal with source-separated materials. Individual categories (e.g., tin cans or glass containers) may be delivered singularly or in commingled forms. The design of the physical layout of the processing facility and selection of equipment is primarily a function of: 1) the quantities, composition, and properties of each of the feedstock streams that will enter the facility; and 2) the market specifications of the recovered products. Other design considerations include the potential need for, and the benefits of, processing flexibility. Flexibility includes the provision of producing more than one marketable form for a particular material type, e.g., baled and granulated forms of high-density polyethylene (HDPE). An illustration of applicable design considerations and processing alternatives for a variety of source-separated processing facility feedstocks, whether delivered in individually segregated or various commingled forms, is provided in Table VI-5.
Several unit processes can be used for processing of materials, as discussed earlier in this chapter. The variety of processing equipment reflects the variety of the forms of the feedstocks, of feedstock composition, and of market specifications that may apply to a particular project. Equipment is also required for environmental control, for processing control, and for documentation (e.g., weigh scales), as illustrated in Table VI-6.
The selection of unit operations, operating conditions, and processing line configurations requires careful analysis in terms of recovered product qualities and waste diversion (from landfill) criteria [23]. Processing may support recovery of materials for re-manufacturing (e.g., container glass and aluminium beverage containers), for use as a solid fuel (e.g., refuse-derived fuel), or both. Additionally, processing may be required to reduce the organic content of wastes that require land disposal, e.g., in Europe [21,22].
The processing of materials, and the recovery and preparation of end products to market specifications, is a complex undertaking and requires a substantial effort if high efficiency and production rates are the system design objectives. One of the reasons is the sheer number of
154
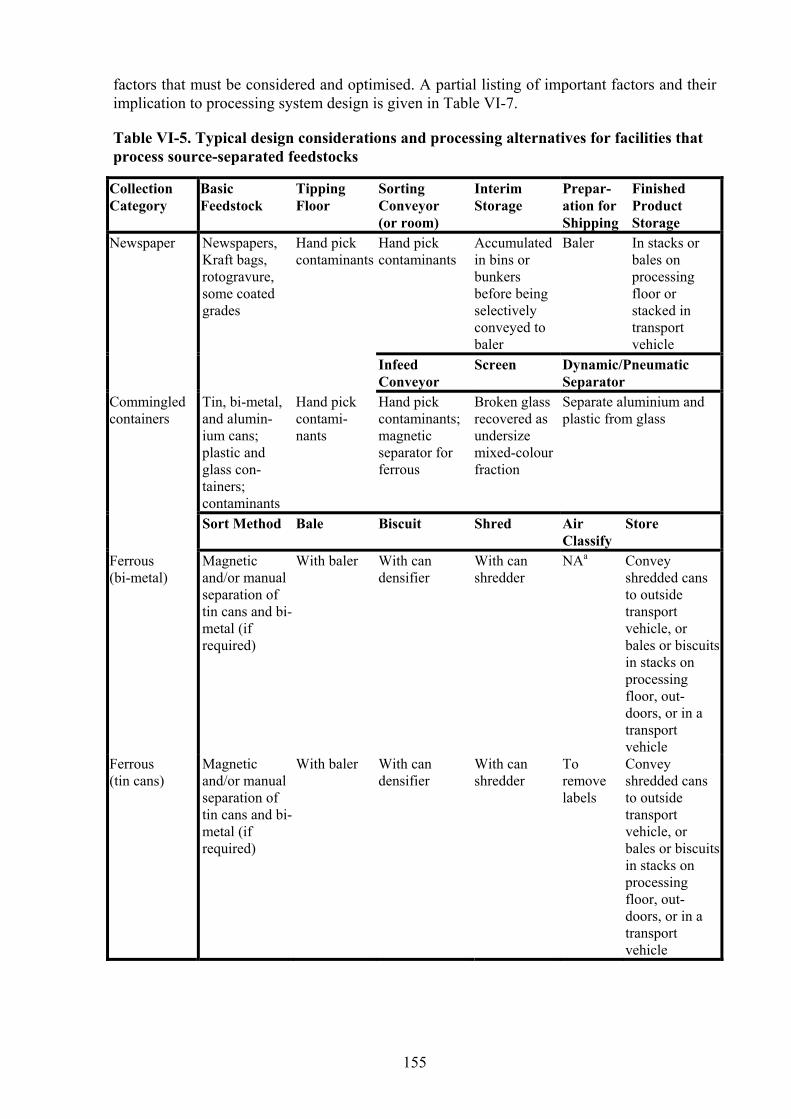
factors that must be considered and optimised. A partial listing of important factors and their implication to processing system design is given in Table VI-7.
Table VI-5. Typical design considerations and processing alternatives for facilities that process source-separated feedstocks
Collection Category
Basic Feedstock
Tipping Floor
Sorting Conveyor (or room)
Interim Storage
Prepar-ation for Shipping
Finished Product Storage
Newspaper Newspapers, Kraft bags, rotogravure, some coated grades
Hand pick contaminants
Hand pick contaminants
Accumulated in bins or bunkers before being selectively conveyed to baler
Baler In stacks or bales on processing floor or stacked in transport vehicle
Infeed Conveyor
Screen Dynamic/Pneumatic Separator
Commingled containers
Tin, bi-metal, and alumin-ium cans; plastic and glass con-tainers; contaminants
Hand pick contami-nants
Hand pick contaminants; magnetic separator for ferrous
Broken glass recovered as undersize mixed-colour fraction
Separate aluminium and plastic from glass
Sort Method Bale Biscuit Shred Air Classify
Store
Ferrous (bi-metal)
Magnetic and/or manual separation of tin cans and bi-metal (if required)
With baler With can densifier
With can shredder
NAa Convey shredded cans to outside transport vehicle, or bales or biscuits in stacks on processing floor, out-doors, or in a transport vehicle
Ferrous (tin cans)
Magnetic and/or manual separation of tin cans and bi-metal (if required)
With baler With can densifier
With can shredder
To remove labels
Convey shredded cans to outside transport vehicle, or bales or biscuits in stacks on processing floor, out-doors, or in a transport vehicle
155

Table VI-5. Typical design considerations and processing alternatives for facilities that process source-separated feedstocks (cont.)
Flatten Transfer Bale Biscuit Store Aluminium Eddy current
apparatus separates aluminium from non-metals
With can flattener
Pneumatically convey to outside transport vehicle
With baler Compress in a densifier
On process-ing floor, outdoors, or in a transport vehicle
Collection Category
Basic Feedstock
Interim Storage
Perforate Bale Store
Plastic (PET)
Pneumatic and/or manual sort of PET
In overhead hoppers
Drop from overhead hopper or pneumatically convey to perforator
Mechani-cally or pneumati-cally from perforator to baler
On processing floor or outdoors in transport vehicles
Granulate Bale Store Plastic (HDPE)
Manual sort of HDPE
In overhead hoppers
Drop from overhead hopper or pneumatically convey to granulator
Mechani-cally or pneumatic-cally convey to baler
Granulated in gaylords on processing floor before loading into transport vehicle, baled in stacks on processing floor or outdoors in transport vehicles
Crush Upgrade Store Glass Optical
automatic sort or hand sort by colour
With glass crusher
Remove paper labels, metal lids, and other contaminants by screen and/or air classifier
In bunkers for loading by front-end loader, or in overhead bins for selectively conveying to transport vehicles
Bale Store Plastic (HDPE and PET)
Manual sort of each type of resin
Mechanically or pneumatically convey to baler
In bunkers for loading by front-end loader, or in overhead bins for selectively conveying to transport vehicles
Sources: References 9, 10, 18. a NA = not applicable.
156
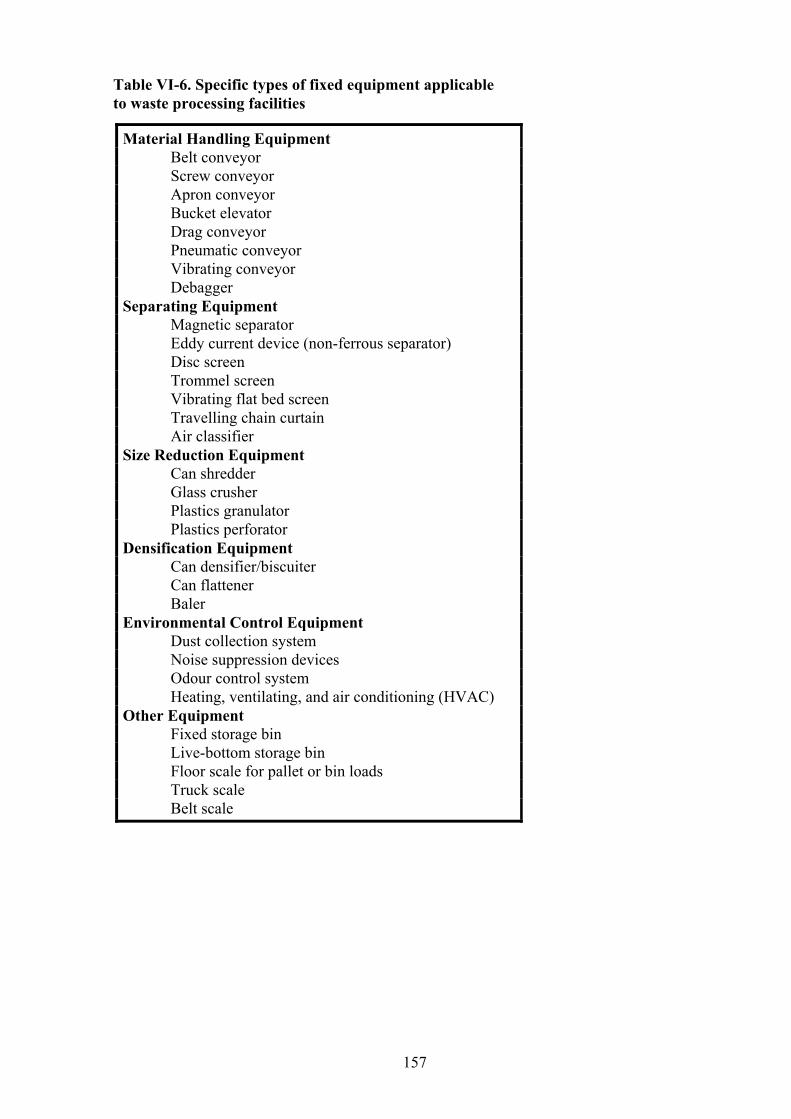
Table VI-6. Specific types of fixed equipment applicable to waste processing facilities
Material Handling Equipment Belt conveyor Screw conveyor Apron conveyor Bucket elevator Drag conveyor Pneumatic conveyor Vibrating conveyor Debagger Separating Equipment Magnetic separator Eddy current device (non-ferrous separator) Disc screen Trommel screen Vibrating flat bed screen Travelling chain curtain Air classifier Size Reduction Equipment Can shredder Glass crusher Plastics granulator Plastics perforator Densification Equipment Can densifier/biscuiter Can flattener Baler Environmental Control Equipment Dust collection system Noise suppression devices Odour control system Heating, ventilating, and air conditioning (HVAC) Other Equipment Fixed storage bin Live-bottom storage bin Floor scale for pallet or bin loads Truck scale Belt scale
157
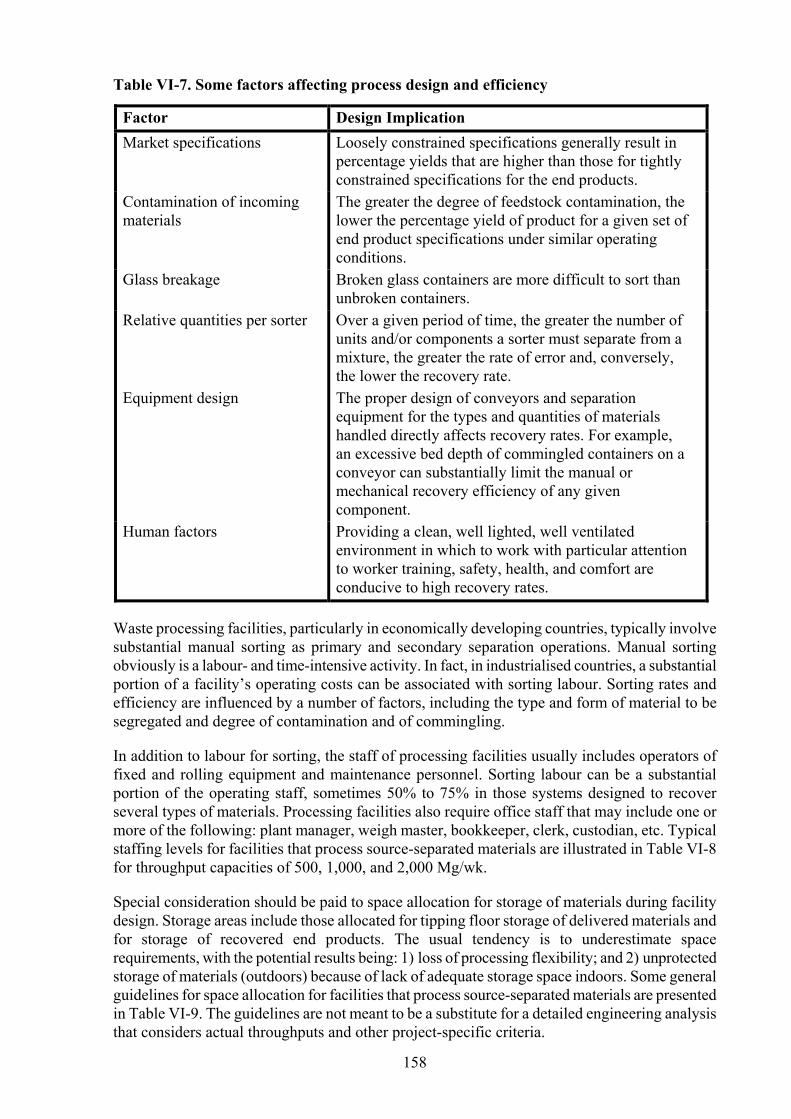
Table VI-7. Some factors affecting process design and efficiency
Factor Design Implication Market specifications Loosely constrained specifications generally result in
percentage yields that are higher than those for tightly constrained specifications for the end products.
Contamination of incoming materials
The greater the degree of feedstock contamination, the lower the percentage yield of product for a given set of end product specifications under similar operating conditions.
Glass breakage Broken glass containers are more difficult to sort than unbroken containers.
Relative quantities per sorter Over a given period of time, the greater the number of units and/or components a sorter must separate from a mixture, the greater the rate of error and, conversely, the lower the recovery rate.
Equipment design The proper design of conveyors and separation equipment for the types and quantities of materials handled directly affects recovery rates. For example, an excessive bed depth of commingled containers on a conveyor can substantially limit the manual or mechanical recovery efficiency of any given component.
Human factors Providing a clean, well lighted, well ventilated environment in which to work with particular attention to worker training, safety, health, and comfort are conducive to high recovery rates.
Waste processing facilities, particularly in economically developing countries, typically involve substantial manual sorting as primary and secondary separation operations. Manual sorting obviously is a labour- and time-intensive activity. In fact, in industrialised countries, a substantial portion of a facility’s operating costs can be associated with sorting labour. Sorting rates and efficiency are influenced by a number of factors, including the type and form of material to be segregated and degree of contamination and of commingling.
In addition to labour for sorting, the staff of processing facilities usually includes operators of fixed and rolling equipment and maintenance personnel. Sorting labour can be a substantial portion of the operating staff, sometimes 50% to 75% in those systems designed to recover several types of materials. Processing facilities also require office staff that may include one or more of the following: plant manager, weigh master, bookkeeper, clerk, custodian, etc. Typical staffing levels for facilities that process source-separated materials are illustrated in Table VI-8 for throughput capacities of 500, 1,000, and 2,000 Mg/wk.
Special consideration should be paid to space allocation for storage of materials during facility design. Storage areas include those allocated for tipping floor storage of delivered materials and for storage of recovered end products. The usual tendency is to underestimate space requirements, with the potential results being: 1) loss of processing flexibility; and 2) unprotected storage of materials (outdoors) because of lack of adequate storage space indoors. Some general guidelines for space allocation for facilities that process source-separated materials are presented in Table VI-9. The guidelines are not meant to be a substitute for a detailed engineering analysis that considers actual throughputs and other project-specific criteria.
158
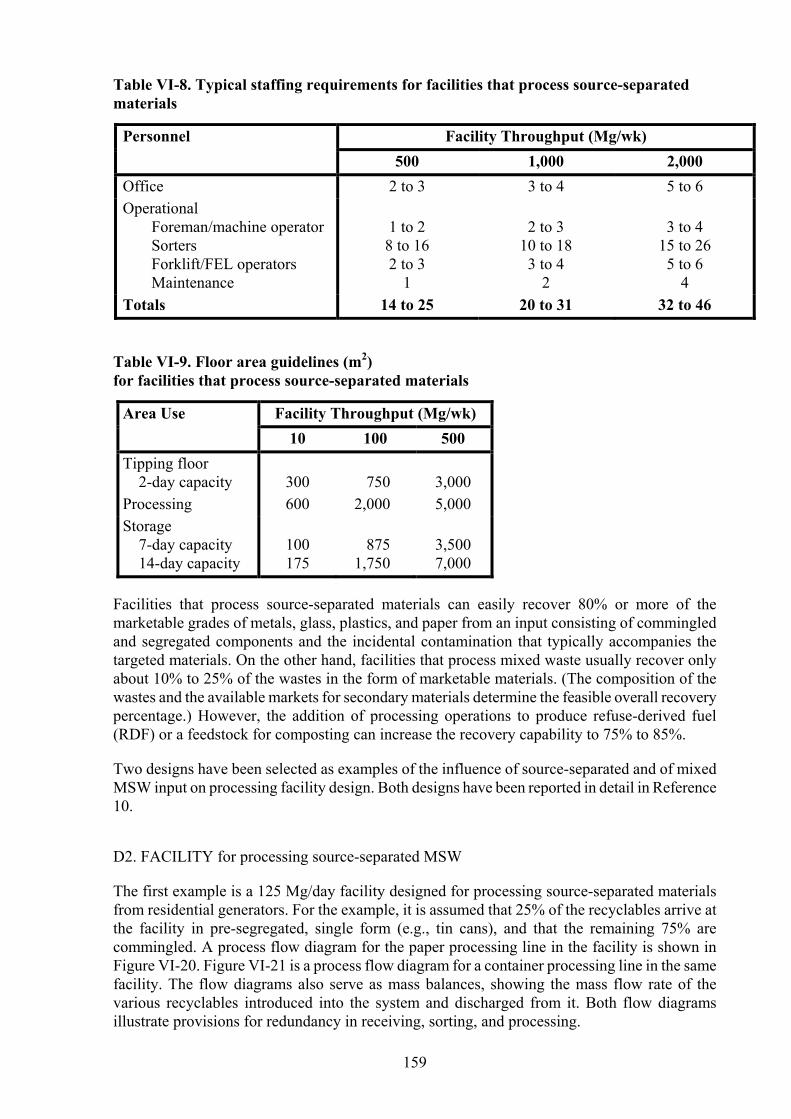
Table VI-8. Typical staffing requirements for facilities that process source-separated materials
Facility Throughput (Mg/wk) Personnel 500 1,000 2,000
Office 2 to 3 3 to 4 5 to 6 Operational Foreman/machine operator Sorters Forklift/FEL operators Maintenance
1 to 2 8 to 16 2 to 3
1
2 to 3
10 to 18 3 to 4
2
3 to 4
15 to 26 5 to 6
4 Totals 14 to 25 20 to 31 32 to 46
Table VI-9. Floor area guidelines (m2) for facilities that process source-separated materials
Facility Throughput (Mg/wk) Area Use 10 100 500
Tipping floor 2-day capacity
300
750
3,000
Processing 600 2,000 5,000 Storage 7-day capacity 14-day capacity
100 175
875
1,750
3,500 7,000
Facilities that process source-separated materials can easily recover 80% or more of the marketable grades of metals, glass, plastics, and paper from an input consisting of commingled and segregated components and the incidental contamination that typically accompanies the targeted materials. On the other hand, facilities that process mixed waste usually recover only about 10% to 25% of the wastes in the form of marketable materials. (The composition of the wastes and the available markets for secondary materials determine the feasible overall recovery percentage.) However, the addition of processing operations to produce refuse-derived fuel (RDF) or a feedstock for composting can increase the recovery capability to 75% to 85%.
Two designs have been selected as examples of the influence of source-separated and of mixed MSW input on processing facility design. Both designs have been reported in detail in Reference 10.
D2. FACILITY for processing source-separated MSW
The first example is a 125 Mg/day facility designed for processing source-separated materials from residential generators. For the example, it is assumed that 25% of the recyclables arrive at the facility in pre-segregated, single form (e.g., tin cans), and that the remaining 75% are commingled. A process flow diagram for the paper processing line in the facility is shown in Figure VI-20. Figure VI-21 is a process flow diagram for a container processing line in the same facility. The flow diagrams also serve as mass balances, showing the mass flow rate of the various recyclables introduced into the system and discharged from it. Both flow diagrams illustrate provisions for redundancy in receiving, sorting, and processing.
159

OCC
News
Magazines
Sorting Station
OCC MagazinesNews
OCC MagazinesNews
Sorting Station
Rejects
Rejects
7.3Rejects
From MixedPaper Collection
From SegregatedCollection
54.9
1.0
12.2
4.3
11.0
15.4
52.3
75% Commingled Collection25% Segregated Collection
CommingledPaper
Trailer
Baler
Trailer
a Design capacity = 75 Mg/day. Figure VI-20. Paper processing line at a source-separated processing facilitya
Fe and Bi-Metal (6.0)
SegregatedGlass (8.6)
Glass A/CSorting Station
SegregatedContainers
VibratoryScreen A/C
Sorting Station
Rej. PET HDPEAluminium
CommingledContainers (33.5)
MagSepMagSep
CanFlattener
Comm.ContainerComm.
ContainerMagSepMagSep
MagSepMagSep
VibratoryScreen Rej. Amb Flt MxdGrn
Rej. Amb Flt MxdGrnRej. Amb Flt MxdGrn
Sorting Station
Milk N/MGrn ClrGrn Clr
GlassCrushers
GlassCrushers
2.6
Granulator Densifier
0.1 0.3 .8 1.2Gaylords
Milk N/MMilk N/MGrn ClrPET HDPE
Aluminium (1.5)
Grn (2.6)
Amb (7.9)
Flt (15.6)
Mxd (6.5)
GlassProducts
Rejects (2.6)
29.1
75% Commingled Collection25% Segregated Collection
Tin (1.5)Alum. (0.4)HDPE (0.6)PET (0.1)
a Design capacity = 45 Mg/day. Figure VI-21. Container processing line at a source-separated processing facilitya
Breakage and contamination generally account for about 2% to 12% of the material introduced into such a system. Glass breakage during the collection process and during processing at the facility results in the loss of small particles of glass as residue. This residue is lost if a market for mixed coloured cullet cannot be found.
160
The level of contaminants must not exceed the limits allowable by the market agreements. Common contaminants involved in facilities designed to process paper and paper products include: 1) corrugated and magazines that have been intermingled with the residential newspaper prior to or during collection; and 2) low-grade paper (e.g., envelopes with “windows”) that has been mixed with commercial high-grade paper before or during collection.
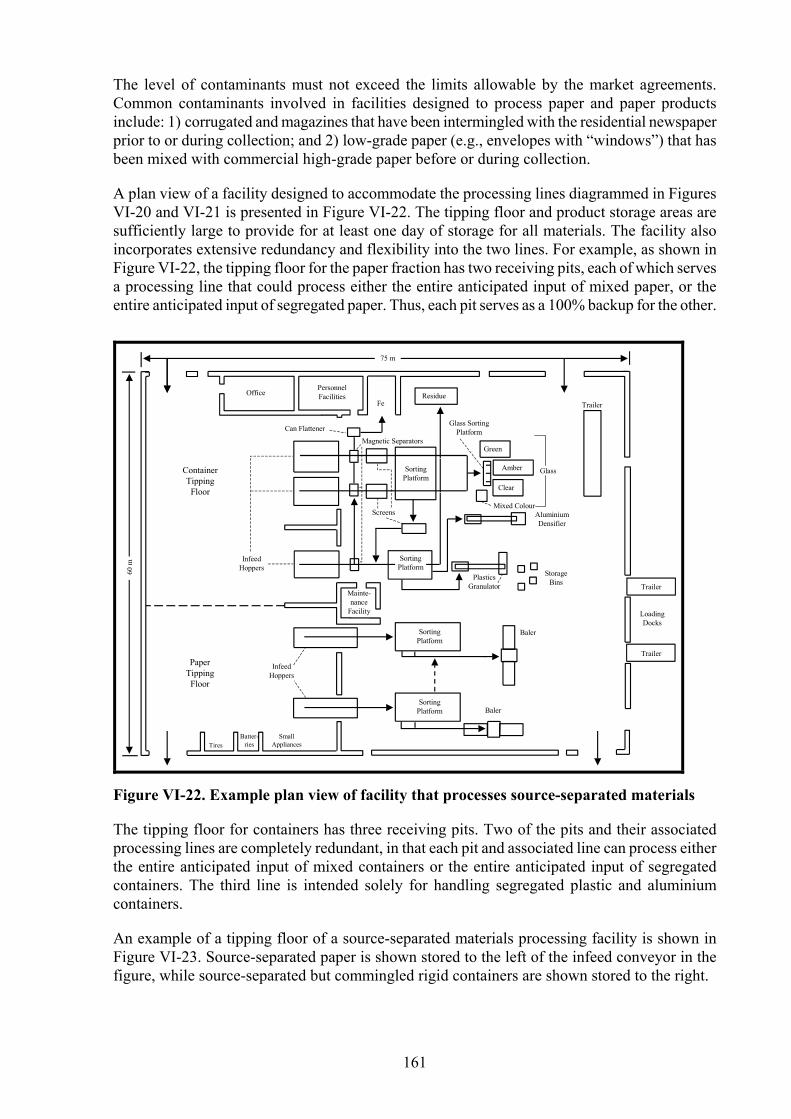
A plan view of a facility designed to accommodate the processing lines diagrammed in Figures VI-20 and VI-21 is presented in Figure VI-22. The tipping floor and product storage areas are sufficiently large to provide for at least one day of storage for all materials. The facility also incorporates extensive redundancy and flexibility into the two lines. For example, as shown in Figure VI-22, the tipping floor for the paper fraction has two receiving pits, each of which serves a processing line that could process either the entire anticipated input of mixed paper, or the entire anticipated input of segregated paper. Thus, each pit serves as a 100% backup for the other.
StorageBins
AluminiumDensifier
Green
Clear
Amber
ResidueFe
SortingPlatform
SortingPlatform
SortingPlatform
SortingPlatform
PlasticsGranulator
Baler
Baler
Tires
75 m
Trailer
ContainerTipping
Floor
PaperTippingFloor
OfficePersonnelFacilities
Can Flattener
InfeedHoppers
Screens
Magnetic Separators
Mainte-nance
Facility
InfeedHoppers
Batter-ries
SmallAppliances
Trailer
Trailer
LoadingDocks
Mixed Colour
Glass
Glass SortingPlatform
60 m
Figure VI-22. Example plan view of facility that processes source-separated materials
The tipping floor for containers has three receiving pits. Two of the pits and their associated processing lines are completely redundant, in that each pit and associated line can process either the entire anticipated input of mixed containers or the entire anticipated input of segregated containers. The third line is intended solely for handling segregated plastic and aluminium containers.
An example of a tipping floor of a source-separated materials processing facility is shown in Figure VI-23. Source-separated paper is shown stored to the left of the infeed conveyor in the figure, while source-separated but commingled rigid containers are shown stored to the right.
161
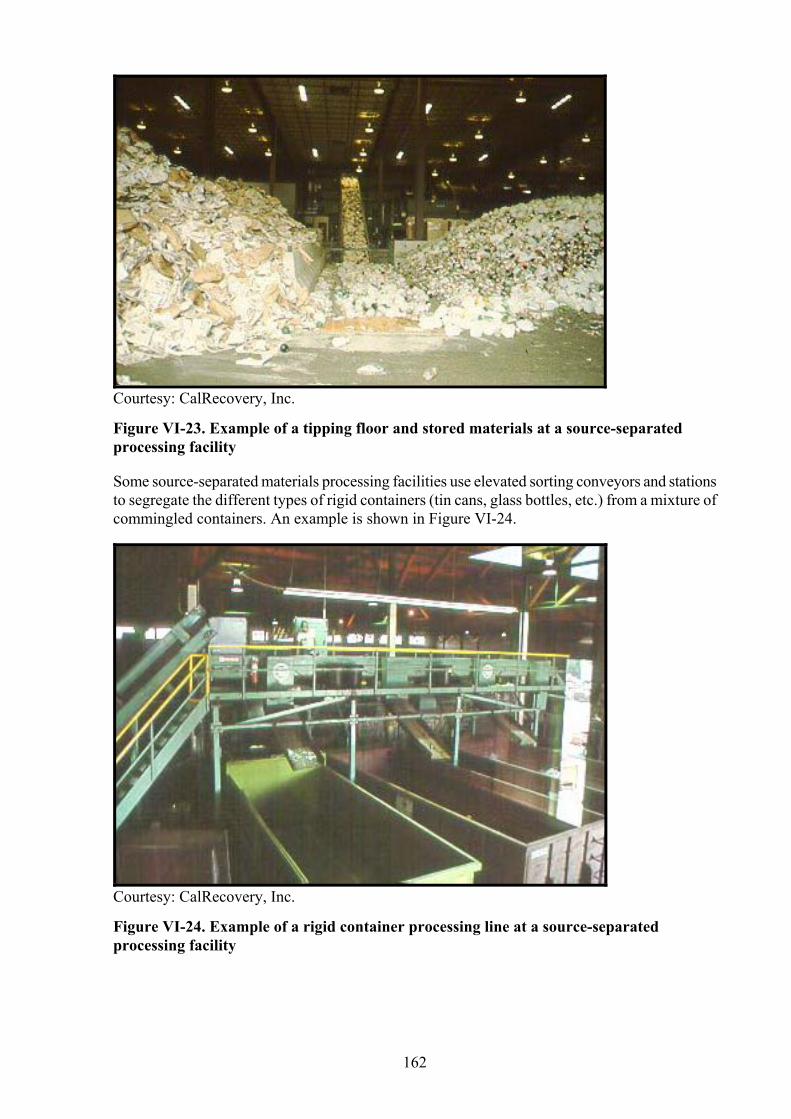
Courtesy: CalRecovery, Inc.
Figure VI-23. Example of a tipping floor and stored materials at a source-separated processing facility
Some source-separated materials processing facilities use elevated sorting conveyors and stations to segregate the different types of rigid containers (tin cans, glass bottles, etc.) from a mixture of commingled containers. An example is shown in Figure VI-24.
Courtesy: CalRecovery, Inc.
Figure VI-24. Example of a rigid container processing line at a source-separated processing facility
162
Presorted OCC and High Grades
Corrugated
Baler #1
Baler #2
ProcessibleWaste
Tipping Floor
Non-ProcessibleWaste
Trommel #1
Sort #1
Sort #2
Sort #3
Fe
Fe
Other Fe (1.4)
Rejects (41.4)
Paper
HD
PEPE
T
Alu
min
ium
Fine
New
sO
ther
(-) (+/-)
(+)
Fe Cans
Fe
MagSep #2Mag
Sep #2Mag
Sep #3Mag
Sep #3
MagSep #1Mag
Sep #1
BaledProducts
(5.8)
GlassRejects(0.4)
VehicleEgress
50
MixedWaste
DeliveriesCan
Process
Fe(1.0)
HD
PEPE
T
Perf
Figure VI-25. Example flow diagram for a mixed waste processing facility (Mg/hr)
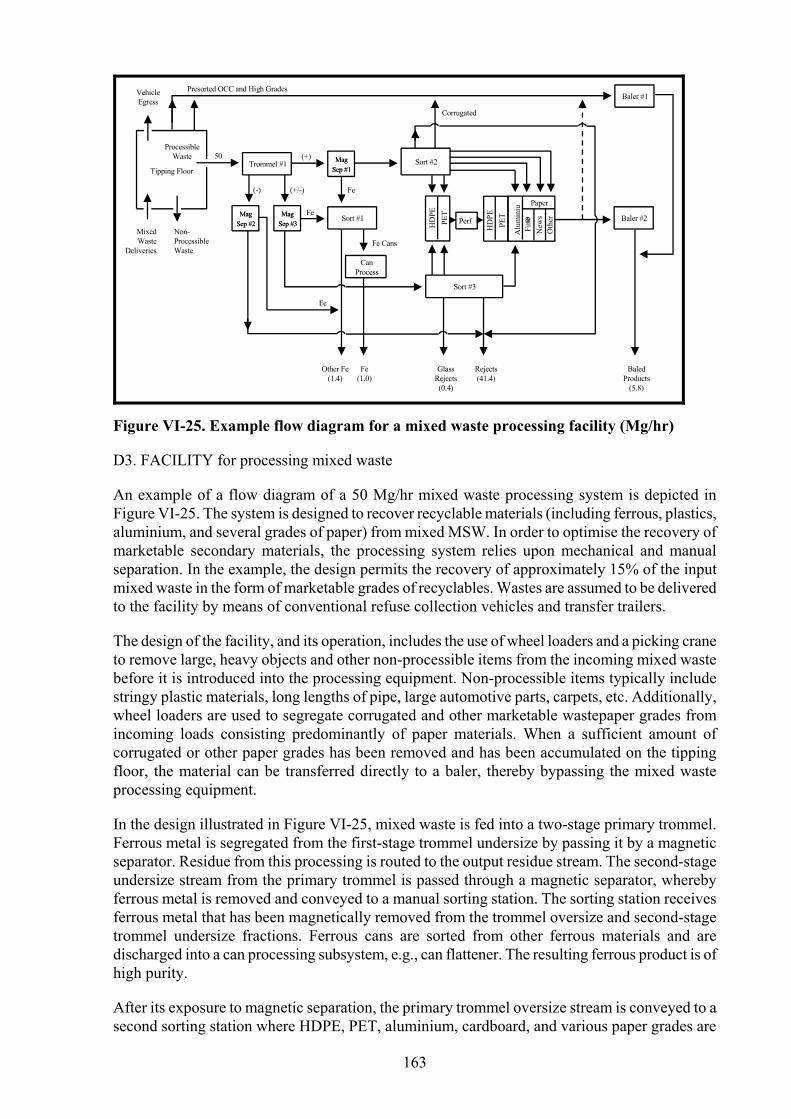
D3. FACILITY for processing mixed waste
An example of a flow diagram of a 50 Mg/hr mixed waste processing system is depicted in Figure VI-25. The system is designed to recover recyclable materials (including ferrous, plastics, aluminium, and several grades of paper) from mixed MSW. In order to optimise the recovery of marketable secondary materials, the processing system relies upon mechanical and manual separation. In the example, the design permits the recovery of approximately 15% of the input mixed waste in the form of marketable grades of recyclables. Wastes are assumed to be delivered to the facility by means of conventional refuse collection vehicles and transfer trailers.
The design of the facility, and its operation, includes the use of wheel loaders and a picking crane to remove large, heavy objects and other non-processible items from the incoming mixed waste before it is introduced into the processing equipment. Non-processible items typically include stringy plastic materials, long lengths of pipe, large automotive parts, carpets, etc. Additionally, wheel loaders are used to segregate corrugated and other marketable wastepaper grades from incoming loads consisting predominantly of paper materials. When a sufficient amount of corrugated or other paper grades has been removed and has been accumulated on the tipping floor, the material can be transferred directly to a baler, thereby bypassing the mixed waste processing equipment.
In the design illustrated in Figure VI-25, mixed waste is fed into a two-stage primary trommel. Ferrous metal is segregated from the first-stage trommel undersize by passing it by a magnetic separator. Residue from this processing is routed to the output residue stream. The second-stage undersize stream from the primary trommel is passed through a magnetic separator, whereby ferrous metal is removed and conveyed to a manual sorting station. The sorting station receives ferrous metal that has been magnetically removed from the trommel oversize and second-stage trommel undersize fractions. Ferrous cans are sorted from other ferrous materials and are discharged into a can processing subsystem, e.g., can flattener. The resulting ferrous product is of high purity.
After its exposure to magnetic separation, the primary trommel oversize stream is conveyed to a second sorting station where HDPE, PET, aluminium, cardboard, and various paper grades are
163
separated manually. The separated materials are baled using one of two balers. One of the balers is always available as a processing redundancy.
HDPE and PET containers, aluminium containers, and some high-grade paper are manually sorted at a third sorting station. This station receives undersize fraction from the second stage of the primary trommel subsequent to ferrous removal. Residue from the third sorting station is combined with the other residue streams, and the resultant stream exits the facility as process residue.
Manual sorting is relied upon as the last step to beneficiate plastics and aluminium because it is an effective means for recovering the various types of plastic and aluminium containers in pure forms. Also, in most economically developing countries, manual sorting provides an opportunity for employment development. While the use of mechanical and electro-mechanical systems for separating different types of plastics and aluminium materials has some commercial history, the technologies be too complex for most applications in developing countries.
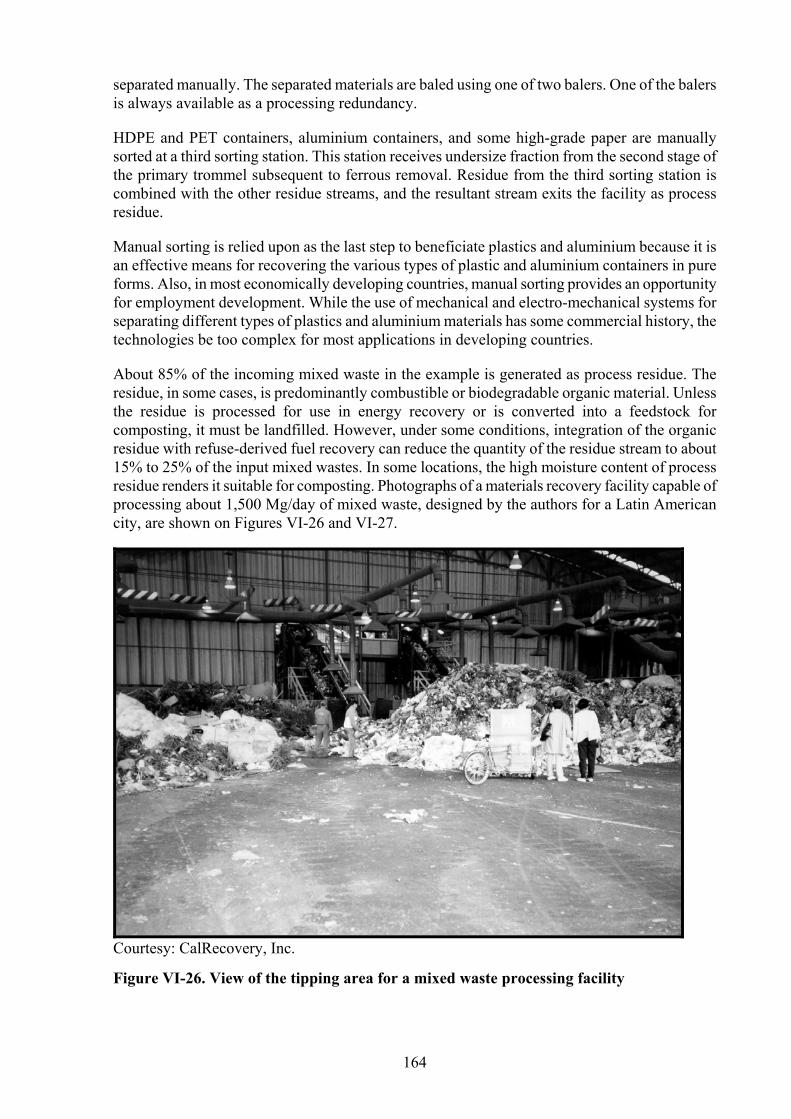
About 85% of the incoming mixed waste in the example is generated as process residue. The residue, in some cases, is predominantly combustible or biodegradable organic material. Unless the residue is processed for use in energy recovery or is converted into a feedstock for composting, it must be landfilled. However, under some conditions, integration of the organic residue with refuse-derived fuel recovery can reduce the quantity of the residue stream to about 15% to 25% of the input mixed wastes. In some locations, the high moisture content of process residue renders it suitable for composting. Photographs of a materials recovery facility capable of processing about 1,500 Mg/day of mixed waste, designed by the authors for a Latin American city, are shown on Figures VI-26 and VI-27.
Courtesy: CalRecovery, Inc.
Figure VI-26. View of the tipping area for a mixed waste processing facility
164
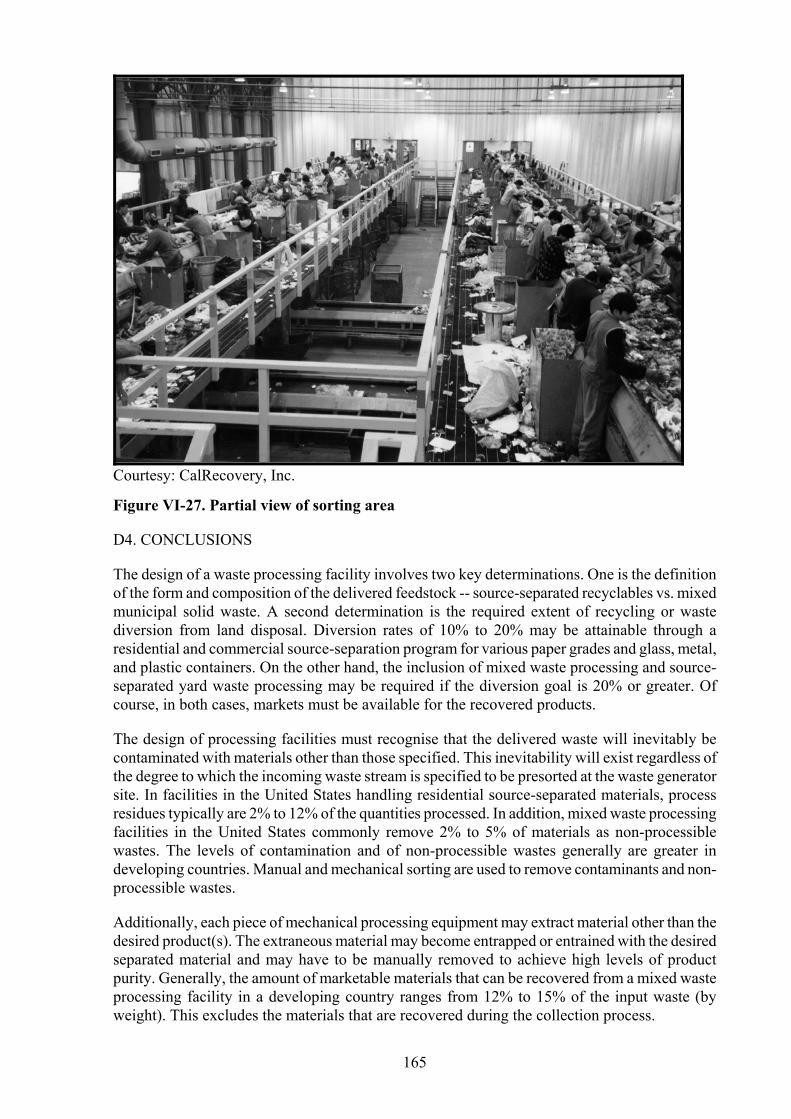
Courtesy: CalRecovery, Inc.
Figure VI-27. Partial view of sorting area
D4. CONCLUSIONS
The design of a waste processing facility involves two key determinations. One is the definition of the form and composition of the delivered feedstock -- source-separated recyclables vs. mixed municipal solid waste. A second determination is the required extent of recycling or waste diversion from land disposal. Diversion rates of 10% to 20% may be attainable through a residential and commercial source-separation program for various paper grades and glass, metal, and plastic containers. On the other hand, the inclusion of mixed waste processing and source-separated yard waste processing may be required if the diversion goal is 20% or greater. Of course, in both cases, markets must be available for the recovered products.
The design of processing facilities must recognise that the delivered waste will inevitably be contaminated with materials other than those specified. This inevitability will exist regardless of the degree to which the incoming waste stream is specified to be presorted at the waste generator site. In facilities in the United States handling residential source-separated materials, process residues typically are 2% to 12% of the quantities processed. In addition, mixed waste processing facilities in the United States commonly remove 2% to 5% of materials as non-processible wastes. The levels of contamination and of non-processible wastes generally are greater in developing countries. Manual and mechanical sorting are used to remove contaminants and non-processible wastes.
Additionally, each piece of mechanical processing equipment may extract material other than the desired product(s). The extraneous material may become entrapped or entrained with the desired separated material and may have to be manually removed to achieve high levels of product purity. Generally, the amount of marketable materials that can be recovered from a mixed waste processing facility in a developing country ranges from 12% to 15% of the input waste (by weight). This excludes the materials that are recovered during the collection process.
165
More detailed presentations on the design of processing facilities for source-separated materials and for mixed waste are given in References 18 and 1, respectively.
E. Yard waste and food waste processing
A waste processing facility can include an accommodation to receive and process segregated yard and food wastes. A discussion of these materials and their processing is presented here. Chapters VII, VIII, and IX present information that complements the following discussion.
E1. YARD waste
“Yard waste” is taken cumulatively to mean the variety of wastes of plant origin that are produced during the course of gardening, landscaping, and general maintenance of grounds. Sources of yard waste may be residential, commercial, institutional, and industrial sectors. Institutional sources include parks, public gardens, and landscaping (initiation and maintenance) of public properties. The composition and quantities of yard waste are influenced predominantly by geographical location, population density, and seasonality. Residential sources include single-family residences and multi-family units (e.g., apartments). Residential units in rural settings can be expected to generate more varied and larger amounts of yard waste than those in suburban areas -- and far more than those in densely populated urban cities. Volumes and types generated in institutional and commercial park settings are fairly similar. Not to be overlooked is kerbside landscaping, of which trees are major constituents.
Although the generation of yard waste may be relatively small in small municipalities in economically developing countries, the quantity of yard wastes generated in large metropolitan areas is substantial.
E1.1. Types of yard waste
The principal types of yard waste of concern in solid waste management are: 1) fallen leaves (especially from deciduous shrubs and trees); 2) discarded herbaceous plants or plant trimmings; 3) trimmings from large shrubs, ornamentals, and trees; and 4) grass clippings. These types of yard waste differ one from the other with respect to physical and chemical properties and to biodegradability. For example, the fallen leaves collected in autumn contain large concentrations of carbon and very little nitrogen. The structure and the carbon-to-nitrogen ratio of freshly discarded “green” herbaceous plants and their trimmings are conducive to rapid decomposition, whereas those of mature ones are not; for example, the higher lignin content of large tree branches compared to that of growing twigs. Approximate concentrations of nitrogen in some selected constituents of yard waste (grass clippings, leaves, and wood), along with those of some other organic materials for the purpose of reference, are listed in Table VI-10. The nitrogen content of yard waste depends upon the relative concentration of each of the types of yard waste present in it. The usual proportions of the components in the United States are such that the nitrogen content of yard waste is likely to be within the range of 1.5% to 2.0% [12]. These characteristics influence the ease and type of management of the yard wastes.
Ranges of concentrations of metals in plants and yard waste are presented in Table VI-11. Concentrations of metals, of microorganisms of public health significance, and of plant nutrients in composted yard waste produced at two particular sites are listed in Appendix A (in Tables in A-1, A-2, and A-3, respectively).
166
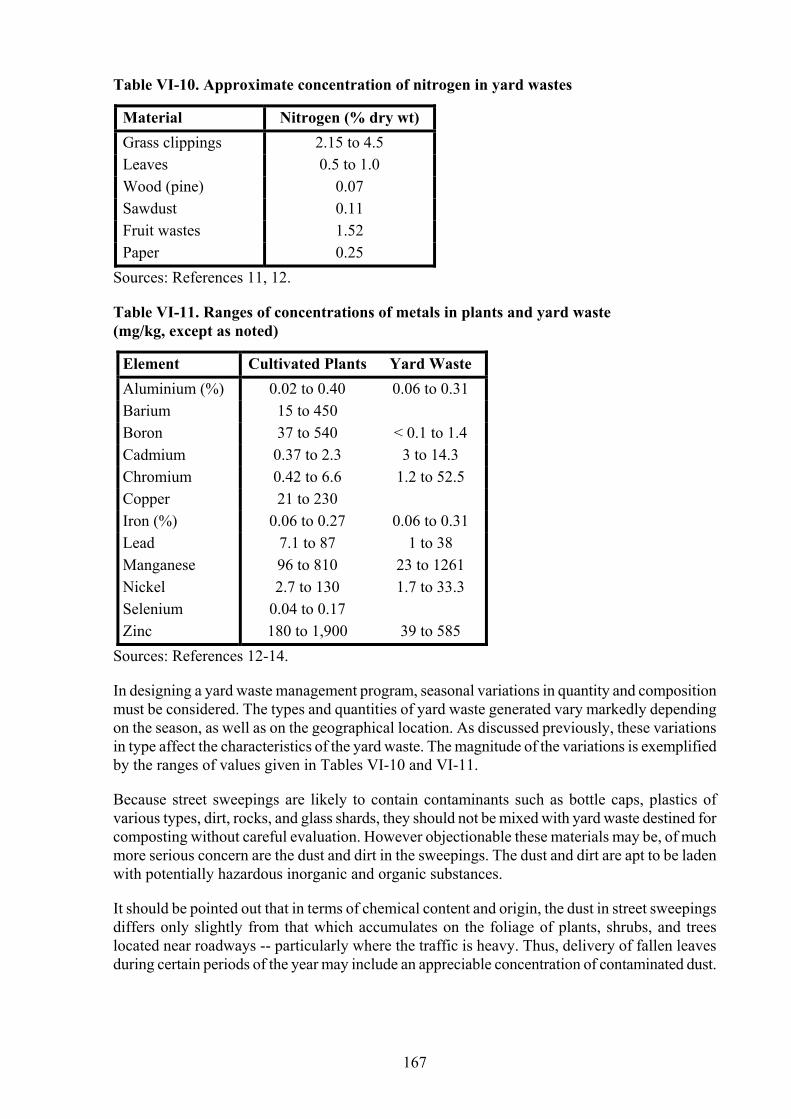
Table VI-10. Approximate concentration of nitrogen in yard wastes
Material Nitrogen (% dry wt) Grass clippings 2.15 to 4.5 Leaves 0.5 to 1.0 Wood (pine) 0.07 Sawdust 0.11 Fruit wastes 1.52 Paper 0.25
Sources: References 11, 12.
Table VI-11. Ranges of concentrations of metals in plants and yard waste (mg/kg, except as noted)
Element Cultivated Plants Yard Waste Aluminium (%) 0.02 to 0.40 0.06 to 0.31 Barium 15 to 450 Boron 37 to 540 < 0.1 to 1.4 Cadmium 0.37 to 2.3 3 to 14.3 Chromium 0.42 to 6.6 1.2 to 52.5 Copper 21 to 230 Iron (%) 0.06 to 0.27 0.06 to 0.31 Lead 7.1 to 87 1 to 38 Manganese 96 to 810 23 to 1261 Nickel 2.7 to 130 1.7 to 33.3 Selenium 0.04 to 0.17 Zinc 180 to 1,900 39 to 585
Sources: References 12-14.
In designing a yard waste management program, seasonal variations in quantity and composition must be considered. The types and quantities of yard waste generated vary markedly depending on the season, as well as on the geographical location. As discussed previously, these variations in type affect the characteristics of the yard waste. The magnitude of the variations is exemplified by the ranges of values given in Tables VI-10 and VI-11.
Because street sweepings are likely to contain contaminants such as bottle caps, plastics of various types, dirt, rocks, and glass shards, they should not be mixed with yard waste destined for composting without careful evaluation. However objectionable these materials may be, of much more serious concern are the dust and dirt in the sweepings. The dust and dirt are apt to be laden with potentially hazardous inorganic and organic substances.
It should be pointed out that in terms of chemical content and origin, the dust in street sweepings differs only slightly from that which accumulates on the foliage of plants, shrubs, and trees located near roadways -- particularly where the traffic is heavy. Thus, delivery of fallen leaves during certain periods of the year may include an appreciable concentration of contaminated dust.
167
E1.2. Processing of yard waste
Three principal alternatives are available for processing yard waste: 1) process all yard waste at a central facility; 2) process all yard wastes at their respective sites of generation (e.g., backyard composting); and 3) a combination of alternatives 1 and 2 (i.e., central facility plus backyard composting). The second alternative would eliminate collection of yard waste and would involve onsite use of the material.
E1.2.1. Backyard processing
Some drawbacks of backyard processing are relevant to developing countries. An obvious drawback is the physical impossibility of backyard processing in densely populated urban areas due to lack of available space. Another drawback is the need for education and training in the practice of backyard processing. A final drawback is the potential that backyard processing could degenerate into backyard “open dumping” and roadside littering.
In light of the drawbacks, one of the best approaches to managing yard waste on a large scale is to process yard waste at a central facility and to keep backyard processing as a strictly voluntary, but encouraged, undertaking on the part of the householder.
The processing of choice for the backyard situation is composting, although some debris can be spaded directly into the ground prior to planting -- usually in early spring or in late autumn. Principles and procedures for composting are described in detail in Chapter VIII.
With respect to composting of small quantities of yard waste, the minimum volume for satisfactory heat retention and, therefore, rapid decomposition is about 1 m3. Thus, the utility or even practicality of most of the pre-fabricated compost units presently on the market is debatable. The units seem to be too small to permit the self-insulation required for a significant accumulation and retention of heat. Preferably, but not necessarily, the compost bin should be constructed of a durable material. Wood, concrete, or cement blocks are suitable.
Inoculums, enzymes, and other exotic additives serve no useful purpose [16,17]. However, the addition of a waste rich in nitrogen or a chemical fertiliser to lower an excessively high C:N is useful in order to achieve relatively rapid decomposition.
E1.2.2. Central processing facility
Inasmuch as yard waste delivered to a central processing facility is likely to be of relatively large particle size and may be contaminated with dirt, rocks, bricks, and ferrous material, it often is subjected to the processing indicated by the flow diagram in Figure VI-28. Size reduction (shredding) renders the waste easier to handle, and brings the particle size distribution of the composted material within that prescribed by product specifications. The size-reduced material is then screened and exposed to magnetic separation (or vice versa) to remove materials that might interfere with certain uses of the product. For instance, if the woody fraction is to be used as a solid fuel, the dirt, glass, and ferrous contamination in the product should be minimised. Removal of glass and ferrous metals would be important if the processed waste is to be used as a compost feedstock. Equipment used in the processing (e.g., shredders, screens, and magnetic separators) has been described previously in this chapter.
Composting of yard waste processed for that purpose may be carried out at the site of the processing facility. The alternative is that the processed waste is transferred and composted at another site. The principles, methods, and technology of composting are described in Chapter VIII.
168
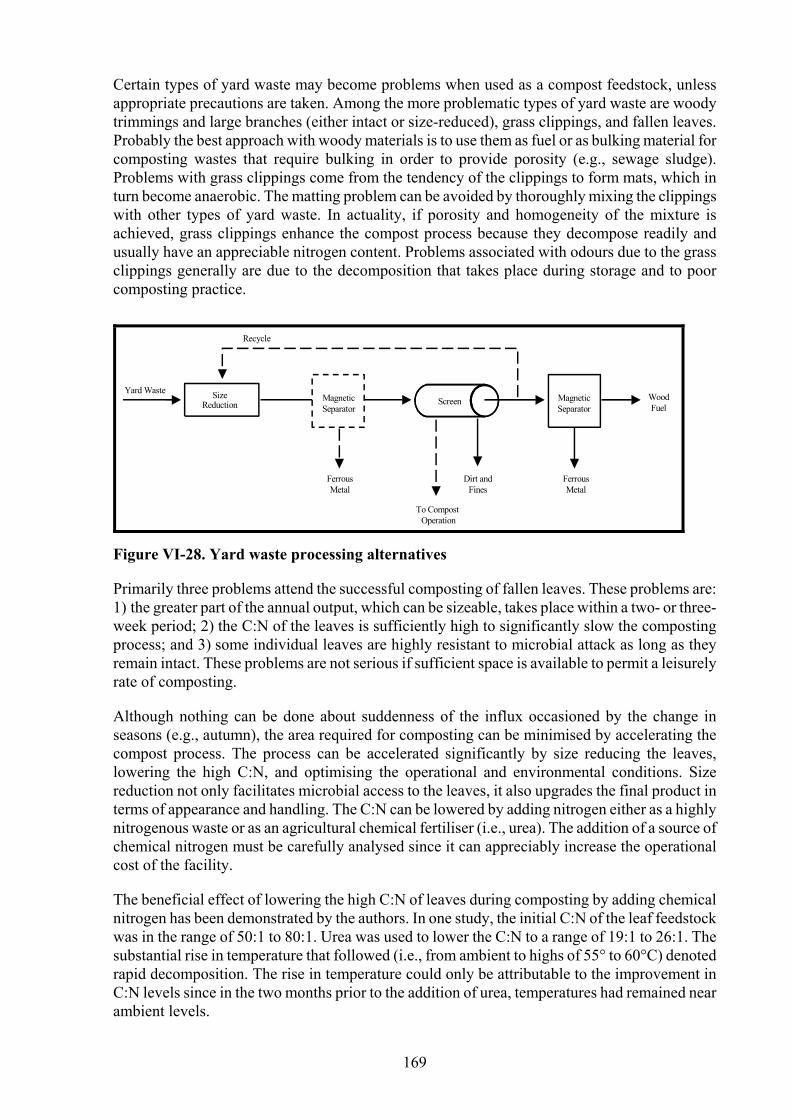
Certain types of yard waste may become problems when used as a compost feedstock, unless appropriate precautions are taken. Among the more problematic types of yard waste are woody trimmings and large branches (either intact or size-reduced), grass clippings, and fallen leaves. Probably the best approach with woody materials is to use them as fuel or as bulking material for composting wastes that require bulking in order to provide porosity (e.g., sewage sludge). Problems with grass clippings come from the tendency of the clippings to form mats, which in turn become anaerobic. The matting problem can be avoided by thoroughly mixing the clippings with other types of yard waste. In actuality, if porosity and homogeneity of the mixture is achieved, grass clippings enhance the compost process because they decompose readily and usually have an appreciable nitrogen content. Problems associated with odours due to the grass clippings generally are due to the decomposition that takes place during storage and to poor composting practice.
SizeReduction
MagneticSeparator
Screen MagneticSeparator
Yard Waste
FerrousMetal
To CompostOperation
Dirt and Fines
Wood Fuel
Recycle
FerrousMetal
Figure VI-28. Yard waste processing alternatives
Primarily three problems attend the successful composting of fallen leaves. These problems are: 1) the greater part of the annual output, which can be sizeable, takes place within a two- or three-week period; 2) the C:N of the leaves is sufficiently high to significantly slow the composting process; and 3) some individual leaves are highly resistant to microbial attack as long as they remain intact. These problems are not serious if sufficient space is available to permit a leisurely rate of composting.
Although nothing can be done about suddenness of the influx occasioned by the change in seasons (e.g., autumn), the area required for composting can be minimised by accelerating the compost process. The process can be accelerated significantly by size reducing the leaves, lowering the high C:N, and optimising the operational and environmental conditions. Size reduction not only facilitates microbial access to the leaves, it also upgrades the final product in terms of appearance and handling. The C:N can be lowered by adding nitrogen either as a highly nitrogenous waste or as an agricultural chemical fertiliser (i.e., urea). The addition of a source of chemical nitrogen must be carefully analysed since it can appreciably increase the operational cost of the facility.
The beneficial effect of lowering the high C:N of leaves during composting by adding chemical nitrogen has been demonstrated by the authors. In one study, the initial C:N of the leaf feedstock was in the range of 50:1 to 80:1. Urea was used to lower the C:N to a range of 19:1 to 26:1. The substantial rise in temperature that followed (i.e., from ambient to highs of 55° to 60°C) denoted rapid decomposition. The rise in temperature could only be attributable to the improvement in C:N levels since in the two months prior to the addition of urea, temperatures had remained near ambient levels.
169
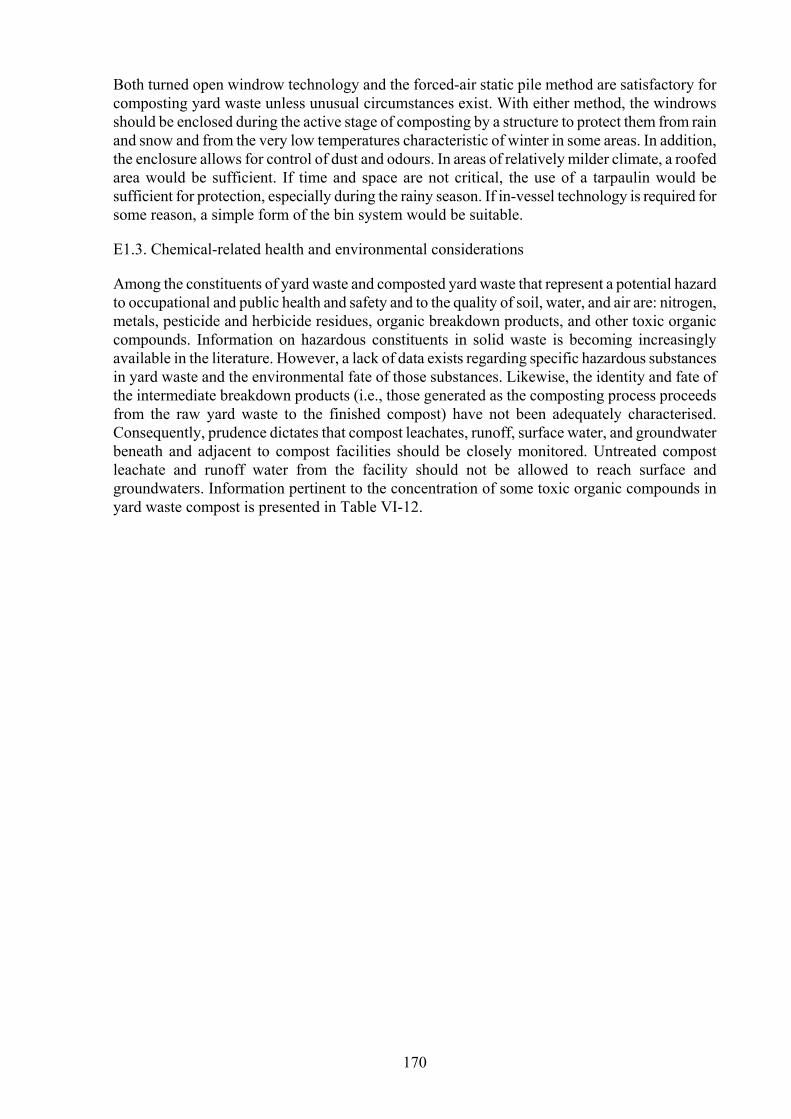
Both turned open windrow technology and the forced-air static pile method are satisfactory for composting yard waste unless unusual circumstances exist. With either method, the windrows should be enclosed during the active stage of composting by a structure to protect them from rain and snow and from the very low temperatures characteristic of winter in some areas. In addition, the enclosure allows for control of dust and odours. In areas of relatively milder climate, a roofed area would be sufficient. If time and space are not critical, the use of a tarpaulin would be sufficient for protection, especially during the rainy season. If in-vessel technology is required for some reason, a simple form of the bin system would be suitable.
E1.3. Chemical-related health and environmental considerations
Among the constituents of yard waste and composted yard waste that represent a potential hazard to occupational and public health and safety and to the quality of soil, water, and air are: nitrogen, metals, pesticide and herbicide residues, organic breakdown products, and other toxic organic compounds. Information on hazardous constituents in solid waste is becoming increasingly available in the literature. However, a lack of data exists regarding specific hazardous substances in yard waste and the environmental fate of those substances. Likewise, the identity and fate of the intermediate breakdown products (i.e., those generated as the composting process proceeds from the raw yard waste to the finished compost) have not been adequately characterised. Consequently, prudence dictates that compost leachates, runoff, surface water, and groundwater beneath and adjacent to compost facilities should be closely monitored. Untreated compost leachate and runoff water from the facility should not be allowed to reach surface and groundwaters. Information pertinent to the concentration of some toxic organic compounds in yard waste compost is presented in Table VI-12.
170

Table VI-12. Concentrations (ppm) of herbicides and pesticides in compost from yard waste
Herbicide/Pesticide a b Source 1 Source 2 Chlordane 0.324 0.152 p’p’DDE 0.014 0.005 p’p’DDT 0.019 0.008 o’p’DDT 0.004 NDc Toxaphene 0.300 0.300 Aldrin ND 0.007 Dieldrin ND 0.019 Dursban ND 0.039 Trifluralin present present Casoron present present Dalapon < 0.50 < 0.50 Dicamba 0.50 to 12.9 < 0.50 MCPD < 0.50 < 0.50 MCPA 0.5 to 7.1 < 0.50 to 2.4Dichloprop < 0.50 < 0.50 to 1.2Dinoseb < 0.50 to 1.0 < 0.50 to 1.0
Source: Reference 15. a Endrin, lindane, malathion, parathion, and diazinon
are not detected/below detection limit for both sources. b 2,4-D, silvex, 2,4,5-T, and 2,4-DB are < 0.50 for both sources. c ND = not detected/below detection limit.
E2. FOOD waste
The term “food waste” refers to the putrescible waste generated in the preparation and consumption of food and that remaining after consumption (i.e., “kitchen” and restaurant wastes); discarded comestibles (e.g., spoiled or partially eaten fruit, stale bakery goods, etc.); and vegetable trimmings generated in produce markets.
A relatively recent development in the United States and Western Europe is the expanding advocacy for composting a mixture of yard waste and food waste. The concept has much in its favour. Food waste decomposes readily and under proper conditions enhances the compostability of yard wastes, especially of shrub and tree trimmings and leaves by serving as a readily available microbial energy source and to a limited extent as a nitrogen source for the microbial populations.
The composting of yard waste and food waste is encumbered usually by the difficulty in reconciling the seasonal variations in yard waste production with the year-round uniformity of food waste production. The problem is less significant in tropical climates. Because of the difference in patterns of generation, yard waste can be in short supply during slack growing seasons (e.g., rainy season, late autumn and winter). However, the dearth of yard waste is a problem only if the composition of the food waste is such that a bulking agent would be needed, since yard waste can be an excellent bulking agent.
If mixed with food waste, yard waste would become a part of a mixture that would have the objectionable aesthetic, health, and environmental impacts usually associated with raw food
171
waste. Objectionable impacts usually associated with food waste are unsightliness and malodours. Objectionable health-related impacts include the attraction of flies of all types (e.g., common houseflies, fruit flies, “blowflies”) and rodents (particularly rats) to food waste. Food waste serves not only as a nutrient source but also provides shelter for pests.
E2.1. Storage and collection
The isolation of food waste from the environment during storage and collection must be as complete as possible in order to minimise health and environmental impacts. The high degree of isolation requires the use of enclosed, leak-proof containers for storage. Furthermore, since 90% to 95% of the weight of raw food waste is water, its density approaches that of water. Thus, the volumetric capacity of the storage container should not be larger than 40 to 50 L if it is to be handled manually. If the food waste is to be transported to a central facility, the transport vehicle must be designed to ensure complete containment of the food waste. Storage time at the site of generation and at the central facility should be as short as is feasible.
The storage and collection of yard waste should be separate from those of food waste in order to avoid the aforementioned problems with storage and collection of food waste. Mixing of the two wastes should not occur until immediately before processing.
E3. COMPOSTING of mixtures of yard and food wastes
E3.1. Methodology
The composting of a mixture of yard waste and food waste is almost identical to the general composting methodology described for backyard and central facility composting of yard waste. A principal difference is that the repercussions of operational shortcomings and lapses are more onerous in the composting of food/yard waste mixtures. Also, the precautionary measures that attend the composting of yard waste/food waste mixtures are more numerous and critical.
The difficulties associated with composting food wastes on a large scale are such that some municipalities have opted for first digesting the mixture anaerobically and then composting the digested solids.
E3.2. Backyard composting
The necessarily batch nature of residential backyard composting creates potential health and environmental problems because substantial time may elapse before sufficient waste is available to warrant operational procedures such as turning. Prior to the accumulation of sufficient material, diffusion of odours and access by pests can be minimised and perhaps prevented by covering the material with a tarpaulin underlain by a fine-mesh screen. The floor and sides of the composting bin should be constructed of “rat-proof” material (e.g., asphalt, concrete, or durable wire mesh). However, if the size of the wire mesh is too large, egress of insect and fly larvae from the bottom of the material will occur.
E3.3. Central composting facility
The problems associated with batch composting can be reduced by resorting to a modified continuous type of composting. With the windrow method of composting (turned or static), continuity is attained by adding material to one end of the windrow while, more or less simultaneously, removing an equivalent volume from the other end. In-vessel composting can be made continuous, although there is the potential of inadequate mixing and aeration of material.
172
Regardless of batch or continuous operations, both raw and composting material should be made inaccessible to flies and animals, especially rats.
E4. PRECAUTIONS
Storage facilities for the raw food waste and for the mixed yard waste/food waste feedstock must be well constructed and maintained. These criteria can best be attained by enclosing storage facilities and the active composting stage in a suitably designed structure.
Because of its putrescible characteristics, food waste (or mixtures containing them) must be properly managed so as to protect human health and safety and the environment. To minimise vector attraction, food wastes should be processed promptly, ideally on the same day that they are delivered to the processing site. Prompt processing minimises the risk of food waste undergoing anaerobiosis and, therefore, generating obnoxious odours. Good housekeeping within and about the processing facility also promotes an operation free of vectors, malodours, and litter.
F. Processing and recycling construction and demolition (C&D) debris
Economic activity and natural disasters generate residues, among which are solid wastes and wastewater. Construction and demolition debris (C&D) is one of the solid wastes. In terms of weight, C&D typically constitutes from 5% to 15% of the solid waste stream of industrialised nations. Among the many activities that generate major amounts of C&D are highway construction and urban development, expansion, and renewal. In the United States, concrete debris from highway construction and demolition account for 10% to 40% of C&D.
Available data on the quantities of C&D produced in developing countries are very limited. However, estimates conducted by the authors indicate that the quantities of C&D generated fluctuate between 0.05 and 1.0 kg/cap/day.
As is well known, the management and disposal of C&D are beset with numerous problems, most of which relate to handling, storage, transport, and disposition either by recycling or by final disposal. These problems are largely due to the nature of the wastes. A characteristic that frequently magnifies the problems is bulkiness. The bulk density of C&D is a function of that of its components. The bulk density of major components of C&D is indicated by the data listed in Table VI-13. Bulkiness and heaviness, along with resistance to compaction, seriously constrain the landfill option. High cost rules out particle size reduction (shredding, grinding) merely as a means of compensating for bulkiness. However, it is justified if it were a unit process in recycling. Disposal by incineration is impractical since the material is mostly inert.
Table VI-13. Selected C&D waste stream densities
Component kg/m3 Brick (whole) 715 to 1,795 Concrete 705 to 1,100 Metal, non-ferrous 540 Metal, steel 650 Wood 240
Sources: References 19, 20.
A seemingly obvious solution to disposal difficulties is to avoid them through recycling. Although C&D may be difficult to handle and to move, it potentially is rich in terms of
173
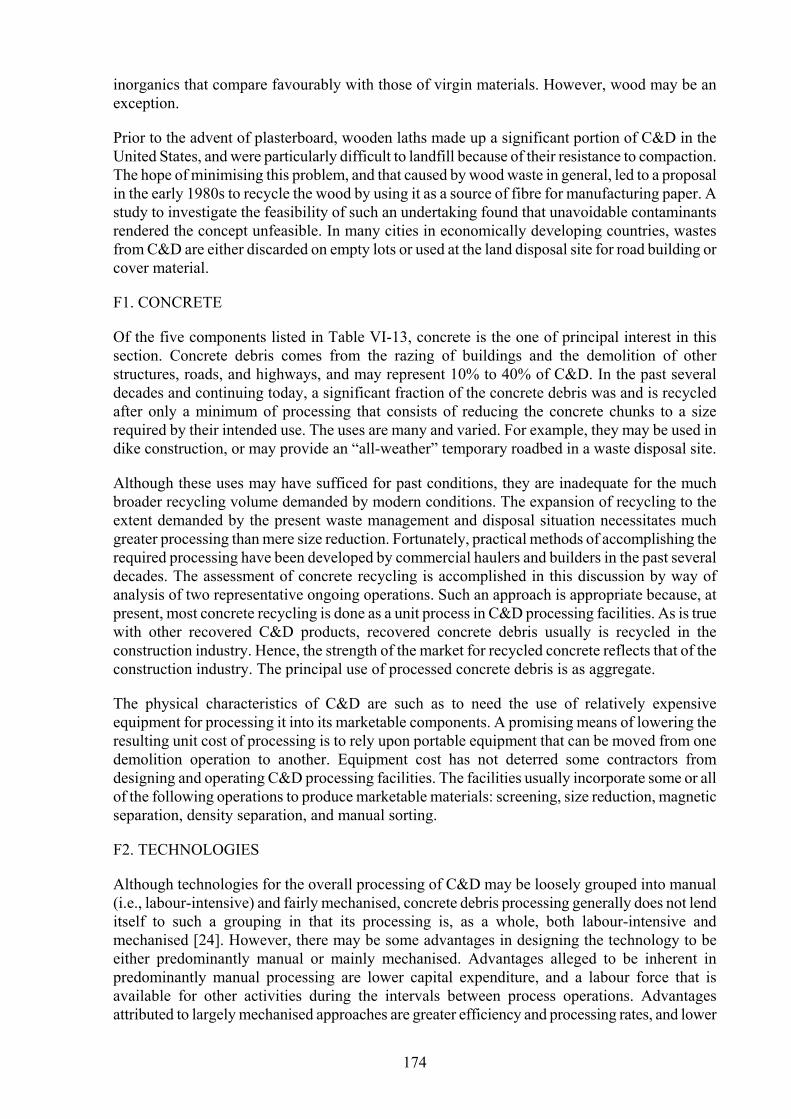
inorganics that compare favourably with those of virgin materials. However, wood may be an exception.
Prior to the advent of plasterboard, wooden laths made up a significant portion of C&D in the United States, and were particularly difficult to landfill because of their resistance to compaction. The hope of minimising this problem, and that caused by wood waste in general, led to a proposal in the early 1980s to recycle the wood by using it as a source of fibre for manufacturing paper. A study to investigate the feasibility of such an undertaking found that unavoidable contaminants rendered the concept unfeasible. In many cities in economically developing countries, wastes from C&D are either discarded on empty lots or used at the land disposal site for road building or cover material.
F1. CONCRETE
Of the five components listed in Table VI-13, concrete is the one of principal interest in this section. Concrete debris comes from the razing of buildings and the demolition of other structures, roads, and highways, and may represent 10% to 40% of C&D. In the past several decades and continuing today, a significant fraction of the concrete debris was and is recycled after only a minimum of processing that consists of reducing the concrete chunks to a size required by their intended use. The uses are many and varied. For example, they may be used in dike construction, or may provide an “all-weather” temporary roadbed in a waste disposal site.
Although these uses may have sufficed for past conditions, they are inadequate for the much broader recycling volume demanded by modern conditions. The expansion of recycling to the extent demanded by the present waste management and disposal situation necessitates much greater processing than mere size reduction. Fortunately, practical methods of accomplishing the required processing have been developed by commercial haulers and builders in the past several decades. The assessment of concrete recycling is accomplished in this discussion by way of analysis of two representative ongoing operations. Such an approach is appropriate because, at present, most concrete recycling is done as a unit process in C&D processing facilities. As is true with other recovered C&D products, recovered concrete debris usually is recycled in the construction industry. Hence, the strength of the market for recycled concrete reflects that of the construction industry. The principal use of processed concrete debris is as aggregate.
The physical characteristics of C&D are such as to need the use of relatively expensive equipment for processing it into its marketable components. A promising means of lowering the resulting unit cost of processing is to rely upon portable equipment that can be moved from one demolition operation to another. Equipment cost has not deterred some contractors from designing and operating C&D processing facilities. The facilities usually incorporate some or all of the following operations to produce marketable materials: screening, size reduction, magnetic separation, density separation, and manual sorting.
F2. TECHNOLOGIES
Although technologies for the overall processing of C&D may be loosely grouped into manual (i.e., labour-intensive) and fairly mechanised, concrete debris processing generally does not lend itself to such a grouping in that its processing is, as a whole, both labour-intensive and mechanised [24]. However, there may be some advantages in designing the technology to be either predominantly manual or mainly mechanised. Advantages alleged to be inherent in predominantly manual processing are lower capital expenditure, and a labour force that is available for other activities during the intervals between process operations. Advantages attributed to largely mechanised approaches are greater efficiency and processing rates, and lower
174
labour requirements. This attribute becomes meaningful only when labour either is scarce or expensive.
“Sorting” exemplifies the “dual nature” of concrete debris processing. Sorting is two-fold: 1) separation of concrete debris from other C&D, and 2) classification of the separated concrete debris. Separation from other debris usually is one of the demolition activities and, thereby, begins at the demolition site. At this point, segregation may be performed manually, mechanically, or both. The role of sorting in this stage is to retrieve recyclable materials. It is exemplified in the demolition of a building that has one or all of the following: concrete walls, floors (slabs), and columns. Steel and/or wire present in the structures is removed manually as the demolition progresses.
The other aspect of sorting is the separation and classification done in the processing sequence. This sorting usually is mechanised and largely consists of screening. The screening may be preceded by size reduction and be augmented by: 1) magnetic removal of ferrous material, and 2) flotation to separate wood and plastics. These processing operations may be performed onsite, with the use of portable equipment, or at a central facility.
Size reduction is one of the more important of the processing steps. It usually is carried out by a specially designed crushing machine (“shredder”) or by a grinder. Obviously, the machines must be rugged. Discharge from the machines is screened and further processed. As stated earlier, the discharge may serve as an aggregate for use in roadbed construction or may be further processed (refined) to the extent required for a particular use. A likely use would be for making concrete. Careful analyses of the concrete must be performed to ensure that it meets national standards.
F3. STATUS of concrete recycling
As was stated earlier, some retrieval of concrete debris always was a part of conventional C&D management and disposal. Nevertheless, it constituted only a minor part of the total effort. This minor role is rapidly being expanded in response to the changes that are taking place in the public attitude regarding waste management in all of its aspects. The upshot with regard to C&D management and disposal in general, and those of concrete debris in particular, is a growing number of processing and reclamation undertakings in industrialised countries.
In this section, we typify the state-of-the-art by describing two representative C&D processing operations. One of the two projects represents a situation in which both onsite processing and reuse or disposal are feasible. An example of such a situation is highway and overpass reconstruction following an earthquake. The second type of situation is one in which concrete processing is done at a central location -- often in conjunction with a materials recovery facility. These facilities are described for those locations in economically developing countries in which the particular situation may demand the processing and recycling of C&D.
F4. REPRESENTATIVE projects
F4.1. Example 1: Onsite processing and reuse/disposal
The first enterprise to be described is part of a development that considerably expanded the Yale University Science Park in Connecticut, United States. The Park is the home of the U.S. Repeating Arms Corporation (USRAC) Winchester Manufacturing facility. In order to make space for the new 46,500 m2 USRAC structure, a 60,400 m2 complex consisting of 12 contiguous buildings had to be demolished. The complex included 4- to 5-story structures, high-bay buildings, single-story residences, and part of a World War I munitions complex. An important feature of the demolition contract called for the filling of all sub-grade cavities in preparation for
175
the new building foundations. These cavities included utility tunnels, passageways, basements, and subbasements. A serious constraint on demolition strategy was the required elimination of the use of explosives. Therefore, the demolition had to be done entirely with use of mechanical (“wrecking ball”) and manual methods. The demolition was preceded, accompanied, and followed by establishment of remedial and preventive measures to keep the site from being classified as an inactive hazardous waste disposal site.
Materials collected in the demolition activity and the processing accorded them are listed in Table VI-14. As the table indicates, concrete was crushed onsite to form an aggregate. The aggregate was used as backfill. Use of the crushed concrete onsite eliminated significant transportation and disposal expenditures. Cost of disposing C&D in the state in 1990 was US$15 to US$20/m3. Equally important were the savings in landfill capacity. For many reasons, available landfill volume was and remains extremely scarce in Connecticut and adjoining states.
Onsite equipment included two to three hydraulic shears, grapples, hydraulic excavators, and a crane with a wrecking ball. Most equipment was mounted on caterpillar-tracked bodies.
An idea of the costs involved in demolition may be gained from the project unit costs listed in Table VI-15. According to the data listed in the table, the unit cost for demolition, exclusive of any return from sale of recovered product, was US$15/m3 in 1990. Cost for processing of the concrete was US$23/m3, exclusive of demolition cost. Without the benefit of recycling, the unit costs experienced in the project site demolition would have been more than double. Use of processed (crushed) concrete as backfill had a very favourable impact on unit costs in the project. This use was particularly advantageous inasmuch as no viable disposal alternative was available at the time.
F4.2. Example 2: Central processing
The second representative case is one in which concrete processing is conducted at a fixed or central site. In this case, concrete debris is brought to the site and the processed concrete is used offsite. The particular case described below is located on an active landfill and has been in operation for a number of years. Processing concrete and C&D is in two separate systems. The material flow through the concrete processing system is diagrammed in Figure VI-29. According to the figure, processing of concrete debris consists mainly in size reduction and screening. The product is used in road construction and other applications in which fill material is required.
The separate C&D processing system is diagrammed in Figure VI-30. Unlike the concrete system, the C&D system is designed to recover several types of materials from size-reduced debris. Among them are dirt, a planting mix, and a “hog” fuel. The key unit operations are size reduction, screening, and flotation.
176
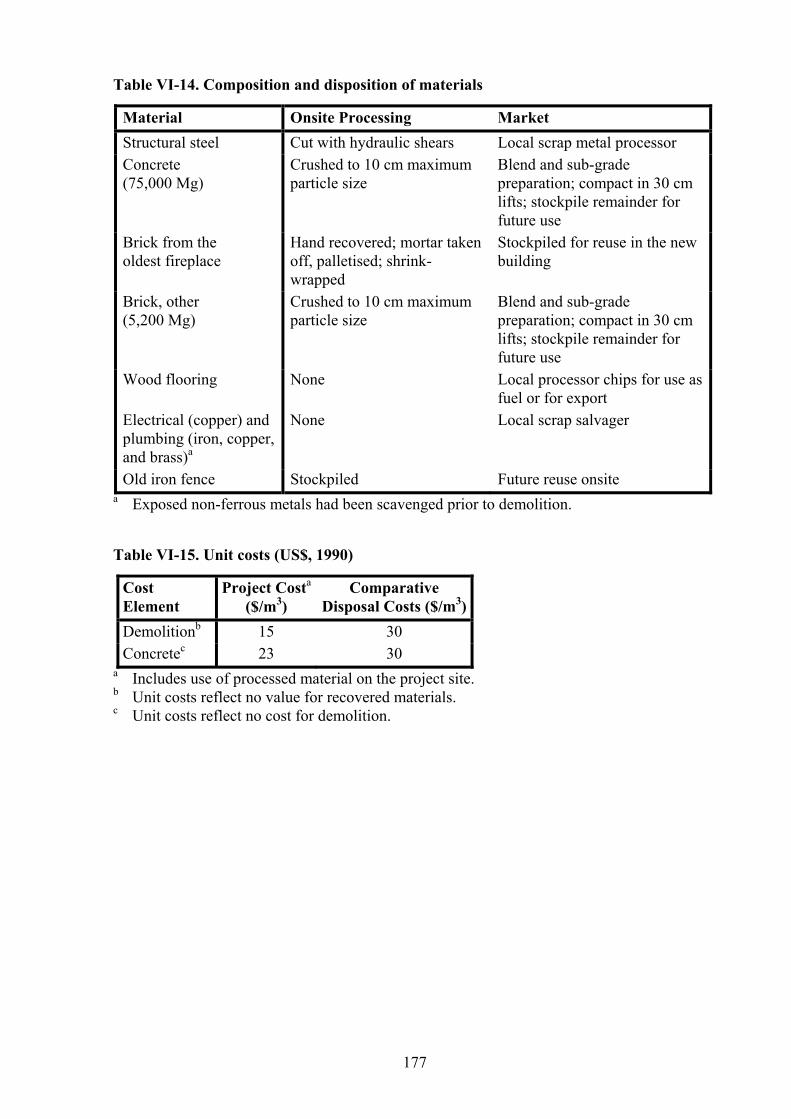
Table VI-14. Composition and disposition of materials
Material Onsite Processing Market Structural steel Cut with hydraulic shears Local scrap metal processor Concrete (75,000 Mg)
Crushed to 10 cm maximum particle size
Blend and sub-grade preparation; compact in 30 cm lifts; stockpile remainder for future use
Brick from the oldest fireplace
Hand recovered; mortar taken off, palletised; shrink-wrapped
Stockpiled for reuse in the new building
Brick, other (5,200 Mg)
Crushed to 10 cm maximum particle size
Blend and sub-grade preparation; compact in 30 cm lifts; stockpile remainder for future use
Wood flooring None Local processor chips for use as fuel or for export
Electrical (copper) and plumbing (iron, copper, and brass)a
None Local scrap salvager
Old iron fence Stockpiled Future reuse onsite a Exposed non-ferrous metals had been scavenged prior to demolition.
Table VI-15. Unit costs (US$, 1990)
Cost Element
Project Costa ($/m3)
Comparative Disposal Costs ($/m3)
Demolitionb 15 30 Concretec 23 30
a Includes use of processed material on the project site. b Unit costs reflect no value for recovered materials. c Unit costs reflect no cost for demolition.
177

Screen Screen
ConcreteDebris
Undersize
Fill Material Road Aggregate
Middling Fraction
Undersize
Oversize
Oversize
Oversize Recycle Loop
SizeReduction
CoarseScreen
Figure VI-29. Concrete recycling process system
2,000 m³/dayC&D Debris
Screen Float Tank
Air DryingTrommel
Floats
Sinks
Foundation Stone,Landfill Cover
Dirt
+7.6 cm
HogFuel
+0.64 cm
ShearShredder
-60 cm
-1.9 cm +1.9 cm,-7.6 cm
-0.64 cmPlanterMix
TubGrinder
Figure VI-30. Construction and demolition debris recycling process system
178

A variant of the preceding system is designed to recover secondary materials. It makes use of a bucket screen to classify size-reduced wastes on the basis of particle size. Oversize materials are manually sorted to recover cardboard, aluminium, foil, plastics, wood, and ferrous materials. Undersize discharge from the bucket screen is conveyed to succeeding screens and an assortment of manual and mechanical separations.
F5. SUMMARY and conclusions
1. Although the focus of this section is on concrete debris, it does include some discussion of C&D debris because concrete is a component of C&D debris. As is true with C&D debris, recycling leads to substantial savings in disposal costs. Contractors in industrialised countries are well aware of this fact and have become adept in developing effective procedures. This is well illustrated in the first example.
2. The first example exemplified the advantages of onsite processing with portable equipment in certain situations. In this case, processed concrete debris was used as backfill, for which there was a considerable need. As a result, substantial savings were realised in transport and disposal costs.
3. The second example demonstrates the feasibility of processing concrete debris with fixed equipment at a central facility in conjunction with a MRF. With this combination of concrete processing and MRF operation, it was possible to recover a wide range of usable products.
4. Onsite vs. central processing: The advantages of onsite processing are more apparent with C&D processing than with concrete debris processing. Costly transport of raw and processed wastes is minimised with onsite processing. The advantages are emphasised when the processed product is used onsite, as was true in the first example.
5. Mechanically-intensive vs. labour-intensive: The qualification “intensive” is used because all but the smallest reuses of concrete debris entail crushing (size reduction) as a first step, followed by screening. Perhaps a more meaningful comparison would be one between manual vs. automated in terms of equipment control. Manual control requires constant supervision in processing concrete debris because of the greater demands imposed by the nature of the material.
6. If for no other reason than its potential in reducing disposal costs, processing concrete debris will always be one of the activities that characterises construction and demolition. Furthermore, this basic reason is being increasingly reinforced by the expansion of the number of useful products of processing.
7. The applicability of mechanised C&D processing and recovery in most developing countries is still debatable. The concepts, however, can be applied in several of the large metropolitan areas. A large amount of manual segregation of C&D debris takes place in most urban areas in economically developing countries. The recovered materials are either reused or recycled.
8. While the examples in this section placed emphasis on concrete segregation and recycling, C&D wastes also usually include high concentrations of asphalt and wood waste. Both of these materials also can be segregated at the source or at central processing facilities, as is the case with concrete wastes. Recovered asphalt can be reused in asphalt mixtures to construct roadways, and wood waste can be used as fuel or as bulking agent for composting.
179
G. References
1. Diaz, L.F., G.M. Savage, and C.G. Golueke, Resource Recovery from Municipal Solid Wastes: Vol. I, Primary Processing, CRC Press, Inc., Boca Raton, Florida, USA, 1982.
2. Savage, G.M., J.C. Glaub, and L.F. Diaz, Unit Operations Models for Solid Waste Processing, Noyes Publications, Park Ridge, New Jersey, USA, 1986.
3. Savage, G.M., D.J. Lafrenz, D.B Jones, and J.C. Glaub, Engineering Design Manual for Solid Waste Size Reduction Equipment, prepared by CalRecovery Inc. for U.S. Environmental Protection Agency, Report No. EPA-600/S8-82-028, 1982.
4. Hasselriis, F., Refuse-Derived Fuel Processing, Butterworth Publishers, 1984.
5. Vesilind, P.A. and A.E. Rimer, Unit Operations in Resource Recovery Engineering, Prentice-Hall, Inc., Engelwood Cliffs, New Jersey, USA, 1981.
6. Robinson, W.D., “Shredding Systems for Mixed Municipal and Industrial Waste”, Proceedings of the American Society of Mechanical Engineers Conference, 1976.
7. CalRecovery, Inc., Trommel Screen Research & Development for Applications in Resource Recovery, prepared for U.S. Department of Energy, October 1981.
8. The Solid Waste Handbook, ed. W.D. Robinson, John Wiley & Sons, New York, USA, 1986.
9. Savage, G.M. and L.F. Diaz, “Processing of Solid Waste for Material Recovery”, presented at American Society of Mechanical Engineers 14th National Waste Processing Conference, Long Beach, California, USA, June 1990.
10. Savage, G.M., “Design of Materials Recovery Facilities (MRFs)”, Proceedings of the First U.S. Conference on Municipal Solid Waste Management -- Solutions for the 90s, Vol. II, sponsored by U.S. Environmental Protection Agency, Washington, DC, USA, June 1990.
11. Sills, M.J. and R.N. Carrow, “Turfgrass Growth, N Use, and Water Use under Soil Compaction and N Fertilization”, Agronomy J., 75:488-492, 1984.
12. Rosen, C.J., N. Schumacher, R. Mugas, and S. Proudfoot, Composting and Mulching: A Guide to Managing Yard Waste, Minnesota Extension Service, AG-FO-3296, pp. 7, 1982.
13. Epstein, E. and P.L. Engel, “Compost Products and Their Uses”, Solid Waste & Power, 5(4):44-53, August 1991.
14. Brownlo, A.H., Geochemistry, Prentice-Hall, Engelwood Cliffs, New Jersey, USA, pp. 498, 1979.
15. CalRecovery, Inc., Portland Area Compost Market Study, Final Report No. 1189-3, prepared for Metropolitan Service District, Portland, Oregon, USA, October 1988.
16. Solbraa, K., “An Analysis of Compost Starters Used on Spruce Bark”, BioCycle, 25(2):46-47, March 1984.
17. Golueke, C.G. and L.F. Diaz, “’Starters’ -- Inoculums and Enzymes”, presented at BioCycle West Coast Conference ‘89, March 1989, BioCycle, 30(4):53-57, April 1989.
180
18. CalRecovery, Inc. and PEER Consultants, Material Recovery Facilities for Municipal Solid Waste, EPA 625/6-91/031, prepared for U.S. Environmental Protection Agency, Office of Research and Development, Washington, DC, USA, September 1991.
19. Lund, H., The McGraw-Hill Recycling Handbook, New York, New York, USA, 1993.
20. CalRecovery, Inc., Conversion Factors for Individual Material Types, prepared for California Integrated Waste Management Board, Sacramento, California, USA, December 1991.
21. Mancini, I.M. and S. Masi, “Influence of Mechanical Pretreatment on MSW Disposal in Integrated Systems”, SARDINIA 99 Seventh Waste Management and Landfill Symposium Proceedings, Vol. I, Landfill Processes and Waste Pre-Treatment, Cagliari, Sardinia, Italy, pp. 361-269, October 1999.
22. Heyer, K.-U., K. Hupe, and R. Stegmann, “Mechanical Biological Pretreatment and Energetic Recovery of RDF Fractions in Germany: Processing and Costs”, SARDINIA 99 Seventh Waste Management and Landfill Symposium Proceedings, Vol. I, Landfill Processes and Waste Pre-Treatment, Cagliari, Sardinia, Italy, pp. 455-464, October 1999.
23. Biala, J. and W. Muller, “Bio-Mechanical Waste Treatment as Part of an Integrated Waste Management Strategy and a Means of Meeting UK and EU Waste Reduction Targets”, SARDINIA 2001 Eighth International Waste Management and Landfill Symposium Proceedings, Vol. I, The Sustainable Landfill, Cagliari, Sardinia, Italy, pp. 399-408, October 2001.
24. Diaz L.F. and G.M. Savage, “Current Practices and Future Development of Construction and Demolition Waste Management - The International Perspective”, proceedings of International Seminar on Environmental Issues in the Construction Industry, Hong Kong, September 1998.
181
