past and current water composition of surface waters in latvia mĀris kĻaviŅŠ, ilga kokorĪte,...
TRANSCRIPT

Past and current water Past and current water
composition of surface composition of surface
waters in Latviawaters in Latvia
MĀRIS KĻAVIŅŠ, ILGA KOKORĪTE, MĀRIS KĻAVIŅŠ, ILGA KOKORĪTE,
VALERY RODINOVVALERY RODINOV
University of LatviaUniversity of Latvia

Chemical composition of surface Chemical composition of surface waters of Latviawaters of Latvia
0,001
0,01
0,1
1
10
100
1000
N-N
O2-
PO43-
Ptot
N-N
H4+
N-N
O3- K+
pH
Na+
Mg2
+
Cl-
CO
D
SO
42-
Ca2
+
Col
our
HCO
3-
Min
eral
KO
NCEN
TRĀ
CIJ
A,
mg/
l
mean
max
min

Piper diagram of surface waters of LatviaPiper diagram of surface waters of Latvia

Long term changes of surface watersLong term changes of surface waters
0
4
8
12
16
20
1976
1979
1982
1985
1988
1991
1994
1997
2000
Mg2
+,
mg/
l
0
0,04
0,08
0,12
0,16
0,2
1977
1980
1983
1986
1989
1992
1995
1998
P-PO
43-,
mg/
l

Changes of COD and water Changes of COD and water colorcolor A
0
20
40
60
80
100
1976 1979 1982 1985 1988 1991 1994 1997 2000
CO
D,
mg/
L
B
0
40
80
120
160
200
1976 1979 1982 1985 1988 1991 1994 1997 2000
Col
or,
0Pt
/Co

Trends of water composition Trends of water composition changes accordingly to changes accordingly to (1977.-(1977.-
2001.) MANN-KENDAL2001.) MANN-KENDALLL testtest
River COD N-NH4+ N-NO3
- P-PO43- HCO3
- SO42- Cl- Ca2+ Mg2+ Na+
Daugava -0,212 -2,797 1,230 2,226 1,897 2,883 0,016 1,848 3,555 -1,821Aiviekste -1,284 -2,117 -0,269 1,239 2,324 -0,452 -2,172 0,491 2,341 -3,000Gauja -0,466 -3,582 -2,931 -2,713 2,256 -2,151 -4,168 0,143 1,566 -3,571Lielupe -2,207 -4,097 -1,830 -2,717 2,657 0,163 -2,254 0,409 1,662 -2,297Venta -2,441 -2,684 -1,114 0,807 2,527 -1,672 -1,878 -0,091 3,211 -2,440Salaca -1,328 -2,262 -2,153 2,021 1,189 2,135 -2,072 1,323 2,485 -2,400
Increasing concentrationsIncreasing concentrations, p<0,05, p<0,05
Decreasing concentrationsDecreasing concentrations, p<0,05, p<0,05

Factors influencing water composition?
• Changes in human loading
• Changes in landuse
• Climate change

Changes of human loading
0
100
200
300
400
500
1990 1992 1994 1996 1998 2000
Us
e o
f fe
rtil
ize
rs,
Th
ou
s.
ton
s
0
20
40
60
80
100
GD
P %
fertilizers, Th.tons GDP (1990=100%)

Impact of landuse un concentrations of Impact of landuse un concentrations of nutrientsnutrients
r=0.670
20
40
60
80
0 0.5 1 1.5 2 2.5N- NO3
- , mg/ l
agri
cult
ural
land
, %
r=- 0.470
20
40
60
80
0 0.5 1 1.5 2 2.5N- NO3
- , mg/ l
fore
sts,
%
r=0.170
20
40
60
80
0 0.01 0.02 0.03 0.04 0.05P- PO4
3-, mg/ l
agri
cult
ural
lan
d,
%
r=- 0,250
20
40
60
80
0 0.01 0.02 0.03 0.04 0.05
P- PO43- , mg/ l
fore
sts,
%
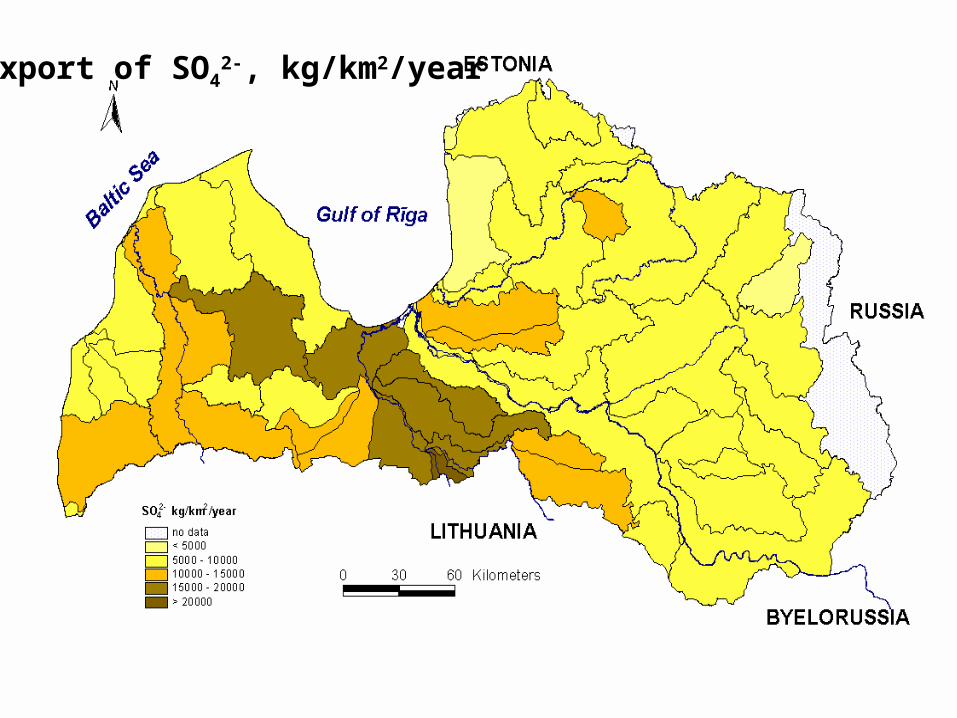
Export of SO42-, kg/km2/year

Export of nitrates kg/km2/year
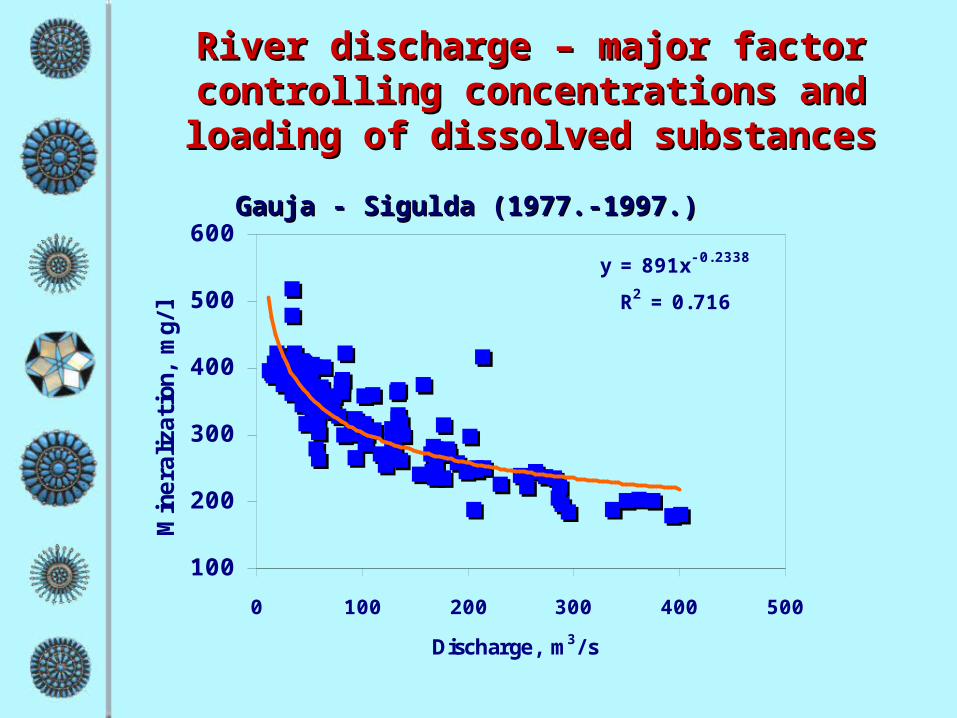
River discharge – major factor River discharge – major factor controlling concentrations and controlling concentrations and
loading of dissolved substancesloading of dissolved substances
Gauja - Sigulda (1977.-1997.)Gauja - Sigulda (1977.-1997.)
y = 891x- 0.2338
R2 = 0.716
100
200
300
400
500
600
0 100 200 300 400 500
Discharge, m3/ s
Min
eral
izat
ion,
mg/
l

River discharge – major factor River discharge – major factor controlling concentrations and loading controlling concentrations and loading
of dissolved substancesof dissolved substancesy = 0,8523Ln(x) - 1,8725
R2 = 0,38
0
2
4
6
8
0 100 200 300 400 500
N-N
O3-,
mg/
l
y = 0,0113Ln(x) - 0,0199
R2 = 0,183
0
0,03
0,06
0,09
0,12
0,15
0 100 200 300 400 500
P-PO
43-,
mg/
l

Changes of temperature and precipitation for the Meteorological
Station Rīga-University
0
1
2
3
4
5
6
7
8
9
1018
51
1861
1871
1881
1891
1901
1911
1921
1931
1941
1951
1961
1971
1981
1991 Year
Tem
pera
ture
, oC
300
400
500
600
700
800
900
1000
1100
Pre
cipi
tati
on, m
m
Temperature,oC Precipitation,mm

Long term changes of river ice regime
-20
0
20
40
60
80
100
120
14019
21
1927
1933
1939
1945
1951
1957
1963
1969
1975
1981
1987
1993
1999
Ice
bre
ak u
p d
ata
from
01
Jan
.
Lielupe-Mežotne Salaca-Lagaste Pededze-Litene

Long term changes of river Long term changes of river dischargedischarge
110
100
1000
1881
1890
1899
1908
1921
1930
1939
1948
1957
1966
1975
1984
1993
Cau
rplū
dum
s, m
3/s
Daugava
Venta
Salaca
Dubna
10 per. Mov.Avg. (Daugava)10 per. Mov.Avg. (Venta)10 per. Mov.Avg. (Salaca)10 per. Mov.Avg. (Dubna)

Major large scale atmospheric circulation processes

Long term changes of large scale atmospheric circulation processes
0%
20%
40%
60%
80%
100%19
00
1905
1910
1915
1920
1925
1930
1935
1940
1945
1950
1955
1960
1965
1970
1975
1980
1985
1990
1995
2000
ACI-E ACI-W ACI-C

Deviation of large scale atmospheric circulation processes
-1,4
-1,2
-1,0
-0,8
-0,6
-0,4
-0,2
0,0
0,2
0,4
0,6
1900 1910 1920 1930 1940 1950 1960 1970 1980 1990 2000 2010
-2
-1
0
1
2
3
4
ACI-(W+E) ACI-C
)1(K )1(K

Long term change of mean annual discharge
of the rivers in Baltic region and precipitations.
0
100
200
300
400
500
600
700
800
900
1896 1908 1920 1932 1944 1956 1968 1980 1992 2004
Dis
char
ge, m
3/s
; Pre
cipi
tati
ons,
mm
20
40
60
80
100
120
140
Dic
shar
ge, m
3/s
4
2
1
3
5
1 – precipitation (Station Rīga-University); 2 - Nemunas River; 3 - Daugava River; 4 – Narva River; 5 – Parnu River. Data were smoothed with a 6-year moving average.

Changes of Venta and Pärnu discharges and index of NAO
data were smoothed with a 10-year moving average
0
20
40
60
80
100
120
140
1896 1908 1920 1932 1944 1956 1968 1980 1992 2004
Dis
char
ge, m
3/s
-1,50
-1,00
-0,50
0,00
0,50
1,00
1,50
NA
O in
dex
NAO
Venta
Parnu

Long term changes of water runoff and inorganic ion export
Venta River, Kuldīga
0
0.5
1
1.5
2
2.5
3
1947-1
955
1956-1
965
1966-1
975
1976-1
982
1983-1
991
1992-1
999
Wat
er r
unof
f, km
3 /yea
r
0
200
400
600
800
HC
O3- , 1
03 t/ye
ar
Venta River, Kuldīga
0
0.51
1.5
22.5
3
1947-1
955
1956-1
965
1966-1
975
1976-1
982
1983-1
991
1992-1
999
Wat
er r
unof
f, km
3 /yea
r
0
10
20
30
40
50
Cl- , 1
03 t/
year

Factors influencing aquatic chemistry are diverse and they
should be considered at the development of monitoring
programs

Thank you!