patterns and determinants of fruit and vegetable …
TRANSCRIPT

i
PATTERNS AND DETERMINANTS OF FRUIT AND VEGETABLE
CONSUMPTION IN URBAN AND RURAL AREAS OF ENUGU STATE,
NIGERIA.
BY
AGWU, NNANNA MBA
B.AGRIC.TECH (FUTO); M.Sc (NIGERIA)
PG/Ph.D/02/33667
DEPARTMENT OF AGRICULTURAL ECONOMICS,
UNIVERSITY OF NIGERIA, NSUKKA.
NOVEMBER, 2011.

i
PATTERNS AND DETERMINANTS OF FRUIT AND VEGETABLE
CONSUMPTION IN URBAN AND RURAL AREAS OF ENUGU STATE,
NIGERIA
A THESIS
SUBMITTED TO THE DEPARTMENT OF AGRICULTURAL
ECONOMICS, UNIVERSITY OF NIGERIA, NSUKKA,
IN FULFILMENT FOR THE AWARD OF DOCTOR OF PHILOSOPHY
DEGREE IN AGRICULTURAL ECONOMICS
(AGRICULTURAL MARKETING AND AGRIBUSINESS OPTION)
BY
AGWU, NNANNA MBA
B.AGRIC.TECH (FUTO); M.Sc (NIGERIA)
PG/Ph.D/02/33667
NOVEMBER, 2011.

ii
CERTIFICATION
Agwu, Nnanna Mba, a post graduate student in the Department of
Agricultural Economics and with registration number PG/Ph.D/02/33667,
has satisfactorily completed his thesis for the award of the degree of
Doctor of Philosophy (Ph.D) in Agricultural Economics (Agricultural
Marketing and Agribusiness) option. The work embodied in this thesis is
original and has not been submitted in part or full for any Diploma or
Degree of this University or any other University.
PROF.S.A.N.D.CHIDEBELU ………………………
(Supervisor) DATE
PROF.C.J.ARENE ………………………
(Supervisor) DATE
…………………….
PROF.E.C.OKORJI DATE
(Head of Department)
EXTERNAL EXAMINER …………………...
DATE

iii
DEDICATION
This work is dedicated to the memories of Late Chiefs Kalu Agwu and
Fidelis Mba Agwu.

iv
ACKNOWLEDGEMENT
I wish to express my most exalted and unreserved gratitude to the ALMIHTY
GOD for his mercies and grace upon my life. My father in heaven, you have
really manifested these in my life. My special thanks go to my wonderful
supervisors, Profs S.A.N.D. Chidebelu and C.J. Arene for their efforts and
contributions in this work. Even at odd periods, you were there to assist. My
present Head of Department, Prof. E.C. Okorji and all my lecturers in the
Department of Agricultural Economics, University of Nigeria, Nsukka -Profs.
E.C. Nwagbo, N.J. Nwaeze, E.C. Eboh, C. U. Okoye, Dr.(Mrs.) A.I.
Achike,Drs.A.A.Enete,B.C.Okpukpara,N.A.Chukwuone,F.U.Agbo,Mr.P.B.I.Nj
epoume,Ms E.C. Amaechina, Nwajesus, Mrs. Opata, Mrs. Ike, etc. I also
express my thanks to HRH Prof. Dr. Emea .O. Arua and Family and HRH Prof.
E.U.L. Imaga and family, Chief T.K. Uduma and family, Mr. Amadi Arua and
family. To my mother, Mrs. Glory .U. Agwu (Mma Glory), my younger ones
Mrs. Chinyere Ofurum and husband Rev. Ogechi Ofurum, Rev. Uchenna,
Nneka, Ngozi, and Chukwuma, I pour my gratitude to you. I will not forget to
acknowledge my Dean at the College of Agribusiness and Financial
Management, Michael Okpara University of Agriculture, Umudike, Prof. J.A.
Mbanasor, the HOD, P.N. Mbadiwe (Executive Daddy), my friends and
colleagues, Drs. C.I. Ezeh, J.U. Ihendinihu, Joseph Onwumere, Philip Nto, Alex
Osuala, Dr (Mrs.) M.E. Njoku, C.E. Nwadighioha, C. E. P. Nzeh, Messers Ray

v
Obasi, H.U. Onyendi, Robert Anuforo, C.O. Odunze J.A. Nwichi, Pastor C.S.
Alamba, A.O. Abba, Mrs. J.A. Mmesirionye, the administrative staff in
CABFM, MOUAU -Mrs. Nnorom-Emecheta (College Officer), Mrs. Nnenna
Chikwendu, Mrs. Moses, Mrs. Egeolu, Mr. Pascal. I. Chukwuba, Mr. Victor,
Madam Eucheria, Miss Ejimole Ube, Dr. B.C. Okoye (NRCRI, Umudike),
Pastor Ifeanyi, Durable Okoye and especially to Dr. Ifeanyi .N. Nwachukwu,
you deserve more than a thank you. To my lovely wife Mrs. Ifeoma Vanessa
Agwu, who will always remind me that I am almost there and to little Master
Gideon Chizaram Kalu Agwu who came into this world at the time this work
was being packaged, you are welcome. I love you.
Finally, I state clearly that all errors of omission or commission found in this
work are entirely mine. None of such errors should be attributed to any of the
persons acknowledged therein.
Thank you all and may the good LORD continue to bless you.
Nnanna .M. Agwu

vi
ABSTRACT
The main objective of this study was to evaluate the patterns and determinants
of fruit and vegetable consumption in urban and rural areas of Enugu State,
Nigeria. The study was articulated based on the fact that despite the relatively
cheap and abundant sources of micro nutrients found in fruits and vegetables,
there abound wide spread cases of micro nutrient deficiencies. The data was
collected from primary sources through a set of questionnaire administered to
240 respondents. The study employed both purposive and random sampling
technique in the selection of the respondents. The data collected were analysed
using descriptive statistics, Working –Leser functional form of regression and z-
test statistic. Citrus, mango, plantain/banana, pineapples, papaya, star apple
were the major types of fruits consumed, while, telferia, tomatoes, onions,
garden eggs, okra and oha were the major vegetables consumed by the
households. The result also showed that the average monthly consumption of
fruit per household during the dry season was 17.8kg and 9.8kg for urban and
rural areas, respectively while the average monthly consumption per household
of fruits during the rainy season was 15.32kg and 12.87kg for urban and rural
areas, respectively. It was 8.68kg for urban and 23.29kg for rural areas for
vegetables during the dry season while it was 6.98kg for urban areas and
28.43kg for rural areas per monthly per household during the rainy season. The
average budget share was 0.0849 for vegetables for households in the urban
areas and 0.0690 for those in the rural areas. When pooled together; it was
0.0828 for fruits and 0.0769 for vegetables. Household’s monthly expenditure,
number of adult females, age of household head, educational attainment of the
household head, price, season and sex were determinants of fruit consumption
in the urban areas. Total monthly expenditure, number of children, number of
adult females, age of household head, educational attainment of household head
and sex were determinants of vegetable consumption in the urban areas. In the
rural areas, number of children, age of the household head, educational
attainment of the household head, price of fruits and season were determinants
of fruits consumption, whereas, total expenditure, number of adult males,
number of adult females, age of household head, educational attainment of the
household head and price of vegetables were determinants of vegetable
consumption. All these variables were significant at various levels of
probability ranging from one to ten percent with different signs. Income
elasticities were below one; ranging from 0.47 to 0.70. The income elasticity for
fruit in urban areas was 0.60 and 0.47 in the rural areas. It was 0.60 for
vegetables in the urban areas and 0.49 in the rural areas. It is therefore
recommended that there is need to put in place policies to promote and support
fruit and vegetable consumption. Secondly, attention should focus on the
processing of fruits and vegetables into forms that can be stored. This will

vii
reduce post – harvest losses as well as making fruits and vegetables available in
all the seasons. Again, education and behaviour change programmes to promote
fruit and vegetable consumption should be mounted. Fruit and vegetable
production should be encouraged particularly in the rural areas. In the same
vein, feeder roads should be built and already built ones maintained. This will
help transport these produce to the urban areas. This will also promote
availability and affordability of these products.

viii
TABLE OF CONTENTS
Title.. .. .. .. .. .. .. .. .. .. .. .. i
Certification.. .. .. .. .. .. . .. .. .. ii
Dedication.. .. .. . .. .. .. .. .. .. .. iii
Acknowledgement.. .. .. .. .. .. .. .. .. iv
Abstract.. .. .. . .. .. .. .. .. .. .. vi
Table of Contents.. .. .. .. .. .. .. .. .. .. ix
List of Tables.. .. .. .. .. .. .. .. .. .. x
CHAPTER ONE: INTRODUCTION.. .. .. .. .. .. 1
1.1 Background Information. .. .. .. .. .. .. .. 1
1.2 Problem Statement... .. .. .. .. .. .. .. 4
1.3 Objectives of the Study... .. .. .. .. .. .. .. 6
1.4 Hypotheses... .. .. .. .. .. .. .. .. 7
1.5 Justification... .. .. .. .. .. .. .. .. 7
1.6 Limitations of the Study.. .. .. .. .. .. .. .. 9
CHAPTER TWO: REVIEW OF RELATED LITERATURE.. .. 10
2.1.1 The Meaning of Fruits and vegetables.. .. .. .. .. .. .. 12
2.1.2 Importance of Vegetables.. .. .. .. .. .. .. .. .. .. .. .. .. 13
2.1.3 Importance of Fruits.. .. .. .. .. .. .. .. .. .. .. .. 15
2.1.4 Demand and Consumption Theory.. .. .. .. .. .. .. .. .. 18
2.1.5 Household Fruit and Vegetable Consumption Pattern.. .. .. .. 20
2.1.6 Expenditure Elasticity of Food.. .. .. .. .. .. .. .. .. 22
2.1.7 Household Budget Share.. .. .. .. .. .. .. .. .. .. 25
2.1.8 Household Income.. .. .. .. .. .. .. .. .. .. .. 28
2.1.9 Market Supply for Fruits and Vegetables .. .. .. .. .. 31
2.2.0 Prices and Availability of Fruits and Vegetables.. .. .. .. .. 36
2.2.1 Consumer Preferences.. .. .. .. .. .. .. .. .. .. .. .. 38
2.2.2 Costs and Feasibility of On-Farm Production.. .. .. .. .. .. .. 41
2.2.3 Intra household Decision –Making Process.. .. .. .. .. .. .. 43
2.2.4 Theoretical and Conceptual Framework.. .. .. .. .. .. .. .. .. .. 44
2.2.5 Analytical Framework ... .. .. .. .. .. .. .. .. .. .. .. .. .. ..48
CHAPTER THREE: METHODOLOGY... .. .. .. .. .. 50
3.1 Study Area... .. .. .. .. .. .. .. .. 51
3.2 Sampling Procedure... .. .. .. .. .. .. .. 53
3.3 Data Collection... .. .. .. .. .. .. .. .. 53
3.4 Data Analysis... .. .. .. .. .. .. .. .. 53
3.5 Model Specification... .. .. .. .. .. .. . 54
CHAPTER FOUR: RESULTS AND DISCUSSIONS.. .. .. .. 57
4.1 Households Socio-economic Characteristics... .. .. .. 57
4.2 Types and Quantities of Fruits and Vegetables Consumed

ix
by the Households.. .. .. .. .. .. .. .. 59
4.3 Consumption Patterns in Urban and Rural Households... .. .. 61
4.4 Paired Sample Test of the Differences between the consumption of
Fruits and Vegetables in Urban and Rural areas of Enugu State.. . 62
4.5 Budget Shares of Fruits and Vegetables in Urban and Rural
Households... .. .. .. . .. .. .. .. 63
4.6 Determinants of Fruits and Vegetables Consumption among
Urban and Rural Households in Enugu State... .. .. .. 64
4.7 Demand Elasticities for Fruits and Vegetables in Enugu State.. .. 75
CHAPTER FIVE: SUMMARY, CONCLUSION AND
RECOMMENDATION... .. .. .. .. .. 78
5.1 Summary... .. .. .. .. .. .. .. .. .. 78
5.2 Conclusion... .. .. .. .. .. .. .. .. 80
5.3 Recommendation... .. .. . .. .. .. .. 80
REFERENCES ... .. . .. .. .. .. .. .. 82

x
LIST OF TABLES
Table 4.1: Socio-Economic Characteristics of the Urban Respondents. 58
Table 4.2: Socio-Economic Characteristics of the Rural Respondents .. 59
Table 4.3: Types and Quantities of Fruit and Vegetable Consumption.. .
among the Respondents .. .. .. .. .. .. .. .. ...60
Table 4.4: Consumption Patterns of Fruits and Vegetables in Urban and
Rural Areas of Enugu State… .. .. .. .. .. .. .. .. .. .. 61
Table 4.5:Paired Sample Test of between the consumption of Fruits
and Vegetables in Urban and the Differences Rural areas of
Enugu State. .. … .. .. .. .. .. .. .. .. .. .. .. .. .. .. .. . 63
Table 4.6: Estimated Budget share of Fruits and Vegetables among
Households in Urban and Rural Areas. .. .. .. .. .. .. .. 64
Table 4.7: Estimates of the Determinants of Fruits Consumption among
Urban Households in Enugu State. .. .. .. .. .. .. .. .. . 69
Table 4.8: Determinants of Vegetables Consumption among Urban Households
in Enugu State. .. .. .. .. .. .. .. .. .. .. .. .. .. 70
Table 4.9: Determinants of Fruits Consumption among Rural Households
in Enugu State. .. .. .. .. .. .. .. .. .. .. .. .. .. 74
Table 4.10: Determinants of Vegetables Consumption among Rural
Households in Enugu State. .. .. .. .. .. .. .. .. .. . 75
Table 4.11: Expenditure (income) Elasticities for Fruits and Vegetables. .. 77
LIST OF FIGURES
Figure 1: Conceptual framework of determinants of fruit and vegetable
Consumption. .. .. … …. ….. ……. ……….. ……… ……… …47
Figure 2: Map of Enugu state of Nigeria. .. … .. . …. ….. ….. ……. ........ 55
1
CHAPTER ONE
1.0 INTRODUCTION
1.1 Background Information
Low fruit and vegetable intake is the main contributor of micronutrient
deficiencies in the developing world especially in population with low intake of
animal protein foods such as meat and dairy products. World Health
Organization (WHO) (2003) estimated that low intake of fruits and vegetables
caused about 19% gastro- intestinal cancers, about 31% of ischemic heart
disease and 11% of stroke. Of the global burden attributable to low fruit and
vegetable consumption, about 85% was from Cardiovascular Diseases (CVD)
and 15% from cancers. It estimated that about 2.7 million deaths were recorded
yearly arising from these chronic diseases.
The implication of the emerging scenario is that 2.7 million lives could be saved
each year with sufficient global fruit and vegetable consumption. According to
the WHO/FAO (2003), the set population nutrient goals and recommended
intake was put at a minimum of 400g for fruits and vegetables per day for the
prevention of chronic heart diseases, cancer, diabetes and obesity. The report
also stated that there was convincing evidence that fruits and vegetables
decreased the risk of obesity and evidence abound also that they probably
decreased the risk of diabetes. Furthermore, there is convincing evidence that
fruits and vegetables lower the risk of CVD.
2
Micro-nutrient deficiency resulting from low fruit and vegetable intake has been
associated with various economic consequences. This is exemplified in a study
in Ethiopia, (Croppenstedt and Muller, 2000). The result showed that nutritional
status affected agricultural productivity and elasticities of labour productivity.
Thus proving that there is a significant link between health and nutritional status
and agricultural productivity.
However, in spite of this growing body of evidence highlighting the protective
effects of fruits and vegetables, their intakes are still grossly inadequate both in
developed and developing countries (IARC, 2003).
Analyses of family budgets suggest that the poorer the family, the greater is the
proportion of the total expenditure on food thus obeying Engel’s law (Blissard
et al, 2003). Engel's Law states that as income rises, percentage of income spent
on consumption rises slower as compared to rise in income. According to
(Blissard et al, 2003), many analyses of family budgets conclude that the
proportions of income devoted to various groups of commodities not only
change with increasing income as stated in Engel’s law but also vary
systematically.
Fruits and vegetables have been known to exhibit substantial heterogeneity with
regard to demand, supply and trade characteristics (Damianos and Demoussis,
1992). On the demand characteristics, most fruits and vegetables exhibit higher
income elasticities than that for overall food consumption. This implies that as

3
income rises, the share of fruits and vegetables within the food budget also
rises. The overall demand for fruits and vegetables are income elastic despite
the relatively high share of fruits and vegetables in the food budget.
Fruit and vegetable production are characterized by a strong seasonal
dimension, leading to substantial price fluctuation and income instability during
the marketing period. This is basically because as horticultural plants, they
exhibit price elasticity supply responses. A small increase in price can result in
huge production increases (Damianos and Demoussis, 1992). If prices were
allowed to fall to accommodate the increased supply, fruits and vegetables that
exhibit inelastic demand would record a reduction in income. If, on the other
hand, the demand is elastic, a drop in prices caused by increased supply will be
followed by a more than proportional increase in the quantity demanded
(Bergman, 1984). Low income households are more responsive to price
changes for vegetables, but less responsive to fruits (Dong and Lin, 2009). On
the other hand, it is estimated that most countries in the sub- Saharan Africa
have income elasticities for fruits greater than the elasticities for vegetables
(Ruel et al, 2004).
1.2 Problem Statement
Low fruit and vegetable intake is among the top risk factors contributing to
about 2.7 million deaths globally (WHO, 2003). In Nigeria, micronutrient
malnutrition has been identified as a wide spread problem with serious

4
economic consequences. These include, cognitive losses, work losses, low
productivity, etc (Adish, 2009). This dismal picture of the micronutrient status
spells serious consequences. In fact, estimated levels of current fruit and
vegetable intake vary considerably around the world ranging from levels less
than 100g/day in less developed countries to about 450g/day in Western Europe
(WHO, 2003). Internationally, representative data on fruit and vegetable
consumption in 21 countries, most of which are from the developed world,
show that average intake reached the WHO/FAO minimum recommended level
of 400g per capita per day (Israel, Italy and Spain) (IARC,2003). Specifically,
in Nigeria, the 2007 estimated production of fruits and vegetables was 977.799
million tonnes and 8.082 million tonnes, while their consumption was estimated
at 15.44 g/capita/day and 47.52 g/capita/day for fruits and vegetables
respectively (FAO, 2008).
In Enugu State, statistics showed that between 2001 and 2007, 4.364 million
tonnes of vegetables were produced (PCU, 2008). However, there are no
available statistics for fruit production as well as their consumption in the area.
In a study (Kushwala et al, 2007), only the determinants of vegetable
consumption was considered. The study did not consider fruits as well as their
various elasticities. From the fore going, certain questions come to mind: What
are the types and quantities of fruits and vegetables consumed by the
households? What are the share of fruits and vegetables in the household’s food

5
budget? What are the factors that shape consumption behaviour in relation to
fruits and vegetables?
The diets of urban dwellers are generally more diverse than those of their rural
counterparts (Regmi and Dyck, 2001; Ruel and Garret, 2003; Smith et al, 2003;
Smith, 2004). It is believed that this is due to a combination of factors
including the availability of a wider variety of foods in urban markets, the
availability of storage facilities, changes in life styles and cultural patterns and
the need for convenience leading to the purchase of more processed food.
According to Fabiosa and Soliman (2008), urban households show larger
differentials in the elasticities for food and non-food items with much smaller
elasticities for the food categories. Rural households on the other hand, show
higher elasticities in the food categories, especially for meat, fish and dairy.
However, urban households are less responsive to income changes than are rural
households in the food categories; and more responsive in the non-food
category.
Hence, this study to examine the patterns and determinants of fruit and
vegetable consumption in the urban and rural areas of Enugu State, Nigeria.
1.3 Objectives of the study
The broad objective of this study was to evaluate the patterns and determinants
of fruit and vegetable consumption in urban and rural areas of Enugu State,
Nigeria. The specific objectives were to:
6
i. describe the household level fruit and vegetable consumption patterns in
Enugu State in relation to the socio-economic attributes;
ii. describe the types and quantities of fruits and vegetables consumed by
the households;
iii. compare the consumption patterns in urban and rural areas of the state;
iv. estimate the share of fruits and vegetables in the household’s food
budget;
v. analyze the determinants of demand for fruits and vegetables in the state;
vi. compare the demand elasticities of these fruits and vegetables in urban
and rural areas.
1.4 Hypotheses
The following null hypotheses were tested;
HO1. there is no significant difference between the consumption of fruits and
vegetables in urban and rural areas of Enugu State of Nigeria;
HO2. the determinants of the consumption of fruits and vegetables are not the
same in urban and rural areas;
HO3. there is no significant difference in the demand elasticities for fruits and
vegetables in urban and rural areas of Enugu State; and
HO4. households’ socio-economic characteristics have no significant effect on
the consumption of fruits and vegetables in the study area.

7
1.5 Justification for the study
It is known that low fruit and vegetable consumption is among the top 20 risk
factors contributing to attributable mortality and up to 2.7 million lives could be
saved each year with sufficient global fruit and vegetable consumption. This
excludes, however, vitamin A deficiency (VAD), iodine deficiency diseases
(IDD) and iron deficiency anaemia (IDA). Abundant intake of fruits and
vegetables is clearly a positive solution to problems of poor diet quality in the
developing world. They are relatively cheap sources of essential micronutrients
and are therefore a cost effective way to prevent micronutrient deficiencies and
protection against the main killers associated with micronutrient deficiencies in
the world today.
Many previous studies have addressed socio-economic differentials in the
nutritional status of people in either rural or urban areas (Levin, 1996; Prasad
and Prasad, 1991). However, the magnitudes of socio-economic differentials in
rural and urban population have seldomly been compared. The danger of using
such comparisms according to Menon et al, (2000) is that they mask the
enormous differentials that exist between socio-economic groups in both urban
and rural areas. It is expected that the study will:
Firstly, help to broaden the understanding of household level factors that
influence the demand for fruits and vegetables in urban and rural areas in Enugu
State. The result will assist in the promotional efforts to foster fruit and

8
vegetable consumption in future. This is because these efforts can only be
sustainable if such factors were properly analyzed.
Secondly, help create awareness on the need for the consumption of locally
available fruits and vegetables bearing in mind the essential benefits of fruits
and vegetables to human health. The study will also suggest strategies for
improving fruits and vegetables consumption among the two demographic
divide in Enugu State, vis-a-vis the nutritional and economic importance of
fruits and vegetables.
Again, the findings will go a long way in providing information to guide future
policy initiatives to promote and facilitate greater consumption of fruits and
vegetables in the study area and help policy makers in planning and managing
micronutrient malnutrition problems. Finally, it will help other researchers
wishing to go into related areas of study.
1.6 Limitations of the Study
The following challenges were faced in the course of this study:
1. Some of the respondents particularly, those in the rural areas were not able to
say for sure the quantity of each of the fruits and vegetables consumed in
standard measurements, example, kilogrammes, and grammes. Given this,
the enumerators had to rely on verbal descriptions as reference measures.
2. In some areas, during the collection of the data, the enumerators had to visit

9
many times before they could be attended to. This became so worrisome
because these respondents had earlier indicated interests to participate in the
exercise when reconnaissance visits were made to the areas.

10
CHAPTER TWO
2.0 REVIEW OF RELATED LITERATURE
This chapter dealt with the review of literature related to the study. They were
reviewed under the following headings:
2.1.1 The Meaning of Fruits and vegetables
2.1.2 Importance of Vegetables
2.1.3 Importance of Fruits
2.1.4 Demand and Consumption Theory
2.1.5 Household Fruit and Vegetable Consumption Pattern
2.1.6 Expenditure Elasticity of Food
2.1.7 Household Budget Share
2.1.8 Household Income
2.1.9 Market Supply for Fruits and Vegetables
2.2.0 Prices and Availability of Fruits and Vegetables
2.2.1 Consumer Preferences
2.2.2 Costs and Feasibility of On-Farm Production
2.2.3 Intra household Decision –Making Process
2.2.4 Theoretical and Conceptual Framework
2.2.5 Analytical Framework.
11
2.1.1 The Meaning of Fruits and Vegetables
Fruits are defined botanically as the ripened ovary of a seed bearing plant that
contains the seed(s) (IARC, 2003). By this definition, zucchini, tomatoes,
peppers, peapods, and even the seed pods of deciduous trees are fruits. Fruit is
more commonly defined as the sweet, fleshy, edible parts of plants that contain
the seed(s), excluding the non-sweet examples as zucchini, tomatoes and
pepper.
Vegetables, on the other hand, are broadly defined as the edible portions of a
plant (excluding fruits and seeds), such as the roots, tubers, stems and leaves, a
common definition which excludes sugar crops such as sugarcane and sugar
beet as well as starchy root crops such as cassava, yams, and taro.
Nwabueze (1995) defined vegetables as annual or perennial herbaceous plants
whose edible parts are characterized by very high moisture content of 80% or
above. Ihekoronye and Ngoddy (1985) described green vegetables as living
entities that can respire when harvested freshly. They have high content of water
and an abundance of cellulose. The cellulose is in a form which, although not
digested, serves a useful purpose in the intestine as roughage, thus promoting
normal elimination of waste products. They stated that because of their high
content of water, leafy vegetables are low in energy values.

12
2.1.2 Importance of Vegetables
According to Ihekoronye and Ngoddy (1985), the chief nutritive value of
vegetables is their richness in minerals and vitamins. The vitamin content is
influenced by certain factors; the cultivar, maturity and source of light. It is
expected that crops that mature during autumn contain higher vitamins (in the
form of carotene) than those that mature in poorer light of winter (Selman,
1994). Cassava leaves contain up to 1010ug retinol (10,000 i.u. of carotene)
(Uwaegbute, 1988). Vegetables are known to be good sources of ascorbate
(Fafunso and Bassir, 1978). The value of ascorbic acid should not be ignored. It
performs many biochemical functions. The abnormalities of connective tissue
observed in scurvy have long suggested that the ascorbate is involved in the
synthesis of collagen or mucopolysacharides (Pike and Brown, 1975).
Importance of ascorbic acid has been demonstrated in the transfer of plasma
iron to the liver and its incorporation into the iron storage compounds (Masur,
1961). Ascorbic acids in varying concentrations in such important foods as
citrus fruits, potatoes, tomatoes and leafy vegetables. Josyln and Hortztzer
(1985) reported that an average glass of orange juice contains 50mg/100g of
ascorbic acid and raw cabbage has 50mg/100g of ascorbic acid. Okolie (1978)
observed that ascorbic acid content of spinach is on the average 30mg/100g.
The green leafy vegetables contain some quantity of riboflavin. However niacin

13
and folate are present in reasonable amount (Fafunso and Bassir, 1978, Ifon and
Bassir, 1979, Oguntona, 1985).
Most of the earlier studies by Oke (1968), and Onyenuga (1968) indicate that
Nigerian green leafy vegetables contain appreciable amounts of minerals. Some
of the factors influencing mineral composition include soil fertility or the type
of fertilizer used (Oke, 1968). Latude-Dada (1991), for example, found that the
total iron contents differed significantly ranging from 29.4mg to 92.6mg/kg due
to wide variation in soil types. In almost all the cases of studies, the different
vegetables were low in sodium (Ifon and Bassir, 1979). However they were
relatively high in potassium.
Ifon and Bassir (1977) suggested that some of the vegetables contain
comparatively high levels of sulphur and other minerals. Zinc and calcium are
abundant in vegetables. Spinach is exceptionally high in calcium, up to
600mg/100g (Duckworth, 1979). Okro has good nutritional value, rich in
protein, ascorbic acid and high in calcium (Oyenuga, 1968).
The carbohydrates in vegetables consist mainly of indigestible fibrous materials
such as cellulose, semi-cellulose and lignin in addition to small quantities of
sugar, such as glucose, fructose and, in some cases starch. Vegetables are not
good sources of dietary energy. This is reflection of the low dry matter content
of many of these leaves. Vegetables promote satiety because large bulks of them

14
are usually taken. This, with their low-energy value, makes them useful in the
prevention and treatment of obesity (Davidson and Truswell, 1975).
Overall, fresh green leafy vegetables have crude protein content ranging from
1.5 to 1.7% although some workers (Aletor and Adeogun, 1995) have obtained
a mean of 4.2% for 17 of such vegetables. When dried samples were used, the
crude proteins can range from 15.0 to 30% although again the mean is usually
rounded to 20%.
There are very few reports on the protein quality of green leafy vegetables.
FAO/WHO (1993) reported that the amino-acid pattern of green leafy
vegetables is relatively low in sulphur containing amino-acids. Although the
protein content is low, however, it is very valuable because of its high cysteine
(Uwaegbute, 1988). Thus, vegetables can enhance the nutritional value of diets
based on edible roots, tubers and legumes.
Green leafy vegetables contain small quantities of riboflavin. Niacin and folate
are present in a reasonable amount (Fafunso and Bassir, 1978). The fat content
of green leafy vegetables (GVL) is relatively low. It is unusual to find levels of
either extract exceeding 1.0% in fresh leafy vegetable. However dry samples
have values that range from 1-30%.
The green leafy vegetables (GLV) contain appreciable amounts of anti-nutrient
compounds, which include phytate and Oxalic acids. These are important
15
compounds as they have significant consequences on the nutritive value of the
materials. Higher levels of either phytate or oxalate have long been known to
inhibit the absorption and utilization of minerals by animals including man
(Taylor, 1995). For instance T. triangulae contain 20mg and 190mg per 100g
respectively of oxalic acid and phytic acid and T. occidentalis contain 40mg and
80mg per 100g respectively of oxalic and phytic acids (Aletor and Adeogun,
1995, Oke, 1968).
2.1.3 Importance of Fruits
In Nigeria, fruits are important during pregnancy and lactation. Analysis of
national household data in Nigeria revealed that fruits had high caroteniod and
vitamin A values, but were ignored in nutrition education (Singleton et al,
1989).
Secondly, fruits are regular components of diets of millions in 1992 (Pipes and
Trahms, 1993). As documented in this review, fruits provide broad range
micronutrients and in some geographical areas, reliance upon such fruits is
critical especially during months preceding harvest of domesticated field crops.
Such species also play prominent roles in sustaining humans during period of
social unrest and military conflict, as well as during drought and other natural
catastrophies (Pollack, 2001).
Among the Hausa of Nigeria, fruits are considered as both food and medicine
and many species are consumed for their roles in curing gastrointestinal

16
diseases (Aletor and Adeogun, 1995). In eastern Nigeria, settled Fulani agro-
pastoralists used fruit species high in protein and micronutrients to maintain
dietary quality during periods of low rainfall. Further, Fulani use of fruits
species for both food and medicine was critical during drought (Latude-Dada,
1991). Some rural Fulani’s use fruits during pregnancy and lactation because of
perceived benefits especially leaves of veronia colorate and fruits of lennea
schiniperi (Latude-Dada, 1991).
Some fruits like citrus, which are rich sources of vitamins, minerals and dietary
fibre (non-starch polysaccharides), are essential for normal growth and
development and overall nutritional well-being. However, it is now beginning to
be appreciated that these and other biologically active, non-nutrient compounds
found in citrus and other plants (phytochemicals) can also help to reduce the
risk of many chronic diseases (Harats et al, 1998).
Vitamin C is one of the essential water-soluble vitamins, which play a key role
in the formation of collagen, a primary component of much of the connective
tissues in the body. Adequate collagen synthesis is essential for strong
ligaments, skin, blood vessels and bones and for wound healing and tissue
repair. The weakening of these tissues is a symptom of vitamin C deficiency.
Vitamin C is an important element in the absorption of inorganic iron; it has
also been used in the treatment of anemia and stress. Contrary to popular belief,

17
vitamin C does not seem to prevent the onset of common cold, but in some
studies it has been reported as the length and severity of the symptoms.
Contemporary interest in vitamin C centres on its ability to perform antioxidant
functions. As an antioxidant, it can help prevent cell damage done by “free
radical” molecules as they oxidize protein, fatty acids and deoxyribonucleic acid
(DNA) in the body. Free radical damage has been implicated in the progression
of several diverse and important diseases including cancer, cardiovascular
disease and cataract formation (Block et al, 1992). Being a good source of
antioxidants, if regularly consumed, citrus can be an important part of a diet
aimed at reducing the risk of such chronic disease.
Folate is also a water-soluble vitamin essential for new cell production of DNA
and ribonucleic acid (RNA) and mature red blood cells, which ultimately
prevent anaemia (Center for Diseases Control and Prevention, 1992). Potassium
is an essential mineral that works to maintain the body’s water and acid balance.
As an important electrolyte, it plays a role in transmitting nerve impulse to
muscles, in muscle contraction and in the maintenance of normal blood pressure
(Center for Disease Control and Prevention, 1992).
Phytochemicals are naturally occurring compounds found in plants and have a
wide range of physiological effects and may help to protect against various
chronic diseases, including cancer and heart diseases. The wide variety and

18
number of known photochemical continue to grow as does understanding of
their role and importance in the diet (Steinmetz and Potter, 1991).
2.1.4 Demand and Consumption Theory
Consumer demand is defined as the various quantities of a particular
commodity that an individual consumer is willing and able to buy as the price of
that commodity varies with other factors that affect or influence the demand
held constant (Tomek and Robinson, 1991).
Many factors are known to affect or influence the demand for a product. These
factors include own price of the product, prices of other products, consumer’s
income, tastes and preference (Koutsoyiannis, 1980). Other factors or
determinants of demand include distribution of income, total population and its
composition, government policy, weather, credit availability, advertising, past
levels of demand and habits (Koutsoyiannis, 1980, Baumol, 1977)
According to Pagot (1992), factors like availability of various commodities,
eating traditions and relative prices also affect demand. Example, for
commodities like fruits and vegetables, Bokeshemi and Njoku (1997) had
contended that because the availability of fruits and vegetables are so well
spread throughout the year, there are always some fruits and vegetable in
abundance in any given period of the year and hence adequate consumption
even among low income households. Aromolaran and Igharo (1998) and Agwu
(2000) had also noted that in addition, household size, monthly income of

19
household, total monthly expenditure on food and educational level of
household head affect meat consumption in particularly although to them, the
most important single factor affecting meat consumption is the real income.
However, very little is known about these variables on the consumption of fruits
and vegetables. Pagot (1992) is of the opinion that the price difference between
species vary considerably from region to region. To him, this contributes to the
orientation of demand towards one type of products rather than another.
The consumer is assumed to be rational in his decisions (Koutsoyiannis, 1980;
Henderson and Quandt, 1980) and as such will prefer more or less of a
particular commodity and that given his income and the market price at the
various commodities, he plans to maximize his utility or satisfaction.
Consumer demand analysis is primarily aimed at analyzing the relationship
between consumption of different commodities expressed in terms of quantities
or expenditures and disposable income or total consumer expenditure (Okorji,
1989). According to Davis (1982), consumer demand theory investigates the
food-expenditure relationships through Engel’s demand curve, which is a
functional relationship between households in a given period.
The slope of Engel’s curve measures the expenditure (income) elasticity of
demand. A positive, negative, or zero elasticity implies normal, inferior and
neutral goods respectively. Engel’s curve shows how purchases of food
commodities change when income changes. Engel ascertained that the lower the
20
consumer’s money income, the greater the proportion of that income spent on
food (Davis, 1982).
Market demand and consumer demand are often distinguished from each other.
The individual consumer demand analysis is the unit that makes economic
decisions about its own consumption and expenditure (Paris and Houthakkar,
1955). This according to them, are usually the part or all of what is known as
family or household while market analysis investigate the price-quantity or
expenditure- income relationship from individual consumers.
2.1.5 Household Fruit and Vegetable Consumption Patterns
Many literatures on the demand for food are concerned primarily with an
understanding of the consumption behaviour of households and individuals.
There is a growing concern for the nutritional consequences of a given level of
fruit and vegetable consumption (WHO, 2003; Pollack, 2001; IARC, 2003).
To measure poverty level thus welfare, one must measure what and how much
individuals consume (Deaton and Case, 1981; World Bank, 1996). According to
Timmer et al, (1983), once these variations in food consumption patterns and
the sources of access to food are understood, points of potential vulnerability of
poor people and opportunities for government intervention to improve and
stabilize food intake begin to emerge.
Some studies have indicated that mainly children and pregnant women
particularly those in poor households suffer micronutrient malnutrition mainly

21
as a result of inadequacy of fruit and vegetable consumption (WHO, 2003;
World Bank, 1996, Minot, 2002). According to them, this is probably because
of high cost of these fruits and vegetables, and besides fruits and vegetables is
regarded as very expensive sources of energy compared to other starchy staples
like garri, rice, yam, etc.
The main energy – yielding nutrient in some fruit like citrus is carbohydrates
(sugars) fructose, glucose and sucrose as well as citric acid which contain no
starch poly-saccharides (NSP), commonly known as dietary fibre, which is a
complex carbohydrate with important health benefits (Bandura, 1986).
However, in many populations, even among people who know that fruit is
nutritious, the consumption of fruits is often very low. The reasons for this are
varied. (Nestle et al, 1998).
i. Individual’s food preferences and previous experiences with a given food.
ii. Cultural values
iii. Perceptions, attributes and societal influence
iv. Availability, taste and price of food item.
Bokeshemi and Njoku (1997) had contended that consumption patterns of fruits
and vegetables depends on local availability, seasonal availability, social
preferences and the importance of commodity to the people. Njoku (1989) had
observed that urban households consume more of yellow vegetables than rural
households. This according to him may be due to the differences in income

22
levels as the yellow vegetables are more expensive than the green vegetables.
Similarly, Njoku (1989) stated that green vegetables are necessities in the diets
of people, since they are inelastic with respect to income. Fruits are elastic in
demand indicating the expensive nature of it and therefore consumed by the
high income groups. However, he stated that there is a negative relationship
between the age of the household head and the consumption of fruits. This
means that household head value less of fruits than younger ones since their
tastes and preference favour more of starchy staples than of fruits. Education
also is a key determinant of fruit consumption, since educated households know
the value of fruits in their nutrition, and hence consume more of them than
uneducated households. However, clear strategies are more likely to modify
behaviour and improve health if they are directed towards the relevant
influences and barriers (Bandura, 1986).
2.1.6 Expenditure Elasticity for Food
Household expenditure on food has been studied extensively in many
developing countries. By extending the Engel function, Rimmer and Powell
(1996) developed a model called Directly Addictive Demand System
(AIDADS). Cranfield, at al. (1998) used the AIDADS model and estimated
income elasticity for demand of food in Ethiopia, Pakistan, Senegal, Korea,
France, and USA was 0.97, 0.77, 0.76, 0.55, 0.26, and 0.15 respectively. It
shows that poorer countries are more likely to spend more of their income on

23
food, which is effectively the overcoming of the under-nutrition associated with
poverty. While Yuen (1994) estimated food income elasticity for 24 countries
from 1961 to 1994 via Working-Leser single equation. The results comply with
“Engel’s law”, with decreasing food income elasticity from year to year as the
countries developed.
Previous studies in Brazil (Simões and Brandt, 1981; Alves, et al., 1982; and
Thomas, et al, 1989; Asano and Fiusa, 2003) calculated the elasticities using
cross-sections data. Recently, Menezes, et al. (2005) used a two-stage budgeting
system via Linear Approximate Almost Ideal Demand System (LA/AIDS) to
estimate income and price elasticities for groups of Products, such as food,
housing, clothing, personal expenditure, transportation & communication, and
health. It was found that income elasticity for demand of food in Brazil was
0.301. More specifically, it was 0.109 and 0.454 among the deciles of 50%
richest population and the deciles of 50% poorest population in Brazil. Such
findings imply that poorer households are expected to increase their expenditure
on food in response to increase in income more rapidly than richer households.
Similarly, Elsner (1999) analyzed Russian food expenditure pattern by using a
two-stage budgeting system. Total expenditure allocation on food and non-food
was analyzed using Working's Engel model in the first stage. The Working's
Engel model estimated income elasticity for demand of food was 0.81 in Russia.
Also, income elasticity for demand of food was estimated to be 0.98 and 0.78

24
among Russian households in rural areas and urban areas respectively. Another
study by Brosig (2000) estimated a two stage model of Hungarian households’
food demand. Demand for food was estimated by a Working - Leser single
equation model in the first stage. The study found that income elasticity for
demand of food was 0.60 in Hungary. It also showed that differences existed
between food demand behaviors across specific socio-demographic groups. It
was estimated that income elasticity for demand of food was 0.65 and 0.58
among Hungarian households in rural areas and urban areas respectively. Both
of these studies indicate that households in rural areas are expected to increase
their expenditure on food in response to increase in income more than those
households in urban areas.
On another hand, numerous studies (Thomas, 1987; Blundell, et al., 1993; Fan,
et al., 1995; Gao, et al., 1996; Tiffin & Tiffin 1999; Dey, 2000) estimated food
income elasticity in the first stage of multi-stage budgeting system via Working-
Leser model. Most recent study by Dey (2000) found that lower income groups
are expected to increase their share of expenditure on food more than higher
income groups. Further to the Working-Leser model specification, Huang and
Bouis (1996) and Haley (2001) argued exclusion of demographic and socio-
economic factors may have the effects of income on food demand have been
overestimated. Kang and Chern (2001) compared the performance of Working-
Leser model with and without incorporation of the demographic variables. The

25
study indicates that the treatment of translating demographic effects is important
in improving the performance of the model.
2.1.7 Household Budget Share
The study of household budget allocation —i.e., how the budget of a household
is allocated to buy different commodities— is one of the most traditional topics
in economics (Paris and Houthakker, 1955). Household budget shares contain
useful information to shed light on this issue. Indeed, the household budget
share for a given commodity category g is defined as the ratio between the
expenditure for the commodity category g and total household resources —as
measured by, e.g., total expenditure or total income.
In the last decades, this topic has received a lot of attention by applied
economists. In particular, many efforts have been devoted to develop statistical
demand functions for homogeneous groups of commodities, e.g. by relating the
expenditure of consumers or households for a given commodity category to
prices and individual-specific variables as total expenditure or income,
household size, head-of-household age, and so on. Such a research program has
been mostly characterized by a theory-driven approach (Attanasio, 1999). In
fact, the parametric specifications that are employed in the estimation of each
specific demand function are in general taken to be consistent with some
underlying theory of household expenditure behavior, which very often is the
standard model based on utility maximization undertaken by full-rational

26
agents. Furthermore, no matter whether parametric or non-parametric
techniques are employed, the estimation of demand systems or Engel curves
compresses household heterogeneity —for any given income or total
expenditure level— to the knowledge of the first two moments (at best) of
household expenditure level or budget share distribution for the commodity
category under study.
This of course is fully legitimate if the aim of the researcher is to empirically
validate a given theoretical model, or if there are good reasons to believe that
the distribution under analysis can be fully characterized by its first two
moments. However, from a more data-driven perspective, constraining in this
way the exploration of the statistical properties of the observed household
expenditure patterns may be problematic for a number of reasons.
The first study of this kind was made by Engel (1857), who empirically studied
the relation between German households’ total income and expenditure for
different commodities (Moneta and Chai, 2005). First, heterogeneity of
household consumption-expenditure patterns is widely considered as a crucial
feature because, as Pasinetti (1981) notices: “At any given level of per capita
income and at any given price structure, the proportion of income spent by each
consumer on any specific commodity may be very different from one
commodity to another”. This suggests that, in order to fully characterize such
heterogeneity, one should perform distributional analyses that carefully

27
investigate how the shape —and not only the first two moments— of household
consumption expenditure and household budget share distributions change over
time and between different commodity categories. Second, understanding
heterogeneity may be important to build sound micro-founded, macroeconomic;
consumption models that go beyond the often disputable representative-agent
assumption (Kirman, 1992; Hartley, 1997; Gallegati and Kirman, 1999). Third,
adopting a more theory-free approach focused on distributional analysis may
help to discover fresh stylized facts related to how households allocate their
consumption expenditures across different commodity categories. In fact,
theory-free approaches aimed at searching for stylized facts are not new in
economics and econometrics (Kaldor, 1961; Hendry, 2000). More recently, this
perspective has been revived in the field of econophysics, where the statistical
properties of many interesting micro and macro economic variables (e.g., firm
size and growth rates, industry and country growth rates, wealth and personal
income, etc.) have been successfully characterized by using parametric
techniques. These studies show that, despite the turbulence typically detected at
the microeconomic level (e.g., entry and exit of firms; positive and negative
persistent shocks to personal income, etc.), there exists an incredible high level
of regularity in the shape of microeconomic cross-section distributions, both
across years and countries. Notwithstanding such successful results, similar
distributional analyses have not been extensively performed, so far, on

28
consumption-related microeconomic variables such as household consumption
expenditures and budget shares, for which reliable and detailed cross-section
data are also available.
Caselli and Ventura (2000) show that models based on the representative-agent
assumption impose almost no restrictions on household consumption
expenditure and budget share distributions. On the contrary, Forni and Lippi
(1997) demonstrate that heterogeneity is crucial when aggregating individual
behavior in macro models.
2.1.8 Household Income
The demand for fruits and vegetables increases with higher incomes; although
the share of total expenditure allocated to fruits and vegetables tends to decline
(IARC, 2003). This implies that at low-income levels, the demand for fruits and
vegetables is small. This is largely due to the fact that low-income households
must prioritize the fulfillment of their basic energy requirements to avoid
hunger and that fruits and vegetables tend to be an expensive source of energy.
A study in Rwanda, for example, showed that starchy staples such as sorghum;
cassava; sweet potatoes and cooking bananas were the cheapest sources of
energy; whereas goat and beef were five times more costly, and tomatoes 12
times more expensive (Minot, 2002). In a study in Enugu metropolis of Enugu
State, Nigeria, a household’s monthly expenditure on meat was a significant
proportion of household expenditure compared to other food items (Agwu,

29
2000). In conclusion, he stated that due to poverty it had become impossible for
households to feed well and consume the required quantity of meat viz-a-viz
protein. The same could be applied to fruits and vegetables. Similarly, a study
in Cambodia found that vegetables cost between 10 and 40 times more per
kilocalorie than rice, while certain fruits were up to 100 times more expensive
than rice per unit of energy (Prescott and Pradham, 1997).
The fact that fruits and vegetables are an expensive source of energy is an
important constraint for poor households. For example, the poor in Cambodia
must allocate half of their budgets to low-quality rice just to reach the
recommended energy intake of 2200 kcal per person per day. Given the need for
other foods to contribute protein and fat to the diet and the need for non-food
goods and services; it is clear that fruit and vegetable consumption will be quite
limited. At these income levels, large quantities of grains and starchy staples
and few fruit and vegetables are consumed (Minot, 2002).
One of the most ambitious attempts to examine international food demand
patterns is provided by Seale and colleagues (Mueller et al, 2001). They used
data of 114 countries from the International Comparison Project (1CP), to
estimate the effect of price and income on the demand for different food and
non-food categories; where each country represented one observation.
According to the ICP data, the budget share allocated to fruits and vegetables
represented 10 –25% of the food budget of most countries. The average budget
30
share declined from 20%, among the low-income countries, to 18% in the
middle-income countries and 15% in high-income countries.
The income
elasticity of fruit and vegetable demand is 0.60-0.70 in most African and South
Asian countries (low-income countries), 0.30-0.44 in most Latin American
countries (middle-income countries); and 0.20-0.37 in industrialized countries.
Thus, rises in income are associated with greater increases in the demand for
fruits and vegetables in poorer countries compared to wealthier countries; and
income increases are generally associated with larger increases in the demand
for fruits than for vegetables (as suggested by the larger income elasticities of
demand for fruits than for vegetables). Increase in household’s total expenditure
increase the consumption of most items. A case of meat is a good example
(Agwu, 2000).
Higher income is associated not only with an increase in the volume of fruits
and vegetables consumed; but also with an increase in the diversity of fruits and
vegetables. For example, a 1993 household survey data from Viet Nam show
that the average number of distinct fruit and vegetables consumed rises from 4.5
out of 10 in the lowest income quintile to 6.9 in the highest income quintile
(Minot, 2002).
2.1.9 Market Supply for Fruits and Vegetables
Agricultural products differ from manufactured goods in terms of supply and
demand. Agricultural products supply including horticultural crops like fruits

31
and vegetables are different because of the very seasonal biological nature while
their demands are comparatively constant throughout the year.
In economic theory, it is stated that human being is always under course of
action of choice from a number of options. The basis for the decisions could be
issues ranging from household characteristic to the exogenous unmanageable
factors.
The analysis can identify factors that determine market supply. A clear
understanding of the determinants helps to know where to focus to enhance
production and marketable supply. The study of market supply helps fill the gap
for success of commercialization. There are different factors that can affect
market supply. According to Wolday (1994) market supply refers to the amount
actually taken to the markets irrespective of the need for home consumption and
other requirements where as the market surplus is the residual with the producer
after meeting the requirement of seed, payment in kind and consumption by
peasant at source.
Marketable surplus is the quantity of produce left out after meeting the farmer’s
consumption and utilization requirements for kind payments and other
obligations such as gifts, donation, charity, etc. This marketable surplus shows
the quantity available for sale in the market. The marketed surplus shows the
quantity actually sold after accounting for losses and retention by the farmers, if
any and adding the previous stock left out for sale (Thakur et al., 1997).

32
Neway (2006) indicated two options for commercialization. The most common
form in which commercialization could occur in peasant agriculture is through
production of marketable surplus of staple food over what is needed for own
consumption. Another form of commercialization involves production of cash
crops in addition to staples or even exclusively. At the farm household level,
commercialization is measured simply by the value of sales as proportion of the
total value of agricultural output. At the lower end, there would always be some
amount of output that a subsistence farmer would sale in the market to buy basic
essential goods and services. For this reason, the ratio of marketed output up to
a certain minimum level cannot be taken as a measure of commercialization.
Neway (2006) proposed the proportion to be 20 percent of marketable surplus in
the Ethiopia as a cut of rate for commercialization.
Marketed surplus is defined as the proportion of output that is marketed (Harris,
1982). Marketed surplus maybe equal to marketable surplus, but may be less if
the entire marketable surplus is not sold out and the farmers retain some stock
and if losses are incurred at the farm or during the transit (Thakur et al., 1997).
In the case of crops that are wholly or almost wholly marketed, the output and
marketed surplus will be the same (Reddy et al., 1995).
Empirical studies of supply relationships for farm products indicate that changes
in product prices typically (but not always) explain a relatively small proportion
of the total variation in output that has occurred over a period of years. The

33
weather and pest influence short run changes in output, while the long run
changes in supply are attribute to factors like improvement in technology, which
results in higher yields.
The principal causes of shifts in the supply are changes in input prices and
changes in return from commodities that compete for the same resources.
Changes in technology that influence both yields and costs of
production/efficiency, change in the prices of joint products, changes in the
level of price/yield risk faced by producer, and institutional constraints such as
acreage control programs also shift supply (Tomek and Robinson, 1991).
A study made by Moraket (2001) indicated households participating in the
market for horticultural commodities are considered to be more commercially
inclined due to the nature of the product. Horticulture crops (fruits and
vegetables) are generally perishable and require immediate disposal. As such,
farmers producing horticulture crops do so with intent to sell. In his study it was
found that 19% of the sample households are selling all or a proportion of their
fruits and vegetables harvest to a range of market outlets varying from informal
markets to the large urban based fresh produce markets. Typically, many of the
households producing fruits and vegetables also have access to a dry land plot
where they commonly produce maize and/or other field crops.
Harris (1982) also verified empirically the relationship between marketed
surplus and output and income. She obtained negative relationship between

34
marketed surplus and variables like family size and distance to market. Farm
size was not found as a direct causal variable, but production was as Harris
(1982) put it.
A similar study was conducted by Holloway et al (1999). Their study wanted to
identify alternative techniques for effecting participation among per-urban milk
producers in the Ethiopian highlands. They found that cross breed cow type,
local breed cows, education level of household head, extension contact, and
farming experience of household head positively affected quantity of milk sold
while distance to the market affected the volume of sale negatively.
The behvaiour of marketed surplus to changes in prices and non price factors
like irrigation, acreage and productivity is of critical importance. The most
important factor, which increases marketed surplus significantly, is the
increased production or output followed by consumption and payments in kind
which should be reduced to keep up the quantity of marketed surplus of food
grains (Thakur et al., 1997).
A similar study on cotton by Bossena (2008), also indicate that four variables
affect cotton marketable supply. Owen oxen number, access to credit, land
allocated to cotton, productivity of cotton in 2005/2006 were the variables
affecting positively cotton supply. Similar study on sesame by Kindei (2007),
also pointed out six variables that affect sesame marketable supply. Yield, oxen
number, foreign language spoken, modern input use, area, time of selling were

35
the variables affecting positively sesame supply and unit cost of production was
found to negatively influence the supply. Similarly, Abay (2007) in his study of
vegetable market chain analysis identified variables that affect marketable
supply. According to him, quantity production and total area owned were
significant for onion supply but the sign for the coefficient for total area of land
was negative. For tomato supply, quantity of production, distance and labor
were significant. Similarly, Rehima (2007), in her study of pepper marketing
chain analysis identified variables that affect marketable supply. According to
her, access to market, production level, extension contact, and access to market
information were among the variables that influence surplus. Another study by
Gizachew (2006), on diary marketing also captured some variables that
influence diary supply. The variables were household demographic
characteristics like sex and household size, transaction cost, physical and
financial wealth, education level, and extension visits. Household size, spouse
education, extension contact, and transaction cost affects positively while
household education affects negatively.
According to Moti (2007), a farm gate transaction usually happens when crops
are scarce in their supply and highly demanded by merchants or when the
harvest is bulk in quantity and inconvenient for farmers to handle and transport
to local markets without losing product quality. For crops like tomato, farm gate
transactions are important as grading and packing are done on the farm under

36
the supervision of the farmers. Therefore, households are expected to base their
crop choice on their production capacity, their ability to transport the harvest
themselves and their preferred market outlet.
From these little reviews, it is possible for households to decide where to focus
to boost production and knowing the determinants for these decisions will help
choose measures that can improve the marketing system in sustainable way.
2.2.0 Prices and Availability of Fruits and Vegetables
Prices of many agricultural commodities follow a definite pattern within a one
year period. Commodities which exhibit this seasonal price pattern are those for
which the production varies substantially over the year.
Using the International Comparison Project Data on 114 countries, Seale and
colleagues (Mueller et al; 2001) also estimated price elasticities of demand for
fruits and vegetables. Their analysis showed own-price elasticities of demand
for fruits and vegetables ranging from – 0.35 to – 0.50 among most African and
South Asian countries, - 0.35 to – 0.45 in most Latin American countries, and
between – 0.10 and – 0.30 in the industrialized nations. This confirms the
conventional wisdom that low-income households are more sensitive to prices
than higher-income households. It also suggested that policies to reduce the
market price of fruits and vegetables can have a significant impact on fruit and
vegetable consumption, particularly for low-income households. However,
according to Houthakkar and Taylor (1970), consumers may continue to make

37
purchases on the basis of habit even if prices have changed. This according to
them is costly for consumers to remake consumption decisions every time and
this results in delay responses towards price change.
Given the perishability of fruits and vegetables and the limited infrastructure in
many developing countries, another constraint to fruit and vegetable
consumption is the fact that many are not available at all during part of the year.
Technologies to extend the harvest period or to facilitate storage are particularly
important for fruit and vegetables (Ali and Tsou, 1997), as well as preservation
methods such as solar drying, to extend their period of availability throughout
the year (IVACG 1993). Bokeshemi and Njoku (1997) had noted that in Imo
State, differences in distance had implications for the prices and consumption of
fruits and vegetables. The result according to the study was that for those that
were abundantly available, their prices were low, thereby permitting easy access
to most consumers. For those that were scarce or relatively available, prices
were high thereby reducing access. However, they were of the opinion that
since the availability of fruits and vegetables was so well spread out throughout
the year, that there were always some fruits and vegetables in abundance at any
period of the year. According to them, this might explain the ability of most low
income households to have adequate consumption of fruits and vegetables for
adequate nutrition.
38
Fruit and vegetable prices are also affected by trade policy. Import tariffs or
highly restrictive sanitary and phytosanitary requirements are sometimes
established at least partly for the purpose of protecting domestic producers. An
unintended consequence is that they reduce fruit and vegetable consumption by
raising domestic prices.
2.2.1 Consumer Preference
Factors like income, prices and availability, affect what consumers are able to
purchase or consume. Consumer preferences shape the decisions that consumers
make regarding what they choose to purchase or consume. Until the
physiological need to satisfy hunger is met, households have little choice but to
focus on cheap sources of energy such as grains and starchy staples. Once they
have satisfied their basic energy needs, households start diversifying their diets
by including animal source foods, dairy products and fruits and vegetables. At
this stage, the role of consumer preferences in shaping food consumption
patterns becomes more important Fruit and vegetable consumption have clear
health and nutrition benefits. They are a relatively cheap source of essential
micronutrients and they protect against chronic diseases. The vast majority of
consumers, however, are unaware of the health benefits of consuming fruits and
vegetables in abundance, even in developed countries. In the United States of
America, health awareness and knowledge of the number of fruit and vegetable
servings recommended per day have been associated with greater fruits and

39
vegetable intakes. Other important factors included taste and preference, and
having developed the habit of eating these products during childhood (Prescott
and Pradham, 1997). Several demographic factors such as gender, age,
education, income and non-smoking status are also associated with greater fruit
and vegetable intake in this population (Subar et al; 1995; Nayga, 1995). A
recent review, also focusing on developed countries, highlighted the importance
of several non-economic factors in determining fruit and vegetable consumption
choices; these included sensory appeal, familiarity and habit, social desirability,
personal and food ideology, convenience and media and advertising (Pollard,
Kirk, and Cade, 2002).
Advertising is known to be effective in increasing the volume of products
purchased by loyal buyers of a particular product but less effective in winning
new buyers (Kotler, 2001). However, Tellis (1998) had argued that advertising
appears unlikely to have some cumulative effect that leads to loyalty; rather
features, displays and especially price have a stronger impact on response than
does advertising. Changes in tastes and preferences obviously affect the demand
and consumption of food. Tastes and preferences of individuals may change for
a variety of reasons such as age, education, health, experience and
advertisement. For example, consumer education about health and nutrition may
influence the types of food purchased. According to Scearce and Jenson (1978),
general education of the household head has a positive and significant effect on

40
household nutritional status. However, very little is known about how
preferences regarding fruits and vegetables affect consumption in low-income
countries. Taboos and cultural beliefs are likely to play a significant role in
many populations, especially for selected physiological or age groups such as
pregnant and lactating women or young infants. Mangoes, for example, are
believed to cause diarrhoea in young children in many cultures, and therefore,
intake of this excellent source of vitamin A by young children – who are also at
highest risk of vitamin A deficiency – is often constrained. Dietary restrictions
during lactation – another period of high vulnerability to micronutrient
deficiencies – are also widespread in developing countries and often include
several fruits and vegetables because of their perceived harm either to the
mother or to her young infant (Pollack, 2001).
Maternal education has been consistently associated with positive child health
and nutrition outcomes as well as with better child feeding and care practices. In
certain cases, maternal knowledge has been found to mediate the effect of
maternal education on child outcomes Smith et al, (2003) whereas in others,
knowledge appeared to be a stronger predictor of child health than formal
education (Block, 2002). The role of maternal education or knowledge in
shaping food consumption patterns, however, is not well documented. In Haiti,
maternal education was associated with greater dietary diversity in young
children’s diets, but no information is available on the association between
41
maternal education and household dietary quality or fruit and vegetable
consumption (Menon and Ruel, 2003). One study in Indonesia, however,
showed that mothers who had greater nutrition knowledge devoted the same
share of their budgets to food, but allocated a larger share of their food budget
to foods that were rich in micronutrients, including fruits and vegetables (Block,
2002).
2.2.2 Costs and Feasibility of on-Farm Production
If markets are efficient and transportation costs are only a small share of food
prices, then consumption patterns depend on total income, prices, and
preferences, but not on production opportunities. In this scenario, fruit and
vegetable consumption would not be related to whether the household could
grow fruits and vegetables. The fact that urban fruit and vegetable consumption
are sometimes higher than rural consumption is a confirmation of this idea.
However, in the presence of large transaction costs that impede market
transaction, household consumption patterns will be affected in part by what the
households can produce for itself.
There is little research on the degree to which fruit and vegetable consumption
are affected by home production, after controlling for income and prices. Ali
and Tsou (1997) reported that a programme to promote home gardens in
Bangladesh significantly increased the volume of vegetable consumption
compared to those that did not participate.

42
Although it is difficult to control for selection bias in a voluntary programme
such as this, it seems plausible that, in areas where markets work imperfectly,
the promotion of home gardens could be an effective means of increasing fruit
and vegetable consumption. Ample evidence exists to support that theory,
mostly from experience with small-scale home gardening initiatives to promote
vitamin-A intakes. These studies show that promotional efforts, especially those
that combine production interventions with strong education and behaviour
change activities, translate into greater consumption of the targeted vitamin A-
rich fruits and vegetables.
The constraint on home production of fruits and vegetables is not the land
requirement. Ali and Tsou (1997) showed that even a 16m2 garden could meet
40% of a family’s calcium needs and almost all its vitamin C requirements.
Rather, the constraints were more likely to be labour, water, and information.
Vegetable production is significantly more labour-intensive than most field
crops because of water requirements and pest control. Fruits and vegetables also
tend to be more water-intensive and management-intensive than other crops.
2.2.3 Intra-household Decision-Making Process
Research on the intra-household allocation of resources indicates that
households in which women have more control over resources (due to legal
rights, greater inheritance, high share of assets, or simply the absence of the
husband) or higher social status tend to place a higher priority on child health

43
and nutrition in allocating household resources. For example, Smith, et al
(2003), using data from 36 demographic and health surveys, showed that
women’s status had a positive and statistically significant effect on the
nutritional status of the children. This appeared to be due to the better health of
higher-status women and their use of better child-care practices. Several studies
in developing countries also showed that a higher share of assets held by
women increased food budget shares of household total energy intake
(Quisumbing, 2003).
Female-headed households may be considered a case where women have full
decision-making power, shedding light on differences in food consumption
patterns between men and women. A study of household budget data from
Rwanda found that female-headed households allocated a larger share of their
budget to fruits and vegetables (4.5%comparad to 3.1%) than male-headed
households (Ministere du Plan, 1988).
Female-headed households also spent a larger share on pulses and tubers, but a
smaller share on animal products and beverages. An econometric analysis
focusing on selected food products found that the consumption of leafy greens
was significantly greater among female-headed households than male-headed
households, even after controlling for income and other household
characteristics. A study in Viet Nam, however, found no statistically significant

44
difference between fruit and vegetable consumption patterns among male-and
female-headed households (Minot, 2002).
2.2.4 Theoretical and Conceptual Framework
In order to examine the determinants of fruit and vegetable consumption in
developing countries in which the study intends to do using Enugu State of
Nigeria as a case study, it is useful to begin with a review of the economic
theory of household decision making. In the standard household model,
households use their resources (labour, skills, land and equipment) to achieve
the highest level of utility (satisfaction) possible. These decisions result in a
certain level of income, although this may not be the highest possible income
since the household may choose to sacrifice some income for more leisure
and/or to have a more stable income flow (Ruel et al; 2004). In practice,
households that are near the margin of subsistence probably cannot “afford”
much leisure and are likely to be close to the maximum income feasible with
their resources and skills.
Consumption patterns are determined by the combination of three main factors:
the income level, preferences of the household, and market prices. Preferences
are, in turn, affected by the composition of the household, its members’
knowledge and education, habits and cultural norms, personal experience, and,
in the case of food, the biological factors that affect hunger (Ruel et al; 2004).
Production and consumption decisions are “separable” in the sense that

45
production decisions do not depend on consumption preferences. Consumption
decisions depend on total income but not on the composition or source of
income.
Two key assumptions of the separable household model are: buying prices and
selling prices are the same; and the household resources are pooled and the
household has a single set of preferences. In recent decades, these two
assumptions have been relaxed, leading to more complex but more realistic
models of households who grow food and face large costs in getting goods to
and from the market (IVACG, 1993). These transaction costs create a gap
between the buying and selling prices of the same item. As a result, for a range
of market prices, the household does not participate in the market for the item,
producing only for its own consumption needs and that consumption is partly
dependent on production opportunities. Fruits and vegetables are highly
perishable, so the cost of getting them to or from the market will be high for
households in remote rural areas. Thus, the consumption of some fruits and
vegetables may be constrained by whether or not they can be grown by the
household. Access to water, seeds, and information on horticultural production
methods may limit both production and consumption of fruits and vegetables.
Second, the assumption that households pool resources and have a single set of
preferences have been questioned by research on intra-household allocation of
resources and gender roles within the household. Empirical research has shown

46
that husbands and wives often have unequal control over resources, that they
may not pool income, and that their consumption priorities may differ. Some
alternative household models assume a cooperative solution in which the
distribution of benefits depends on the bargaining position of each based on the
threat of non-cooperation or separation. Other models assume a non-cooperative
solution in which each partner maximizes utility (satisfaction) subject to the
decisions of the other. In either case, the consumption patterns will depend
partly on the legal and socioeconomic status of each partner and their ability to
monitor each other’s behaviour (Quisumbing, 2003).
Applying the standard household model and the two extensions to fruit and
vegetable consumption, the following factors are the main influences on
consumption:
• Household income,
• The prices and availability of fruits and vegetables relative to other prices,
• Household members’ preferences,
• The cost to the household and feasibility of fruit and vegetable production,
and
• The decision-making power of women relative to men in the household.
These five hypothesized determinants of fruit and vegetable consumption are
illustrated in Figure 1, along with some of the policy and non-policy factors
that may affect them.

47
Figure 1: Conceptual framework of determinants of fruit and vegetable
Consumption
Fruit and Vegetable Consumption
Adapted from: Ruel et al; (2004).
Household
composition,
education and
skills, access
to land,
equipment,
social capital,
location,
Wage rates,
and farm
prices
World prices,
trade policy,
transport and
storage
infrastructure,
agro-climatic
conditions,
institutions,
price policy,
seed policy,
and F & V
research
Nutrition
education,
cultural
beliefs &
norms, and
biological
aspects of
hunger
Access to
water, labour
availability,
F& V seed,
fertilizer,
production &
marketing
information,
and agro-
climatic
conditions
Gender
aspects of
property
rights,
divorce law,
legal
infrastructure,
access to
education, &
cultural
norms
Household
income
Prices and
availability of
F&V
Consumer
food
preferences
Cost &
feasibility of
home-
production of
F&V
Intra-
household
decision-
making
process
Fruit and Vegetable Consumption
Household
composition,
education and
skills, access
to land,
equipment,
social capital,
location,
Wage rates,
and farm
prices
Market
prices,
transport and
storage
infrastructure,
agro-climatic
conditions,
season,
institutions,
price policy,
seed policy,
and F & V
Nutrition
education,
cultural
beliefs &
norms, and
biological
aspects of
hunger,
awareness
Access to
water, labour
availability,
F& V seed,
fertilizer,
production &
marketing
information,
and agro-
climatic
conditions,
season
Gender
aspects of
property
rights,
divorce law,
access to
education, &
cultural
norms, male
or female
headed hh,
children
Household
income
Prices and
availability of
F&V
Consumer
food
preferences
Cost &
feasibility of
home-
production of
F&V
Intra-
household
decision-
making
process
Fruit and Vegetable Consumption
48
2.2.5 Analytical framework
In food consumption and demand analysis, a number of models are used.
Typical theoretical models used in the papers are the Almost Ideal Demand
System (AIDS) model and its variations, Rotterdam, Working and Leser models
and Linear Expenditure System (LES) model. AIDS, Rotterdam, Working and
Leser models and LES allow estimating demand equation separately. Demand
System model by Deaton and Muellbauer (1980) is derived from cost and
expenditure function and does not depend on the utility function explicitly. It is
not linear, but for estimation log-linear form of AIDS can be used. It is based on
consumer demand theory and in case of aggregation over Consumers, the result
are consistent (Dhehibi and Gil 2003). However, AIDS nearly approximates any
demand system and it requires summing up the weights of total expenditure to
one, and that zero homogeneity in prices and symmetry condition holds. Slutsky
symmetry and zero homogeneity conditions can be additionally examined by
AIDS model by putting some restrictions on the parameters of the model.
The single equation approach to demand modeling changed with the
introduction by Stone (1954) of the linear expenditure system (LES). The LES
was among the first attempts to derive utility-based demand models. The
derivation of LES imposes theoretical restrictions of adding-up, homogeneity,
and symmetry. Among the implications of the LES are that goods cannot be
inferior and that all goods must be substitutes, which obviously makes it too

49
restrictive a functional form to model demand, except for cases where
commodities are grouped into very broad categories so that it is reasonable not
to expect inferiority or complementarity among them. Also, while the
imposition of the theoretical restrictions helps generate degrees of freedom, it
also forces the analyst to take theoretical restrictions as given (because these
restrictions are embedded in the model). An interesting alternative is one that
allows restrictions to be tested empirically.
The Rotterdam model proposed by Theil (1965) and estimated by Barten (1969)
allows for restrictions to be tested statistically. In many ways, the approach
followed in deriving the Rotterdam model is similar to Stone’s, except the
Rotterdam model is specified using variables in first-differences. Like the LES,
the derivation of the Rotterdam model emphasized the use of theoretical
restrictions to generate degrees of freedom. Among the limitations of the
Rotterdam model are that it imposes constant price and expenditure elasticities
and that it typically does not satisfy theoretical restrictions when applied to data
(Deaton and Muellbauer, 1980).
It became apparent that specifying functional forms using theoretical restrictions
to generate degrees of freedom did not offer much promise. It was partly for this
reason that research in the 1970s focused on developing flexible functional
forms. This approach entailed approximating the direct utility function, the
indirect utility function, or the cost function with some specific functional form

50
that has enough parameters to be regarded as a reasonable approximation to
whatever the true unknown function might be. Important contributions in this
regard were the transcendental logarithmic (translog) model of Christensen et
al., (1975) and the almost ideal demand system (AIDS) model of Deaton and
Muellbauer (1980).
The indirect translog model (as originally proposed by Christensen et al.
(1975)) is derived by applying Roy’s identity to a function that approximates
the unknown indirect utility function by a quadratic form in the logarithms of
the price to expenditure ratios. Unfortunately, the demand functions derived
from this indirect utility function are complicated and difficult to estimate. Its
modified version (Jorgenson et al., 1982), the direct translog model, makes the
discomforting assumption that, for all goods, prices are determined by quantities
rather than the other way round.
Working assumes the same set of prices for households thus omitting them from
the model. Since 1943 the model has been improved a lot. It has been used for
cross-country analysis and the assumption about similar prices is no longer
relevant. As a result, prices are included in the model. The final model, Florida,
requires the information about prices, income level, budget share for good and
substitution term (Theil et al., 1989). Absolute prices are converted into relative
ones by dividing by the geometric mean. The form of income variable in
Florida’s model is the same as in the AIDS model. The model consists of linear,

51
quadratic and cubic terms (Regmi and Seale, 2010). In addition the model has
the same assumptions as AIDS, and other demand models. However, the
authors have not developed the extension to the model where other explanatory
variables can be included.
The empirical model applied in this study is the Working-Leser model. The
original form of the Working-Leser model was discussed by Working (1943)
and Leser (1963). In the Working-Leser model, each share of the food item is
simply a linear function of the log of prices and of the total expenditure on all
the food items under consideration. The model is a simple model with desirable
properties which expresses the household’s budget share of each item t, as a
linear function of the logarithm of household expenditures (Castaldo and Reilly,
2007). The model is also known to be consistent with household utility –
maximization.
The model provides information on the tendency of households at different
income levels and with different characteristics to allocate expenditures among
different budget categories. Demographic characteristics were added to the
model.
The model in its most austere form is expressed as:
Wit = Ait + Bit log MT
Where: w = budget share
i = commodity and
t = time

52
The budget share which was derived as:
Wit = Pit Qit
MT
Wit = Budget share of commodity i at time t
Pit =Price of commodity i at time t
Qit =Quantity of commodity i at time t
MT= Total expenditure at time t

53
CHAPTER THREE
3.0 METHODOLOGY
3.1 Study Area
The study area is Enugu State. The state is one of the 36 States that make up the
Federal Republic of Nigeria, and was created in 1991. It is located in the south
east geopolitical zone of Nigeria. The state is made up of 17 Local Government
Areas. The Local Government Areas are Aninri, Awgu, Enugu East, Enugu
North, Enugu South, Ezeagu, Igbo-Etiti, Igbo-eze North, Igbo eze South, Isiuzo,
Nkanu East, Nkanu West, Nsukka, Oji-River, Udenu, Udi and Uzo-Uwani. The
state is also divided into three senatorial zones namely, Enugu East, Enugu
North and Enugu West. Generally, four Local Government Areas viz: Enugu
North, Enugu South, Nsukka and Oji-River Local Government Areas are
regarded as urban areas in the state given the infrastructural, demographic and
socio-economic considerations while the rest are rural.
It has a land area of about 8,022.95km2, and is bounded on the East by Ebonyi
State, on the North by Benue and Kogi States, on the South by Abia State and
on the West by Anambra State. The state is located between latitudes 5056’ and
70
06’N and longitudes 6053’ and 7
055’E (Ezike, 1998; INEC, 2008). According
to NPC (2007), the population is about 3,257,298 persons.
The climate is tropical, with an annual rainfall of about 1500mm. The rainfall is
concentrated within seven to eight months of the year (Iloeje, 1981). The major

54
occupation of the people is agriculture. Major crops grown are cassava, yam,
maize, rice, melon, groundnut, palm oil and a variety of fruits and vegetables.
Some of these fruits and vegetables are available all year round, though to
varying degrees. These include oranges (Citrus spp.), pineapple (Ananas
comosus), paw-paw (Carica papaya), garden eggs (Solanum melongena),
banana (Musa balbisiana), plantains (Musa paradisca) and tomatoes
(Lycopersicon). However, plantains, tomatoes and star apple are more abundant
during the dry season months of November to March. Leafy vegetables such as
Fluted pumpkin (Telfeiria occidentalis), Bitter leaf (Veronica amygdalina),
Water leaf (Talinum triangulare) and Okazi (Gnetum africana or
G.buchhoizium) are most available during the rainy season months of April to
September. Oha (Pterocarpus milabreadi) is an exception here, which is mostly
abundant between November and December. There are also small herds of
sheep and goats, poultry and piggery.

55

56
3.2 Sampling Procedure
Multi-stage sampling techniques were used for this study. Firstly, two urban
and two rural areas were purposively selected. The two urban areas were Enugu
North and Enugu South Local Government Areas, while the rural areas were
Nkanu East and Isi-Uzo Local Government Areas. Also, two residential zones
were purposively selected from the urban areas and these were New Heaven and
Uwani, so also Eha-Amufu and Ugbawka were purposively selected for the
rural areas. A sample frame of 360 respondents was drawn from these areas.
After this, 60 households were randomly selected from each of the areas. A list
of these households, who had earlier indicated interest in participating in the
study during the reconnaissance visit to the area, formed the sampling frame. In
all, 240 respondents were used for the study.
3.3 Data Collection.
Primary source of data was used for the study. The data were collected through
questionnaire administered to the households by some trained enumerators who
assisted the researcher. Data collection was carried out between May and
August, 2008 for rainy season and November, 2008 and March, 2009 for dry
season. In each of the seasons, two visitations were made.
3.4 Data Analysis
Objectives (i), (ii) and (iii) were realized by means of descriptive statistics using
measures of central tendency such as means, percentages, and standard

57
deviation. Objective (iv) was achieved using budget share analysis as previously
used by Deaton and Muellebeur (1980), while the Working – Leser functional
form which was subjected to the Ordinary Least Squares (OLS) and employed
to achieve objective (v).This follows the methods employed in the past by
Njoku (1989), Okorji (1989), Blundell et al; (1993), Yeong-Sheng (2008).
Since elasticities are involved, it is more convenient to use double logarithmic
functions. The coefficients of the variables become the elasticities. This method
has been used in the past by Deaton and Muellebauer (1980); Njoku (1989);
Okorji, (1989); Ruel et al; (2004) and Hoddinott and Yohanner (2002). Z-test
statistic was also employed in testing of the differences in consumption patterns
in the urban and rural areas.
3.5 Model Specification
The Budget share model is specified as follows:
Wit = PitQit ……………………………………………………… (i)
MT
Where:
Wit = Budget share of commodity i at time t
Pit = Price of commodity i at time t
Qit = Quantity of commodity i at time t
MT = Total expenditure at time t
In this case, commodity i is either fruit or vegetable per month.

58
The restricted budget share model is specified as:
Wit = Ait + Bit log MT + B2it (logMT)2 + 1…………………………..(2)
Household characteristics and composition, and seasonality were included in the
model to eliminate bias in the expenditure elasticity estimate that may arise if
not included.
Thus the full model is
Wit = Ait + B1it log MT + B2it (logMT) 2 + B3Ct + B4AMT + B5 AFt + B6
AGEHD + B7 SEX HD + B8 EDUCHD + M Bt SEAt + M Bt
∑ ∑ t=1 logpt ……. (3)
Where:
Wit = Budget share of commodity i at time t
Ait = Intercept
LogMT = Log of total expenditure
(LogMT)2 = Log of total expenditure squared
Ct = Number of children who are members of the household at time t.
AMT = Number of adult male members of the household at time t.
AFt = Number of adult female members of the household at time t.
AGEHD = Age of the household head in years.
EDUCHD = Education of the household head in years.
SEX =Dummy(Male -1; Female - 0)
SEA = Dummy for season (Dry season -1; Rainy season – 0).
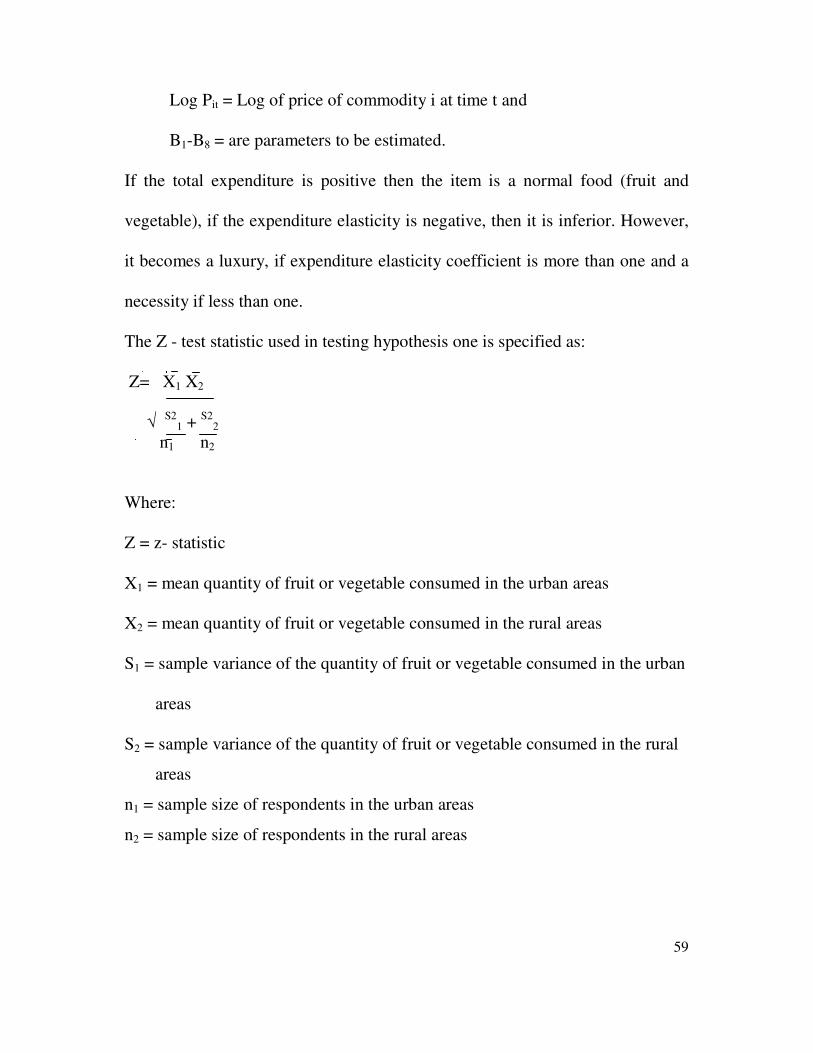
59
Log Pit = Log of price of commodity i at time t and
B1-B8 = are parameters to be estimated.
If the total expenditure is positive then the item is a normal food (fruit and
vegetable), if the expenditure elasticity is negative, then it is inferior. However,
it becomes a luxury, if expenditure elasticity coefficient is more than one and a
necessity if less than one.
The Z - test statistic used in testing hypothesis one is specified as:
Z= X1 X2
√ S2
1 + S2
2
n1 n2
Where:
Z = z- statistic
X1 = mean quantity of fruit or vegetable consumed in the urban areas
X2 = mean quantity of fruit or vegetable consumed in the rural areas
S1 = sample variance of the quantity of fruit or vegetable consumed in the urban
areas
S2 = sample variance of the quantity of fruit or vegetable consumed in the rural
areas
n1 = sample size of respondents in the urban areas
n2 = sample size of respondents in the rural areas

60
While hypotheses (ii) – (iv), were tested using the differences between the t-
values from the regression results and the tabulated t- values.
61
CHAPTER FOUR
4.0 RESULTS AND DISCUSSION
The results and discussions made in the study are presented in this chapter. The
results were based on the analysis from the data which were collected through a
set of questionnaire administered on 240 respondents, 120 each from both the
urban and rural areas of Enugu State. All the respondents returned their
questionnaire and so were all used for the analysis. The presentation followed
the stated objectives for the study which had the sub-headings below:
4.1 Households socio-economic characteristics.
4.2 Types and quantities of fruits and vegetables consumed by the
households.
4.3 Consumption patterns in urban and rural households.
4.4 Paired sample test of the differences between the consumption of
fruits and vegetables in urban and rural areas of Enugu State.
4.5 Budget shares of fruits and vegetables in urban and rural households.
4.6 Determinants of fruits and vegetables consumption among urban and
rural households in Enugu State.
4.7 Demand elasticities for fruits and vegetables in Enugu State.

62
4.1 Households’ Socio-economic Characteristics of the Respondents.
The households’ socio-economic profile of the respondents in both urban and
rural areas of Enugu State is presented below.
Table 4.1: Socio-economic characteristics of the urban respondents in Enugu State.
Variables
Minimum Maximum Mean Standard deviation
N=120
Amount spent on f & v (N) 300.00 3200.00 1617.00 773.00
Total expenditure (N)/month 20000.00 110000.00 54850.00 26047.00
No of children 0.00 6.0 2.0 1.3
No of adult males 0.00 13.0 1.4 1.5
No of adult females 1.0 5.0 1.3 0.80
Age of household head (years) 32.0 60.0 47.0 8.0
No. of years spent in formal
education by household head
(years)
6.0
16.0
12.0
3.4
Source: Computations from Field Survey, 2008/2009.
As shown in Table 4.1, among the urban respondents, the average amount of
money spent by households in the consumption of fruits and vegetables was
N1617.08, with a minimum of N300.00 and a maximum of N3200.00 on fruits
and vegetables per month. The minimum monthly expenditure was N20, 000.00
while the maximum monthly expenditure was N110, 000.00. The households
had a mean expenditure of N58, 850.00. The urban households had a maximum
of six children, having an average of 2 children, and a standard deviation of 1.3.
The average number of adult males was one (1.4) while that of females was also
one (1.3). The minimum age of the household head was 32 years while the
maximum was 60 years, having an average of 47 years. The average educational

63
attainment or number of years spent in school by the household heads in the
urban areas was 12.7, having attended a minimum of six years and a maximum
of 16 years in school. From the result, it could be inferred that the urban
respondents had monthly income exceeding the minimum wage of the Nigerian
worker, average family size, the household head was of average age and had
acquired or spent a reasonable number of years in school, an average of them
having a secondary school certificate and made purchases of at least to the tune
of N1500.00 per month.
Table 4.2: Socio-economic characteristics of the rural respondents in Enugu State
Variables Minimum Maximum Mean Standard
Deviation
N=120
Amount spent on f & v (N) 00.00 1900.00 579.7917 348.36
Total expenditure (N)/month 15000.00 78000.00 42937.50 20709.99
No of children 0.00 6.0 1.9 1.3
No of adult males 1.00 8.0 1.4 1.4
No of adult females 1.00 5.0 1.4 0.9
Age of household head (years) 35.0 62.0 45.0 7.3
No. of years spent in formal
education by household head (years)
6.0 14.0 10.2 3.1
Source: Computations from Field Survey, 2008/2009.
In the rural areas, as shown in Table 4.2, the respondents spent an average of
N579.79 per month on fruits and vegetables. Their minimum monthly
expenditure was N15, 000.00 and maximum expenditure was N78, 000.00 with

64
an average of N42937.50. The average number of children was approximately
2, with a standard deviation of 1.3. The minimum number of adult males was
one while the maximum number was eight. The rural respondents had a
minimum number of one and maximum number of five adult females. The
average age of the household head was approximately 45 years with a
maximum age of 62 years. The minimum number of years spent in school by
the household head was six years; the maximum was 14 years while the average
was 10 years. By implication, the households in the rural areas possessed a
minimum monthly income which was also above that of the minimum wage of
an average civil servant in Nigeria, had a maximum number of eight adult
males, five adult females, with an average household head age of 45 years who
can at least read and write.
4.2: Types and Quantities of Fruits and Vegetables Consumed by the
Households.
In the study area, some common fruits and vegetables which are generally
consumed were studied. The types and quantities consumed are presented
below.

65
Table 4.3: Types and quantities of fruits and vegetables consumed by households.
Fruits
Average Qty(Kg)
Urban Rural
Vegetables Average Qty(Kg)
Urban Rural
n=120 n=120
Citrus 32.16 24.26 Telferia 30.0 38.09
Mango 30.88 23.34 Tomatoes 27.02 30.42
Plantain/Banana 28.20 19.63 Onions 30.42 26.43
Pineapples 30.33 15.25 Garden eggs 23.07 25.20
Papaya 32.18 13.10 Okra 20.0 27.88
Star apple 13.32 10.15 Oha 8.55 12.68
Source: Computations from Field Survey, 2008/2009.
Among the fruits, citrus was the most consumed in the urban areas. It recorded
an average of 32.16 kg/month as against 24.26kg/month in the rural areas. This
was closely followed by mango with an average consumption of 30.88 kg in the
urban areas and 23.34kg in the rural areas. The urban households consumed an
average of 28.20 kg of plantain/banana, while, in the rural areas it was 19.63kg.
Pineapples, papaya and star apple consumption recorded an average of 30.33kg,
32.18kg and 13.32 kg respectively in the urban areas, whereas, it was 15.25kg,
13.10kg and 10.15kg for pineapples, papaya and star apples respectively in the
rural areas. Although, the respondents indicated to have consumed other types
of fruits like cashew, guava, avocado pear, local pear, including some they
described as “bush fruits”, they could not ascertain the level of consumption of
these ones.
Telferia accounted for the highest consumed vegetable among the rural
households. On the average 38.09 kg per month was consumed, while in the

66
urban areas, it was 30.0kg per month. The respondents in the urban households
indicated to have consumed 27.02 kg of tomatoes, while, their rural counterparts
consumed 30.42kg. Onions recorded an average consumption of 30.42 kg per
month in the urban areas and 26.43kg in the rural areas. Garden eggs, okra and
oha consumption was 23.07 kg, 20.0kg and 8.55 kg respectively in the urban
areas,25.20kg, 27.88 kg and 12.68kg respectively in the rural areas. Like in the
case of fruits, households also consumed some other vegetables like lettuce,
cabbage, spinach, bitter leaf, okazi and cucumber sometimes, but cannot
actually estimate the quantities consumed per month. By implication,
households in the urban areas consumed more of fruits than vegetables while
those in the rural areas consumed more of vegetables than fruits.
4.3 Fruit and Vegetable Consumption Patterns in Urban and Rural
Households of Enugu State, Nigeria.
The consumption patterns which included the season, quantities, amount spent
on the purchase of the fruits and vegetables as well as the prices of the fruits and
vegetables in the urban and rural areas of Enugu State is presented in Table 4.4
below.

67
Table 4.4: Fruit and vegetable consumption in urban and rural households in Enugu
State.
Dry season Rainy season
Fruits Urban
N=120
Rural Urban Rural
N=120
Average amount spent (N) 970.42 445.67 979.58 447.67
Average Quantity kg/hh (month) 17.8 9.8 15.32 12.87
Average Price of fruits (N) 905.25 259.75 925.72 280.45
Total expenditure (N) hh (month) 40,848.33 33,463.33 40,848.33 33,463.33
Vegetables
Average amount spent (N) 863.75 965.50 820.77 850.52
Average Quantity (kg/hh) 8.68 23.29 6.98 28.43
Average Price of vegetables (N) 692.21 765.83 703.42 690.54
Total expenditure (N) (hh/month) 55,725.00 40,316.67 55,725.00 40,316.67
Note: All values are mean values
Source: Computations from Field Survey, 2008/2009.
The result in Table 4.4 has shown that the average quantity of fruits consumed
per household per month in the urban areas was higher than that consumed in
the rural areas in both the rainy and dry seasons. However, the situation was
different for vegetable consumption as the quantity consumed was higher in the
rural than in the urban areas.
The result could be interpreted to mean that larger quantities of fruits are moved
from the rural areas, where they are produced, to the urban centres whereas the

68
bulk of the vegetables produced are consumed in the rural areas because of their
high perishability. Price differences also indicate that average prices for fruits
are higher in the urban areas than in the rural areas. Given this result, it is
implied that since prices of fruits were higher in the urban centres, those at the
rural areas preferred to take them there in order to make more money.
However, this result must be interpreted with caution because the average price
of vegetables was also higher in the urban areas same as the fruits. It might be
plausible to conclude that the higher consumption stemmed from better
knowledge of the nutritional and health benefits of fruits by the urban dwellers
who were better informed. However, higher income maybe a factor. There were
also seasonal differences. There seemed to be higher consumption of fruits in
both the urban and rural areas during the dry season than during the rainy
season. Whereas, consumption of vegetables was higher during the rainy season
than that of fruit.
4.4 Paired Sample Test on the Differences between the Consumption of
Fruits and Vegetables in both Urban and Rural Areas of Enugu
State.
The result of the paired sample differences which employed the paired z-
statistic in testing the differences in the consumption of fruits and vegetables in
the urban and rural areas of Enugu State is shown below.

69
Table 4.5: Paired sample test on the differences between the consumption of fruits and
vegetables in both urban and rural areas of Enugu State.
Fruits
variable
Individual
mean
Paired mean 95%
confidence
Interval of the difference
Difference Lower Upper
Urban 505.000
-781.08333 -8.638 960.13138 602.03525
Rural 1286.0833
Urban 42.2250 -4.18333 -4.799 -5.90948 -2.45719
Rural 46.4083
Source: Computations from Field Survey, 2008/2009.
Table 4.5 showed that there were significant differences in the individual means
for fruit and vegetable consumption in urban and rural areas of Enugu State,
with a mean difference of 781.083 and 4.183 respectively. Given this result,
hypothesis (i) which stated that there was no significant difference between the
consumption of fruits and vegetables in urban and rural areas of Enugu State of
Nigeria has been rejected.
4.5: Budget Shares of Fruits and Vegetables in Urban and Rural
Households in Enugu State.
The budget share estimates obtained using the approach proposed by Deaton
and Muellebauer (1980) is presented below.

70
Table 4.6: Estimated budget share of fruits and vegetables among households in urban and rural areas.
Urban Rural
Fruits 0.0985 0.0671
Vegetables 0.0849 0.0690
All Fruits (pooled) 0.0828
All Vegetables (pooled) 0.0769
Note: All (pooled) stands for both urban and rural areas.
Source: Computations from Field Survey, 2008/2009.
Table 4.6 shows the estimated budget shares by households on fruits and
vegetables in Enugu State. From the result, it could be seen that the household
budget share for both fruits and vegetables were less than 10 percent. This
suggests that households do not allocate much of their income on the
consumption of fruits and vegetables. According to Mueller et al;(2001), the
ICP data on fruits and vegetables account for 11 percent of the budget for low
income countries, defined as those whose income are less than 15 percent of
that of the United States of America. The result also indicated that the budget
shares for fruits and vegetables were higher in the urban areas than in the rural
areas. This may be as a result of differences in income. Many studies have
shown that income levels are higher in the urban areas compared to those in the
rural areas (World Bank, 1994; Mueller et al; 2001 and Minot, 2002). Besides,
given the fact that fruits and vegetables are regarded as expensive sources of
energy compared to other staples like garri, yam, etc, it therefore, seems

71
unlikely that these households, particularly, those in the rural areas allocated
more of their budgets to these fruits and vegetables. This result, indicating a
lower budget share for fruits and vegetables, particularly in the rural areas did
not come as a surprise.
Furthermore, the result showed that households allocated more of their budgets
to fruits than vegetables. This might be because fruits seem to be more
expensive than vegetables.
4.6: Determinants of Fruit and Vegetable Consumption among Urban and
Rural Households in Enugu State.
The estimates of the determinants of fruit and vegetable consumption among the
urban and rural households using the Working – Leser model are presented
below. The presentations were as follows:
4.6.1 Determinants of fruit consumption among the urban households of Enugu
State.
4.6.2 Determinants of vegetable consumption among the urban households of
Enugu State.
4.6.3 Determinants of fruit consumption among the rural households of Enugu
State.
4.6.4 Determinants of vegetable consumption among the rural areas of Enugu
State.

72
4.6.1 Determinants of fruit consumption among the urban households of
Enugu State.
The estimates of the determinants of fruit consumption among urban households
obtained using the Working – Leser functional form is presented below:
Table 4.7: Estimates of the determinants of fruit consumption among urban households
in Enugu State, Nigeria.
Variable Coefficient Standard error t-values
Constant -9770.31 1123.774 -8.694***
Total monthly
expenditure (₦) 777.968 90.468 8.600***
Number of children
(persons) -69.690 58.492 -1.157
Number of adult males
(persons) 40.883 56.213 0.727
Number of adult females
(persons) -283.890 101.648 -2.793***
Age of household head
(years) 509.774 151.770 3.359***
Education of household
head(years) -280.766 102.681 -2.734***
Price (₦) 267.531 46.429 5.762***
Season (dummy) -516.217 83.359 -6.193***
Sex (dummy) 310.340 64.782 4.791***
R2
0.916
Adjusted R2
0.909
F-ratio 123.870
SE estimate 227.935
Note: *10% level of significance; **5% level of significance;***1% level of significance
Source: Computations from Field Survey, 2008/2009.

73
The estimates of the determinants of fruit consumption among the urban
households indicated that total monthly expenditure, number of adult females,
age of the household head, educational attainment, price of fruits, season and
sex were all significant at one percent probability level with different signs.
Total monthly expenditure was positive and significant at 99 percent confidence
level. This meant that any increase in the monthly expenditure of these
households would lead to increases in the budget share for fruits. By
implication, the coefficient of 777.968 means that any 7 percent increase in
expenditure would lead to a one percent increase in the consumption of fruits.
This result consolidates that of Damianos and Demousssis (1992) in their study
on the consumption of Mediterranean fruits and vegetables. Similarly, given the
positive coefficients, fruits could be regarded as normal goods.
The coefficient of adult females was negative but significant at one percent
level. This implied that as the number of adult females increased, there would
be a decrease in the budget share for fruits. This could probably mean that as
adult female members increases, there is the tendency to allocate more of the
family budgets to other items outside fruits.
Age of the household head was positive and significant at one percent
probability level. This result meant that with increasing age of the household
head, there is the probability of increased budget share for fruits in the urban
areas of Enugu State. The result is consistent with that of Correaleita et al;
74
(2003) in their study on dietary and nutritional patterns in an elderly population
in Italy.
Educational attainment of the household head was significant at one percent
probability level with a negative sign. Although education exposes people to
nutritional benefits of different types of food including fruits, however, the
negative sign in this result may mean that increasing responsibilities such as
fees for children’s education, rent, feeding, etc, must be addressed first and thus
a reduction in the budget share for fruits.
The coefficient of price was also significant at one percent probability level
with a positive sign. This could be interpreted to mean that an increase in the
price of fruits would to an increase in the household budget share for fruits in
the study area.
Seasonal variable which was dummied exhibited significance at one percent
level but had a negative sign. This implied that budget shares for fruits tended to
reduce with season, in this case during the dry season. Some studies have
shown that availability of fruits and vegetables is influenced by season,
abundance of fruits during the dry season and vegetables during the rainy
season (Omueti and Adepoju, 1998; Nelson, 1990; Bokeshemi and Njoku,
1997). The implication is that because the abundance of fruits at peak periods,
the price of fruits could fall which could in turn lead to a reduction in budget
share for fruits.

75
Sex which was also dummied had a significant and positive relationship at one
percent level of probability. This suggested that the more males in the
household, the higher the budget share for fruits. In other words, males
consumed more fruits than females. This result is similar to that obtained in Iran
by Mohammadifard et al; (2006), where they reported that married men and
single women consumed greater amounts of fruits and vegetables compared to
married and single women respectively. This result is in contrast with some
other previous studies like Tippet et al; (1995); Krebs- Smith et al ;( 1996);
Wenlock (1987) and Raynolds et al; (1999).
The R2 value was 0.916 while the adjusted R
2 was 0.909. This implied that 91.6
percent of the variables in the dependent variable were explained in the model,
whereas 90.9 percent of the dependent variable can be based on the predictors
which are the independent variables. The F- ratio was 123.870 and is significant
at one level and this measured the overall significance of model confirming it as
a good fit for the model.

76
4.6.2 Determinants of vegetable consumption among the urban households
of Enugu State.
The determinants of vegetable consumption among urban households obtained
using the Working – Leser functional form is presented below:
Table 4.8: Estimates of the determinants of vegetable consumption among urban
households in Enugu State, Nigeria.
Variable Coefficient Standard error t-values
Constant 6.625 0.115 57.576***
Total monthly
expenditure (₦) 0.599 0.039 15.179***
Number of children
(persons) -0.033 0.010 -3.359***
Number of adult males
(persons) -0.007 0.013 -0.562
Number of adult
Females(persons) -0.040 0.014 -2.791***
Age of household
head (years) -0.010 0.002 -5.275***
Education of household
head(years) 0.032 0.006 5.260***
Price (₦) -3.24E-005 0.000 -0.954
Season (dummy) -0.097 0.061 -1.579
Sex (dummy) 0.118 0.059 1.991*
R2
0.946
Adjusted R2
0.942
F-ratio 214.347
SE estimate 0.13005
Note: *10% level of significance; **5% level of significance; ***1% level of significance
Source: Computations from Field Survey, 2008/2009.

77
Estimates of the determinants of vegetable consumption among households in
the urban areas of Enugu State, indicated that total monthly expenditure,
number of children, number of adult females, age of the household head,
education of the household head and sex were significant at different levels of
probability with different signs.
Total monthly expenditure was significant at one percent level of probability
with a positive sign. By implication, the coefficient of 0.599 indicated that any
0.059 percent increase in expenditure will lead to a one percent increase in
budget share for vegetables among households in the study area. This result is in
line with Damianos and Demoussis (1992).
The coefficient for number of children was significant at one percent level with
a negative sign. This meant that there is a negative relationship between the
number of children and budget share for vegetables. Given this result, as the
number of children increased, budget share for vegetables reduces. Similarly,
the number of adult females was significant at one percent probability level with
a negative sign, also, implying a negative relationship between the variable and
budget share for vegetables. This negative relationship was also found by
Kushwaha et al; (2007) in their study on the current trends in vegetable
consumption in Nigeria: a case study of consumption pattern in Kano State.
Age of the household head was significant at one percent level with a negative
sign. This implied that with increasing age of household heads, budget shares

78
for vegetables would reduce. This result is in conformity with Rasmussen et al;
(2006), but in contrast with Correalleita et al; (2003).
Educational attainment of the household head was significant at one percent
level of probability with a positive sign. This means that with increasing
educational attainment of the household head, the probability of household’s
budget share for vegetables increases. For the fact that education enabled people
to have access to greater information on the nutritive values of different food
types including vegetables, the result is expected and is consistent with
Babatunde et al; (2007) and Njoku (1989). The coefficient of sex was
significant at 10 percent level and with a positive sign. This meant that males
consumed more vegetables than females and thus more budget shares for
vegetables than females. The result is in line with Mohammadifard et al ;( 2006)
and Blanck et al; (2007).
The R2
value is 0.946, implying that 94.6 percent of the variability was
explained in the model. The adjusted R2 was 0.942 which means that 94.2
percent of the dependent variable was based on the predictors of the
independent variables. The F- ratio was 214.347 and is significant at one
percent level, signifying the overall significance of the model.

79
4.6.3 Determinants of fruit consumption among the rural households of
Enugu State.
The estimates of the determinants of fruit consumption among rural households
obtained using the Working – Leser functional form is presented below:
Table 4.9: Estimates of the determinants of fruit consumption among rural households
in Enugu State, Nigeria.
Variable Coefficient Standard error t-values
Constant 3.023 1.920 1.575
Total monthly
expenditure (₦) -0.471 0.260 -1.815*
Number of children
(persons) -0.085 0.042 -2.024*
Number of adult
males(persons) -0.004 0.070 -0.056
Number of adult
females(persons) 0 .072 0.093 0.767
Age of household
head (years) 0.876 0.451 1.942*
Education of household
head(years) 0.779 0.268 2.907***
Price (₦) -0.689 0.065 -10.713***
Season (dummy) -0.641 0.272 -2.357**
Sex (dummy) -0.125 0.121 -1.031
R2
0.744
Adjusted R2
0.716
F-ratio 27.064
SE estimate 0.36660
Note: *10% level of significance; **5% level of significance;***1% level of significance
Source: Computations from Field Survey, 2008/2009.

80
Among the rural households, number of children, age of the household head,
education of the household head, price of fruits and season were all significant
at various levels of probability with different signs.
The coefficient of number of children was significant at 10 percent level of
probability with a negative sign. This implies that as the number of children
increased, the less the budget share for fruits in the rural households of Enugu
State. Given the fact that children engaged in indiscriminate harvesting of these
fruits in the rural areas, particularly at peak periods, and the tendency of getting
satisfied outside homes, the result seems plausible.
Age of household head was also significant at 99 percent confidence level with
a positive sign. This result meant that increasing age of the household head
could lead to increase in the budget share for fruits. According to Thompson et
al; (1999); Whichelow and Prevost (1996) and Correaleita et al; (2003), with
increasing risk of chronic diseases especially cardiovascular diseases at older
ages, people find additional incentive to consume fruits for their health benefits.
However, this findings contradicts that of Rasmussen et al ;( 2006).
Educational attainment of the household head was also significant at one
percent level of probability with a positive sign. This result implied that there is
a positive relationship between education of the household head and budget
share for fruits among rural households. This result consolidates those of
Babatunde et al; (2007) and Njoku (1989).
81
The coefficient of price was significant at one percent probability level.
However, this result exhibited a negative relationship with budget share. The
coefficient of 0.698 means that any 0.0698 percent increase in price of fruit
could probably lead to a one percent reduction in the household budget share for
fruits. Given the fact that starchy foods were major staples, it seemed unlikely
that households, particularly those in the rural areas, would be able to increase
their spending on fruits; and so would not prefer to substitute fruit consumption
for these other starchy foods.
The coefficient of season was negatively signed but significant at one percent
probability level. This meant that as rainy season sets in, the households’ budget
share for fruit increases. This probably could be as a result of price increase
arising from not being abundant. This result is in line with previous studies as
(Omueti and Adepoju, 1998; Nelson, 1990; and Bokeshemi and Njoku, 1997).
This result is also the same as that obtained in the urban areas. The R2 value
was 0.744, implying that 74.4 percent of the variability has been explained in
the model. The adjusted R2 was 0.716, meaning that 71.6 percent of the
predictors were based on the independent variables. The F- ratio was 27.064
which is significant at one percent level and shows the overall performance of
the model.

82
4.6.4 Determinants of vegetable consumption among the rural households of Enugu State.
Below are the estimates of the determinants of vegetable consumption among
rural households obtained using the Working – Leser functional form.
Table 4.10: Estimates of the determinants of vegetable consumption among rural
households in Enugu State, Nigeria.
Variable Coefficient Standard error t-values
Constant -16.774 2.494 -6.725***
Total monthly
expenditure (₦) 1.189 0.202 5.892***
Number of children
(persons) -0.107 0.124 -0.685
Number of adult males
(persons) 2.200 0.540 4.074***
Number of adult
females(persons) -0.864 0.254 -3.400***
Age of household
head (years) 0.505 0.127 3.976***
Education of household
head(years) 1.763 0.231 7.626****
Price (₦) 0.408 0.140 2.747***
Season (dummy) -0.166 0.140 -1.181
Sex (dummy) -0.166 0.128 -1.296
R2
0.644
Adjusted R2
0.602
F-ratio 15.280
SE estimate 0.498
Note: *10% level of significance; **5% level of significance; ***1% level of significance
Source: Computations from Field Survey, 2008/2009.

83
Among the rural households, total monthly expenditure, number of adult males,
number of adult females, age of the household head, education of the household
head, and price of vegetables were all significant all 99 percent confidence
level with different signs and therefore major determinants of vegetable
consumption in the study area.
Total monthly expenditure was significant at one percent level with a positive
sign. This implied that as household’s total monthly expenditure increases,
budget share for vegetables increases; and thus increases in consumption among
households. This result is in line with Damianos and Demoussis (1992), and
those in the urban areas in this present study.
Number of adult males was also significant at one percent probability level with
a positive sign. This meant that more number of males in the household leads to
a higher consumption of vegetables and thus higher budget share for vegetables.
This result is consistent with Blanck et al; (2007) who stated that males
consumed more fruits and vegetables than women in their study on fruit and
vegetable consumption among adults.
Number of adult females was also significant at one percent probability level
but with a negative sign. This implied that as the number of females increases,
budget share for vegetables reduces and so consumption. This is in line with
Kushwaha et al; (2007).

84
Age of the household head was a significant determinant of vegetable
consumption among the rural households at one percent probability level with a
positive sign. This meant that increased consumption of vegetables is increased
with increasing age of the household head. It has been known that with
increasing risk of chronic diseases especially cardiovascular diseases at older
ages, people find additional incentive to consume fruits and vegetables for their
health benefits. Similar results have been found in the past by Thompson et al;
(1999); Whichelow and Prevost (1996) and Correaleita et al ;( 2003) in their
studies on the health education authority’s health and lifestyle survey 1993: who
are the low fruit and vegetable consumers; dietary patterns and their association
with demographic lifestyle and health in a random sample British adults and
dietary and nutritional patterns in an elderly population in northern and southern
Italy: a cluster analysis of food consumption respectively.
The result showed a positive association between education of the household
head and the budget share of households for vegetables at one percent
probability level. This suggested that increasing education of the household
head would lead to increase in the budget share for vegetables. This result is in
line Rasmussen et al; (2006) in their study on the determinants of fruit and
vegetable consumption among children and adolescents: a review of the
literature. Part 1 qualitative studies and Pollack (2001) in a study on consumer
85
demand for fruit and vegetable: the USA example. Changing structure of global
food consumption and trade.
The coefficient of price was significant at one percent level and possessed a
positive sign. This indicates that as prices increased, budget shares for
vegetables increased. The coefficient of price being 0.408 also implied that
price increase of 0.041 percent would lead to a one percent increase in the
budget share for vegetables. R2
value was 0.644, adjusted R2 0.602 and the F-
ratio 15.280. These values implied that 64.4 percent of the variability was
explained by the explanatory variables in the model; 60.2 percent of the
dependent variable was based on the predictors of independent variable and the
15.280 for the F-ratio was significant at one percent level which measured the
overall performance and goodness of fit of the model respectively.
In testing hypothesis (ii) and (iv), which stated that the determinants of the
consumption of fruits and vegetables are not the same in the urban and rural
areas, and households’ socio-economic characteristics have no effect on the
consumption of fruits and vegetables in the study area, the significant variables
in the regression results were used. Given that the calculated t-test in the
variables were greater than the t-tabulated, the hypotheses were therefore
rejected.

86
4.7. Income Elasticities for Fruits and Vegetables in Urban and Rural
Areas of Enugu State.
The results of the income elasticities which were derived from the coefficients
of the regression are presented in the Table 4.11below.
Table 4.11: Income elasticities for fruits and vegetables in Enugu State.
Urban Rural
Fruits 0.60 0.47
Vegetables 0.60 0.49
*All fruits (pooled) 0.70
*All vegetables (pooled) 0.51
*All stands for both urban and rural areas.
Source: Field Survey, 2008/2009.
In Table 4.11, the income elasticities of demand for fruits and vegetables in
urban and rural areas as well as combined fruits and vegetables are presented. In
all, income elasticities of demand for fruits and vegetables both in urban and
rural and those of combined were lower than one. They ranged between 0.47
and 0.70.This implied that a one percent increase in income was associated with
a 0.47 percent to 0.70 percent increase in the total budget share allocated to
fruits and vegetables. Income elasticity of 0.60 was the same for both fruits and
vegetables in the urban areas; while they were 0.47 and 0.49 for fruits and
vegetables, respectively, in the rural areas. These findings suggested that fruits

87
and vegetables were normal goods but necessities. It also meant that as income
increased spending on fruits and vegetables increased less in proportion to the
income increase. This result is consistent with Ruel e t al, (2004) and Claro et
al, (2007). The estimated expenditure (income) elasticities for fruits in urban
and combined fruits were greater than those of fruits and vegetables in the rural
areas and combined vegetable. This scenario suggested that as income
increased, the demand for fruits was likely to increase faster than the demand
for vegetables. This is particularly true because as shown in table 4.11, one
percent increase in income was likely to cause an increase in the demand for
fruits by between 0.60-0.70 percent as against the demand for vegetables which
was likely to increase by between 0.49 and 0.51 percent. The income elasticity
was higher in the urban areas for both fruits and vegetables than in the rural
areas. The differences ranged between 0.11and 0.13.
In testing hypothesis (iii) of the study, t-calculated was 8.600 and greater than t-
tabulated of 2.617. Using the decision rule which stated that if the absolute
value of calculated test statistic is greater than the absolute value of the
tabulated test statistic; null hypothesis will be rejected in favour of the alternate
hypothesis (Eboh, 2009). Following this, the hypothesis (iii) above which stated
that there is no significant difference in the demand elasticities for fruits and
vegetables in urban and rural areas have been rejected.

88
CHAPTER FIVE
5.0 SUMMARY, CONCLUSION AND RECOMMENDATIONS.
5.1 Summary
This study was carried out with the view to evaluate the patterns and
determinants of fruit and vegetable consumption in urban and rural areas of
Enugu State, Nigeria. Two urban and two rural areas were selected for the
study; one hundred and twenty respondents each from the urban and rural areas
bringing the total number of respondents to two hundred and forty respondents.
Descriptive statistics, budget share analysis, Working –Leser functional form
which was subjected to OLS and paired z-statistic were used in analyzing the
data. The variables considered in the study were budget share for fruit and
vegetable as dependent variable, while total monthly expenditure, number of
children, number of adult males, number of adult females, age of household
head; education of household head, price of commodity, season and sex were
the independent variables.
The major findings were: The average number of children were two, average
number of adult males and females one, average age of the household head
was 45 years, average number of years spent in school by the respondents was
11 years, average total expenditure was N48, 020.00,and average price of
products N755.95. Citrus, mango, plantain/banana, pineapples, papaya, and star
apples were the mostly consumed fruits, recording an average of 32.16kg,

89
30.88kg, 28.20kg, 30.33kg, 32.18kg, and 13.32kg, respectively in the urban
areas. It was 24.26kg, 23.34kg, 19.63kg, 15.25kg, 13.10kg, and 10.15kg,
respectively for those households in the rural areas. Telferia, tomatoes, onions,
garden eggs, okra, and oha were the major vegetables consumed, recording an
average consumption of 30.0kg, 27.02kg, 30.42kg, 23.07kg, 20.00kg, and
8.55kg among the urban households. Among the rural households, telferia
recorded an average of 38.09kg; tomatoes had 30.42kg; 26.43kg for onions;
garden eggs recorded 25.20kg; okra with an average of 27.88kg and oha having
an average of 12.68kg. The average monthly consumption of fruit per
household during the dry season was 17.8kg and 9.8kg for urban and rural
areas, respectively while the average monthly consumption per household of
fruits during the rainy season was 15.32kg and 12.87kg for urban and rural
areas, respectively. It was 8.68kg for urban areas and 23.29kg for rural areas for
vegetables during the dry season while it was 6.98kg for urban areas and
28.43kg for rural areas per monthly per household during the rainy season. The
average budget share of fruits was 0.0985 for urban and 0.0671 for rural areas.
The budget share was 0.0849 for vegetables for households in the urban areas
and 0.0690 for those in the rural areas. When pooled together, it was 0.0828 for
fruits and 0.0769 for vegetables.
Household’s total monthly expenditure (income), number of adult females, age
of household head, education attainment of the household head, price, season

90
and sex which were dummied was major determinants of fruit consumption in
the urban areas. While total monthly expenditure (income), number of children,
number of adult females, age of household head, educational attainment of
household head, and sex were major determinants of vegetable consumption in
the urban areas. In the rural areas, number of children, age of household head,
educational attainment of the household head, price of fruits and season were
determinants of fruits while the total monthly expenditure (income), number of
adult males, number of adults females, age of household head, educational
attainment of the household head, price of vegetables were major determinants
for vegetable consumption. All these were significant at various levels ranging
from 1 – 10 percent with different signs.
Income elasticities were below one; ranging from 0.47 to 0.70. The income
elasticity for fruit in urban areas was 0.60 and 0.47 in the rural areas. It was
0.60 for vegetables in the urban areas and 0.49 in the rural areas. All fruits were
0.70 and all vegetables were 0.51.All, in this case means both urban and rural
areas. The result of the hypotheses showed that there is a significant difference
between fruit and vegetable consumption in urban and rural areas, there is
significant difference in the demand elasticities for fruits and vegetables in
urban and rural areas and that the socio-economic characteristics of the
respondents have effects on the consumption of fruits and vegetables in the
study area.

91
5.2 Conclusion
The study has also shown that fruits and vegetables were normal goods, given
that their income elasticity was positive though less than one.
Furthermore, the results have shown some of the determinants of fruit and
vegetable consumption and budget share for fruits and vegetables among
households in urban and rural areas of Enugu State, Nigeria and there exist a
significant difference in consumption of fruits and vegetables in the urban and
rural areas of the state.
5.3 Recommendations
i. There is a need for policies to promote and support fruit and vegetable
consumption. This could be in the form of education and behaviour
change programmes to promote fruit and vegetable consumption. Such
should be based on local knowledge regarding the demographic and
socio-cultural factors that may affect consumer choice.
ii. Given the fact that many households especially poor households
allocate a large share of their income to the purchase of starchy
staples, there is need for efforts to be intensified towards increasing
the income of the people. Arising from the findings of this study that
an increase in the income could lead to an increase in the budget share
for fruit and vegetable, there is then the tendency that an increase in
income will reflect in greater consumption. It seems very unrealistic to
92
advise poor households to spend their scarce resources on fruit and
vegetable as against satisfying their daily household energy
requirements and other needs.
iii. Attention should focus on the processing of fruits and vegetables into
forms that can be stored. This will reduce post-harvest losses as well
as making fruits and vegetables almost available all seasons and
affordable.
iv. Fruit and vegetable production should be encouraged particularly in
the rural areas. In the same vein, feeder roads should be built and
already built ones maintained. This will help transport these produce
to the urban areas. This will also promote availability and affordability
of these products.
v. It is also recommended that further studies should be made on the
subject matter, particularly in the area of quantity of fruits and
vegetables consumed by each member in the household as well as
their consumption according to their ages.

93
REFERENCES
Abay, A. (2007). Vegetable Marketing Chain Analysis in the Case of Fogera
Wereda, in Amehara National Regional State of Ethiopia. An M.Sc
Thesis Presented to School of Graduate Studies of Haramaya University.
Adish, A. (2009). Consequences of Micronutrient Deficiencies in Africa: Why
we have to act. Micronutrient initiative.www.micronutrient.org
Agwu, N.M. (2000). The Demand for Selected Meat Types among Households
in Enugu Metropolis of Enugu State; Nigeria. An unpublished M.Sc
Thesis, Dept. of Agricultural Economics, University of Nigeria, Nsukka.
Aletor, M.U. and O.A. Adeogun (1995). Nutrient and Anti- nutrient
Components of Some Tropical Leafy Vegetables. Food Chemistry 53:375 – 379
Ali, M. and S.C.S. Tsou (1999).Combating Micronutrient Deficiencies through
Vegetables-a Neglected Food Frontier Asia. Food Policy 22:18-38.
Alves, D.,R. Disch and R. Evenson (1982). The Demand for Foods in Brazil.
Anais do IV Encontro Brasileiro de Eonometria. Águas de São Pedro.
Aromolaran, A.B. and J.A. Igharo (1998). Analysis of Household Consumption
Pattern of Animal Products in South Western Nigeria. NSAP/WASAP Confr. Papers Proceedings. March, 21 – 26. Pp. 458 – 459.
Asano, S. and S. Fiusa (2003). Estimation of the Brazilian Consumer Demand
System. Brazilian Review of Economics, Rio de Janeiro, 23: 255-294.
Attanasio, O(1999).Consumption Demand in J. Taylor and M. Woodford (eds.),
Handbook of Macroeconomics .Amsterdam: Elsevier Science.
AVRDC (1996). Combating Micronutrient Deficiency Through Vegetables.
AVRDC Center Point, Vol. 14 (1): 4 – 5, Asian Vegetables Research and Development Centre, Shanhua, Taiwan. ROC.
Babatunde, R.O; O.A. Omotesho and O.S. Sholotan (2007). Scio-Economic
Characteristics and Food Security Status of Farming Households in
Kwara State, North Central, Nigeria. Pakistan Journal of Nutrition 6(1): 49 – 58.

94
Bamuol, W.J. (1977). Economic Theory and Operation Analysis. Prentice hall
Inc., Eaglewood Cliffs, New Jersey, USA.
Bandura, A. (1986). Social Foundation of Thought and Action; a Social Cognitive Theory. Englewood Cliffs. NJ USA Prentice Hall.
Barten, A.P. (1969). Maximum Likelihood Estimation of Complete System of
Demand Equations.” European Economic Review 1:7-73.
Battistin, E., R. Blundell and A. Lewbel (2007). Why is Consumption More Log
Normal than Income? Gibrat’s Law Revisited. IFS Working Papers WP08/07, London, U.K., The Institute for Fiscal Studies.
Bergman, D. (1984). North-South Balances and Conflicts within a Community
– European Review of Agricultural Economics 11(2): 151 – 157.
Blisard, N, J.N.Variyam and J.Cromartie (2003).Food Expenditures by United
States Households: Looking Ahead of 2020.Department of Agriculture.
Agricultural Economics Report No.821.Economic Research Service,
USA.
Block, G. B. Patterson and A. Subat (1992). Fruits, Vegetables and Cancer
Prevention. A Review of the Epidemiological Evidence: Nutrition and Cancer, 18 (1): 1 – 29.
Block, S. (2002).Nutrition Knowledge Versus Schooling in the Demand for
Child Micronutrient Status. Working Paper No.93.Centre for
International Development. Cambridge, M.A: Harvard University:
Cambridge.
Blundell, R., P. Pashardes and G. Weber (1993). What Do We Learn About
Consumer Demand Patterns from Micro Data? American Economic Review, 83: 570-597.
Bokeshemi, S.O.C. and Njoku, J.E. (1997). The Nigerian Agricultural
Environment on the Supply, Availability, Prices and Consumption of
Fruits and Vegetables: A Case Study of Imo State. A paper presented at
32nd
Annual Conference of the Agricultural society of Nigeria held at the
Federal College of Agriculture Isiagu, Ebonyi State.

95
Bosena, T. (2008). Analysis of Cotton Marketing Chains in the Case of Metema
Wereda, in Amehara National regional state of Ethiopia. An MSc Thesis
Presented to School of Graduate Studies of Haramaya University.
Brosig, S. (2000). A Model of Household Type Specific Food Demand
Behavior in Hungary. IAMO Discussion Paper, No. 30. Institute of
Agricultural Development in Central and Eastern Europe.Cambridge
University Press.
Caselli, F. and J. Ventura (2000). A Representative Consumer Theory of
Distribution. American Economic Review .90: 909–926.
Castaldo, A and B. Reilly (2007). Do Migrant Remittances affect the
Consumption Patterns of Albanian Households? South- Eastern Europe Journal of Economics 1:25- 54.
Centre for Disease Control and Prevention (1992). Recommendation for the use
of Folic Acid to Reduce the Number of Cases of Spina-befida and other
Neural tube defects. Morbidity and Mortality Weekly Report (RR – 14): 1 – 7 (Review).
Christensen, L.R., D.W. Jorgenson, and L.J. Lau. (1975). Transcendental
Logarithmic Utility Functions. American Economic Review 65 (3):367-
383.
Claro, R.M; Carmo, H.C.E., Machado, F.M. S. and Monteiro, C.A. (2007).
Income, Food Prices and Participation of Fruits and Vegetables in the
Diet. Revista de Saode Publica. 41(4): 1 – 8.
Correaleita, M.L; A. Nicolosi; S. Cristina; H. Hauser; P. Pugliese and G. Nappi
(2003). Dietary and Nutritional Patterns in an Elderly Rural Population in
Northern and Southern Italy: A Cluster Analysis of Food Consumption.
European Journal of Clinical Nutrition 57. 1514 – 1521.
Cranfield, J. T., J.E. Hertel and P. Preckel (1998). Changes in the Structure of
Global Food Demand. American Journal of Agricultural Economics, 80
(5): 1042-1050.
Croppenstedt, A. and Muller, C. (2000). The Impact of Farmers Health and
Nutrition Status on their Productivity and Efficiency: Evidence from
Ethiopia. Economic Development and Cultural Change, 48: 475 – 502.

96
Damianos, D. and Demoussis, M. (1992). Consumption of Mediterranean Fruits
and Vegetables: Outlook and Policy Implications. CIHEAM Options Mediterraneennes, Ser. A/n 19.
Daramola, A.M. (1998). Post Harvest, Handling of Indigenous Fruits and
Vegetables: a Paper Presented at the Meeting of Exports on Indigenous
Crops and Animal Research and Development in Nigeria.
David, A. 1990 cf ACC/SCN (1994). Controlling Vitamin A Deficiency.
Nutrition Policy Discussion Paper. No 14.
Davidson, P and B. Truswell (1975). Human Nutrition and Dietetics. 6th ed. Church-Hill Livingstone.
Davis, C.C. (1982). Linkages Between Socio-economic Characteristics, Food
Expenditure Patterns and Nutritional Status of Low Income Households:
A Critical Review. American Journal of Agricultural Economics. Vol. 64. No. 5. Pp. 101 – 105.
Deaton, A and A. Case (1981). Analysis of Household Expenditures. LSMS Working Papers No 28 Washington, DC. The World Bank Development
Research Department.
Deaton, A. and J. Muellbauer (1980). Economics and Consumer Behaviour. Cambridge University Press.
Deaton, A. and J. Muellbauer (1980a). An Almost Ideal Demand System.
American Economic Review 70(3):312-336.
Dey M.M. (2000). Analysis of Demand for Fish in Bangladesh. Aquaculture Economics and Management, 4: 65–83.
Dhehibi, B., and J. M. Gil. (2003). Forecasting Food Demand in Tunisia under
Alternative Pricing Policies. Food Policy 28 (April):167-186.
Dong, D. and Lin, B.H. (2009). Fruit and Vegetable Consumption by Low-
income Americans: Would Price Reductions make a Difference?
Economic Research Report No. 70. USA Department of Agriculture,
Economic Research Service. Pp. 1 – 17.
Duckworth, R.B. (1979). Fruits and Vegetables 2nd Ed. Pergamon Press Ltd.
Oxford. P. 3.

97
Eboh, E.C. (2009). Social and Economic Research: Principles and Methods. 2nd
Edition. African Institute for Applied Economics, Enugu.
www.aiaenigeria.org
Elsner, K. (1999). Analyzing Russian Food Expenditure Using Micro-data.
IAMO Discussion Paper, No. 23. Institute of Agricultural Development
in Central and Eastern Europe.
Engel, E. (1857). Die Produktions und Consumptions Verhaltnisse Konigreichs
Sachse .Zeitschrift des Statistisehen Bureaus des Koniglich Sachsischen Ministerium des Innern
Ezike, J.O. (1998). Delineation of Old and New Enugu State Bulletin, Lands
and Survey, Ministry of Works, Enugu.
Fabiosa, J.F and I.Soliman (2008).Egypt’s Household Expenditure Pattern:
Does it alleviate a Food Crisis? Working Paper 08-WP 475.Centre for Agriculture and Rural Development. Iowa State University.
Fafunso, M. and O. Bassir (1978). Effects of Cooking on the Vitamin C.
Content of Fresh Leaves and Witted Leaves. Journal of Agriculture, Food and Chemistry. 24:252 – 256.
Fagiolo, G., L. Alessi, M. Barigozzi and M. Capasso (2009). On the
Distributional Properties of Household Consumption Expenditures. The
Case of Italy. Empirical Economics.
Fan S., E .L. Wailes and G.L. Cramer (1995). Household Demand in Rural
China: A Two- Stage LES-AIDS Model. American Journal of Agriculture Economics, 77: 54–62.
FAO/WHO (1993). Energy Protein requirements. Report of a Joint FAO/WHO
Ad Hoc Expert Committee. WHO Technical Report Services 522:1 – 118.
Food and Agriculture Organisation (2008). Statistical Data Base.
Forni, M. and M. Lippi (1997). Aggregation and the Micro foundations of Dynamic Macroeconomics. Oxford: Oxford University Press.
Gallegati, M. and A. P. Kirman(1999). (eds.), Beyond the Representative Agent in Aldershot and Lyme eds: Edward Elgar, Publishers, London.
98
Gao X.M., E.J. Wailes and G.L.Cramer (1996). A Two-Stage Rural Household
Demand Analysis: Micro Data Evidence from Jiangsu Province, China.
American Journal of Agricultural Economics, 78: 604–613.
Gizachew Getaneh (2006). Dairy Marketing Patterns and Efficiency: A Case
Study of Ada’a liben district of Oromia region, Ethiopia. An Msc Thesis
Presented to the School of Graduate Studies of Alemaya University. 100p
Haley, M. M. (2001). Changing Consumer Demand for Meat: The U.S.
Example, 1970-2000.Changing Structure of Global Food Consumption
and Trade. Economic Research Service, United States Department of Agriculture, WRS-01-1.
Harats, D. Schevion; M. Natis; Y; D. Sagies; B. Berry (1998). Citrus Fruits
Supplementation Reduces Hypo Protein Oxidation in Young Men.
Presumptive Evidences for an interaction between Vitamin C and E
in Vivo.
Harris, B. (1982). The Marketed Surplus of Paddy in North Arcot District,
Tamil Nadu: A Micro-Level Causal Model. Indian J. Agric. Economics.
XXXVII (2): 145-158
Hartley, J. E. (1997). The Representative Agent in Macroeconomics. London
New York: Routledge,
Henderson, J.M. and R.E. Quandt (1980). Micro-economic Theory: A Mathematical Approach. MC Graw Hill Public Tokyo.
Hendry, D. F. (2000). Econometrics: Alchemy or Science? : Essays in Econometric Methodology Oxford: Oxford University Press.
Hoddinott, J and Y. Yahanner (2003). Dietary Diversity as a Food Security
Indicator. Food Consumption and Nutrition Division. IFPRI. Washington
DC. P. 21.
Holloway, G, Charles Nicholson, and Delgado, C. (1999). Agro
industrialization through Institutional Innovation: Transaction Costs,
Cooperatives and Milk-Market Development in the Ethiopian Highlands.
Mssd Discussion Paper No.35
Houthakkar, J.M. and L.D.Taylor (1970). Consumer Demand in U.S.A. Analysis and Projections. Cambridge Mass Havard University Press.

99
Huang J. and H. Bouis (1996). Structural Changes in the Demand for Food in
Asia. Food, Agriculture, and the Environment Discussion Paper, No. 11,
International Food Policy Research Institute, Washington, DC.
Ifon, E.T. and O. Bassir (1977) Cf ODO, C.E (2002). Effect of Sun Drying on
some Green Leafy Vegetables in Nigerian Ecosystem. Department of
Home Science and Nutrition U.N.N.
Ifon, E.T. and O. Bassir (1979). The Nutritive Value of Some Nigerian Leafy
Vegetables Part I Vitamin and Mineral Contents. Food Chemistry 4: 263 – 267.
Ihekoronye, A.I. and P.O. Ngoddy (1985). Integrated Food Science and Technology for the Tropics. Macmillan Publishers. London and
Basingstoke P. 263 – 267.
Iloeje, N.P. (1981). A New Geography of Nigeria. New Revised Edition, Longman Limited, Ikeja.
Independent National Electoral Commission (INEC) (2008). Nigeria Atlas of Electoral Constituencies. O.Y. Balogun (ed). Independent National
Electoral Commission, Abuja, Nigeria.
International Agency for Research on Cancer (2003). Handbooks of Cancer Prevention, Vol. 8. Fruit and Vegetables. Lyon, France, IARC Press.
International Vitamin A Consultative Group (IVACG) (1993).Towards
Comprehensive Programme to Reduce Vitamin A Deficiency. Report of
the 15th
IVACG Meeting, Arusha, Tanzania, March 8-12. Washington,
D.C: International Vitamin A Consultative Group.
Josy Iyn, M.A. and E.R. Hortzter (1985). The Availability of Ascorbic Acid in
Orange Juice and Guava. Journal of Nutrition. 30: 355 – 356.
Jorgenson, D.W., L.J. Lau, and T.M. Stoker. (1982). The Transcendental
Logarithmic Model of Aggregate Consumer Behavior. In R. Basman and
G. Rhodes eds., Advances in Econometrics, vol.1, Greenwich, Ct: JAI
Press.
Kaldor, N. (1961).Capital Accumulation and Economic Growth. In F. Lutz and
D. Hague, (eds.) The Theory of Capital .New York: St. Martin’s Press.

100
Kang, E. L. and W.S. Chern (2001). Effects of Model Specification and
Demographic Variables on Food Consumption: Microdata Evidence from
Jiangsu, China. Paper presented at World Food and Agribusiness Forum XI, International Food and Agribusiness Management Association,
Sydney, Australia, June 27-28.
Kindei Aysheshm (2007). Sesame Market Chain Analysis: The Case of Metema
Woreda, North Gondar Zone, Amhara National Regional State. An MSc
Thesis Presented to School of Graduate Studies of Haramaya University.
123pp.
Kirman, A. P. (1992).Whom or What Does the Representative Individual
Represent? Journal of Economic Perspectives (1992) 6, 117–136.
Kotler, P. (2001). Marketing Management. The Millennium Ed. 10th ed. Prentice Hall, India and USA.
Koutsoyiannis, A (1980). Modern Economic Theory, London. Macmillan Press.
Krebs-Smith, S.M., D.A. Cook, A.F. Subar, . Cleveland, J. Friday and L.L.
Kahle (1996). Fruit and Vegetable Intakes of Children and Adolescents in
the United States. Arch pediatr. Adolescent. 150:81-86.
Kushwaha, S., C. Sen, and M.T. Yakasai (2007). Current Trends in Vegetable
Consumption in Nigeria: Case study of Consumption Pattern in Kano
State. Paper Presented at the Mediterranean Conference of Agro-food
Social Scientists. 103rd
EAAE seminar ‘Adding value to the Agro-food
Supplying Chain in the Future Euromediaterranean space’. Barcelona,
Spain, April, 23rd
– 25th, 2007.
Latude-Dada, G.O. (1991). Effect of Processing on Iron Levels of Green Leafy
Vegetables. J. Sc, Food Agric. 53: 353 – 365.
Leser, C.E.V (1963).Forms of Engels Functions. Econometrica, 31(4):694-703.
Levin, H.M. (1996). A Benefit Cost Analysis of Nutritional Programmes of
Anemia Reduction. World Bank Research Observer (1): 219-245.

101
Masur (1961) Cf ODO C.E. (2002). Effects of Sun Drying of Some Green leafy
Vegetables in Nigerian Ecosystems. Home Science and Nutrition
Department UNN.
Menezes, T. A., F.G. Silveira and C.R. Azzoni (2005). Estimating a Two-
Stage Demand System for Staple Food Baskets in Brazil Using Pseudo
Panel Data. Insituto de Pesquisas Economicas, Universidade de Sao
Paulo.
Menon, P., and M.T. Ruel (2003).Child Care, Nutrition, and Health in the
Central Plateau of Haiti: The Role of Community, Household and Care
giver Resources. Report of the IFPRI-Cornell University-World Vision based Survey Haiti 2002.Washington D.C: Food and Nutrition Technical
(FANTA) Project.
Menon, P., M.T Ruel and S.S Morris (2000). Socio-economic Differentials in
Child Stunting are Consistently Larger in Urban than Rural Areas. Food and Nutrition Bulletin, 21(3): 282 – 289.
Ministere du Plan Consommation de revenue des ménages ruraux.Enquete Nationale sur le Budget et la Consommation. Kigali. Rwanda:
Government, 1988. (http; / /www4. worldbank. Org / afr / poverty / docnay/00627.pdf)
Minot, N (2002). Fruits and Vegetables in Vietnam. Adding Value from Farmer
to Customer. Washington D.C.: International Food Policy Institute.
Mohammadifard, N.N, Omidvar, A.H. Rad, M. Magbroon, and F. Sajjadi
(2006). Does Fruit and Vegetable Intake Differ in Adult Females and
Males in Isfahan. ARYA Journal 1(3): 193 – 201.
Moneta, A. and A. Chai (2005).At the Origins of Engel Curves Estimation.
Papers on Economics and Evolution, No. 0802, Max Planck Institute of
Economics, Jena.
Moraket Thomas, (2001). Overcoming Transaction Costs Barriers to Market
Participation of Small holder Farmers in the Northern Province of South
Africa. PhD Dissertation, university of Pretoria.
Moti Jaleta (2007). Econometric Analysis of Horticultural Production and
Marketing in Central and Eastern Ethiopia. Ph.D Dissertation.
Wageningen University. The Netherlands. 101pp.

102
Mueller et al; (2001). Subsistence Agriculture and Child Growth in Papua New
Guinea. Ecology of Food and Nutrition 40:367-395.
National Population Commission (2007). 2006 Population Census Provisional
Results – Abuja.
Nayga, R. M. (1995). Determinants of U.S. Household Expenditure on Fruits
and Vegetables: A Note and Update. Journal of Agriculture and Applied Economics 27:588-404.
Nelson, P.E. (1990). Aseptic Bulk Processing of Fruit and Vegetables. Food Technology 44(2): 96 – 106.
Nestle, M. (1998). Behavioural and Social Influences on Food Choice. Nutrition Reviews 56 (5, Part II) 550 – 574.
New S, C. Botton – Smith, D. Grubb and D. Reid (1997). Nutritional Influences
on Bone Mineral Density; A Cross Sectional Study in Pre-Menopausal
Women. American Journal of Clinical Nutrition. 65: 1831 – 1839.
Neway Gebre-ab (2006). Commercialization of Small holder Agriculture in
Ethiopia. Note and Papers Series, No 3. Ethiopian Development
Research Institute. 52pp.
Njoku, J.E. (1989). Demand Elasticities for Food in the Minor Food Producing
Areas of South Eastern Nigeria. A Case of Imo State. Unpublished Ph.D.
Thesis, Dept. of Agric. Econs. UNN.
Nwabueze, M.O. (1995).Economic Analysis of Dry Season Vegetable
Production in Enugu State. An Unpublished M.Sc thesis. Department of
Agricultural Economics, UNN.
Oguntona, T. (1988). Cf ODO C.E. (2002). Effects of Sun Drying on some
Green Leafy Vegetables in Nigerian Ecosystems. Home Science and
Nutrition Department UNN.
Oke, O.l. (1968). Composition of some Nigerian Leafy Vegetables. Journal of American Dietetic Association. 53: 130 – 132.

103
Okolie, C.I. (1978). Effects of Traditional Market Habits on the Ascorbic Acid
Contents of African Spinach. B.Sc. Thesis Dept. of Food Science Tech.
UNN.
Okorji, E.C. (1989). Demand Elasticities for Food Crops in Major Yam
Producing Areas of South Eastern Nigeria. An Unpublished Ph.D. Thesis,
Dept. of Agric. Econs. UNN.
Omueti, O. and O. Adepoju, Research Note: Preliminary Assessment of the
Effect of Processing and Storage on the Quality of Five Local Vegetables.
Nigeria Food Journal 6: 67 – 71.
Oyenuga, V.A. (1968). Nigeria Foods and Feeding Stuffs, Their Chemistry and Nutritive Value, Ibadan University Press, Nigeria.
Pagot, J. (1992). Animal production in the Tropics and Sub-tropics. Macmillan,
London and Basingstoek/CTA Public.
Paris, S. J. (1952).Non-linear Estimates of the Engel Curves. The Review of Economic Studies 20, 87–104.
Paris, S.J. and H.S. Houthakkar (1955). The Analysis of Family Budgets. N.Y.
Cambridge University Press.
Pasinetti, L. L.(1981).Structural Change and Economic Growth .Cambridge:
Cambridge University Press.
Pike and Brown (1975). Cf ODO C.E. (2002). Effects of Sun Drying on Some
Green Leafy Vegetables in Nigerian Ecosystems. Home Science and
Nutrition Department UNN.
Pipes, P.L. and C.M. Trahms (1993). Nutrition in Influencing and Childhood. Mosby St. Louis, 5th ed.
Pollack, S.L. (2001). Consumer Demands for Fruit and Vegetables: The US
Example. Changing Structure of Global Food Consumption and Trade.
Agriculture and Trade Report. WES–01–1. Regime Ed., 49–54.
Washington DC. Economic Research Service US Department of Agriculture.

104
Pollard, J., S.F.L. Kirk and J.E. Cade (2002).Factors Affecting Food Choice in
Relation to Fruit and Vegetable Intake: Nutrition Research Reviews 15:373-387.
Pomerleau, J., Lock, K., Mckee, M. and Ahmann, D.R. (2001). The Challenge
of Measuring Global Fruit and Vegetable Intake. Journal of Nutrition, 134:1175 – 1180.
Prasad, A. N. and Prasad, C. (1991). Iron deficiency: Non haematological
Manifestations. Prog. Food Nutrition Science. 15: 255 – 288.
Prescott, N and M. Pradham (1997).A Poverty Profile of Cambodia. Discussion Paper No.373.Washington D.C: The World Bank.
Quisumbing, (2003). Cf Ruel, M.T, N. Minot and L. Smith (2005). Patterns of
Determinants of Fruits and Vegetable Consumption: A Multi Country
Comparison. International Food Policy Research Institute. Washington D.C.
Rasmussen, M; R. Krolner; K. Ingekleep; L. Leslie; B. Johannes; B. Eling and
D. Pernille (2006). Determinants of Fruits and Vegetables Among
Children and Adolescents: A Review of the Literature. Part 1 Qualitative
Studies. International Journal of Behaviour, Nutrition and Physical Acts. 3: 22.
Raynolds, K.D., T. Baranoswski, D.B. Bishop, R.P. Farris, D. Binkley, Theresa,
A. Nicklas and P.J. Elmer (1999). Patterns in Child and Adolescent
Consumption of Fruit and Vegetables. Effects of Gender and Ethnicity
Across Four Sites. Journal of the American College of Nutrition 18(3): 248 – 254.
Reddy, G.P., P.G. Chengappa and L. Achotch (1995). Marketed Surplus
Response of Millets: Some Policy Implications. Indian J. Agric. Economics. L(4) 668-674
Regmi, A. and J. Dyck (2001).Effects of Urbanization on Global Food Demand.
Changing Structure of Global Food Consumption and Trade. Agriculture and Trade Report.WRS-01-1.A.Regimi,ed.Washington,D.C:Economic Research Services, U.S. Department of Agriculture.
Regmi, A. and J. L. Seale. (2010). Cross-Price Elasticities of Demand Across
114 Countries. Technical Bulletin No. TB-1925 88 (March).United

105
States Department of Agriculture.
Rehima Musema (2007). Analysis of Red Pepper Marketing: The Case of Alaba
and Silitie in SNNPRS of Ethiopia. An M. Sc Thesis Presented to School
of Graduate Studies of Haramaya University. 153pp.
Richter, J.W.H., Schnitzter and S. Gura (1995). Vegetable Production in Peri
Urban Areas in the Tropics and Subtropics – Food Income and Quality of
Life. Proceeding of an International Workshop. German Foundation of International Development; Council for Tropical and Sub Tropical Agricultural Research. ZEL, Felafing, Zschortau.
Rimmer, M. T. and A. A.Powell (1996). An Implicitly, Directly Additive
Demand System. Application Econometrics, 28: 1613-1622.
Ruel, M.T. and C.E.Garret (2003). Assessing the Potential for Food Based
Strategies to Reduce Vitamin A and Iron Deficiencies. A Review of
Recent Evidence. Food Consumption and Nutrition Division Discussion Paper No. 92. Washington DC. IFPRI.
Ruel, M.T.; N. Minot and L. Smith (2004). Patterns and Determinants of Fruit
and Vegetable Consumption: A Multi-Country Comparison. International Food Policy Research Institute. Washington D.C.
Scearce, W.K. and R.B. Jensen (1979). Food Stamp Effects on Availability of
Food Nutrient for Low Income Families in Southern Region of the USA.
Southern Journal of Agricultural Economics. No. 2. Pp. 113 – 120.
Selman, J.D. (1994). Vitamin Retention During Blanching of Vegetable. Food Chemistry. 49: 137 – 147.
Simmons, E.B. (1976). Rural Household Expenditures in three Villagers of
Zaria Province, May 1970 – July 1971. Samaru Miscellaneous Paper 56, Institute for Agricultural Research, Ahmadu Bello University Zaria,
Nigeria.
Simoes, R. and S.A. Brandt (1981). Sistema Completo De Equações De
Demanda Para o Brasil in: Anais do III Encontro da Sociedade Brasileira de Econometria, Olinda-PE.
106
Singleton, J.C. (1989). Role of Food and Nutrition. In the Health Perception of
Young Children. Journal of American Dietetics Association 92 (1) 67 – 70.
Smith, L.C. (2004).Food Security in Sub-Saharan Africa: New Estimates from
Household Expenditure Surveys Project Final Report on Improving the
Empirical Basis for Assessing Food Insecurity in Developing Countries:
Sub-Saharan Africa, Submitted to AAID, CIDA, DFID, USAID, USDA
and the World Bank. Washington, D.C.: International Food Policy
Research Institute.
Smith, L.C., M.T. Ruel and A. Ndiaye (2003).Why is Child Malnutrition Lower
in Urban than Rural Areas? Evidence from 36 Developing Countries.
Food Consumption and Nutrition Division Discussion Paper.
Washington, D.C: International Food Policy Research Institute.
Steinmetz, K and J. Potter (1991). Vegetables, Fruits and Cancer II.
Mechanisms. Cancer Causes and Control 2: 421 – 422.
Stone, R. (1954).Linear Expenditure Systems and Demand Analysis: An
application to the
Pattern of British Demand. The Economic Journal, 64(225):511-27.
Subar, A. F., J. Heimendinger and B.H. Patterson (1995).Fruit and Vegetable
intake in of the United States: the Baseline Survey of the Five –a day for
Better Health Programme. American Journal of Health Promotion. 9(5):352-360.
Subrathy, A.H. and V. Jowaheer (2001).Consumption Pattern of Fruits in
Mauritius. Nutrition and Food Science. 31(3): Pp. 125 – 128.
Tellis, G.J. (1998). Adverting Exposure, Loyalty and Brand purchase. A Two-
Stage Model of Choice. Journal of Marketing Research. May. Pp. 134 – 144.
Thakur, D.S., D.R. Harbans Lal, K.D.Sharma and A.S.Saini (1997). Market
Supply Response and Marketing Problems of Farmers in the Hills. Indian J. Agric. Economics. 52(1):139-150.
Theil, H.(1965). The Information Approach to Demand Analysis.
Econometrica, 33:67-87.

107
Theil H., C.F. Chung, and J. L. Seale. (1989). International Evidence on Consumption Patterns. Greenwich, CT: JAI Press, Inc.
Thomas, D., J. Strauss and M.M.R. Barbosa. Estimating the Impact of Income
and Prices Changes on Consumption in Brazil, Yale Economic Growth Discussion Paper No. 589, New Haven-CT.
Thomas, R.L. (1987). Applied Demand Analysis. Longman Group Limited,
Harlow, England.
Thompson, R.L., Margets, B.M., Speller, V. and Mcvey, D (1999). The Health
Education Authority’s Health and Lifestyle Survey 1993: Who are the
Low Fruit and Vegetable Consumers? Journal of Epidemiology and Community Health 53: 294 – 299.
Tiffin A. and R. Tiffin (1999). Estimates of Food Demand Elasticities for Great
Britain: 1972–1994. Journal of Agricultural Economics, 50: 140–147.
Timmer, C.P. and W.P.; Falcon and S.R. Pearson (1983). Food Policy Analysis.
Baltimore and London. John Hopkins University Press.
Tippet, K.S., S.J. Mickle, J.D. Goldman, K.E. Sykes, D.A. Cook, R.S.
Sebastian, J.W. Wilson and J. Smith (1995). Food and Nutrient intakes by
individuals in the United State 1 Day, 1989-1991. Continuing Survey of
Food Intakes by Individuals 1989 – 1991. Nationwide Food Surveys Report No. 91-2. Washington. DC. US Dept of Agric. 1995.
Tomek, W.G. and K.L. Robinson (1991). Agricultural Products Prices. Third
Edition. Cornel University Press. Ithaca and London. 360p
Uwaegbute (1998).cf Nwabueze, M.O. (1995).Economic Analysis of Dry
Season Vegetable Production in Enugu State. An Unpublished M.Sc
thesis. Department of Agricultural Economics, UNN.
Vemcery, M. (1981). Rural Food Habits in 6 Developing Countries. A Case
Study of Environmental, Social and Cultural Influence on Food
Consumption Patterns. Nigeria.
Wenlock, R.S. (1987). Diet and Development in School Children. Royal Soc. Health 3:80-83.

108
Whichelow, M.J. and Prevost, A.T. (1996). Dietary Patterns and their
Associations with Demographic, Lifestyle and Health in a Random
Sample of British Adults. British Journal of Nutrition, 76:17 – 30.
Wolday, Amha. (1994). Food Grain Marketing Development in Ethiopia after
the Market Reform 1990: a Case study of Alaba Sirarao district. Ph.D
Dissertation. 1-Aufl-Berlin: Koster. Germany. 292pp.
Working, H (1943).Statistical Laws of Family Expenditure. Journal of the American Statistical Association.38:43-56.
World Bank (1996). Poverty and Welfare in Nigeria. NPC/FOS Publications.
Abuja and Washington DC
World Health Organization (2003). Reducing Risks, Promoting Healthy Lives. WHO Report, Geneva. www.fao.org.accessed on the 17th June, 2010.
Yeong-Sheng, T.J(2008).Household Expenditure on Food at Home in Malaysia.
MPRA Journals on line.http://mpra.ub.uni- muenchen.de/15031/11pp.
Yuen, W. C. (1994). Food Consumption in Rich Countries. The University of
Western. Australia. Available: www. ecom. uwa. edu. Au
/_data/page/36742 /Chapt6new.pdf, [3June 2008].

109
APPENDIX
Department of Agricultural Economics,
University of Nigeria, Nsukka.
Enugu State.
Dear Respondent,
I am a postgraduate student in the Department of Agricultural Economics, University of
Nigeria, Nsukka. I am conducting a research on “Patterns and Determinants of Fruits and
Vegetable consumption in Enugu State, Nigeria”.
You have been chosen as one of the respondents to provide information needed for the
research. Your response will be treated in strict confidence as no names will be mentioned in
the report.
Thank you.
Yours Sincerely,
Nnanna Agwu.
SECTION A
Socio-economic characteristics of the Household. (Please, tick (√) as appropriate)
1.
1.01 Location (i) Urban L.G.A (ii) Rural L.G.A
1.02 Sex: (a) Male (b) Female
1.03 Position of the Respondent in the family
(a) Husband (b) Housewife/Homemaker
1.04 Married status of the Respondent.
(a) Married (b) Single
1.05 If single, indicate whether,
(a) Spinster
(b) Widow
(c)Divorced
1.06 Indicate the primary occupation of the household head.
(a) Trading/Business
(b) Public Service
(c) Artisan
(d) Labour

110
1.07 What is the age of the House Head? ……………………………
1.08 What are the ages of adult members in the household?.
(a) ………………(b)……………… (c) ……………… (d) …………………..
(e) …………… (f) ……………… (g) ……………… (h) ………………….
(i) …………… (j) ………………….
1.09 What is the educational attainment of the Household Head?
(a) Did not attend school at all
(b) First School Leaving Certificate (FSLC)
(c) Secondary School Certificate (WASCE or SSC)
(d) Posting-Secondary School Certificate.
(i) OND /NCE ……………….. (ii) HND /B.Sc ……………….
(iii) MBA /Ph.D ……………..
1.10 What are the highest educational attainments of adult members of your
household?
(a)……………… (b)………………(c)……………(d) …………….
(e) …………….. (f) ………………… (g) ………………….
(h)………………….
(i) ………………. (j) …………………
1.11 What is the total Household size? (Number of persons in the family?). .......
1.12 What is the Secondary occupation of the Household head, if any ……..
1.13 Estimate the total household monthly expenditure ₦ …………………..
SECTION B
2.0 Household Consumption of Fruits and Vegetables
2.01 Estimate the total household monthly recurrent expenditure on
(a) Food items ₦ …………………………..
(b) Vegetable ₦ …………………………….
(c) Fruits ₦ ………………………………..
2.02 Estimate your monthly expenditure on other items apart from food items
example cloths, Energy, bills ,water, etc.
₦…………,………,………,………,………,…………………………………………………
…………
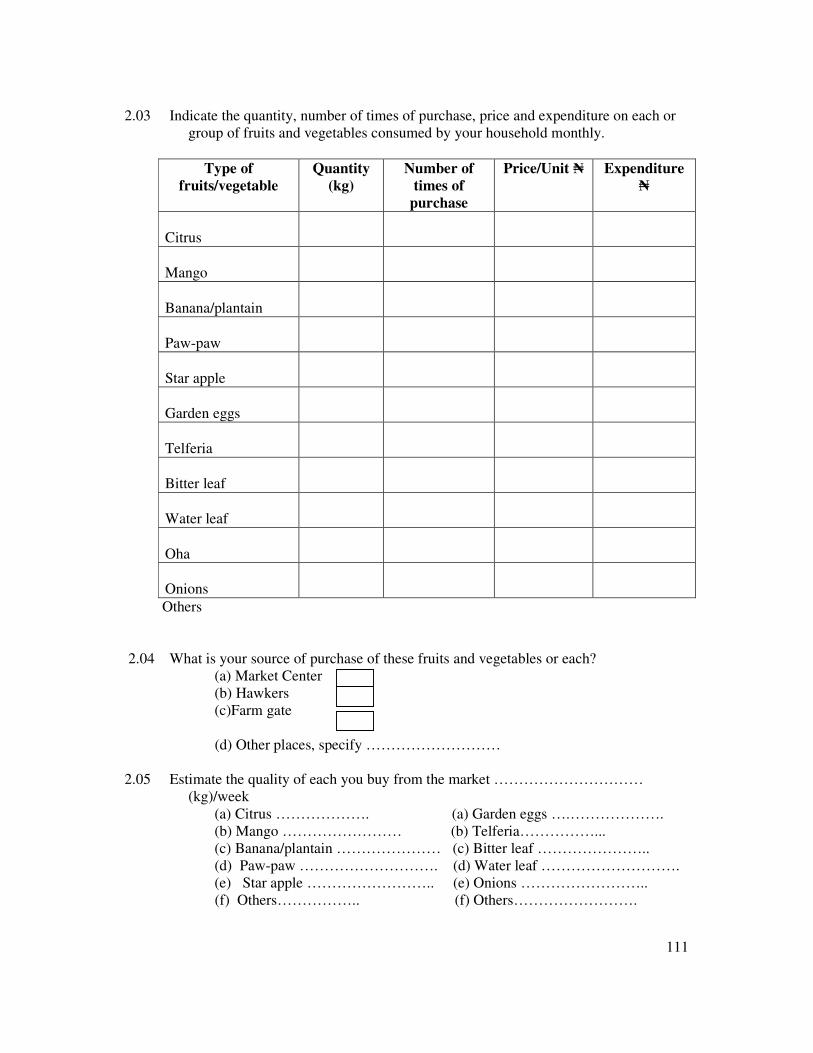
111
2.03 Indicate the quantity, number of times of purchase, price and expenditure on each or
group of fruits and vegetables consumed by your household monthly.
Type of
fruits/vegetable
Quantity
(kg)
Number of
times of
purchase
Price/Unit ₦ Expenditure
₦
Citrus
Mango
Banana/plantain
Paw-paw
Star apple
Garden eggs
Telferia
Bitter leaf
Water leaf
Oha
Onions
Others
2.04 What is your source of purchase of these fruits and vegetables or each?
(a) Market Center
(b) Hawkers
(c)Farm gate
(d) Other places, specify ………………………
2.05 Estimate the quality of each you buy from the market …………………………
(kg)/week
(a) Citrus ………………. (a) Garden eggs ….……………….
(b) Mango …………………… (b) Telferia……………...
(c) Banana/plantain ………………… (c) Bitter leaf …………………..
(d) Paw-paw ………………………. (d) Water leaf ……………………….
(e) Star apple …………………….. (e) Onions ……………………..
(f) Others…………….. (f) Others…………………….

112
2.06 Estimate the quantity of each item collected from your garden/ backyard/
Surroundings per week/month (kg)
(a) Citrus ………………….. (a) Garden eggs…………………
(b) Mango ………………….. (b) Telferia ………
(c) Banana/plantain …………………(c) Bitter leaf ………………
(d)Paw-paw ……………………… (d) Water leaf ………………
(e)Star apple ……………………… (e) Onions ……………………
(f) Others………….. (f)Others…………….
2.07 At what period of the year do you buy these items more (Rainy or Dry season).
(a) Citrus ………………… (a)Garden eggs ………………………………
(b)Mango ……………… (b)Telferia …………………………………….
(c)Banana/plantain ……… (c)Bitter leaf …………………………………
(d)Paw-paw ………………… (d) Water leaf ………………………………
(e) Star apple ……………… (e)Onions ……………………………………
2.08 Identify the quantities consumed in each period/season and the prices.
Rainy Season (April – October)
Item consumed Unit price ₦ Quantity
consumed(kg)
Total
Expenditure ₦
Citrus
Mango
Banana/plantain
Paw-paw
Star apple
Garden eggs
Telferia
Water leaf
Oha
Onions
Others

113
2.09 DRY SEASON (NOVEMBER – MARCH)
Item consumed Unit price ₦ Quantity consumed
(kg)
Total Expenditure
₦
Citrus
Mango
Banana/plantain
Paw-paw
Star apple
Garden eggs
Telferia
Water leaf
Oha
Onions
Others
3.01 Identify why you consumed ant item more during rainy /dry season.
(a) They are abundant ……………………………………………
(b) They are cheap …………………………………………………
(c) They are readily available ……………………………………………..
(d) Place of purchase is near my house ……………………………
(e) I grow them in my backyard/garden ……………………………
(f) Other reason(s), specify ………………………………………………..
3.02 Indicate the problem associated with the consumption of these items.
(a) Price ……………………………………………
(b) Seasonality …………………………………..
(c) Others, specify ……………………………….

114