patterns and determinants of housing utilization...
TRANSCRIPT
HFPC 2016
Patterns and Determinants of Housing Utilization and “Graduation” in Calgary
Ali Jadidzadeh
and
Nick Falvo

Background
• Homelessness in Calgary
447 461615
9881,296
1,737
2,397
3,157
3,601
3,190
3,576
3,533
3,531
0
500
1,000
1,500
2,000
2,500
3,000
3,500
4,000
Point-in-time Counts

Background
In 2008, Calgary became first Canadian city to develop a “plan to end homelessness.”
Shortly thereafter, we developed an HMIS system.
Calgary Homeless Foundation (CHF) is the “system responder.”
We disburse funding to programs in the homeless-serving sector each year; to monitor their outcomes and impact, we benchmark them against key performance indicators (KPIs).

Motivation for Present Study
• Like most North American cities, Calgary has far more low-income people in need of housing than it has available units of affordable housing.
• This puts CHF in a difficult situation. Though we lobby all levels of gov’t for more funding for affordable housing, we must simultaneously be as careful as possible in how we allocate affordable housing units when they become vacant.
• The more we know how long to expect someone to stay in a particular type of unit, the better we can plan.

Motivation for Present Study (cont’d)
• The more we know which subgroups do well in which types of housing, the better-informed decisions can be made in terms of allocations of existing units, planning new developments and designing new programming.
• Further, knowing which factors are positively associated with positive outcomes help us make evidenced-based policy asks of all levels of gov’t.
• And the more we know which subgroups do better in which types of programs, the more we can ‘fine tune’ our KPIs.

Motivation for Present Study (cont’d)
In Calgary, we have some housing programs intended for permanent tenancy. We have others intended for temporary tenancy.
If people ‘stay put’ in our housing for a long time, we need to know that. That means we can’t count on units being empty for new persons to enter.
We need to know what kind of ‘flow’ we have. Which units vacate most quickly? How quickly can we expect them to vacate?
It would be nice to know: if a person with certain characteristics enters a particular type of housing program, how long should we reasonably expect them to stay there.

Literature Review
• Culhane & Kuhn, 1998. Looked at Philadelphia and NYC.
• They looked at patterns of stay in public shelter systems.
• They found that the following characteristics were positively associated with longer shelter stays: older, black, having a substance use or mental health diagnosis, having a physical disability.
• Our analysis looks at housing programs in Calgary—specifically, ones funded by the CHF.

Local Program Context
• The programs under consideration in the present study have a variety of intended outcomes.
• Some are intended to be permanent. Others temporary.
• We’re studying a concept that the Alberta government refers to as “graduation.” In the case of permanent housing, graduation refers to moving to a new unit elsewhere that doesn’t require ‘housing support’ (i.e. case management).
• In the case of temporary housing, it refers to the tenant having completed program requirements and typically having moved on to either subsidized housing or unsubsidized housing.

Local Program Context (con’td)
• In the present study, we’re studying how long the tenants stay in the housing. We’re also studying how graduation varies by tenant subgroup.
• Key questions: how long do our tenants stay in each type of housing? Which types of housing are correlated with faster “graduation” rates? Which types of tenants “graduate” most/least quickly?
• We’re looking at ‘flow.’ How quickly do people “graduate” from units, as defined by our main funder?

Research Questions and Methods
Research Questions:
1. What are the patterns of stays of those who “graduate” from our housing programs?
For single adults For families For youth
1. What are the determinants of “graduation” from homelessness for housed clients?
Methods:
1. Survival Analysis: To investigate the first research question
2. Hazard Models: To investigate the second research question

Survival Analysis
• With survival analysis, we’re trying to reconcile/disentangle the fact that we’re following a large number of tenants as they ‘flow through’ a system.
• They all enter and exit the system at different times.
• We’re trying to keep track of who enters when, and how long it takes for each person to leave.
• With survival analysis alone, we’re looking just at time, not the determinants of outcomes.

Hazard Analysis
• With hazard analysis, we study the determinants of outcomes.
• This is where we control for variables such as type of housing, age, gender, physical health status, mental health status.

Survival vs. Hazard Analysis
• In our case, survival analysis tells us when we can expect new housing units to become available for new tenants, and which program types will have available units more quickly.
• Hazard analysis can tell us which tenants will be most likely to “graduate” (based on the individual characteristics of those tenants).

Data
• Source: HMIS
• Timeframe: April 1, 2012 to March 31, 2015
• Type: Cross-section (individual level)
• Number of observations: 1,542
• Data considerations:
Includes clients experiencing their first housing admission
Excludes clients entering on or after 1 April 2014 (i.e. a client is only considered if they’ve had a period of at least 12 months to “graduate”).
Exclude clients with multiple re-entries (i.e. this is a single-spell study)

Data: Demographics
Demographics No. %
Ethnicity
Caucasian 906 59
Indigenous 385 25
Others 251 16
Gender
Male 879 57
Female 663 43
Age
Youth (24 and under) 307 20
Young Adult (25-35) 323 21
Adult (36-64) 887 57
Senior (65 and over) 25 2
Average age 39 --

Three Ways of Breaking Down Sample
Categories No. %
By subgroup
Single (23 prog.) 984 64
Family (6 prog.) 394 25
Youth (10 prog.) 164 11
By spatial distribution of housing
Placed based (15 prog.) 482 31
Scattered site (24 prog.) 1060 69
By time expectation
Permanent supportive housing (16 prog.) 642 42
Supportive housing (23 prog.) 900 58

Client Status Before Entry Into Our Housing
No. %Primary residence
Public facilities 240 16Shelter/Transitional 732 47Rough/Couch/ Hotel/Motel 398 26Own place 124 8Other 48 3
EmploymentNo 711 46No - Unable to work 414 27Yes 417 27
Have a source of incomeYes 1244 81No 298 19
EducationLess than completed high school 880 57Completed high school 350 23Less than post-secondary 248 16Completed post-secondary 64 4
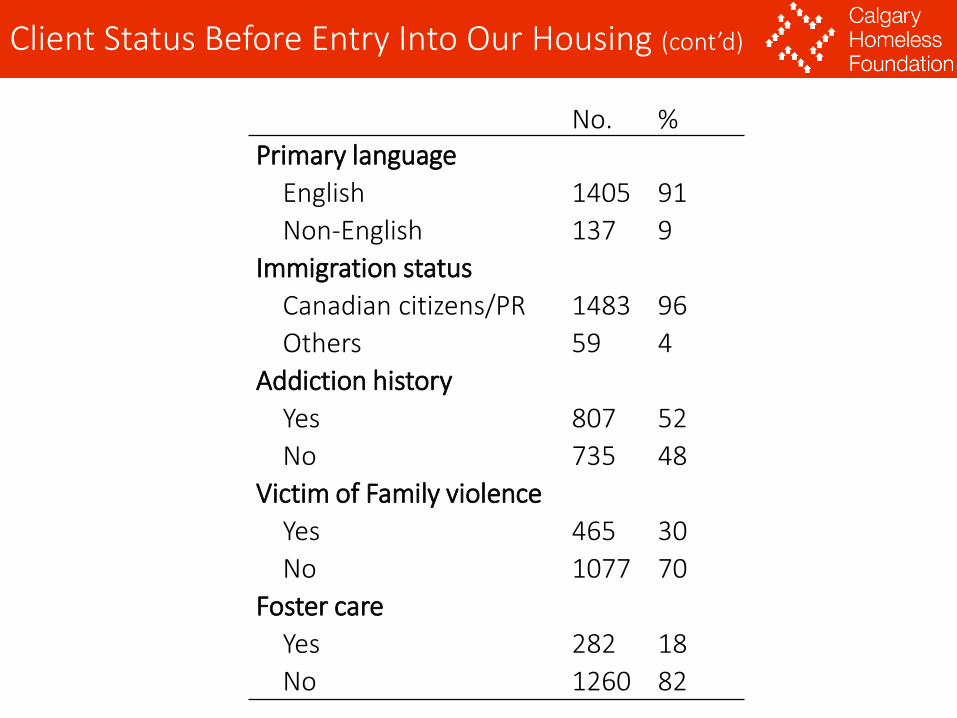
Client Status Before Entry Into Our Housing (cont’d)
No. %Primary language
English 1405 91
Non-English 137 9
Immigration status
Canadian citizens/PR 1483 96
Others 59 4
Addiction history
Yes 807 52
No 735 48
Victim of Family violence
Yes 465 30
No 1077 70
Foster care
Yes 282 18
No 1260 82
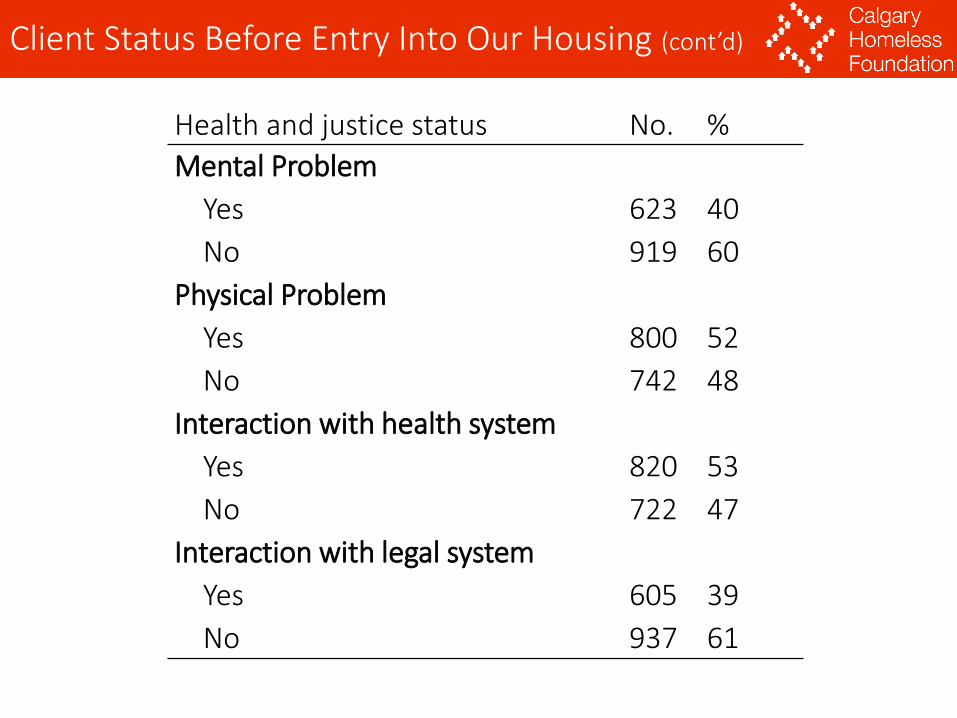
Client Status Before Entry Into Our Housing (cont’d)
Health and justice status No. %
Mental Problem
Yes 623 40
No 919 60
Physical Problem
Yes 800 52
No 742 48
Interaction with health system
Yes 820 53
No 722 47
Interaction with legal system
Yes 605 39
No 937 61

Model: Set-up
• Two left-hand variables (i.e. dependent variables)
1. Time: Length of stay for each individual
2. Evento =1 if graduated
o =0 otherwise
• Several right-hand (independent variables):
All variables discussed in previous slides

Model: Set-up
Time: Use client time
(not calendar time)

Model: Set-up
Event Graduation ratePrograms 0 1
Single (23 prog.) 749 235 24%(ACT) HR, PB+SS, No Time Limit (2 prog.) 70 6 8%
(ICM) AB, SS, Time-Limited (3 prog.) 172 101 37%
(ICM) HR, PB, No Time Limit (6 prog.) 113 15 12%
(ICM) HR, SS, Time-Limited (12 prog.) 394 113 22%
Family (6 prog.) 253 141 36%
Youth (10 prog.) 117 47 29%
Total (39 prog.) 1119 423 27%
oACT: Assertive Community Treatment oHR: Harm ReductionoICM: Intensive Case Management oPB: Place BasedoAB: Abstinence Based oSS: Scatter Site
Evento =1 if graduated
o =0 otherwise

Results: Survival function
Graduated
Not graduated
365
Kaplan-Meier estimator of the survival function for pooled data

Results: Survival function
Kaplan-Meier estimator of the survival function for each program types

Results: Hazard Function - All
• Pooled data
• N=1542
Coefficient Hazard RateProg.: (ACT) HR, PB+SS, No Time Limit -87%***Prog.: (ICM) AB, SS, Time-Limited -6%Prog.: (ICM) HR, PB, No Time Limit -65%***Prog.: (ICM) HR, SS, Time-Limited -35%**Prog.: Youth -23%Ethnicity: Indigenous -26%*Gender: Female -32%**Age -2%**
Education: Less that high school -20%.Education: Some college/university 3%Education: Complete college/university 13%Employed: No -3%Employed: Unable to work -35%**Have a source of income 77%***History of addiction -17%Have interaction(s) with legal sys. -35%***Have interaction(s) with health sys. -11%R-squared 0.112Likelihood ratio test 182.4***Wald test 148.9***Score (logrank) test 164.1***
. p≤0.10, *p≤0.05,**p≤0.01,***p≤0.001
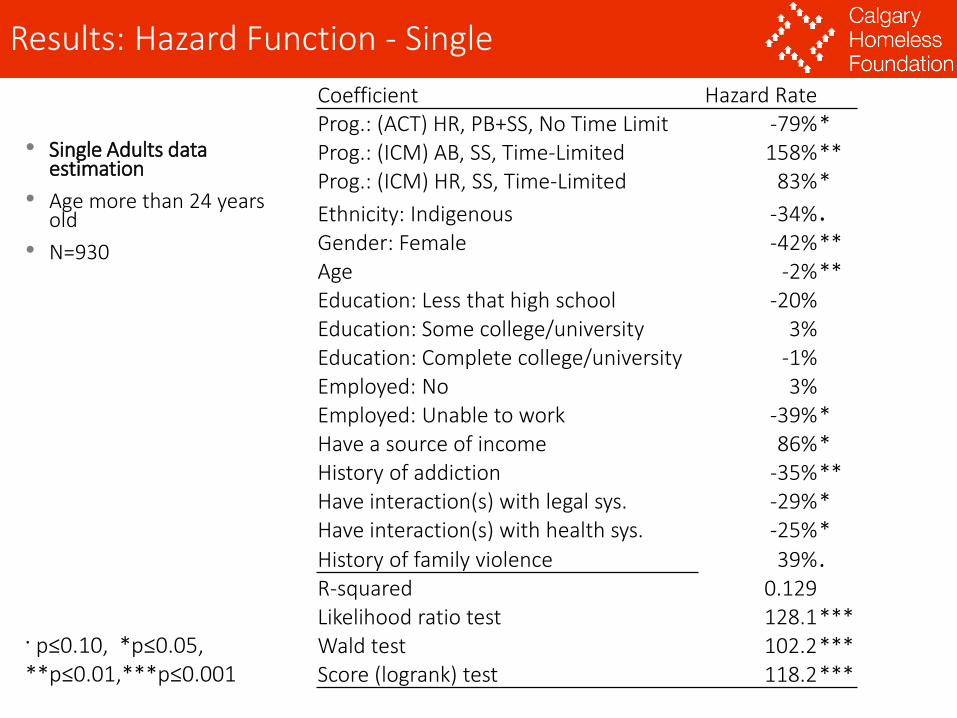
Results: Hazard Function - Single
• Single Adults data estimation
• Age more than 24 years old
• N=930
. p≤0.10, *p≤0.05,**p≤0.01,***p≤0.001
Coefficient Hazard RateProg.: (ACT) HR, PB+SS, No Time Limit -79%*Prog.: (ICM) AB, SS, Time-Limited 158%**Prog.: (ICM) HR, SS, Time-Limited 83%*
Ethnicity: Indigenous -34%.Gender: Female -42%**Age -2%**Education: Less that high school -20%Education: Some college/university 3%Education: Complete college/university -1%Employed: No 3%Employed: Unable to work -39%*Have a source of income 86%*History of addiction -35%**Have interaction(s) with legal sys. -29%*Have interaction(s) with health sys. -25%*
History of family violence 39%.R-squared 0.129Likelihood ratio test 128.1***Wald test 102.2***Score (logrank) test 118.2***

Results: Hazard Function - Youth
• Youth data estimation
• Age less than 24 years old
• N=218
. p≤0.10, *p≤0.05,**p≤0.01,***p≤0.001
Coefficient Hazard RateProg.: (ACT) HR, PB+SS, No Time Limit -38%
Prog.: (ICM) AB, SS, Time-Limited 269%.Prog.: (ICM) HR, SS, Time-Limited -71%*Ethnicity: Indigenous 32%Gender: Female -33%Age 5%Education: Less that high school -41%Education: Some college/university 11%Education: Complete college/university -75%
Employed: No -43%.Employed: Unable to work -55%Have a source of income 32%History of addiction -25%Have interaction(s) with legal sys. -34%
Have interaction(s) with health sys. -44%.
Place based programs -44%R-squared 0.134Likelihood ratio test 31.26***Wald test 32.15***Score (logrank) test 33.87***

Results: Hazard Function - Family
• Family data estimation
• N=394
. p≤0.10, *p≤0.05,**p≤0.01,***p≤0.001
Coefficient Hazard RateProgram dummies YesEthnicity: Indigenous -141%*Gender: Female -85%Age -101%Immigration: Citizen or PR -11%.
Mental problem -89%Physical problem -30%*Evicted -160%**Education: Less that high school -91%Education: Some college/university -98%
Education: Complete college/university 12%.
Employed: No -47%.
Employed: Unable to work -65%Have a source of income -28%History of addiction 18%**Interaction with legal system -155%**No. of interactions with health system -108%**Number of dependents -94%R-squared 0.32Likelihood ratio test 145***
Wald test 150.3***
Score (logrank) test 244.1***

Summary: Hazard rates in pooled data
-100%
-80%
-60%
-40%
-20%
0%
20%
40%
60%
80%
100%

Summary: Hazard rates in single adult sector
-100%
-50%
0%
50%
100%
150%
200%

Summary: Hazard rates in youth sector
-44%
-44%
-44%
-44%
-43%
-43%
-43%
-43%
-43%
-42%

Summary: Hazard rates in family sector
-180%
-160%
-140%
-120%
-100%
-80%
-60%
-40%
-20%
0%
20%
40%

Conclusion
• As time passes ,the rate of graduation decreases for persons still in our housing programs.
• After a year, we can expect that 40% of clients will have graduated.
• Graduation rate: Single < Youth < Family
• Generally, the following factors correlate negatively with graduation: being a woman, being Indigenous, being older, having less education, and not being able to work.

Conclusion (cont’d)
• Having a source of income positively correlates with graduation.
• Program type seems to matter.
• Addiction, history of family violence and physical problems do not have robust relationships with graduation from CHF-funded housing.

Thank You
Dr. Ali Jadidzadeh
Senior Researcher
Calgary Homeless Foundation
and
Dr. Nick Falvo
Director of Research and Data
Calgary Homeless Foundation