pc67 evidence ian clark 121119 - ccc
TRANSCRIPT

Page 1
IN THE MATTER OF The Resource Management Act 1991
AND
IN THE MATTER OF A private plan change request by Highfield Park Ltd to rezone
approximately 260ha of land adjoining Redwood from Rural 3
(Styx-Marchland) to Living G (Highfield)
BETWEEN Highfield Park Ltd (Requestor)
AND Christchurch City Council (Local Authority)
STATEMENT OF EVIDENCE OF IAN DAVID CLARK
19 November 2012

Page 2
INTRODUCTION
1 My full name is Ian David Clark and I live in Auckland. I am a Director of Flow Transportation
Specialists Limited, which was established in February 2005. Prior to this I was the Manager
of the Transportation Planning Section at the Auckland office of Opus International
Consultants Ltd. I was employed by Opus for eight years.
2 I hold a Bachelor of Arts in Geography from the University of Wales and a Master of Science
in Transportation from the University of London. I am a member of the Chartered Institute
of Logistics and Transport, the Chartered Institution of Highways and Transportation and
the Australian Institute of Traffic Planning and Management. I am also an affiliate member
of the Institution of Professional Engineers of New Zealand Transportation Group, a board
member of the Trips Database Bureau and chairman of the New Zealand Modelling User
Group.
3 My work experience includes 25 years in transport planning, working in both New Zealand
and the U.K. My experience in New Zealand includes responsibility for the transportation
planning, traffic modelling and economic evaluation of numerous major schemes, including
the Manukau Harbour Crossing, the Eastern Transport Corridor, the Upper Harbour
Motorway, the SH1 Esmonde Interchange, the SH1 to Waiouru Peninsula connection, and
elements of the North Shore Busway, all in Auckland.
4 My local experience of relevance to this case includes the following:
4.1 I was responsible for the transport planning of the Christchurch Southern Motorway
extension at the Scheme Assessment stage;
4.2 I presented evidence for Transit New Zealand, Environment Canterbury and
Christchurch City Council, and subsequently for the New Zealand Transport Agency
(NZTA) at the Environment Court hearings relating to the proposed S293
development at Belfast;
4.3 I presented evidence for the NZTA at the council hearings relating to Plan Change 22,
the proposed Styx Centre, and Plan Change 30, the Prestons Road development;
4.4 I also assisted the NZTA in assessing the effects of other proposed developments
within the Christchurch area and I provided advice to NZTA on the transport
provisions of Plan Change 1;
4.5 I am currently involved in assisting the NZTA with certain elements of the Roads of
National Significance in Christchurch;

Page 3
4.6 During 2012 I have been responsible for peer reviews of the Christchurch City
Council’s draft Central City Recovery Plan (December 2011) and the Canterbury
Earthquake Recovery Authority’s draft Christchurch Central Recovery Plan, Accessible
City chapter (November 2012).
5 Over the last few years I have undertaken reviews of a wide variety of regional and sub
regional traffic and transport models, including the Waikato Regional Transport Model, the
Western Bay of Plenty (Tauranga) Traffic Model, the Wellington Traffic Model, a traffic
model of South Auckland and other large area models, and also a wide variety of small area
and more detailed traffic models.
6 I have also undertaken many peer reviews and have presented evidence at several council
and Environment Court hearings, either relating to major transportation proposals or
proposed developments.
7 I have read the Code of Conduct for Expert Witnesses and I agree to comply with its
provisions. My qualifications as an expert are set out above. I confirm that the issues
addressed in this statement of evidence are within my area of expertise.
8 I have not omitted to consider material facts known to me that might alter or detract from
the opinions I have expressed.
SCOPE OF EVIDENCE
9 My evidence will deal with the following:
9.1 The strategic transport network in the vicinity of the site;
9.2 The role of the strategic network and the state highways;
9.3 The status of the Roads of National Significance;
9.4 The traffic effects of the development.
SUMMARY OF EVIDENCE
10 The NZTA’s main concerns with privately requested Plan Change 67 (PC67) relate to the
effects on the State Highways of Main North Road and Queen Elizabeth II Drive (both State
Highway 74), particularly prior to the completion of the proposed Northern Arterial.

Page 4
11 I conclude that PC67 should be approved, subject to the level of development prior to the
completion of the Northern Arterial being capped.
OVERVIEW OF NATIONAL AND REGIONAL TRANSPORT POLICIE S
12 An overview of national and regional transport planning policies, as set out in the New
Zealand Transport Strategy (NZTS)1, the Government Policy Statement on Land Transport
Funding (GPS)2, the Canterbury Regional Land Transport Strategy (RLTS)
3 and the National
State Highway Strategy, is provided at Appendix A. The key issues of relevance to my
evidence are as follows:
12.1 The government’s emphasis on investment in transport that supports efficient
movement of freight and people, with a focus on the State Highway network;
12.2 The need for greater emphasis on land use and transport integration.
THE CHRISTCHURCH STRATEGIC ROADING NETWORK
The Road Hierarchy
13 The road network around Christchurch is subject to a hierarchical classification system.
Further details on the principles and purpose of road hierarchies, and the definitions in the
Christchurch City Plan and the Regional Land Transport Strategy, are provided at Appendix
B.
The Strategic Road Network
14 The strategic road network for the Christchurch area is shown in Figure 1.
1 New Zealand Government (2008), “New Zealand Transport Strategy 2 New Zealand Government (2011), “Government Policy Statement on Land Transport Funding 2012/13 – 2021/22” 3 Environment Canterbury (2012), “Canterbury Regional Land Transport Strategy 2012-2042”

Page 5
Figure 1: Strategic Transport Network (Source: Canterbury Regional Land Transport
Strategy (RLTS), 2012-2042, page 21).
15 It is noted that Main North Road and Queen Elizabeth II Drive (QEII Drive) are both classified
as forming part of the Strategic Road Network. The functions of these roads are as follows:
15.1 Main North Road (State Highway 74) runs from north to south, from Johns Road
toward the Central Business District. North from Johns Road it is classified as State
Highway 1, serving both north-south traffic and north to west traffic (ie traffic
heading around Christchurch);
15.2 The function of Main North Road for through traffic will diminish following the
completion of the Northern Arterial (see paragraph 23 below);
15.3 QEII Drive (also State Highway 74) runs east to west, between Main North Road and
the eastern suburbs. It is an important route for freight traffic heading to and from
Lyttelton Port;
15.4 Marshland Road and QEII Drive (east of Marshland Road) are identified in the RLTS as
forming part of the Strategic Freight Network. This function of Marshland Road can
be expected to be taken up by the Northern Arterial, although QEII Drive will retain
this function, indeed it will extend west as far as the Northern Arterial.

Page 6
16 The NZTA has recently upgraded the QEII Drive/Burwood Road and QEII/Marshland Road
intersections, to signalised control. It is important to the NZTA, the Christchurch City
network and indeed to the Port, that the benefit of this investment endures into the future.
The Roads of National Significance
17 The 2009 Government Policy Statement set out the government’s emphasis on the “Roads
of National Significance” (RoNS), including the Christchurch motorway projects. The GPS
states:
“These are seven of New Zealand’s most essential routes that require significant
development to reduce congestion, improve safety and support economic growth”4.
18 The Christchurch Motorway RoNS are grouped into three corridors, comprising eight
projects, as shown in Figure 2. The Christchurch Northern Corridor is one of the three
corridors. This includes the Northern Arterial and QEII Drive four laning (both NZTA
projects), and associated Christchurch City Council (CCC) network upgrades, including the
Northern Arterial Extension. Cumulatively, these projects will improve access to the Port
and the CBD.
19 It is perhaps worth noting that the linking of these projects to the NZTA RoNS indicates that
the projects currently have high priority. However, there is no guaranteed construction
funding at this stage. Further details on the progress of the Northern Arterial are set out in
the evidence of Ms Minogue.
4 Government Policy Statement on Transport (2009), paragraph 22

Page 7
Figure 2: The Christchurch Motorway RoNS 5
ASSESSMENT OF DEVELOPMENT
20 The predicted traffic effects of the proposed development have been subject to three
assessments:
20.1 The original Integrated Transport Assessment (ITA) prepared by Abley Transportation
Consultants (Ableys) on behalf of the Applicant, was undertaken on the basis of the
pre earthquake traffic forecasts;
20.2 The above assessment is now unfortunately out of date, and the work undertaken by
CCC now provides a post earthquake set of traffic demands. Mr Falconer’s evidence
offers a more up to date assessment of the likely effects of the development, using
the Christchurch Transport Model (CTM);
20.3 I understand that Mr Falconer will be submitting supplementary evidence, providing
results from the more detailed Christchurch Assignment and Simulation Traffic (CAST)
model.
21 The main issue for the NZTA relates to the likely effects of the development on the State
Highway network. The development will lead to some internal trips, but the Marshland
area sits in what can be termed an island, in transport terms, and the vast majority of
external trips will need to join, leave or cross the State Highway to reach the rest of
5 NZTA Project Update: Christchurch Southern Motorway Stage 2, Issue 1 May 2010

Page 8
Christchurch. Movements to/from the south will need to join or cross QEII Drive, while
movements to/from the west will need to join or cross Main North Road.
22 Given that this site is anticipated to accommodate around 2,200 households, plus two
supporting Business 1 zones, the proposal could have significant adverse traffic effects on
the existing strategic network if the development is not sustainably managed.
23 The proposed Northern Arterial will provide a new route for strategic north-south through
traffic. As noted above, this will change the function of Main North Road significantly, with
the reduction in strategic traffic. This will allow the route to serve its other functions,
namely to accommodate public transport running north-south, along with local traffic
turning on and off the route. Therefore the NZTA’s main concern is the extent of
development that occurs prior to the completion of the Northern Arterial.
24 The following intersections are of particular interest to the NZTA:
� Main North Road/Prestons Road;
� Main North Road/Northcote Road;
� QEII Drive/Marshland Road;
� QEII Drive/Hills Road;
� Any new connection to QEII Drive.
Main North Road/Prestons Road
25 Both the ITA and the CTM predict that a significant proportion of development trips will use
this intersection to access Main North Road. Some traffic will be heading north, but the
majority will be heading south (or south then west). Traffic turning left from Prestons Road
onto Main North Road may have limited effect on the operation of this intersection, but
traffic turning right into Prestons Road is more likely to adversely affect the operation of the
State Highway, since:
25.1 Traffic turning right into Prestons Road will be in conflict with southbound through
traffic on Main North Road;

Page 9
25.2 The right turn bay is quite short, at around 40 m, meaning that an increase in right
turning traffic to Prestons Road may affect northbound through traffic.
26 The applicants have identified that there are existing delays at the Main North
Road/Prestons Road intersection and have proposed the removal of the existing on street
parking located on Prestons Road, on the southern side, and an extension to the right turn
bay for northbound traffic turning into Prestons Road.
Main North Road/Northcote Road
27 Any traffic heading to/from the south at the Main North Road/Prestons Road intersection
will pass through the Main North Road/Northcote Road/QE II Drive intersection.
28 I note that the existing operation of this intersection, post earthquake, is summarised in the
evidence of Mr Falconer, as follows:
“During the morning peak, high delays were observed for vehicles travelling along Main
North Road due to bottleneck delay at the Main North/Northcote/QEII intersection. Queues
frequently block back past Prestons Rd (and occasionally over the Styx overbridge, 1.6km
upstream)6.”
29 I accept the above assessment and it matches my own observations. It indicates that this
intersection is already operating at or over capacity and it will be operating over capacity in
the future, without the proposed plan change. The private plan change proposes no
mitigation works at this location, on the basis that the Northern Arterial will resolve this
bottleneck in due course.
30 This operation of the Main North Road/Northcote Road/QEII Drive intersection will
adversely affect the operation of the Main North Road/Prestons Road intersection. While
the latter may generally operate satisfactorily with the mitigation proposed, when viewed in
isolation7, in reality, traffic will struggle to turn in and out from Prestons Road, as a result of
the queues emanating from the south.
6 Evidence of Mr Falconer, paragraph 3.2.4. 7 Although paragraphs 61-62 below refer to the possibility of right turn queues exceeding the length of the right turn
bay

Page 10
QEII Drive/Marshland Road
31 As noted above (paragraph 16), this intersection has recently been upgraded, from a
roundabout to a fairly substantial signalised intersection. The CTM indicates that this will
operate at level of service F with full development of both the Prestons Road and Highfield
developments, prior to the completion of the Northern Arterial, in both the weekday
morning and evening commuter peak periods. However, this situation is predicted to
improve to level of service D following the completion of the Northern Arterial.
Connections to QEII Drive
32 Paragraph 50 of Mr Durdin’s evidence notes that the concept of a new direct connection
from the Highfield site onto QEII Drive has been consistently opposed by the NZTA. The
Applicant’s current position is that they are prepared to accept a rule linking this connection
to the development of the deferred area, allowing this issue to be considered in detail at a
later date.
33 I return to assess the operation of each of the above intersections, with the new provisions
now proposed by the Applicant, and the staging proposed by the Council, at paragraphs 64-
69 below.
STAGING
34 As a result of the assessment of the potential effects of the proposed development, the
NZTA wishes to see greater staging rules which would link the amount of development
which can occur to the transport improvements required, referring particularly to the
Northern Arterial, the Northern Arterial Extension and the four laning of QEII Drive. This is
consistent with the outcomes approved for PC22 and PC30, as follows:
34.1 With the Prestons Road development (PC30), no more than 1,700 households and
7,200m2 of commercial development are to be provided prior to the completion of
the Northern Arterial. This equates with just over 60% of the full development
permitted under the Operative Plan Change8;
8 Paragraph 42 below refers to the change in ultimate development proposed at this site, and therefore the change in the
percentage permitted prior to the completion of the Northern Arterial

Page 11
34.2 With the Styx Centre (PC22), caps were identified in terms of the total numbers of
trips exiting the site during critical time periods (the Thursday evening peak and the
Saturday peak hour), until the Northern Arterial is constructed. Clearly this rule does
not relate to a precise quantum of development.
35 The reason for staging of PC30 is expressed in the Operative Plan Change as follows:
“As part of the recovery process from the 22 February 2011 Christchurch Earthquake, urban
development is anticipated in the North-eastern portion of the City. Without the
construction of the Northern Arterial, this planned growth may adversely affect the safe,
effective and efficient functioning of road network, with levels of service being eroded and
significant delays experienced. To avoid the potential for such adverse effects and to ensure
such growth occurs at a rate that can be accommodated by the future road network,
development in the Living G (Prestons) zone is to be staged in conjunction with specific
roading upgrades. This enables an appropriate level of urban development to occur, having
acceptable levels of effects on the safe, effective and efficient functioning of the road
network until such time as the Northern Arterial is in the process of being constructed”9.
36 In terms of PC22, the Environment Court decision noted that:
“Both traffic engineers accept that until the Northern Arterial is in place, significant
restrictions on the ability of the site of the proposed plan change to generate traffic are
necessary”10
.
37 I have been involved with several of the plan changes that have come forward in Northern
Christchurch, and can explain to the commissioners in detail, if necessary, why the NZTA has
pursued staging limits more rigorously at some locations than at others. Put simply, the
NZTA has been more concerned over those sites with direct access to the state highways, or
those “island sites” which require the vast majority of trips to join, leave or cross the state
highways, at critical locations (ie where they are operating at capacity)11
.
9 Christchurch City Plan, Operative Plan Change 30, page 4 10 Environment Court Decision 2012 NZEnvC92, paragraph 301 11 For completeness, I note that NZTA also sought staging of the S293 development at Belfast.

Page 12
EVIDENCE OF MR FALCONER
38 At paragraphs 5.1.9 and 7.1.4 ii, Mr Falconer proposes that the development should be
staged, with limitations to be imposed prior to the completion of the Northern Arterial. He
does not propose a ceiling amount, but he recommends that the rule should be similar to
that adopted for PC30 Living G (Prestons)12
. This recommendation is accepted in the
Officers Report.
39 The NZTA sought staging rules relating to the Northern Arterial, and I support the concept.
However, I note that the justification of the 1,680 residential units13
(approximately 80% of
the ultimate figure) now proposed appears to be based primarily on the question of equity.
I note that Mr Durdin comments on the vague definition of equity14
, but from the evidence
of Mr Falconer it is apparent that it refers to equity relative to Plan Change 3015
.
40 I do not consider that the question of equity should be the over-riding consideration. The
reason for the staging of Plan Change 30 was set out in paragraph 35 above, and it is clear
that it was to avoid the potential for adverse traffic effects, and to ensure that growth
occurs at a rate that can be accommodated by the future road network.
41 In other words, I consider that the question of equity should be secondary to the objective
to avoid or mitigate adverse traffic effects.
42 The matter is complicated, since I understand that the proponents of PC30 have now
indicated that the full development is likely to be around 2,250 households, not 2,700
households. The amount of development tied to the provision of the Northern Arterial has
not changed, at 1,700 households, meaning that the percentage of residential development
permitted is either 63% (of the original figure) or 76% (of the revised figure).
12 Evidence of Mr Falconer, paragraph 7.1.4 ii 13 Proposed rule 12.4.10 c 14 Evidence of Mr Durdin, paragraph 131 15 Evidence of Mr Falconer, paragraph 7.1.4.ii

Page 13
43 At paragraph 3.3.3, Mr Falconer notes that the CTM tests have assumed a constant total
number of households in Northern Christchurch. That is to say, the extra households at
Highfield have been assumed to be drawn from elsewhere within Northern Christchurch. At
paragraph 3.11.3 he continues, to state that it is this assumption that means that the
inclusion of PC67 does not appear any worse than the base case without the Northern
Arterial.
44 I understand and at a strategic level I accept the logic that the provision of additional
residential capacity in Northern Christchurch does not necessarily mean a significant
increase in population within this sector, for a situation where there appears to be surplus
capacity. However, this does not necessarily mean that there will be no additional adverse
effects, for the following reasons:
44.1 Any significant new development site is likely to create local bottlenecks, with
additional turning traffic at certain intersections. In some locations this may not be
critical, but with PC67 there is concern about the effects of additional turning traffic,
for example at the Main North Road/Prestons Road intersection;
44.2 While any development in Northern Christchurch will lead to some increase in traffic
passing across Main North Road or QEII Drive, a development of 1,680 residential
units further north is likely to have less impact in this location than 1,680 units at
Highfield. For example, while the proportion of commuter traffic heading south of
QEII Drive may be similar for PC67 as for another site in Northern Christchurch, the
same cannot be said for other trip purposes (such as retail, residential, recreational or
“serve passenger16
” trips), as these are likely to include a reasonable percentage of
fairly short or local trips. As noted at paragraph 21 above, the vast majority of trips
associated with PC67 will need to cross the state highways, at sensitive locations,
while this may not necessarily be the case with development of sites elsewhere;
44.3 As such, the effect on the critical intersection of Main North Road/QEII Drive, where
no mitigation is proposed, may not be the same with PC67 as for other developments
of a similar size in Northern Christchurch.
45 As a result, while I support the overall thrust of Mr Falconer’s assessment, I do not agree
with the subsequent interpretation of Mr Durdin (see paragraphs 59-61 below) on the
resulting need for staging.
16 A “serve passenger” trip is where the main purpose of the trip is to drop off or pick up someone

Page 14
46 I also note that Mr Falconer’s evidence summarises the predicted operation of various
intersections on the basis of levels of service, using the standard definitions of levels A to F,
based on delay. The commissioners need to be aware of two important points regarding
this form of reporting:
46.1 Level of service F for signalised intersections relates to delay of above 80 seconds.
According to the standard definitions, there is no worse level of service. Therefore,
the commissioners will not know whether the predicted delay is, say, 81 seconds, or
801 seconds. As a result, while an intersection such as the QEII Drive/Marshland
Road intersection is predicted as operating at level of service F in the weekday
morning and evening commuter peak periods, without the Northern Arterial, both for
the scenarios without and with PC67, this should not be taken to mean that PC67 has
no impact;
46.2 As the reporting relates only to delay, it is not clear how close an intersection is to
operating at capacity. For example, it is quite possible for an intersection to operate
at, say, level of service E, but it could be at or very close to capacity (ie with a degree
of saturation of greater than 85-90%17
). Indeed the second printout at Appendix C of
my evidence shows one such example. Under these conditions, a slight change in
circumstances (such as a slightly greater level of growth than is currently assumed, or
a slightly different trip distribution for PC67 traffic) may mean that the effects are
greater than are currently anticipated.
47 On a point of detail, Mr Falconer proposes a rule in the plan change which would ensure
that any resource consent assessment makes use of the CAST model18
. While I understand
the desire to ensure that the assessment uses an approved tool, I note that the resource
consent applications for the latter stages of development may not come forward for some
time. As such, I would like to see the following addition to the rule recommended by the
Council:
“That the CAST model (or its successor, or any model accepted in advance as appropriate,
by Christchurch City Council) be applied at resource consent stage as details of the proposed
development become available in order to confirm that the assumptions adopted at the Plan
Change stage still hold” (my suggested additions are in bold).
17 If the demand equals capacity, then the degree of saturation is 100%. This is termed the “theoretical capacity”.
However, it is generally accepted that conditions start to deteriorate at less than 100%, and an intersection operating at
85-90% is generally termed as being at “practical capacity”. 18 Evidence of Mr Falconer, paragraph 7.1.4 v

Page 15
EVIDENCE OF MR DURDIN
The Integrated Transport Assessment
48 At paragraphs 43-47, Mr Durdin repeats the justification given in the ITA as to why he
prefers the method of manual traffic assignment over the equilibrium assignment assumed
by many strategic models. This is probably not the right venue for me to give too detailed a
response on the matter of equilibrium assignments, but I note Mr Falconer’s comment, that
the ITA was undertaken in late 2011: after the Canterbury earthquakes but before any
adequate planning information was available that considered the changes in land use
resulting from the earthquakes and likely recovery scenarios19
.
49 As such, I fully accept that it was not worthwhile undertaking detailed analysis under those
conditions, so a manual assignment was adequate and appropriate at that time. However,
the evidence (and forthcoming supplementary evidence) of Mr Falconer means that the
manual assessment of the ITA is now superceded by more robust modelling which properly
reflects the dynamic effects of bottlenecks on vehicle routing.
50 I note that Mr Durdin’s evidence refers to an update to his assessment since the ITA20
.
However, the evidence provides no details of the basis of the reassessment, nor any
updated results (for example, revised results regarding the operation of critical intersections
prior to the completion of the Northern Arterial, with the revised mitigation now proposed).
It appears that Mr Durdin is continuing to rely on the manual traffic assignment used for
the ITA, and has not used the CTM runs undertaken by Mr Falconer.
Connections to QEII Drive
51 Mr Durdin states that a key finding of the ITA report was that a connection to QEII Drive
would be required to support full development of the PC67. He states that, given that the
proposed connection would be built to a higher standard than any other intersection
between the Northern Arterial interchange and the Innes Road roundabout, the NZTA’s
non-evidentially based position on this matter is difficult to comprehend21
. He continues,
19 Evidence of Mr Falconer, paragraph 2.1.3 20 Evidence of Mr Durdin, paragraph 23 21 Evidence of Mr Durdin, paragraph 54

Page 16
to state that the NZTA position fails to acknowledge that trips generated by PC67 will occur
along or across the State Highway network, irrespective of whether access is provided via a
proposed connection or not, and that not providing access simply results in travel distances
increasing for residents of these areas and places unnecessary pressure on other parts of
the transport network (especially Prestons Road) that could be avoided by creating better
connectivity to the strategic transport network22
.
52 The NZTA’s main concerns with the proposed connection relate to the efficiency of the State
Highway and safety, due to vehicles weaving. For example, vehicles turning left onto QEII
Drive from the proposed connection may then turn right at the Innes Road roundabout,
over the same section of road where traffic on QEII Drive (from west of the proposed
connection) may wish to continue east along QEII Drive.
53 Mr Durdin correctly notes that the proposed connection was discussed at a meeting with
the NZTA in July 201223
, and since the advice given at that meeting was that the Applicant
was not pursuing the connection at this point in time, it did not seem worthwhile for the
NZTA to invest much time investigating the proposal.
54 However, at paragraphs 54-57, Mr Durdin repeats the conclusions in the ITA, on the effects
of the proposed connection to QEII Drive. As a result, I consider it necessary to respond, on
two levels:
The capacity and weaving issue:
54.1 QEII Drive currently operates with a single lane in each direction. As such, traffic
joining from the PC67 connection and turning right at the Innes Road roundabout will
not weave, but will join the single lane of eastbound traffic;
54.2 In the short term therefore, the potential left in, left out arrangement would not
cause a weaving issue, but it could cause congestion along QEII Drive, to the capacity
limitation of the single lane;
54.3 The capacity issue will be resolved by the proposed widening of QEII Drive to two
lanes per direction, but it will create the weaving issue of through traffic from west of
the proposed connection needing to get into the kerbside lane to pass straight
through the Innes Road roundabout, in the same area as traffic from PC67 needing to
turn right at the Innes Road roundabout.
22 Evidence of Mr Durdin, paragraph 54 23 Evidence of Mr Durdin, paragraph 51

Page 17
The modelling of the issue:
54.4 The assessment Mr Durdin refers to was undertaken using a set of flows that is no
longer valid. Indeed, as described at paragraphs 48-49 above, it was really an
“interim” set of flows, pending the development of post earthquake demands;
54.5 The small PARAMICS model developed by Mr Durdin did not include the split of traffic
from the west of the proposed connection, ie from the future interchange of the
Northern Arterial and QEII Drive, which will lead to weaving to the west of the
proposed connection;
54.6 The model did not include the QEII/Innes Road roundabout, to the east of the
proposed connection. Vehicles joining QEII Drive and then turning right into Innes
Road will have priority over westbound traffic on the state highway – but this effect is
not modelled;
54.7 The model did not include the existing Hills Road connection, again reducing the
quantum of weaving in the model, to the east of the proposed connection;
54.8 The model was, to my knowledge, not subject to any validation checks;
54.9 The model, if correctly constructed, would have given an assessment of the likely
change in travel times along QEII Drive. However, it would not have given any
indication of the potential safety effects.
55 As a result, Mr Durdin’s assertion that “not providing access simply results in travel distances
increasing for residents of these areas and places unnecessary pressure on other parts of the
transport network (especially Prestons Road and Hills Road)24
” is a significant
oversimplification. I accept that there could be travel time benefits to the residents, but
there could also be potential safety consequences due to the lane changing required in a
relatively high speed environment.
56 I note that there is currently a left in, left out arrangement at the connection of QEII Drive
with Hills Road. However, this intersection is very close to the Innes Road roundabout, and
my understanding is that the manoeuvre for traffic turning left out from Hills Road then
turning right at the Innes Road roundabout may have to be prohibited, following the four
laning of QEII Drive. In this case, the provision of the left in, left out connection to PC67 will
increase the level of weaving along QEII Drive, ie it will not simply be transferred from
adjacent left in, left out connections to QEII Drive.
24 Evidence of Mr Durdin, paragraph 54

Page 18
57 In any case, Mr Falconer and Mr Durdin agree that roughly half of the vehicles exiting the
PC67 area in the morning peak will be heading south of QEII Drive25
. Once QEII Drive has
been widened, I expect the left in, left out intersections to be quite attractive – and this is
backed up by the plots appended to the evidence of Mr Falconer26
. If the additional
connection (to PC67) is not provided, then it is unlikely that the same level of traffic will be
able to access QEII Drive from Hills Road. This means that the effects of PC67 on QEII Drive
will not be constant, without and with the additional connection, in that the flows accessing
QEII Drive will differ.
58 The other alternative is that the existing Hills Road connection to QEII Drive could be closed
and replaced with the new connection. Of the two, I accept that the PC67 connection
would offer the better solution, as it is some distance from the intersections to the east and
the west, and it would therefore offer safer weaving conditions, compared with Hills Road.
However, some of the existing users of Hills Road would be adversely affected by the
closure of that connection to QEII Drive, to the extent that it is premature to assume that
closure can be readily achieved. As such, at this stage, there remains a possibility that the
existing and the proposed connections to QEII could both be provided. This is the outcome
that is least acceptable to NZTA, and it would further increase the potential effects of PC67.
Staging
59 Mr Durdin states that no staging is required, relative to the progress on the Northern
Arterial, partly on the basis that it is not necessary and partly since it is inconsistent with the
position of the UDS Partners, in the Submission to the Environment Court dated July 201127
.
I will address both points:
59.1 My understanding is that Mr Durdin’s assertions regarding the July 2011 Submission
are incorrect. While the UDS partners approved the concept of the sites being
sequenced before 2020 in principle, this does not mean that the site need not still be
subject to any assessment regarding traffic effects and staging, in accordance with
the principles of PC1. This matter is addressed further in the evidence of Ms
Minogue;
25 Evidence of Mr Falconer, Table 3.4. This table notes that the range is 46% according to the CTM and 57% according
to the ITA 26 For example, the plots appended to Mr Falconer’s evidence indicate that the proposed connection from PC67 to QEII
Drive may attract 900 vehicles/hour in the morning peak, for the scenario without the Northern Arterial 27 Evidence of Mr Durdin, paragraph 112, response to submission 55, on page 27, and paragraphs 115 to 120

Page 19
59.2 The second point, that staging rules are unnecessary, appears to stem from the
assertion that if development does not occur by 2021 at Highfield, then it will occur
elsewhere in Northern Christchurch. This is consistent with the work undertaken by
Mr Falconer, referred to at paragraphs 43-45 above.
60 This assertion, that the proposed plan change will not lead to any additional development in
Northern Christchurch leads Mr Durdin to paraphrase Mr Falconer’s assessment as follows:
“PC67 Living G (Highfield) will not generate any additional effects on the operation of Main
North Road or Marshland Road alone, as it is assumed and agreed that it would substitute
for growth in other northern parts of the city. Effectively Mr Falconer is concluding that
PC67 Living G (Highfield) does not generate any cumulative effects on these strategic
corridors”28
.
61 I do not agree with these conclusions. The assumption of no extra growth in Northern
Christchurch is a modelling assumption. It is logical at a strategic level, but at a local level it
does not mean that there will be no adverse effects on the Main North Road corridor. This
is for reasons set out at paragraph 21 above, namely that the vast majority of PC67 related
traffic will need to join, leave or cross SH74. For other sites in Northern Christchurch, the
percentage of traffic affecting these critical sections of the strategic network may be lower,
and I note the following:
61.1 The overall cost (ie time and distance) of commuting from Waimakiriri to Christchurch
without the Northern Arterial is likely to be sufficient to deter some people from
relocating to Waimakiriri, if development is restricted in Northern Christchurch. For
example, some people may choose to live in Southwest Christchurch;
61.2 The vehicle kilometres travelled assumptions in Mr Durdin evidence (paragraphs 120-
123) imply that if people relocate to Waimakiriri, they would maintain the same
travel patterns as if they had lived in Christchurch. This is very unlikely, given that
Waimakiriri offers many of the same opportunities as Christchurch without the need
to increase overall vehicle kilometres. As noted at paragraph 44 above, the possible
exception is commuter trips, however these account for only 15% of daily person
trips (and 30-40% during the peak periods), according to Household Interview Survey
data collected for the development of the CTM.
28 Evidence of Mr Durdin, paragraphs 118-119

Page 20
EVIDENCE OF MR PUTT
62 At paragraph 30, Mr Putt refers to the proximity of the site to the main trunk railway line,
and the discussion for the redevelopment of the central business district, to use the existing
rail network for “urban rail”29
. It is indeed the case that the Council’s draft CBD Recovery
Plan30
referred to rail, but the more recent draft Christchurch Central Recovery Plan,
Accessible City chapter31
, published for consultation on Friday 15 November 2012 (ie the
day after Mr Putt’s evidence was circulated) does not refer to passenger rail. This does not
mean that passenger rail will not be considered for Christchurch, but I suggest that it means
that less weight should be given to the proximity of PC67 to the rail network than is
intimated by Mr Putt.
63 At paragraph 65, Mr Putt refers to the lack of suitable urban land for the redevelopment of
Christchurch. He states that the risk of not acting and rejecting this plan change places an
additional burden on the city as a whole as it tries to move forward from the housing loss
created by the earthquakes. This position is inconsistent with the evidence of Mr Falconer,
which notes that even under a rapid recovery scenario, there will be excess housing capacity
in Northern Christchurch for the period to 202132
.
REASSESSMENT OF STAGING
64 Having reviewed the evidence of the Council and the Applicant on the staging issue, I have
undertaken some checks on the modelling undertaken by Mr Falconer recently, using the
Christchurch Assignment and Simulation Traffic (CAST) model, using the pre Northern
Arterial scenario in which he has assumed 1,700 households at the PC30 site (ie as per the
staging rule for that development) and 1,700 households at the PC67 site (ie roughly as per
the staging rule sought by Council). I have run the predicted flows through SIDRA33
models.
29 I understand that this is referring to passenger rail 30 Christchurch City Council (2011), “Draft Central City Recovery Plan” 31 Canterbury Earthquake Recovery Authority (2012), “Christchurch Central Recovery Plan: Accessible City chapter”,
Draft for consultation 32 Evidence of Mr Falconer, paragraphs 3.3.2 to 3.3.7 33 SIDRA is an “industry standard” modelling tool for assessing isolated intersections

Page 21
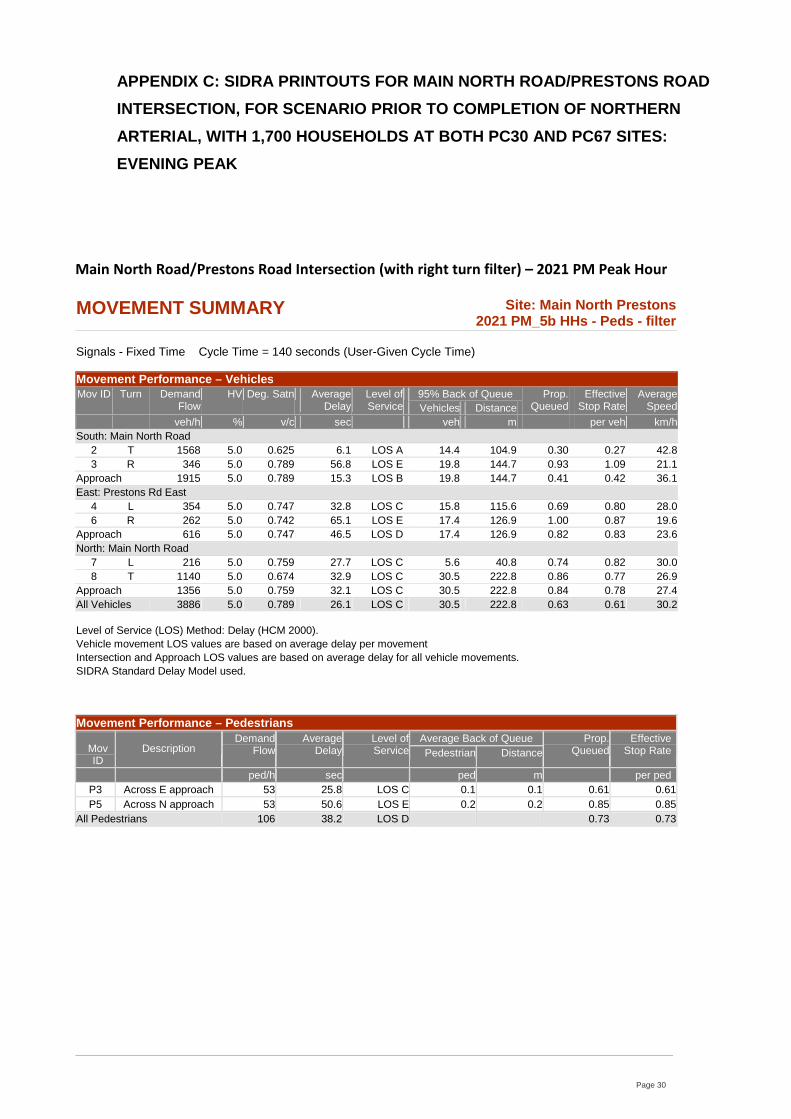
65 The Main North Road/Prestons Road intersection is predicted to be operating at level of
service E in the evening peak, on the worst movement, with a maximum degree of
saturation of up to 92.5% (see Appendix C)34
. However, more critically, the 95% back of
queue for the right turn into Prestons Road is predicted to be up to 180m, although the
mitigation proposed by the Applicant is for a right turn bay of 110m. In other words, in the
evening peak, it is reasonably likely that one of the northbound through lanes on Main
North Road will be impeded by right turning traffic, if 1,680 households are allowed to be
provided prior to the completion of the Northern Arterial. Appendix C also provides results
of a sensitivity test with 10% less right turners.
66 It is reasonable to assume that this situation is a result of PC67. Indeed Mr Durdin states
that the proposed extension of the right turn bay “will help to accommodate some of the
additional right turning demands”35
(my emphasis).
67 The Main North Road/QEII Drive/Northcote Road intersection is already predicted by Mr
Falconer to be at capacity, but no mitigation is proposed at this location, for reasons set out
at paragraph 60 above.
68 The QEII Drive/Marshland Road intersection is predicted by SIDRA to be operating at over
100% with 1,700 households permitted at PC67.
69 I accept that it is difficult to isolate the causes of congestion at many locations, and also that
there are current many uncertainties in forecasting congestion in Christchurch at the
moment. However, I consider that there is sufficient evidence for there to be concern
about the future operation of the intersections identified above, if 1,680 households are
allowed to proceed at PC67 prior to the completion of the Northern Arterial.
34 Appendix C provides two SIDRA printouts. The first assumes the retention of the current signal phasing, with right
turns into Prestons Road allowed to filter across Main North Road. I have concerns around the safety implications of
this situation, particularly as the demand for the right turn increases, and the opposing (southbound) flow increases.
Also, this situation has potential safety consequences for pedestrians crossing Prestons Road. Therefore the second
SIDRA printout removes the right turn filter, with all right turns into Prestons Road only permitted during the dedicated
right turn phase.
It is important to note that the back of the queue for right turning vehicles is predicted to exceed the 110m right turn bay
under both signal phasing scenarios. 35 Evidence of Mr Durdin, paragraph 70

Page 22
CONCLUSIONS
70 My evidence has assessed the traffic effects of the proposed plan change, in the light of the
evidence of Christchurch City Council and the Applicant. My key conclusions are as follows:
70.1 I consider that there are compelling reasons that dictate that the level of
development should be restricted until the Northern Arterial is complete, primarily to
limit the adverse traffic effects along Main North Road and along QEII Drive;
70.2 The evidence of the City Council, accepted by the Applicant, is that there is excess
residential capacity in Northern Christchurch. As such, rules relating to the staging of
development will not adversely impede the earthquake recovery, indeed such rules
would be consistent with rules approved for other developments within the Northern
Arterial corridor;
70.3 The Applicant is resisting staging rules relating to the provision of the Northern
Arterial. However, staging will in effect be imposed by the rule proposed by the
applicant, with the connection to QEII Drive to be deferred. This connection cannot
be introduced until QEII Drive is upgraded, which is unlikely to occur until the
Northern Arterial is in place.

Page 23
APPENDIX A: ROAD HIERARCHY
71 Transit New Zealand’s Planning Policy Manual36
states that road hierarchies provide a
classification system that differentiate roads by primary function and assist in the planning
and management of the road network and surrounding land use.
72 A typical hierarchy is as follows:
72.1 State highways (motorways, expressways and primary arterials) sit at the top of the
roading hierarchy. Their principal function is that of a through route that can quickly
and efficiently move people and goods over long distances;
72.2 Secondary or district arterials cater for traffic movement between major areas of
districts or cities. Traffic management of these roads seeks to facilitate traffic
movement;
72.3 Collector roads collect and distribute traffic to and from the arterial road network and
often act as links between two arterials. These roads also act as local main roads
supplementing the district arterials. Through traffic generally makes up a high
proportion of the traffic flow;
72.4 Local roads provide direct access to adjoining properties. Main local roads, except
cul-de-sacs, also collect and distribute traffic to and from local roads within a
district/city.
73 The purpose of a roading hierarchy system has been described as being37
:
73.1 To avoid conflict, by separating roads serving different purposes from each other and
from building and other non road uses;
73.2 To allow consistent decisions to be made about the design and management of a
road;
73.3 To assist with the allocation of responsibilities.
74 Most local authorities now include such a road hierarchy in their district plans, and the
principles are well understood. Put simply, it is recognised that land use adjacent to a high
speed, high volume state highway needs to be managed very differently to land use
adjacent to a residential cul-de-sac.
36 Transit New Zealand (2007), “Planning and Policy Manual”, page 24 37 See “Building on Buchanan: Evolving Road Hierarchy for today’s streets oriented design agenda”, Mr Stephen
Marshall, University College, London (2004)

Page 24
75 The Christchurch City Plan recognises the role of roading hierarchies and the need to ensure
that roads are consistent with established hierarchies. Specifically, Policy 7.2.1: “Hierarchy
of Roads” states that the policy is:
“To continue to plan, build, maintain and manage the operation of the roads in Christchurch
as a hierarchical network comprised of roads of different classifications, and to recognise the
different functions and roles of roads and their environmental impacts within those
classifications”38
.
76 The explanation for the above Policy reinforces the points noted above, and in particular
that land use adjacent to roads must be managed carefully:
“For over 25 years the City has adopted and continued to develop, a hierarchy of roads.
Each road is generally classified with respect to its planned traffic function and the
surrounding landuses. The highest classified roads (major arterials) provide for the
greatest level of movement with a minimum access function, while local roads provide for
very little through movement, but have a major access function. In this way the
hierarchical network provides for the efficient and safe movement of people and goods,
while reducing the conflicts which arise between traffic requirements and the environment
of surrounding areas…”
77 The subsequent paragraphs in the Plan set out the hierarchy as:
77.1 Major arterial roads;
77.2 Minor arterial roads;
77.3 Collector roads;
77.4 Local roads;
77.5 Service lanes.
38 Christchurch City Council “Christchurch City Plan”, accessed online www.cityplan.ccc.govt.nz on 12 November
2012

Page 25
78 Major arterial roads are defined as follows:
“Major arterial roads are the dominant elements of the roading network connecting the
major localities of the region, both within and beyond the main urban area, and link to the
most important external localities. Some major arterials, particularly some State
Highways, serve an important by-pass function within the City, directing traffic through
the district to areas beyond. Major arterials cater especially for longer trips and generally
link to other arterial roads and collector roads. They will be constructed and managed to
minimise their local access function”.
79 A number of policies in the Plan are also relevant to this issue. Policies relating to ”planning
the network” include Policy 7.2.2 which is:
“To protect the function of the road network and the environment of adjacent land uses
from the adverse effects of high traffic generators”.
80 The explanation of this policy states that:
“The efficiency and safety of the road network, particularly arterial roads, requires
minimising conflicts between various road users. Important in this respect is protection
from queuing and manoeuvring vehicles through the control of access to and from high
traffic generating activities. These may be in the form of individual land uses, or a
grouping of activities such as a suburban shopping centre.”
“A hierarchical network of roads provides an efficient form of access for all vehicles which
leads to savings of not only energy but also time. Pollution is minimised by decreasing
congestion on the roads and decreasing travel times for each trip”.
81 The Canterbury Regional Land Transport Strategy (RLTS) 2012-2042 also contains
statements of relevance to this issue. Page 20, relating to the role of Strategic Transport
Networks states:

Page 26
“Strategic transport networks provide a high level of mobility for people and freight
transport within the region. The criteria used to identify the strategic transport networks
reflects routes of national significance and recognise the nationally significant role of
Canterbury as the most populous region in the South Island. Canterbury is a major
producer of primary goods and a major distribution centre for the South Island. It is home
to two major ports as well as the South Island’s major international airport. The strategic
networks connect the region to neighbouring regions and provide contingency routes for
inter-regional travel. They also link main population centres, tourist destinations and
freight hubs within the region.”
82 At a higher level, the NZTA National State Highway Strategy includes a classification system
for the state highways, with three categories. State Highway 74 (both referring to Main
North Road and QEII Drive) is classified as the highest category of “National State Highway”.

Page 27
APPENDIX B: NATIONAL AND REGIONAL TRANSPORT POLICIE S
New Zealand Transport Strategy (NZTS)
83 The NZTS, updated in 2008, describes the high level vision for transport to the year 2040,
along with key components and targets. The overarching vision of this non-statutory
document is that “People and freight in New Zealand have access to an affordable,
integrated, safe, responsive and sustainable transport system”.
84 The NZTS includes five objectives and 14 transport targets. The form and nature of land use
activity will have a particular role to play in achieving the following targets:
84.1 halving per capita greenhouse gas emissions from domestic transport by 2040;
84.2 reducing the vehicle kilometres travelled by single occupancy vehicles in major urban
areas on weekdays by ten percent per capita by 2015, compared to 2007; and
84.3 increase use of public transport to seven percent of all trips by 2040.
85 The NZTS identifies several key challenges to achieving the transport targets, including land
use development and its impact on transport demand. One of the key components of the
NZTS is the focus on integrated planning. This can be split into achieving integration
between transport and land use through multi-modal transport planning. Another key
component of the NZTS is increasing the availability and use of public transport, cycling,
walking and other shared and active modes, in an effort to reduce congestion, fossil fuel
consumption as well as to improve public health and the vibrancy of local communities.
Government Policy Statement (GPS)
86 The Government Policy Statement (GPS)39
on Land Transport Funding is a statutory
Statement that describes the government’s funding priorities to 2021/22. The most recent
Government Policy Statement on Land Transport Funding was published in July 2011 and
became operative in July 2012. The government has three focus areas that are priorities for
this GPS, which are to direct land transport investment into activity that:
86.1 Supports economic growth and productivity
39 Government Policy Statement on Land Transport Funding 2012/13 – 2021/22. July 2011

Page 28
86.2 Improves road safety
86.3 Achieves strong value-for-money.
87 With regard to supporting economic growth and productivity, the GPS places particular
importance on the following:
87.1 Investing in the State highway network
87.2 Continuing to progress the Roads of National Significance (RoNs)
87.3 Rebuilding the land transport system in Canterbury
87.4 Getting Auckland’s transport working well
87.5 Making quality investments in public transport
87.6 Improving the local road network
87.7 Investing in walking and cycling
87.8 Considering networks from a national perspective
87.9 Integrated planning continues to be important
88 The GPS includes the Christchurch motorway projects as one of the seven current RoNs, and
states the following with regard to the RoNs:
“Continuing to progress the seven RoNs is a critical part of the economic growth and
productivity priority and a significant part of the government’s National Infrastructure Plan.
The RoNs are important to addressing the needs of our key supply chain routes. Investing in
these routes will ease the most significant pressure points in the national network, reduce
congestion in and around our five largest metropolitan areas, improve road safety and link
our major sea and air ports more effectively into the State highway network.”
89 Further details of the projects that are included within the Christchurch RoNS are provided
at paragraphs 18-19.

Page 29
Canterbury Regional Land Transport Strategy
90 The vision of the Canterbury Regional Land Transport Strategy is as follows:40
“Canterbury has an accessible, affordable, integrated, safe, resilient and sustainable
transport system.”
91 The RLTS vision is supported by objectives to41
:
91.1 Ensure a resilient, environmentally sustainable and integrated transport system
91.2 Increase transport safety for all users
91.3 Protect and promote public health
91.4 Assist economic development
91.5 Improve accessibility levels for all.
40 Canterbury Regional Land Transport Strategy 2012-2042, page 2 41 Ibid, page 2
Page 30
APPENDIX C: SIDRA PRINTOUTS FOR MAIN NORTH ROAD/PRE STONS ROAD
INTERSECTION, FOR SCENARIO PRIOR TO COMPLETION OF NORTHERN
ARTERIAL, WITH 1,700 HOUSEHOLDS AT BOTH PC30 AND PC 67 SITES:
EVENING PEAK
Main North Road/Prestons Road Intersection (with right turn filter) – 2021 PM Peak Hour
MOVEMENT SUMMARY Site: Main North Prestons 2021 PM_5b HHs - Peds - filter
Signals - Fixed Time Cycle Time = 140 seconds (User-Given Cycle Time) Movement Performance – Vehicles Mov ID Turn Demand
Flow HV Deg. Satn Average
Delay Level of Service
95% Back of Queue Prop. Queued
Effective Stop Rate
Average Speed Vehicles Distance
veh/h % v/c sec veh m per veh km/h South: Main North Road
2 T 1568 5.0 0.625 6.1 LOS A 14.4 104.9 0.30 0.27 42.8 3 R 346 5.0 0.789 56.8 LOS E 19.8 144.7 0.93 1.09 21.1
Approach 1915 5.0 0.789 15.3 LOS B 19.8 144.7 0.41 0.42 36.1 East: Prestons Rd East
4 L 354 5.0 0.747 32.8 LOS C 15.8 115.6 0.69 0.80 28.0 6 R 262 5.0 0.742 65.1 LOS E 17.4 126.9 1.00 0.87 19.6
Approach 616 5.0 0.747 46.5 LOS D 17.4 126.9 0.82 0.83 23.6 North: Main North Road
7 L 216 5.0 0.759 27.7 LOS C 5.6 40.8 0.74 0.82 30.0 8 T 1140 5.0 0.674 32.9 LOS C 30.5 222.8 0.86 0.77 26.9
Approach 1356 5.0 0.759 32.1 LOS C 30.5 222.8 0.84 0.78 27.4 All Vehicles 3886 5.0 0.789 26.1 LOS C 30.5 222.8 0.63 0.61 30.2 Level of Service (LOS) Method: Delay (HCM 2000). Vehicle movement LOS values are based on average delay per movement Intersection and Approach LOS values are based on average delay for all vehicle movements. SIDRA Standard Delay Model used. Movement Performance – Pedestrians
Mov ID
Description Demand
Flow Average
Delay Level of Service
Average Back of Queue Prop. Queued
Effective Stop Rate Pedestrian Distance
ped/h sec ped m per ped P3 Across E approach 53 25.8 LOS C 0.1 0.1 0.61 0.61 P5 Across N approach 53 50.6 LOS E 0.2 0.2 0.85 0.85
All Pedestrians 106 38.2 LOS D 0.73 0.73

Page 31
Main North Road/Prestons Road Intersection (without right turn filter) – 2021 PM Peak Hour
MOVEMENT SUMMARY Site: Main North Prestons 2021 PM_5b HHs - Peds
Signals - Fixed Time Cycle Time = 140 seconds (User-Given Cycle Time) Movement Perform ance – Vehicles Mov ID Turn Demand
Flow HV Deg. Satn Average
Delay Level of Service
95% Back of Queue Prop. Queued
Effective Stop Rate
Average Speed Vehicles Distance
veh/h % v/c sec veh m per veh km/h South: Main North Road
2 T 1568 5.0 0.619 5.5 LOS A 13.3 96.8 0.28 0.25 43.3 3 R 346 5.0 0.906 72.1 LOS E 24.6 179.5 0.97 0.95 18.3
Approach 1915 5.0 0.906 17.6 LOS B 24.6 179.5 0.40 0.38 34.7 East: Prestons Rd East
4 L 354 5.0 0.685 25.9 LOS C 13.5 98.9 0.62 0.77 30.8 6 R 262 5.0 0.770 67.2 LOS E 17.8 129.8 1.00 0.89 19.2
Approach 616 5.0 0.770 43.5 LOS D 17.8 129.8 0.78 0.82 24.5 North: Main North Road
7 L 216 5.0 0.925 30.3 LOS C 5.6 40.8 0.93 0.83 29.0 8 T 1140 5.0 0.774 40.2 LOS D 33.8 246.6 0.94 0.84 24.5
Approach 1356 5.0 0.925 38.6 LOS D 33.8 246.6 0.94 0.84 25.1 All Vehicles 3886 5.0 0.925 29.0 LOS C 33.8 246.6 0.65 0.61 28.9 Level of Service (LOS) Method: Delay (HCM 2000). Vehicle movement LOS values are based on average delay per movement Intersection and Approach LOS values are based on average delay for all vehicle movements. SIDRA Standard Delay Model used. Movement Performance – Pedestrians
Mov ID
Description Demand
Flow Average
Delay Level of Service
Average Back of Queue Prop. Queued
Effective Stop Rate Pedestrian Distance
ped/h sec ped m per ped P3 Across E approach 53 30.9 LOS D 0.1 0.1 0.66 0.66 P5 Across N approach 53 51.4 LOS E 0.2 0.2 0.86 0.86
All Pedestrians 106 41.2 LOS E 0.76 0.76

Page 32
Main North Road/Prestons Road Intersection (with right turn filter and a reduction of 10% for
right turning traffic) – 2021 PM Peak Hour
MOVEMENT SUMMARY Site: Main North Prestons 2021 PM_5b HHs - Peds - filter
- RT reduce 10% Signals - Fixed Time Cycle Time = 140 seconds (User-Given Cycle Time) Movement Performance – Vehicles Mov ID Turn Demand
Flow HV Deg. Satn Average
Delay Level of Service
95% Back of Queue Prop. Queued
Effective Stop Rate
Average Speed Vehicles Distance
veh/h % v/c sec veh m per veh km/h South: Main North Road
2 T 1568 5.0 0.639 7.4 LOS A 16.6 121.0 0.34 0.32 41.6 3 R 312 5.0 0.748 56.4 LOS E 17.5 128.0 0.91 1.07 21.2
Approach 1880 5.0 0.748 15.5 LOS B 17.5 128.0 0.44 0.44 35.9 East: Prestons Rd East
4 L 354 5.0 0.739 31.6 LOS C 15.4 112.7 0.68 0.79 28.4 6 R 262 5.0 0.693 61.5 LOS E 16.7 122.0 0.98 0.84 20.2
Approach 616 5.0 0.739 44.3 LOS D 16.7 122.0 0.81 0.82 24.2 North: Main North Road
7 L 216 5.0 0.741 26.5 LOS C 5.4 39.7 0.72 0.81 30.6 8 T 1140 5.0 0.686 33.8 LOS C 30.9 225.7 0.87 0.78 26.6
Approach 1356 5.0 0.741 32.6 LOS C 30.9 225.7 0.84 0.78 27.2 All Vehicles 3852 5.0 0.748 26.1 LOS C 30.9 225.7 0.64 0.62 30.1 Level of Service (LOS) Method: Delay (HCM 2000). Vehicle movement LOS values are based on average delay per movement Intersection and Approach LOS values are based on average delay for all vehicle movements. SIDRA Standard Delay Model used. Movement Performance - Pedestrians
Mov ID
Description Demand
Flow Average
Delay Level of Service
Average Back of Queue Prop. Queued
Effective Stop Rate Pedestrian Distance
ped/h sec ped m per ped P3 Across E approach 53 26.4 LOS C 0.1 0.1 0.61 0.61 P5 Across N approach 53 48.9 LOS E 0.2 0.2 0.84 0.84
All Pedestrians 106 37.7 LOS D 0.73 0.73