pcis final report 091007.doc | us epa archive document
TRANSCRIPT


September 2007
Environmental Technology Verification Report SKC, INC. SIOUTAS PERSONAL CASCADE IMPACTOR SAMPLER WITH LELAND LEGACY® PUMP
Prepared by Battelle
Under a cooperative agreement with
U.S. Environmental Protection Agency

September 2007
Environmental Technology Verification
Report
ETV Advanced Monitoring Systems Center
SKC, Inc. Sioutas Personal Cascade
Impactor Sampler with
Leland Legacy® Pump
by
Marielle Brinkman Kenneth Cowen
Amy Dindal Zachary Willenberg
Battelle
Columbus, Ohio 43201

ii
Notice
The U.S. Environmental Protection Agency (EPA), through its Office of Research and Development, has financially supported and collaborated in the extramural program described here. This document has been peer reviewed by the Agency. Mention of trade names or commercial products does not constitute endorsement or recommendation by the EPA for use.

iii
Foreword
The U.S. Environmental Protection Agency (EPA) is charged by Congress with protecting the nation’s air, water, and land resources. Under a mandate of national environmental laws, the Agency strives to formulate and implement actions leading to a compatible balance between human activities and the ability of natural systems to support and nurture life. To meet this mandate, the EPA’s Office of Research and Development provides data and science support that can be used to solve environmental problems and to build the scientific knowledge base needed to manage our ecological resources wisely, to understand how pollutants affect our health, and to prevent or reduce environmental risks. The Environmental Technology Verification (ETV) Program has been established by the EPA to verify the performance characteristics of innovative environmental technology across all media and to report this objective information to permitters, buyers, and users of the technology, thus substantially accelerating the entrance of new environmental technologies into the marketplace. Verification organizations oversee and report verification activities based on testing and quality assurance protocols developed with input from major stakeholders and customer groups associated with the technology area. ETV consists of six environmental technology centers. Information about each of these centers can be found on the Internet at http://www.epa.gov/etv/. Effective verifications of monitoring technologies are needed to assess environmental quality and to supply cost and performance data to select the most appropriate technology for that assessment. Under a cooperative agreement, Battelle has received EPA funding to plan, coordinate, and conduct such verification tests for “Advanced Monitoring Systems for Air, Water, and Soil” and report the results to the community at large. Information concerning this specific environmental technology area can be found on the Internet at http://www.epa.gov/etv/centers/center1.html.

iv
Acknowledgments
The authors wish to acknowledge the support of all those who helped plan and conduct the verification test, analyze the data, and prepare this report. We would like to thank the Mickey Leland National Urban Air Toxics Research Center for providing co-funding to perform the verification testing. We also appreciate SKC’s cooperation and prompt assistance in obtaining not only the test equipment but the Personal Environmental Monitor reference equipment as well. We would also like to thank the peer reviewers for their assistance in planning this verification test and carefully reviewing the test/QA plan and verification report. Specifically, we would like to acknowledge Jeff Cook of the California Air Resources Board, Ron Williams of the EPA (NERL), and Will Ollison of the American Petroleum Institute.

v
Contents
Page
Notice.............................................................................................................................................. ii
Foreword ........................................................................................................................................ iii
Acknowledgments.......................................................................................................................... iv
List of Abbreviations .......................................................................................................................x
Chapter 1 Background ....................................................................................................................1
Chapter 2 Technology Description .................................................................................................2
Chapter 3 Test Design.....................................................................................................................4 3.1 Pump Testing ................................................................................................................8 3.1.1 Moderate Temperature and Humidity (25ºC, 30%)..........................................8 3.1.2 Sampling Performance at Different Pressure Loads.........................................9 3.1.3 High Temperature and Moderate/High Humidity (40ºC, 60/90%).................10 3.2 Sampling Efficiency Comparison ...............................................................................11 3.2.1 Nozzle Selection .............................................................................................13 3.2.2 Sampler Placement..........................................................................................14 3.3 Sampling Metals in Ambient Air................................................................................16 3.4 Sampler Ease of Use, Reliability, and Subject Acceptance/Compliance ...................17
Chapter 4 Quality Assurance/Quality Control..............................................................................20 4.1 Flow Rate Checks .......................................................................................................20 4.2 Pressure Drop Checks .................................................................................................20 4.3 Field Replicates...........................................................................................................24 4.4 Field Blanks ................................................................................................................24 4.5 Checks of Metal/Element Analysis Accuracy ............................................................28 4.6 Gravimetric Measurement Checks..............................................................................30 4.7 Audits..........................................................................................................................31
4.7.1 Performance Evaluation Audit .........................................................................31 4.7.2 Technical Systems Audit..................................................................................33 4.7.3 Audit of Data Quality .......................................................................................33
4.8 QA/QC Reporting ......................................................................................................33 4.9 Data Review...............................................................................................................33 4.10 Deviation from the Test/QA Plan ..............................................................................35
Chapter 5 Statistical Methods and Reported Parameters..............................................................36 5.1 Comparability of Sampling Efficiency .......................................................................36 5.2 Variability ...................................................................................................................36 5.3 Metal/Element Detection ............................................................................................37 5.4 Ease of Use, Reliability and Subject Acceptance/Compliance...................................37
Chapter 6 Test Results ..................................................................................................................38

vi
6.1 Pump Testing ..............................................................................................................38 6.1.1 Moderate Temperature and Humidity (25ºC, 30%) .........................................38 6.1.2 Sampling Performance at Different Pressure Loads ........................................41 6.1.3 High Temperature and Moderate/High Humidity (40ºC, 60/90%) ..................46
6.2 Sampling Efficiency Comparison ...............................................................................46 6.2.1 PCIS:DCI-6 and PCIS:PEM TPM Comparisons .............................................48 6.2.2 PCIS:DCI-6 0.5 – 1.0 µm and [0.5 µm Comparisons......................................50 6.2.3 PCIS:FRM PM2.5 Comparison .........................................................................50
6.3 Sampling Metals in Ambient Air................................................................................52 6.4 Sampler Ease of Use, Reliability and Subject Acceptance/Compliance ....................56
6.4.1 Ease of Use and Subject Acceptability.............................................................56 6.4.2 Reliability and Subject Compliance .................................................................60
Chapter 7 Performance Summary.................................................................................................63 7.1 Pump Testing ..............................................................................................................63 7.2 Sampling Efficiency Comparison ...............................................................................64 7.3 Sampling Metals in Ambient Air................................................................................65 7.4 Ease of Use, Reliability, and Subjet Acceptance/Compliance ...................................65
Chapter 8 References ....................................................................................................................67
Figures
Figure 2-1. Components of SKC Sioutas PCIS ..............................................................................2
Figure 2-2. Sioutas PCIS and Leland Legacy® Pump ....................................................................2
Figure 3-1. Leland Legacy® Pumps (4) Inside the Constant Temperature and Humidity Chamber.........................................................................................................................................8
Figure 3-2. Leland Legacy® Pumps (4) Inside the Constant Temperature and Humidity Chamber (top) Connected to Electronic Flow Meters External to the Chamber (bottom)............9
Figure 3-3. Leland Legacy® Pumps (4) Connected to Flow Cells Equipped with Hot Wire Anemometers in a Constant Temperature and Humidity Chamber (top) For the Extreme Temperature (40ºC) and Moderate/High Humidity (60/90%) Tests. Data Logging Velocity Meters Used to Monitor the Pumps’ Flow Performance Were Located Outside the Chamber (bottom) ............................................................................10
Figure 3-4. Exploded Diagram of the PEM..................................................................................12
Figure 3-5. Schematic of the DCI-6..............................................................................................12
Figure 3-6. Schematic Diagram Showing the Location of Test and Reference Particle Samplers in the Large Environmental Chamber for the Sampling Efficiency Testing ...............14
Figure 3-7. Test and Reference Particle Samplers Inside the Battelle Environmental Chamber Just Prior to Aerosol Generation for the Sampling Efficiency Testing........................15

vii
Figure 3-8. The Leland Legacy® Pumps Were Placed Outside the Large Environmental Chamber (left), and Were Connected via Feedthroughs to the Sioutas PCIS (Test) and PEM (Reference) Samplers Inside the Chamber (right) .......................................................................16
Figure 6-1. Battery Operation Duration for Original and Retrofitted Pumps in 25ºC, 30% Relative Humidity Environment (n = 4 pumps per test)..............................................................41
Figure 6-2. Battery Operation Duration for Original (top) and Retrofitted (bottom) Pumps Sampling Under Different Pressure Drops (n = 4 pumps per test) ..................................42
Figure 6-3. Average Flow (L/min) for Original and Retrofitted (bottom) Pumps Sampling Under Different Pressure Drops (n = 4 pumps per test) ..............................................................43
Figure 6-4. Flow Rate (L/min) for Original Pump Test #2 at 19 inch H2O pressure drop ...........44
Figure 6-5. Sound Level (dB) for Original (top) and Retrofitted (bottom) Pumps Sampling Under Different Pressure Drops (n = 4 pumps per test) ..............................................................45
Figure 6-6. Comparison of TPM Collected Using Test (Sioutas PCIS) and Reference (DCI-6 and PEM 10 µm cutpoint) Sampler Gravimetric Results for TPM .............................................49
Figure 6-7. Comparison of PM2.5 Collected Using Test (Sioutas PCIS) and Reference (FRM PM2.5 and DCI-6 [2.0 µm cutpoint) Samplers ...........................................................................51
Figure 6-8. Detectable Metals/Elements Found in Ambient Air PM2.5 Collected Over a 48-hour Period using Test (Sioutas PCIS) and Reference (PEM) Samplers for Test 1...............52
Figure 6-9. Detectable Metals/Elements Found in Ambient Air PM2.5 Collected Over a 48-hour Period using Test (Sioutas PCIS) and Reference (PEM) Samplers for Test 2...............53
Figure 6-10. Detectable Metals/Elements Found in Ambient Air PM2.5 Collected Over a 48-hour Period using Test (Sioutas PCIS) and Reference (PEM) Samplers for Test 3...............53
Figure 6-11. Metal/Element Levels Detected in 48-hour Ambient Air PM2.5 Samples Collected Using Test (Sioutas PCIS) and Reference (PEM) Samplers .......................................54
Figure 6-12. Particle Distribution of Detectable Metals/Elements Measured in 48-hr Ambient Air (Columbus, OH) PM2.5 Samples Collected Using Sioutas PCIS Samplers............55
Figure 6-13. Comparison of the Pump Movement Data Logged by the Accelerometers with The Time/Activity Diary Data (Show in Red, 5 = High Activity) for Three Subjects Who Appeared to Follow the Sampling Protocol for the 48-hour Period ...........................................61
Figure 6-14. Comparison of the Pump Movement Data Logged by the Accelerometers with The Time/Activity Diary Data (Show in Red, 5 = High Activity) for Three Subjects Who Appeared to Stop Following the Sampling Protocol for the 48-hour Period..............................62
Tables
Table 3-1. Manufacturer’s Operating Specifications for the Leland Legacy® Pump and
Sioutas PCIS ..................................................................................................................................5
Table 3-2. Verification Test Activities ..........................................................................................6

viii
Table 3-3. Experimental Matrix for Sioutas PCIS Sampling Efficiency Comparison ................11
Table 3-4. Mass Mean Diameter, Geometric Standard Deviation, Number Mean Diameter, and Aerosol Generation Rate for Evaluated Nozzles..................................................13
Table 3-5. Instrument and Method Detection Limits (MDLs) for Metal/Element Analyses Using XRF ...................................................................................................................................18
Table 4-1. Summary of Section 3.1 Pump Testing Flow Rate and Pressure Drop Data .............21
Table 4-2. Summary of Sections 3.2-3.4 Sioutas PCIS Testing Flow Rate and Pressure Drop Data ..............................................................................................................................................22
Table 4-3. Field Replicates for the Sampling Efficiency Comparison Test ................................24
Table 4-4. PEMs Field Blank (PTFE, 37 mm) Summary of Detectable Metals/Elements .........25
Table 4-5. Sioutas PCIS After-Filter Field Blank (PTFE, 37 mm) Summary of Detectable Metals/Elements...........................................................................................................................26
Table 4-6. Sioutas PCIS Field Blank (PTFE, 25 mm) Summary of Detectable Metals/ Elements......................................................................................................................................27 Table 4-7. Summary of Quality Assurance Standards (QS), NIST-Certified Standard Reference Materials (SRMs), and Blind Performance Evaluation (PE) Samples Analyzed Using XRF ...................................................................................................................................29
Table 4-8. Summary of the Gravimetric Precision Data Collected During the Sampling Efficiency Comparison Testing ...................................................................................................30
Table 4-9. Summary of the Substrate Stability Data Collected During the Sampling Efficiency Comparison Testing ...................................................................................................31
Table 4-10. Summary of Performance Evaluation Flow Audits....................................................32
Table 4-11. Performance Evaluation Audit of the Analytical Balance .........................................32
Table 4-12. Summary of the Data Recording Process...................................................................34
Table 6-1. Flow Rate Variability (L/min) and Duration of Battery-Powered Original Pump Operation (Hours) at 25ºC and 30% Relative Humidity After a 15-hour Battery Charge ..........39
Table 6-2. Flow Rate Variability (L/min) and Duration of Battery-Powered Retrofitted Pump Operation (Hours) at 25ºC and 30% Relative Humidity After a 15-hour Battery Charge ..........40
Table 6-3. Test and Reference Sampler Gravimetric Comparisons .............................................47
Table 6-4. Summary of Comparison Between the Sioutas PCIS, DCI-6, and PEM for Particle Sizes from Test Aerosol...............................................................................................................48
Table 6-5. Comparison of Sioutas PCIS, DCI-6, and PEM (10 µm cutpoint) Sampler Gravimetric Results for TPM.......................................................................................................49
Table 6-6. Comparison of Sioutas PCIS and DCI-6 Sampler Gravimetric Results for Similar Aerodynamic Diameter Cutpoints...................................................................................50
Table 6-7. Summary of Comparison Between 48-hour Ambient Air PM2.5 Metal/Element Levels Collected Using the Test (Sioutas PCIS) and Reference (PEM) Samplers.....................55

ix
Table 6-8. Summary of Ease of Use, Reliability, and Subject Acceptability Questionnaire Responses (n = 7 Subjects) ..........................................................................................................57
Table 6-9. Subjects' and Laboratory Technicians' Comments and Suggestions Regarding the Sioutas PCIS Sampler ..................................................................................................................59
Appendices
Appendix A. PCIS Questionnaire .............................................................................................. A-1 Appendix B. Time/Activity Diary ..............................................................................................B-1

x
List of Abbreviations
A/C alternating current ACH air changes per hour AMS Advanced Monitoring Systems DCI-6 Delron cascade impactor, model DCI-6 cm2 square centimeter(s) CTHC constant temperature and humidity chamber dB decibel(s) EPA U.S. Environmental Protection Agency ETV Environmental Technology Verification FRM federal reference method ft foot/feet GC/ECD gas chromatograph with electron capture detection H2O water inch inch or inches KCl potassium chloride L/min liter(s) per minute µm micrometer(s) µg/m3 microgram(s) per cubic meter m3 cubic meter(s) mg/m3 milligram(s) per cubic meter mm millimeter(s) NERL National Exposure Research Laboratory NIST National Institute of Standards and Technology PCIS personal cascade impactor sampler PE performance evaluation PEM personal environmental monitor PM particulate matter PT performance test PTFE Polytetrafluoroethylene (Teflon®) QA quality assurance QC quality control QMP quality management plan QS quality assurance standard

xi
RPD relative percent difference RSD relative standard deviation (standard deviation ÷ mean x 100%) SD standard deviation SOP standard operating procedure SRM standard reference material TPM total particulate matter TSA technical systems audit Vdc volts direct current XRF X-ray fluorescence

1
Chapter 1 Background
The U.S. Environmental Protection Agency (EPA) supports the Environmental Technology Verification (ETV) Program to facilitate the deployment of innovative environmental technologies through performance verification and dissemination of information. The goal of the ETV Program is to further environmental protection by accelerating the acceptance and use of improved and cost-effective technologies. ETV seeks to achieve this goal by providing high-quality, peer-reviewed data on technology performance to those involved in the design, distribution, financing, permitting, purchase, and use of environmental technologies. ETV works in partnership with recognized testing organizations; with stakeholder groups consisting of buyers, vendor organizations, and permitters; and with the full participation of individual technology developers. The program evaluates the performance of innovative technologies by developing test plans that are responsive to the needs of stakeholders, conducting field or laboratory tests (as appropriate), collecting and analyzing data, and preparing peer-reviewed reports. All evaluations are conducted in accordance with rigorous quality assurance (QA) protocols to ensure that data of known and adequate quality are generated and that the results are defensible. The EPA’s National Exposure Research Laboratory and its verification organization partner, Battelle, operate the Advanced Monitoring Systems (AMS) Center under ETV. The AMS Center recently evaluated the performance of the SKC Inc. Sioutas Personal Cascade Impactor Sampler (PCIS) with the Leland Legacy® pump for measuring ambient particulate matter (PM). Personal cascade impactor samplers were identified as a priority technology category for verification through the AMS Center stakeholder process.

2
Chapter 2 Technology Description
The objective of the ETV AMS Center is to verify the performance characteristics of environmental monitoring technologies for air, water, and soil. This verification report provides results for testing the Sioutas PCIS. The following is a description of the Sioutas PCIS and the Leland Legacy® pump, based on information provided by the vendor (SKC Inc.). The information provided below was not verified in this test.
The Sioutas PCIS is designed to separate and collect airborne PM in specific size ranges, generally referred to as coarse, fine, and ultrafine. Results of the micro-environmental sampling performed with the Sioutas PCIS can be used to characterize particle mass, particle size, and chemical composition (constituents) of PM pollutants in air. The Sioutas PCIS was designed to be operated with the Leland Legacy® pump, which allows for 24-hour sampling on battery power. The Sioutas PCIS consists of four impaction stages (with a collector plate and an accelerator plate) followed by an after-filter (see Figure 2-1). Each impaction stage holds a 25 mm (0.5 µm pore size) impaction substrate that collects particles above a specific size (50% cut-point) starting from the largest
particles with aerodynamic diameters >2.5 µm, Stage A; and going smaller: 2.5 – 1.0 µm, Stage B; 1.0 – 0.5 µm, Stage C; and 0.5 – 0.25 µm, Stage D. The smallest particles (<0.25 µm) collect on a 37-mm (2.0 µm pore size) after-filter. The Sioutas PCIS, which is clipped onto a shirt lapel or pocket, is connected with tubing to a calibrated Leland Legacy® constant flow sample pump (Figure 2-2) that draws air through the impactor at 9 L/min. The 9 L/min flow rate must remain constant for
Figure 2-2. Sioutas PCIS and Leland Legacy® Pump.
Figure 2-1. Components of SKC Sioutas PCIS.
After-filter

3
precise particle separation. The chemically inert Teflon® impaction substrates and after-filter recommended for use in the Sioutas PCIS are well suited for both gravimetric analysis of PM mass and chemical analyses of PM constituents. The Sioutas PCIS is 3.4 inches tall by 2.2 inches wide (9.0 by 5.6 cm); its inlet is 3/8-inch outer diameter (0.95 cm), ¼-inch inner diameter (0.63 cm); and its outlet is 3/8-inch outer diameter, ¼-inch inner diameter. It weighs 5.6 ounces (159 grams). The price of the Sioutas PCIS is $505 and the Leland Legacy® pump costs $1,249. Together the pump and PCIS costs $1,754. Addi-tionally, impaction substrates are approximately $195 per 100 (each sampling requires four of these), and 50 collection filters cost approximately $230 (each sampling requires one of these). An optional noise reducing nylon case is also available at a cost of $87.

4
Chapter 3 Test Design
The objective of this verification test was to evaluate the Sioutas PCIS, coupled to the Leland Legacy® pump, on the basis of comparability with the sampling efficiency of three more well-known reference samplers; its ability to collect detectable levels of metals in ambient air; and its ease of use, reliability, and acceptance among volunteer subjects. Additionally, the verification test included an evaluation of the Leland Legacy® pump on the basis of duration of operation on a single battery charge sampling at different pressure drops, and 24-hour performance sampling under moderate and extreme temperature and humidity conditions. Prior to its introduction to the marketplace, the PCIS was characterized in the laboratory to corroborate the manufacturer’s stated cutpoints, and evaluate collection efficiency and particle loading. (1) This verification test will not repeat the manufacturer’s characterizations, but will instead proceed to the next logical step and conduct the evaluations described above. Ambient PM as an air pollutant has become a major public health concern in the past 10 years. Health effects studies have used ambient monitors to represent human exposures. Using personal monitors, which incorporate the effects of factors such as indoor pollutants and human time/activity patterns, can significantly improve the understanding of individual exposures to PM. Newly introduced into the marketplace, miniaturized PCISs are worn in a subject’s breathing zone, commonly clipped to a shirt collar, and separate and collect airborne particles onto a substrate in several size ranges, typically from 0.1 to 10 µm. These samplers are coupled to small, high-efficiency, battery-operated pumps that are designed to be capable of sampling for 24 hours on a single battery charge, and rugged enough to operate in hot, humid weather. The manufacturer’s operating specifications for the Leland Legacy® Pump(2) and the Sioutas PCIS(3) are shown in Table 3-1. During this verification test, the performance of the Leland Legacy® pump was monitored in terms of flow rate while the pump sampled under increasing pressure drop levels ranging from normal to extreme (1.7 times the manufacturer’s recommended compensation range). Time and magnitude of flow rate fluctuations and termination of operation were summarized. Sound level data for the pump operating in the noise-reducing case was measured at a distance of 0.5 meter from the pump in decibels (dB) and logged to a file during the testing of the pump performance under increasing pressure drop loads. Pump performance was also monitored in high temperature-moderate humidity (40°C-60%) and high temperature-high humidity (40°C-90%) environments. Again, time and magnitude of flow rate fluctuations and termination of operation were summarized.

5
Table 3-1. Manufacturer’s Operating Specifications for the Leland Legacy® pump and Sioutas PCIS.
Leland Legacy® Pump No. Description Specification L1 Flow Range 5 – 15 L/min
15 L/min at 5 inch H20 10 L/min at 12 inch H20 L2 Compensation Range 5 L/min at 20 inch H20
L3 Operating Temperature Range 0 - 45°C
L4 Typical Run Time –Sioutas PCIS (13 inch H20 at 9 L/min) –PEM (2.0 µm PTFE filter at 10 L/min)
24 hours 24 hours
L5
Noise Level (measured 1 meter distance from pump operating at 10 L/min and 12 inch H20) –Without case –Housed in noise-reducing case
64.1 dB 55.7 dB
Sioutas PCIS No. Description Specification
S1 Recommended After-Filter 37 mm diameter, 2.0 µm pore size PTFEa
S2 Recommended Impaction Substrate 25 mm diameter, 0.5 µm pore size PTFEb
S3 Flow Rate 9 L/min S4 Maximum Particle Load 3.16 mg per stage S5 After-Filter Maximum Operating Temperature 240°C
a SKC Cat. No. 225-1709 b SKC Cat. No. 225-1708 Three of the Leland Legacy® pumps failed during the extreme pressure drop tests, and one failed during the high temperature, moderate relative humidity test. Testing was halted after the fourth pump failure. The vendor, SKC, examined the four failed pumps and found that in each case the crank-arm pivot pin came loose from the diaphragm yoke assembly. SKC stated that the failures were due to operating the pumps at conditions outside the recommendations shown in Table 3-1, and that this problem had never been evidenced under normal field conditions. Nevertheless, SKC retrofitted the pumps with a new pin that has a hexagonal head designed to prevent this type of failure. In order to evaluate the retrofitted pumps, Battelle repeated all of the pump testing on the newly retrofitted pumps. SKC will incorporate this new pin design into Leland Legacy pumps manufactured by them. The sampling efficiency of the Sioutas PCIS was compared with that of several reference samplers, and comparisons were reported as a relative percent difference of the means. Reference and test samplers were collocated in an environmental chamber where they sampled a test potassium chloride (KCl) aerosol for a defined period of time. Sampling efficiency determinations were made gravimetrically for all stages. The reference samplers employed in

6
this comparison included four Federal Reference Methods (FRMs) for PM with particle diameters of ≤2.5 µm (PM2.5 FRMs), four personal environmental monitors (PEMs, 10 µm cutpoint), and four Delron Cascade Impactor (DCI-6) samplers (16, 8, 4, 2, 1, and 0.5 µm cutpoints). This task involved four of each test and reference impactor samplers and was repeated three times to measure inter- and intra-sampler variability. The verification test for the Sioutas PCIS was conducted by Battelle from January 16, 2006 through February 7, 2007, according to procedures specified in the Test/QA Plan for Verification of Personal Cascade Impactor Samplers (PCISs) forMeasuring Ambient Particulate Matter (PM).(4) X-ray fluorescence (XRF) analyses were carried out by Chester LabNet according to EPA Compendium Method IO-3.31. (5) Table 3-2 shows the verification schedule by month and year and test activity. The longer than normal period of testing resulted from the necessity to repeat the pump testing on pumps that were newly retrofitted by the manufacturer to improve performance under extreme operating conditions. The Leland Legacy® pump, in both its original and retrofitted form, was evaluated for the following performance parameters: Sampling duration Operation in extreme temperature/humidity Sampling performance at different pressure drops.
The Sioutas PCIS, coupled to the Leland Legacy® pump, was evaluated for the following performance parameters: Comparability of sampling efficiency Ability to collect detectable levels of metals in ambient air Operational factors (ease of use, reliability, etc.) Subject acceptability/compliance.
Table 3-2. Verification Test Activities.
Month (Year) Test Activity Parameters
Pump Testing – Original Pumps Pump Evaluation January - August (2006)
Set up/installed PCISs in constant temperature and humidity chamber
Selected critical orifices to equal impactor pressure drop (11 inch H2O)
Equipped pumps with data-logging flow meters
Measured pre- and post-experiment pressure drop and flow rate
Equipped chamber with data-logging sound-level meter
Duration of operation (monitored via flow rate) on single battery charge at moderate-temperature and low-humidity (25°C, 30%) conditions
Flow rate for 24 hours of battery operation in high-temperature, moderate-humidity (40°C, 60%) and high-temperature, high-humidity (40°C, 90%) conditions
Flow rate and noise level for duration of operation (single battery charge) under three pressure drops, ranging from 11 to 19 inch H2O

7
Table 3-2. Verification Test Activities (continued)
Month (Year) Test Activity Parameters
Sampling Efficiency Comparison Comparing PCISs to Reference Samplers January -
March (2006)
Set up/installed PCISs in environmental chamber
Set up/installed reference samplers in environmental chamber
Generated test KCl aerosol Measured pre- and post-experiment pressure drop and flow rate
Determined mass associated with each particle size range
Mass associated with each particle size range (µg/m3)
Pre- and post-experiment pressure drop (inch H2O) and flow rate (L/min)
Sampling Metals in Ambient Air Comparing PCISs to PEMs March - February (2006-2007)
Set up/installed PCISs in chamber Set up/installed PEMs in chamber Collected ambient air for 48 hours Measured pre- and post-experiment pressure drop and flow rate
Analyzed substrate filters for metals
Pre- and post-experiment pressure drop (inch H2O) and flow rate (L/min)
Target metal concentrations (ng/m3) associated with each particle size range in 48-hour ambient air sample
Sampler Ease of Use, Reliability, and Subject Acceptability/ Compliance PCIS Evaluation Parameters
April - May
(2006)
Recruited 7 subjects Explained sampling protocol, basic pump operation, time/activity diary to each subject
Characterized pump/PCIS and equipped with accelerometer; released to subject
After 48-hour sampling period, characterized pump/PCIS, downloaded accelerometer data
Subject provided time/activity diary and written response to questionnaire
Compensated subject for participation in study
Pre-and post-experiment pressure drop (inch H2O) and flow rate (L/min)
Qualitative subject acceptance and compliance with sampling protocol (questionnaire)
Semi-quantitative subject compliance with sampling protocol (compare gross accelerometer data with time/activity diary)
June – July
(2006)
Vendor performs analysis of failed pumps, retrofits original pumps with a specially designed pin, performs short- and long-term performance tests on retrofitted pumps and then sends retrofitted pumps to Battelle for ETV verification testing.
Pump Testing – Retrofitted Pumps Pump Evaluation August –
September (2006)
Set up/installed PCISs in constant temperature and humidity chamber
Selected critical orifices to equal impactor pressure drop (11 inch H2O)
Equipped pumps with data-logging flow meters
Measured pre- and post-experiment pressure drop and flow rate
Equipped chamber with data-logging sound-level meter
Duration of operation (monitored via flow rate) on single battery charge at moderate-temperature and low-humidity (25°C, 30%) conditions
Flow rate for 24 hours of battery operation in high-temperature, moderate-humidity (40°C, 60%) and high-temperature/high-humidity (40°C, 90%) conditions
Flow rate and noise level for duration of operation (single battery charge) under three pressure drops, ranging from 11 to 19 inch H2O

8
3.1 Pump Testing
All of the pump testing was performed on the group of four original pumps and four retrofitted pumps, with the exception of the high temperature, high humidity testing; the fourth original pump failed prior to the completion of this testing, prompting SKC’s re-design and retrofit of all of the pumps. Each group of pumps (original and retrofitted) was tested in triplicate for each completed evaluation; these replicates are referred to in the discussion as Test 1, Test 2, and Test 3. All pump testing was performed with each pump clad in a noise-reducing nylon case (Model No. 224-89, SKC). Moderate temperature and humidity conditions were selected to mimic typical indoor environments, and high temperature and humidity conditions were selected to mimic outdoor summertime environments. 3.1.1 Moderate Temperature and Humidity (25ºC, 30%) To evaluate sampling duration, four Leland Legacy® pumps were placed inside a constant temperature and humidity chamber, as shown in Figure 3-1, under moderate temperature and low humidity conditions (25ºC, 30%) and evaluated to determine the duration that each pump sampled on a single battery charge. Prior to their being placed in the chamber, the four pumps were allowed to operate using battery power until the battery charge decayed such that the pumps no longer functioned. The batteries were then charged for 15 hours. After the batteries were charged, the pumps were placed inside the chamber and configured with a flow meter (TopTrak, Sierra Instruments) external to the chamber and allowed to sample the chamber environment, as shown in Figure 3-2. The length and diameter of the tubing was chosen to yield a pressure drop of 11 inch H2O to simulate the pressure drop of the Sioutas impactor. Analog data (0-5 Vdc) were collected from each of the flow meters using a PCMCIA data acquisition card (DAQCard 1200, National Instruments), laptop personal computer (Latitude 6100, Dell), and LabView (ver. 6.1, National Instruments) software. The pumps were allowed to run until the battery charge decayed and the pumps stopped functioning. The flow rate for each pump was logged electronically (analog output, 0-5 Vdc corresponding to 0-10 L/min) throughout the test.
Figure 3-1. Leland Legacy® Pumps (4) Inside the Constant Temperature and Humidity Chamber.

9
Figure 3-2. Leland Legacy® Pumps (4) Inside the Constant Temperature and Humidity Chamber (top) Connected to Electronic Flow Meters External to the Chamber (bottom). 3.1.2 Sampling Performance at Different Pressure Loads. To evaluate sampling at different pressure loads, four Leland Legacy® pumps were outfitted with flow meters and precision orifices and/or tubing lengths and allowed to discharge and charge as described above. A series of tests were conducted in which the pumps were independently connected to three different critical orifices and/or tubing lengths, yielding pressure drops of 11, 15, and 19 inch H2O. The pumps were allowed to run in an unoccupied (to limit noise

10
interference) laboratory held at 24 ± 1ºC and 29 ± 17% relative humidity, until the battery charge decayed and all of the pumps stopped functioning. Flow rate (analog output, 0 – 5 Vdc corresponding to 0-10 L/min) for each pump and overall sound level data (analog output, 0 – 4 Vdc corresponding to a dynamic range of 0-80 dB) was logged electronically throughout the experiment. Three of the original pumps stopped functioning during the course of these tests. The tests were also performed on the retrofitted pumps. 3.1.3 High Temperature and Moderate/High Humidity (40ºC, 60/90%) Four Leland Legacy® pumps were allowed to discharge and charge as described above. They were then outfitted with precision orifices and connected to flow cells containing hot wire anemometer data logging velocity meters (435, Testo), as shown in Figure 3-3.
Figure 3-3. Leland Legacy® Pumps (4) Connected to Flow Cells Equipped with Hot Wire Anemometers in a Constant Temperature and Humidity Chamber (top) for the Extreme Temperature (40ºC) and Moderate/High Humidity (60/90%) Tests. Data Logging Velocity Meters Used to Monitor the Pumps’ Flow Performance Were Located Outside the Chamber (bottom).

11
The pumps’ battery-powered operation was evaluated for 24 hours in high-temperature, moderate-humidity (40ºC, 60%) and high-temperature, high-humidity (40ºC, 90%) atmospheres. Flow rate data were logged electronically throughout the 24-hour period. When conducting these tests on the original pumps, only the first test was completed, at which point testing of the original pumps was halted due to the failure of the fourth pump. The tests were also performed on the retrofitted pumps.
3.2 Sampling Efficiency Comparison
The sampling efficiency of the PCIS “test” samplers was evaluated through comparisons with three “reference” samplers using a laboratory generated test aerosol (KCl) in a well-mixed environmental chamber (17.3 m3). The sampling efficiency chamber tests were conducted in triplicate for each completed comparison; these replicates are referred to in the discussion as Test 1, Test 2, and Test 3. The reference samplers were chosen based on the following parameters: 1) similar flow rates, 2) similar aerodynamic diameter cutpoints, 3) well characterized in the literature, and 4) availability to the study. The number and type of air samplers used to collect samples, the particle size cutpoint ranges, the number of samples collected for gravi-metric analyses, and the pumps and flow rates for the samplers are summarized in Table 3-3. The PEM, shown in an exploded diagram in Figure 3-4, is a personal
Table 3-3. Experimental Matrix for Sioutas PCIS Sampling Efficiency Comparison. Sampler Pump, Flow
Rate No. of Samplers
in Chamber Particle
Diameter Cutpoints (µm)
No. of Samples for Gravimetric
Analysis > 2.5 4
m1.0 and [2.5 4 m0.5 and [1.0 4 m0.25 and [0.5 4
Sioutas Personal Cascade Impactor Sampler (Test)
Leland Legacy®, 9
L/min 4
<0.25 4
Total 20 PEMS
Environmental Monitor
(Reference)
SKC, 10 L/min 4 [10 4
PM2.5 FRM (Reference)
Internal, 16.7 L/min 4 [2.5 4
>16 4 m8.0 and [16 4 m4.0 and [2.5 4 m2.0 and [4.0 4 m1.0 and [2.0 4 m0.5 and [1.0 4
Delron DCI-6 Cascade Impactor
(Reference)
Gast, 3 pumps at 12.5 L/min, 1 at 28.0
L/min
4
<0.5 4 Total 28

12
Figure 3-4. Exploded Diagram of the PEM.
air sampler that is well characterized and has been used extensively in the field for human exposure studies.(6-23) The FRM is the federal standard instrument used for regulatory purposes in the United States.(24, 25) The DCI-6, shown schematically in Figure 3-5, was introduced in the late 1950s,(26) and its glass plate impaction substrates that don’t require temperature and humidity conditioning make it a convenient tool for measuring particle size distribution.(27-35) Each test was conducted in triplicate to establish precision, and four of each of the samplers were used in each test in order to measure inter- and intra-sampler variability.
Figure 3-5. Schematic of the DCI-6.

13
3.2.1 Nozzle Selection
Three nozzles (Air Atom, Airlife, and 3Jet Collision) were evaluated on the basis of their ability to produce gravimetrically measurable quantities of particles on all of the test sampler’s aerodynamic diameter cutpoints, which range from <0.25 to >2.5 µm. The nozzles were evaluated using an aqueous KCl solution (5 %) by spraying the resulting aerosols into a static box while the particle distribution was monitored using a wide-range particle spectrometer (WPS, 1000 XP, MSP Corp.) operated by scanning the entire particle diameter size range, 10 nm – 10 µm. The mass mean diameters, geometric standard deviations, number mean diameters, and aerosol generation (solution consumption) rates were measured for each of the three nozzles, and are shown in Table 3-3. The Airlife (002002, Baxter) nozzle was chosen because it had a midrange aerosol generation rate of particles distributed across the entire targeted range of 0.1 - 10 µm. The final aerosol for the three sampling efficiency tests was generated by pressurizing (60 psi) a nebulizer container (~1 L) filled with an aqueous KCl solution (5%) and equipped with the Airlife nozzle, with a solution consumption rate of 0.57 mL/min. For Test 1, the aerosol was generated during the first 15 minutes of the one-hour sampling period. This aerosol generation period resulted in a heavy loading on the PEM’s filters that was sufficient to produce a post-sampling pressure drop greater than 20 inch H2O for three of the four PEMs. For this reason, the aerosol generation time was reduced to 10 minutes for Tests 2 and 3. Although pressure drops continued to exceed 20 inch H2O, the time could not be reduced any further since the 10 minute aerosol generation time resulted in particle quantities on the lowest Sioutas cutpoint (<0.25 µm) that were at or below the balance detection limit. It should be noted that the aerosol concentrations for these tests are several orders of magnitude higher than those typically collected in the field; however, this was done so that measurable quantities of material could be obtained on all stages of the Sioutas PCIS.
Table 3-4. Mass Mean Diameter, Geometric Standard Deviation, Number Mean Diameter, and Aerosol Generation Rate for Evaluated Nozzles.
Nozzle
Mass Mean
Diameter (µm)
Geometric Standard Deviation
Number Mean
Diameter (µm)
Aerosol Generation
Rate (mL/min)
Air Atom (1/4 J SS, Spray Systems Co.) 1.545 2.56 0.122 12.6
Airlife (002002, Baxter) 1.014 2.79 0.104 0.57
3Jet Collision (CN24, BGI) 0.573 2.39 0.104 0.38

14
3.2.2 Sampler Placement Four Sioutas PCISs were equally spaced in Battelle’s environmental chamber. Four PEM samplers (10 µm cutpoint), four FRMs, and four Delron (DCI-6) samplers were also placed similarly inside the chamber with their sampling inlets ~1 meter from the Sioutas PCISs. The air inlets for each of the FRMs were 1.2 meters from the floor of the chamber, and 1.8 meters away from one another. The two-dimensional spatial location of the test and reference samplers is depicted schematically in Figure 3-6, and a photograph of the setup is shown in Figure 3-7. To avoid generating aerosols other than the test aerosol inside the chamber, the DCI-6 pumps were placed outside the chamber and tubing was connected to the DCI-6 samplers inside the chamber via feedthrough ports in the chamber’s south wall. It was not practical to place the Sioutas, PM2.5 FRM, and PEMs sampling pumps outside the chamber, and thus these pumps were located inside the chamber and were powered by A/C outlets, also located inside the chamber. To account for the air drawn out of the chamber by the DCI-6 pumps, the environmental chamber was balanced with ADCO clean air at an approximate replenishment rate of 65 L/min; 35 L/min of this was used to produce the test aerosol and 30 L/min was makeup air. The air exchange rate for all three tests, measured using SF6 tracer gas and Gas Chromatography/ Electron Capture Detection (GC/ECD) analysis (one measurement every 5 min), was 0.26 ± 0.1 air changes per hour (ACH).
Nebulizer
KEY
Box Fan (stationary)
Pedestal Fan (oscillating)
PM 2.5 FRM
Delron Cascade Impactor
Sioutas Personal Cascade Impactor
Personal Environmental Monitor
))((
))((
Figure 3-6. Schematic Diagram Showing the Location of the Test and Reference Particle Samplers in the Large Environmental Chamber for the Sampling Efficiency Testing.

15
Figure 3-7. Test and Reference Particle Samplers Inside the Battelle Environmental Chamber Just Prior to Aerosol Generation for the Sampling Efficiency Testing.

16
Preliminary Chamber Characterization. The environmental chamber (L x W x H = 4.88 x 1.52 x 2.32 m) is constructed of aluminum and was equipped with two large fans to promote mixing. Prior to testing, preliminary experiments were conducted to verify that the aerosol was uniformly mixed throughout the chamber. During these experiments, four DCI-6 samplers were equally spaced on the floor (5 x 16 ft) of the chamber at a height of ~1.1 m and allowed to sample the chamber environment while the test aerosol was generated for one hour. The cascade impactor glass plates were then recovered and the mass of the particulate was determined gravimetrically. Inter-sampler coefficients of variation did not exceed 10% for the three particle aerodynamic diameter cutpoints of interest, namely <0.5 µm: 8.5%; m0.5 and [1.0 µm: 9.1%; and m1.0 and [2.0 µm: 9.2%. Based upon these results, it was determined that the dispersion of the test aerosol in the chamber was adequate to perform the sampling efficiency comparison without introducing bias because of sampler placement.
3.3 Sampling Metals in Ambient Air
The ability of the Sioutas PCIS to collect sufficient sample to detect metals in ambient air during a 48-hour sampling period was evaluated and compared with collocated PEM reference samplers. The sampling metals in ambient air tests were conducted in triplicate; these replicates are referred to in the discussion as Test 1, Test 2, and Test 3. Four test Sioutas PCISs and four PEMs (2.5 µm cutpoint) were placed in the chamber with their pumps located outside the chamber, as shown in Figure 3-8. Clean sample handling techniques for trace metals analysis, including the use of stainless steel tweezers, powder-free gloves, and Tyvek body suits (Micro-Clean 2-1-2 Frocks, VWR), were used to load, and collect substrates from these samplers.
Figure 3-8. The Leland Legacy® Pumps Were Placed Outside the Large Environmental Chamber (left), and Were Connected via Feedthroughs to the Test Sioutas PCIS and Reference PEM Samplers Inside the Chamber (right).

17
Ambient air drawn from the outside flowed through the environmental chamber for a period of 48 hours and was sampled by the Sioutas PCIS and PEM samplers. The air exchange rate of the chamber was measured at the beginning and end of each test using SF6 tracer gas and continuous GC/ECD analysis (5 measurements, 1 per hour). The average air exchange rate for the three tests was 0.93 ±0.05 ACH. At the beginning and end of the 48-hour sampling period, the pressure drop and flow rate were measured for all samplers. After sampling, the exposed substrates corresponding to the different particle size ranges were analyzed for the 38 target metals and elements shown in Table 3-4 using XRF. Approximate instrument and method detection limits (MDLs) for these techniques are also listed in Table 3-5. Although the focus of the test was on characterizing metals in ambient air, we have included data in the discussion that follows from other non-metallic elements that were also observed.
3.4 Sampler Ease of Use, Reliability, and Subject Acceptability/Compliance
In addition to the performance evaluation described above, this verification test established a qualitative and semi-quantitative assessment of the burden human subjects associate with using the Sioutas PCIS. Although this portion of the verification included the use of human subjects, Battelle’s Internal Review Board (IRB) reviewed the protocol and determined on October 25, 2005, that this portion of the testing did not require the preparation of a Human Subject’s Committee application, because wearing the Sioutas PCISs would not expose study participants to risk, and time/activity diaries and questionnaire responses would not be directly linked to the study participants’ names or other unambiguous identifying information. Battelle received formal notification via e-mail from EPA on March 20, 2006, stating that the EPA Exposure Research Laboratory (NERL) Division Director Human Exposure and Atmospheric Sciences Division, and the NERL Human Subjects Research Official agreed with the Battelle IRB assessment. Seven non-smoking subjects were recruited to wear the PCIS for a period of 48 hours and keep a simple time/activity diary for that period. Subjects were compensated $75 for their participation in the study. The subjects were each fitted with a Sioutas PCIS and Leland Legacy® pump at Battelle. Each pump was clad in a noise-reducing nylon case (Model No. 224-89, SKC). The subjects were instructed to wear the Sioutas PCIS during all the activities they conducted for the next 48-hour period, with the exception of sleeping and showering/bathing. Subjects were instructed to put the Sioutas PCIS and Leland Legacy® pump on the nightstand and plug it into the A/C adaptor at bedtime so that the PCIS would continue to sample their environment while they slept. Likewise, the subjects were instructed to place the Sioutas PCIS and Leland Legacy® pump on the bathroom counter, or other suitable surface, with the pump still operating during showering/bathing. At the end of the sampling period, subjects returned to Battelle and turned in their pumps and their completed time/activity diaries. They were then asked to fill out a questionnaire to gather information about the pump’s ease of operation, reliability, and their acceptance of the device. Ease of use and reliability was also evaluated by our Battelle laboratory technicians during sampler setup and return.

18
Table 3-5. Instrument and Method Detection Limits (MDLs) for Metal/Element Analyses Using XRF.
Metal
Instrument Detection Limit
(ng/filter)
Approximate Method Detection
Limit (ng/m3)a Mg 140 5.6 Na 1200 47 Al 64 2.5 Si 45 1.7 P 39 1.5 S 32 1.2 Cl 39 1.5 K 24 0.9 Ca 16 0.6 Ti 11 0.4 V 8.0 0.3 Cr 8.0 0.3 Mn 13 0.5 Fe 10 0.4 Co 6.8 0.3 Ni 6.8 0.3 Cu 6.8 0.3 Zn 8.0 0.3 Ga 17 0.7 Ge 16 0.6 As 14 0.5 Se 11 0.4 Br 10 0.4 Rb 11 0.4 Sr 18 0.7 Y 17 0.7 Zr 21 0.8 Mo 28 1.1 Pd 58 2.2 Ag 61 2.4 Cd 63 2.4 Sn 110 4.2 Sb 88 3.4 I 160 6.1
Ba 680 26 La 410 16 Hg 28 1.1 Pb 32 1.2
aAssume 48-hour sampling period, 9 L/min sampling flow rate.

19
The pumps were equipped with small, data-logging multidirectional accelerometers (AW-64, Mini Mitter Co., Inc.) that measured and logged occurrence and intensity of activity. These data provided an objective measure of subject protocol compliance during the 48-hour sampling period. Subjects were not made aware of the fact that the pump contained a device that recorded its movements, and the device was hidden inside the pump’s noise-reducing jacket. At the beginning and end of the sampling period the pressure drop and flow rate of each sampler was measured. As this portion of the testing was designed to evaluate sampler ease of use, reliability, and subject acceptability/ compliance, no gravimetric or analytical determinations were performed on the substrates collected during this testing.

20
Chapter 4 Quality Assurance/Quality Control
Quality Assurance/Quality Control (QA/QC) procedures were performed in accordance with the quality management plan (QMP) for the AMS Center(36) and the test/QA plan(4) for this verification test. Fixed site air sampling and gravimetric analyses were performed based on guidelines specified in EPA’s PM2.5 method(24, 25) for monitoring ambient air, and metals analyses were performed based on guidelines specified in EPA’s Compendium Method IO-3.3.(5) These measurements were subject to the data quality control requirements summarized in the test/QA plan.(4)
4.1 Flow Rate Checks
The flow rate of each reference sampler and each Sioutas PCIS was measured at the beginning of each test as described in Sections 3.1 through 3.4. When, at the beginning of each test, the measured flow rate varied by more than 10% from the manufacturer’s recommended values, the reference sampler or Sioutas PCIS was removed from the test, and repair or maintenance was performed according to the vendor’s recommendations. Leland Legacy® pump maintenance consisted of recalibrating the pump using a piston calibrator (SKC, DC-Lite, model 717-03) and an automatic calibration device (SKC, Calchek Communicator Smart Adapter). Sioutas PCIS maintenance consisted of disassembling the sampler and making sure the plastic filter retainer rings were pressed flush to the impaction plate. The sampler was re-included in the test once the initial flow rate fell within the 10% limits. The flow rate of each reference sampler and each Sioutas PCIS was also measured at the end of each sampling period and recorded. When the flow rate varied by more than 10% from the manufacturer’s recommended values, the data from the reference sampler or Sioutas PCIS were flagged. Initial and final flow rate and pressure drop data for the tests described in Section 3.1 are summarized in Table 4-1. Initial and final flow rate and pressure drop data for the tests described in Sections 3.2 – 3.4 are summarized in Table 4-2.
4.2 Pressure Drop Checks
The pressure drop of each Sioutas PCIS was measured at the start of each sampling period. Prior to conducting the tests described in Section 3.1, the initial pressure drop was adjusted to within 10% of the target pressure drop. For the remaining tests described in Sections 3.2 – 3.4, when the measured pressure drop for the Sioutas PCIS was less than 11 or exceeded 16 inch H2O, the PCIS was removed from the test, and leak checks, repair, or maintenance was performed

21
Table 4-1. Summary of Section 3.1 Pump Testing Flow Rate and Pressure Drop Data. Test
Design Section
Test Cond.a
Test No.
Date (MMDDYY) Summary of Flow Rate and Pressure Drop Checks
1 011606 2 012006 3.1.1Ob Normal 3 012306
Initial flow and pressure drop data within 10% variance; no Final data collected (batteries were discharged)
1 080806 2 081006 3.1.1R Normal 3 081506
Initial flow and pressure drop data within 10% variance; no Final data collected (batteries were discharged)
1 040306 2 040606 3.1.2O-11″ Normal 3 041006
Initial flow and pressure drop data within 10% variance; no Final data collected (batteries were discharged)
1 081806 2 082106 3.1.2.R-11″ Normal 3 082306
Initial flow and pressure drop data within 10% variance; no Final data collected (batteries were discharged)
1 042406 2 042806 3.1.2.O-15″ Extreme 3 050206
Initial flow and pressure drop data within 10% variance; no final data collected (batteries were discharged); SN 14359c,d failed during Test 2
1 082506 2 083006 3.1.2R-15″ Extreme 3 090106
Initial flow and pressure drop data within 10% variance; no final data collected (batteries were discharged)
1 051106 SN 16042d failed during test 2 051606 Initial flow and pressure drop data within 10% variance 3.1.2O-19″ Extreme 3 051806 SN 14407d failed during test 1 090506 2 090706 3.1.2R-19″ Extreme 3 091106
Initial flow and pressure drop data within variance; no final data collected (batteries were discharged)
3.1.3O 40ºC, 60% Normal 1 061506 Initial and Final flow and pressure drop data within 10%
variance; SN 20993d failed after test was completed 1 091706 2 091906 3.1.3R
40ºC, 60% Normal 3 092006
Initial and Final flow data within 10% variance; Final pressure drop for 4 pumps was outside variance: SN 16159 23%, 13%, -23% for Tests 1-3, SN 16177 -16% for Test 2
3.1.3O 40ºC, 90% Testing for the original pumps was halted on 9/21/06 due to 4 pump failures
1 092206 2 092506 3.1.3R
40ºC, 90% Normal 3 092606
Initial and Final flow data within 10% variance; Final pressure drop for 5 pumps was outside variance: SN 16159 -23%, -14%, -14% for Tests 1-3, SN 16177 -18%, -23% for Tests 1, 2
b Test Conditions; “Normal” = test conditions within manufacturer’s operating specifications L1 – L5, shown in Table 3-1; “Extreme” = test conditions outside manufacturer’s operating specification L2, shown in Table 3-1.
b “O” denotes test was performed on original pumps, “R” denotes test was performed on retrofitted pumps. c “SN12345” identifies a Leland Legacy® pump having a manufacturer’s serial number of 12345. d Increased backpressure broke the crank-arm pivot pin loose from the diaphragm yoke assembly.

22
Table 4-2. Summary of Sections 3.2-3.4 Sioutas PCIS Testing Flow Rate and Pressure Drop Data.
Test Design Section
Test Cond.a
Test No.
Date (MMDDYY)
Summary of Flow Rate and Pressure Drop Checks
1 020106
Final flow for 1 PEM pump was outside variance: SN16042 -17%; Final pressure drop was outside variance for all PEMs: SN 20960b 23.8″ H2O, SN 20982 20.0″ H2O, SN 20993 22.1″ H2O, SN 16042 21.2″ H2O
2 020206
Initial and Final flows within variance; Final pressure drop was outside variance for all PEMs: SN 20960 19.6″ H2O, SN 20982 21.5″ H2O, SN 20993 19.9″ H2O, SN 16042 20.0″ H2O
3.2
Extreme L2
Normal S1-S5
3 020306
Initial and Final flows within variance; Final pressure drop was outside variance for all PEMs: SN 20960 22.0″ H2O, SN 20982 23.0″ H2O, SN 20993 21.2″ H2O, SN 16042 20.8″ H2O
1 020207 Initial and Final flows and pressure drops within variance
2 020407 Initial and Final flows and pressure drops within variance 3.3
Extreme L4
Normal S1-S5 3 020707 Initial and Final flows and pressure drops within
variance F01c 042706 F02 042706
Initial and Final flows and pressure drops within variance
M03 050506 Initial and Final flows within variance, Final pressure drop outside variance: SN 20993 17.5″ H2O
F04 050206 Initial and Final flows and pressure drops within variance
F05 051006 Initial and Final flows within variance, Final pressure drop outside variance: SN 20982 17.5″ H2O
F06 051606 Initial and Final flows and pressure drops within variance
3.4
Extreme L4
Normal S1-S5
F07 052206 Initial and Final flows within variance, Final pressure drop outside variance: SN 20982 18.0″ H2O
a Test Conditions; “Normal” = test conditions within manufacturer’s operating specifications for Leland Legacy® pump and Sioutas PCIS shown in Table 3-1; “Extreme” = test conditions outside manufacturer’s operating specifications shown in Table 3-1.
b “SN12345” identifies a Leland Legacy® pump having a manufacturer’s serial number of 12345. c “F01” refers to subject identification code F01.

23
according to the vendor’s recommendations. Sioutas PCIS maintenance consisted of disassembling the sampler and making sure the plastic filter retainer rings were pressed flush to the impaction plate. The PCIS was re-included in the test once the initial pressure drop fell within the 11 to 16 inch H2O range. The pressure drop of each Sioutas PCIS was also measured at the end of each sampling period and recorded. When the pressure drop fell outside the 11 to 16 inch H2O range, the data were flagged. For reference samplers used in the tests described in Sections 3.2 and 3.3, if the initial pressure drop exceeded the manufacturer’s recommended value by more than 10%, maintenance was performed on the sampler until the measured pressure drop fell within the 10% range. If the final pressure drop fell outside the 10% range, the data were recorded and flagged. This happened routinely for the PEM samplers in the sampling efficiency comparison test (i.e., Section 3.2). The aerosol generation time, originally set at 15 minutes for Test 1, was reduced to 10 minutes for Tests 2 and 3 in an effort to reduce the sample loading of the PEMs. However, pressure drops continued to exceed 20 inch H2O for the PEMs, but the time could not be reduced any further since the 10 minute aerosol generation time resulted in particle quantities on the lowest Sioutas cutpoint (<0.25 µm) that were at or below the balance detection limit. It should be noted that the aerosol concentrations for the sampling efficiency comparison testing are several orders of magnitude higher than those typically collected in the field; however, this was done so that we would obtain measurable quantities of material on all stages of the Sioutas PCIS. Although these filter loadings did not exceed the manufacturer’s specified maximum particle load for the Sioutas PCIS, 3.16 mg per stage, they did result in pressure drops that were outside the manufacturer’s specified compensation range for the Leland Legacy® pump, as shown previously in Table 3-1, No. L2. SKC states that the extended operation of the pumps at higher than specified backpressures was the cause of the pump failures during testing. The increased backpressure of the initial tests was great enough to break the crank-arm pivot pin loose from the diaphragm yoke assembly. Although this has never been evidenced under normal field conditions, SKC designed a new hexagonal-shaped pin head to ensure that this failure would not occur. The new pin design will be incorporated into all Leland Legacy pumps manufactured by SKC.

24
4.3 Field Replicates
For the sampling efficiency comparison test, four replicates for test and reference samplers were collected to establish the variability of the test and reference samplers. The data for the first test are summarized in Table 4-3. The relative standard deviation from the mean for all cutpoints shown in Table 4-3 fell within 30%, verifying the well-mixed state of the chamber. The variability exhibited by each set of four samplers is below 15% in all instances, with the exception of the m2.0 and [4.0 µm cutpoint for the DCI-6 sampler. This is due to the fact that the amount of material on these slides for that stage was at or near the gravimetric detection limit. The low variability of these data indicate a well-mixed chamber. Table 4-3. Field Replicates for the Sampling Efficiency Comparison Test.
Test Aerosol KCl Concentration (mg/m3)
Sampler Cutpoint (µm) Rep A Rep B Rep C Rep D R.S.D
(%) <0.25 1.08 0.82 1.05 0.93 12.3
m0.25 and [0.50 1.38 1.34 1.28 1.23 5.0 m0.50 and [1.0 0.89 0.95 0.96 0.98 4.2 m1.0 and [2.5 0.63 0.76 0.76 0.76 9.1
Sioutas PCIS
>2.5 0.23 0.23 0.07a 0.27 9.0 <0.50 2.97 3.84 3.36 3.18 11.0
m0.50 and [1.0 0.60 0.79 0.59 0.66 14.3 m1.0 and [2.0 0.61 0.66 0.62 0.74 9.0 DCI-6
m2.0 and [4.0 0.27 0.23 0.19 0.14 28.4 PEM [10 4.37 4.62 4.47 4.31 3.1 FRM [2.5 4.08 3.89 4.58 4.60 8.4
aSample pellet broke; most of the sample was lost and therefore this data point was not included in the analysis. 4.4 Field Blanks
To verify that the detectable metals/elements determined for the tests described in Section 3.3 were not a result of contamination, field blanks were processed at a rate of 10% of the real samples collected. Field blank substrates were stored and treated exactly like actual samples, with the exception that no sampling was performed on these substrates. Two types of field blanks were analyzed: (1) a PTFE 37 mm filter, which is used for sample collection in the PEM and is also used for the Sioutas PCIS after-filter, and (2) a 25 mm PTFE, which is used for sample collection in the first four stages of the Sioutas PCIS. Tables 4-4, 4-5, and 4-6 present the analytical results for the collected air samples and the field blanks for the PEM, the Sioutas PCIS after-filter, and the smaller Sioutas PCIS substrates, respectively. Only those metals/

25
Table 4-4. PEMs Field Blank (PTFE, 37 mm) Summary for Detectable Metals/Elements. (µg/filter)
Metal Test No.a Sample
Level
Average Field Blank Level (n = 3)
10x MDL Comments
1 2.23 ± 0.08 2 2.13 ± 0.04 Si 3 1.21 ± 0.03
0.10 ± 0.06 0.6 Blank subtracted samples
1 9.16 ± 0.44 2 9.30 ± 0.27 S 3 12.2 ± 0.40
< 0.02 0.2 Blank subtraction not needed
1 4.30 ± 0.14 2 5.93 ± 0.25 Cl 3 1.72 ± 0.14
<0.05 0.5 Blank subtraction not needed
1 1.06 ±0.07 2 1.33 ± 0.06 K 3 1.27 ±0.05
0.02 ± 0.01 0.2 Blank subtracted samples
1 1.93 ± 0.17 2 2.22 ± 0.10 Ca 3 1.26 ± 0.13
0.02 ± 0.01 0.2 Blank subtracted samples
1 1.40 ± 0.10 2 1.98 ± 0.11 Fe 3 1.39 ± 0.03
0.07 ± 0.05 0.2 Blank subtracted samples
1 0.53 ± 0.05 2 2.35 ±0.14 Zn 3 0.56 ± 0.04
< 0.02 0.2 Blank subtraction not needed
1 4.16 ± 0.49 2 6.65 ± 0.69 Na 3 3.05 ± 0.37
<0.39 3.9 Blank subtraction not needed
1 0.85 ± 0.04 2 0.68 ± 0.08 Al 3 0.34 ± 0.07
0.08 ± 0.04 0.9 Blank subtracted samples; field blank > 10%, flagged data
a The 48-hour ambient air sampling tests were conducted on the following days: Test 1, 2/2/07; Test 2, 2/4/07; Test 3, 2/7/07. N = 4 for each sampler and test.

26
Table 4-5. Sioutas PCIS After-Filter Field Blank (PTFE, 37 mm) Summary of Detectable Metals/Elements.
(µg/filter)
Metal Test No.a Sample
Level
Average Field Blank Level (n = 3)
10x MDL Comments
1 0.23 ± 0.06 2 0.27 ± 0.02 Si 3 0.28 ± 0.02
0.10 ± 0.06 0.6 Blank subtracted samples; field blank > 10%, flagged data
1 4.08 ± 0.19 2 4.45 ± 0.35 S 3 6.30 ± 0.26
< 0.02 0.2 Blank subtraction not needed
1 0.11 ± 0.10 2 0.07 ± 0.00 Cl 3 0.08 ± 0.00
<0.05 0.5 Blank subtraction not needed
1 0.36 ±0.02 2 0.48 ± 0.02 K 3 0.55 ±0.03
0.02 ± 0.01 0.2 Blank subtracted samples
1 0.11 ± 0.02 2 0.13 ± 0.04 Ca 3 0.13 ± 0.01
0.02 ± 0.01 0.2 Blank subtracted samples; field blank > 10%, flagged data
1 0.08 ± 0.02 2 0.14 ± 0.02 Fe 3 0.31 ± 0.04
0.07 ± 0.05 0.2 Blank subtracted samples; field blank > 10%, flagged data
1 0.10 ± 0.03 2 0.15 ±0.01 Zn 3 0.18 ± 0.03
< 0.02 0.2 Blank subtraction not needed
1 0.56 ± 0.29 2 0.59 ± 0.26 Na 3 0.57 ± 0.27
<0.39 3.9 Blank subtraction not needed
1 0.08 ± 0.02 2 0.08 ± 0.02 Al 3 0.07 ± 0.00
0.08 ± 0.04 0.9 Field blank ≈ Sample Level, flagged data
a The 48-hour ambient air sampling tests were conducted on the following days: Test 1, 2/2/07; Test 2, 2/4/07; Test 3, 2/7/07. N = 4 for each sampler and test.

27
Table 4-6. Sioutas PCIS Field Blank (PTFE, 25 mm) Summary of Detectable Metals/Elements.
(µg/filter)
Metal Test No.a Sample
Levelb
3x Average Field Blank
Level (n = 3)c 10x MDL Comments
1 0.73 ± 0.06 2 0.78 ± 0.09 Si 3 0.42 ± 0.05
0.09 ± 0.03 0.6 Blank subtracted samples; field blank > 10%, flagged data
1 1.75 ± 0.15 2 2.08 ± 0.09 S 3 1.93 ± 0.22
< 0.01 0.2 Blank subtraction not needed
1 2.44 ± 0.15 2 3.36 ± 0.22 Cl 3 1.46 ± 0.04
< 0.20 2.8 Blank subtraction not needed
1 0.47 ± 0.06 2 0.56 ± 0.06 K 3 0.43 ± 0.05
0.13 ± 0.06 1.4 Blank subtracted samples; field blank > 10%, flagged data
1 1.18 ± 0.07 2 1.43 ± 0.03 Ca 3 0.78 ± 0.06
0.14 ± 0.07 1.1 Blank subtracted samples; field blank > 10%, flagged data
1 0.86 ± 0.06 2 1.64 ± 0.06 Fe 3 0.83 ± 0.09
0.09 ± 0.02 1.1 Blank subtraction not needed
1 0.34 ± 0.06 2 2.60 ±0.30 Zn 3 0.35 ± 0.07
< 0.05 0.7 Blank subtraction not needed
1 1.96 ± 0.15 2 0.98 ± 0.32 Na 3 1.15 ± 0.18
0.24 ± 0.01 3.4 Blank subtracted samples; field blank > 10%, flagged data
1 0.29 ± 0.05 2 0.27 ± 0.03 Al 3 0.19 ± 0.02
0.08 ± 0.04 1.0 Blank subtracted samples; field blank > 10%, flagged data
a The 48-hour ambient air sampling tests were conducted on the following days: Test 1, 2/2/07; Test 2, 2/4/07; Test 3, 2/7/07. N = 4 for each sampler and test.
b Sample consists of the sum of the levels found in three substrates: m0.25 and [0.5, m0.5 and [1.0, and m1.0 and [2.5 µm.
c Numbers in this column are the average concentration found in a set of three filters multiplied by three in order to facilitate comparison with the Sample Level column, which shows the sum of the levels found in three substrates.
elements for which detectable levels were measured in the majority of the recovered substrates are included in these tables. Sample results were field blank-corrected, as indicated in Table 4-4 through 4-6, in any instance where the field blank average was above the method detection limit and determined to be statistically higher than zero.

28
When the field blanks showed contamination that was above the MDL and greater than 10% of the samples’ metal/element concentration, sample collection materials were examined until the source of contamination was found or eliminated. This was the case for Si, K, and Na in the 25 mm substrates, and Si and Ca in the 37 mm substrates, and Al in all of the substrates. Na and Al levels measured in the test and reference sampler substrates were at the MDL, and thus were not included in the analyses. Although the field blank contamination levels of Si, K, and Ca were low, either at or slightly above the MDL, comparatively they were 10-20% of the levels found in the ambient air samples. To reduce this type of crustal element contamination, it is recom-mended to perform impactor loading and unloading in a Class 100 (or better) cleanroom, which was not available for this verification test. None of the field blanks had metal/element concentrations that exceeded 10 times the MDL; therefore the levels included in the sampler comparability analysis are genuine and not due to contamination of the filters. 4.5 Checks of Metal/Element Analysis Accuracy Three types of QA/QC samples were analyzed to ensure the accuracy of the metal/element analysis using XRF: 1) quality assurance standards (QSs), 2) National Institute of Standards and Technology (NIST)-certified standard reference materials (SRMs), and 3) blind performance evaluation (PE) samples. The results are summarized in Table 4-7. All of the QA/QC standards analyzed during the testing passed the acceptance criterion, which is discussed in further detail for each type of QA/QC standard below. The XRF was calibrated only when fluorescers, X-ray tubes, or detectors were changed or a serious malfunction occurred. Calibration verification QSs, or multi-element thin film vapor-deposited standards on mylar, were analyzed every analytical run as a check of the instrument’s operation. When the results were not within 10% of the expected value, the analysis was terminated and the cause of the QS failure was determined. Repeated failures required a recalibration of any excitation condition not meeting the required limits, and the samples associated with the failed QS were reanalyzed. NIST-certified SRMs were analyzed alongside the samples. When the percent recovery for any of the target metals/elements in the SRM fell outside the NIST-certified uncertainty, analysis was terminated and the cause of the SRM failure was determined. The excitation condition in which the failure occurred was recalibrated and the samples associated with the failed SRM were reanalyzed. The percent recovery (R) of a given metal was calculated using Equation (1):
RCC
M
T= × 100% (1)
where: CM = measured concentration (µg/cm2) CT = theoretical or certified concentration (µg/cm2)

29
Blind performance evaluation (PE) samples were analyzed as part of the PE audit (see Section 4.8.1) to assess the quality of the metal/element measurements made in this verification test. When the percent recovery measured for any target metal/element in the PE sample fell outside the 80 to 120% range, the instrumentation was examined and serviced or maintained as needed, and the PE samples were reanalyzed. During the verification testing, none of the QA/QC sample results fell outside of the acceptable range.
Table 4-7. Summary of Quality Assurance Standards (QS), NIST-Certified Standard Reference Materials (SRMs), and Blind Performance Evaluation (PE) Samples Analyzed using XRF.
Type Analysis
Date (MMDDYY)
Metal/ Element
Theoretical/ Certified Measured Recovery
(%)
Si(0) 1757 1794 102 Si(1) 41.13 38.10 93 QS 285a
(n=1) 030606 Fe(3) 1915 1935 101 Si(0) 1684 1681 100 QS 285
(n = 7) 021507 thru
022307 Fe(3) 1809 1818 101 Si 34.0 ± 1.1 33.0 ± 1.3 97 030606 Ca 19.4 ± 1.3 20.0 ± 0.1 103 Si 34.0 ± 1.1 35.1 ± 0.5 103
NISTb 1832 (n = 4) 021507 thru
022307 Ca 19.4 ± 1.3 21.1 ± 0.5 109 Si 31.5 ± 2.1 30.4 ± 1.2 96 K 16.4 ± 1.6 16.8 ± 0.9 102 Fe 13.6 ± 0.4 13.4 ± 0.6 99 030606
Zn 3.9 ± 0.3 3.8 ± 0.2 97 Si 31.5 ± 2.1 33.1 ± 0.3 105 K 16.4 ± 1.6 15.5 ± 0.2 94 Fe 13.6 ± 0.4 13.2 ± 0.2 97
NIST 1833 (n = 4)
021507 thru 022307
Zn 3.9 ± 0.3 3.9 ± 0.1 101 030606 S 2.5 ± 0.2 2.4 ± 0.1 98 NIST 2708
(n = 4) 021507 thru 022307 S 2.5 ± 0.2 2.4 ± 0.04 96
Ca 13.2 ± 1.7 13.9 ± 1.0 106 Fe 26.5 ± 1.6 28.3 ± 0.51 107 K 5.28 ± 0.52 5.44 ± 0.21 103 Zn 1.79 ± 0.13 2.10 ± 0.22 117 S 1.05 ± 0.26 1.09 ± 0.11 104
Blind PE NISTc 2783
(n =3)
030606, 033006 thru
040506, 021507 thru
022307 Si 58.6 ± 1.6 54.6 ± 7.1 93
a QS data is reported in counts per second. b NIST SRM certified mass loadings for SRMs 1832, 1833, and 2708 are reported in µg/cm2
c NIST SRM certified and reference mass loadings for SRM2783 are reported in µg/filter

30
4.6 Gravimetric Measurement Checks Samples were conditioned for at least 24 hours in a microbalance laboratory that was kept at 22 ± 1ºC and 44 ± 2.5% relative humidity, and these limits were not exceeded during the gravimetric testing period. The calibration of the analytical balances was checked using NIST-traceable mass reference standards that spanned the range of weights measured, i.e., 100 to 300 mg, prior to and at the completion of gravimetric determinations. Balances were also checked with these weights after the measurement of every 10 actual samples. The measurement of the certified weights fell within the ±10 µg acceptability criterion, and thus the balance did not require recalibration or repair during the testing period. A summary of the gravimetric precision data collected during the three sampling efficiency comparison tests is presented in Table. 4-8. The stability of the substrates was also checked by reweighing 10% of the samples from the previous batch of samples. Table 4-9 shows the mean of the differences between original and reweighed results for the various samples and substrates. For several of the substrate types, laboratory and field blank re-weighs did not fall within ±15 µg of the previously made measurements. The standard deviations of the differences are also presented to indicate the variability in the measurements. The temperature and humidity logs for the balance room were examined for those periods during which sample conditioning or sample weighing occurred, and no anomalies in these records were found. For the DCI-6 backup filter (DCI-F), some of the variability in the weighing results can be explained by the fact that these filters were too large to be weighed on the 6-decimal place precision balance, and were instead weighed on a 4-decimal place precision balance. Although the substrate stability varies as much as two times the specified range for the 6-decimal place measurements, and as much as 14 times the 4-decimal place measurements, this variability, when compared to the gravimetric comparison levels, which are at milligram levels (2-3 orders of magnitude larger), is negligible. Within a given weighing session, all of the replicate weights were well within ±5 µg of the previously made measurements. Table 4-8. Summary of the Gravimetric Precision Data Collected During the Sampling Efficiency Comparison Testing.
Measured (Mean ± Std Dev, mg) Test 100 mg Std
(n = 8) 200 mg Std
(n = 24) 1 100.003 ± 0.003 200.006 ± 0.004 2 100.004 ± 0.002 200.006 ± 0.003 3 100.003 ± 0.003 200.007 ± 0.002

31
Table 4-9. Summary of the Substrate Stability Data from Weighing and Re-Weighing Substrates Collected During the Sampling Efficiency Comparison Testing.
Sample Type na Samplerb Original Weight – Reweigh (Mean ± Std Dev, µg)
3 PCIS 3 ± 6 3 FRM -6 ± 11 3 PEM/PCIS-L -11 ± 11 1c DCI-6 -40
Laboratory Blank
3 DCI-F 0 ± 100d 6 PCIS 7 ± 18 6 FRM 18 ± 20 8 PEM/PCIS-L 20 ± 12 10 DCI-6 31 ± 21
Field Blank
3 DCI-F -200 ± 200 16 PCIS 0 ± 3 6 FRM 2 ± 4 8 PEM/PCIS-L 1 ± 4 17 DCI-6 1 ± 2
Session Replicate
2 DCI-F -1 ± 1 a n = number of observations b PCIS = Sioutas personal cascade impactor sampler (25 mm PTFE substrate), FRM = Federal Reference Method
sampler (47 mm PTFE substrate), PEM/PCIS-L = Personal Environmental Monitor and Sioutas PCIS after-filter (both use a 37 mm PTFE substrate), DCI-6 = Delron Cascade Impactor (37 mm glass plate), and DCI-F = Delron Cascade Impactor backup filter (80 mm PTFE substrate)
c Two of the laboratory blank glass slides broke before they were re-weighed. d DCI-F filters were too large to weigh on the 6-decimal place balance; and thus were weighed on a 4-decimal place
balance.
4.7 Audits
4.7.1 Performance Evaluation Audit
Several PE audits were conducted during the verification test. These PE audits included checks of the test and reference sampler flow rates, checks of the analytical balance, and blind PESs for metals analyses. The PE criteria for flow, mass, and blind PESs are summarized in Sections 4.1, 4.6, and 4.5, respectively. During the pump testing, a flow audit of all of the pumps was conducted. During the sampling efficiency comparison testing, a flow audit of all of the FRM samplers and one of the DCI-6 reference samplers was conducted using a flow standard independent of that used to calibrate the reference samplers, and the results are shown in Table 4-10. None of the measured flow rates exceeded the manufacturer’s recommended values by more than 10%.

32
Table 4-10. Summary of Performance Evaluation Flow Audits.
Date (MMDDYY)
Sampler Target ±
Tolerance (L/min)
A (L/min) B (L/min)
FRM-SN 200FB206850507 16.7a 16.76b FRM-SN 200FB206840507 16.7 16.86 FRM-SN 200FB205120107 16.7 16.86 012306
FRM-BGI BPN X-57397
16.7 ± 1.67
16.65 16.65 11.60c 11.67b 11.62 11.62 020306 DCI-6 A 12.5 ± 1.25 11.57 11.67
Leland Legacy® Pump-SN 14168 (n =3) 8.95 ± 0.06c 8.97 ±0.02b
Leland Legacy® Pump-SN 16042 (n =3) 9.67 ± 0.02 9.75 ± 0.01
Leland Legacy® Pump-SN 14140 (n =3) 8.96 ± 0.09 9.05 ± 0.02
050206
Leland Legacy® Pump-SN 14407 (n =3)
9.0 ± 0.9
9.22 ± 0.06 9.21 ± 0.04
a “A” flows measured using each FRM’s internal flow meter b “B” flows measured with Dry Cal DC-2 DC-HC-1, 500 mL/min – 30 L/min, S/N 104947, Cert #32242 c “A” flows measured with Dry Cal DC-Lite, S/N 104345, Cert #29915 Audits of the analytical balance were conducted using certified mass standards independent of those used for calibration or routine calibration checks, and the results are summarized in Table 4-11. The audit measurement of the certified weights fell within ±10 µg of the certified value. During the sampling metals in ambient air testing, blind PE samples were analyzed to assess the quality of the measurements made in this verification test, and the results for the metals/elements that were detected in the 48-hr ambient air samples are shown in Table 4-7. None of the percent recoveries measured for the blind PE sample fell outside the 80 – 120% range. The blind PE samples were purchased from NIST (SRM 2783) and provided as unknowns by the Verification Test Coordinator to Chester LabNet, who was responsible for analyzing them. Table 4-11. Performance Evaluation Audit of the Analytical Balance.
Date Target ± Tolerance (mg) A (mg)a B (mg)b 100 ± 0.010 100.002 100.000 2/3/06 200 ± 0.010 200.008 200.010
a “A” weights = Rice Lakes, SN 0T1X, Met. Lab. Control # C17826. b “B” weights = Rice Lakes, SN 1H1B, Met. Lab. Control # C16471.

33
4.7.2 Technical Systems Audit
The Battelle Quality Manager conducted two technical systems audits (TSAs) on 2/3/06 and 5/2/06, to ensure that the verification test was performed in accordance with the AMS Center QMP,(36) the test/QA plan,(4) published reference methods, and any standard operating procedures (SOPs) used by Battelle. As part of the audit, the Battelle Quality Manager reviewed the reference methods, compared actual test procedures to those specified or referenced in this plan, and reviewed data acquisition and handling procedures. The Battelle Quality Manager also toured the environmental chamber laboratory and observed the fixed site sampling or human subject chamber testing; inspected documentation of sample chain of custody; and reviewed PCIS-specific record books. In addition, the Battelle Quality Manager checked calibration certifications for test measurement devices. Observations and findings from this audit were documented and submitted to the Battelle Verification Test Coordinator for response. During the Pump Testing TSA, the Battelle Quality Manager noted that the pump testing that included measurement and logging of sound level was conducted in a vacated laboratory, instead of the constant temperature and humidity chamber, as stated in the test/QA plan. As a result of this finding, a deviation to the test/QA plan, described more fully in Section 4.10 of this report, was submitted by the Verification Test Coordinator to the Battelle Quality Manager. The records concerning the TSA are permanently stored with the Battelle Quality Manager.
4.7.3 Audit of Data Quality
At least 10% of the data acquired during the verification test were audited. The Battelle Quality Manager or designee traced the data from initial acquisition, through reduction and statistical comparisons, to final reporting. All calculations performed on the data undergoing the audit were checked.
4.8 QA/QC Reporting
Each assessment and audit was documented in accordance with Section 3.3.4 of the AMS Center QMP.(35) Once the assessment report was prepared, the Battelle Verification Test Coordinator responded to each potential problem and implemented any necessary follow-up corrective action. The Battelle Quality Manager ensured that follow-up corrective action was taken. The results of the TSA were sent to the EPA.
4.9 Data Review
Records generated in the verification test were reviewed before they were used to calculate, evaluate, or report verification results. Table 4-12 summarizes the types of data recorded. The review was performed by a technical staff member involved in the verification test, but not the staff member who originally generated the record. The person performing the review added his/her initials and the date to a hard copy of the record being reviewed.

34
Table 4-12. Summary of Data Recording Process.
Data to Be Recorded Responsible
Party Where Recorded How Often Recorded
Disposition of Data
Dates, times, and details of each test procedure, PCIS maintenance, down time, etc.
Battelle ETV laboratory record book
Start/end of experiments
Summarized and incorporated into verification report
Initial and final flow rate, pressure drop
Battelle Sampler run data sheet
Start/end of experiments
Incorporated into verification report
Pre- and post-sampling substrate mass
Battelle Substrate preparation and analysis data sheet
Start/end of gravimetric analyses
Incorporated into verification report
XRF QS calibration verification information
Chester LabNet
Prior to use of XRF to quantify metals content of substrates
With every enumeration
Incorporated into verification report
Subject time/activity diary
Participant Handwritten on time/activity diary form
Recorded continuously throughout 48-hour field study
Summarized in the verification report
Subject questionnaire responses
Participant Handwritten on questionnaire form
At the completion of the field study
Summarized in the verification report

35
4.10 Deviation from the Test/QA Plan
The following deviation from the test/QA plan was documented and approved by the AMS Center Manager. The pump testing that measured duration of operation and sound level when the pumps sampled across pressure drops of 11, 15, and 19 inch H2O was not conducted inside a constant temperature and humidity chamber. This deviation did not compromise the validity of the verification data. The deviation from our original experimental design was necessary because the noise level of the circulation fan (87 dB) that operates inside the constant temperature and humidity chamber exceeded the combined noise level of the four pumps. Therefore, changes in the noise level of the pumps operating inside that chamber were not discernable. This testing was instead conducted in a vacated laboratory with stable room temperatures (23-25ºC) and ambient humidity (12-45%), as measured using a microprocessor-based temperature and humidity recorder (Omega, CT485B). The laboratory allowed us to measure changes in noise level when sampling across different pressure drops.

36
Chapter 5 Statistical Methods and Reported Parameters
The methods presented in this chapter were used to verify the performance parameters listed in Section 3.1.
5.1 Comparability of Sampling Efficiency
The comparability of the Sioutas PCISs was assessed in terms of the relative percent difference (RPD) of the mean of four replicate Sioutas PCIS measurements with respect to the mean of the four replicate measurements of the reference samplers, using Equation (2):
RPDC C
CPCIS REF
REF=
−× 100% (2)
where: C PCIS = mean particle or metal mass concentration (µg/m3) measured by the PCISs CREF = mean particle or metal mass concentration (µg/m3) measured by reference samplers. The RPD was calculated and reported separately for comparisons of each PCIS with the PM2.5 FRM and the PEM, as well as for the corresponding stages of the Battelle impactor.
5.2 Variability
Inter-pump/sampler variability (V) was assessed in terms of relative standard deviation from the mean of four replicate pumps/samplers, according to Equation (3):
Vn
CSD
nC
i
ii
ni
n
= ±⎡
⎣⎢
⎤
⎦⎥
×
=
= ∑∑1
1100
1
1 (3)
where: Ci = duration of pump operation for pump i, or particle or metal mass concentration
(µg/m3) for sampler i SD = standard deviation of the sample (n=4)

37
The intra-pump/sampler variability (Vi) was assessed in terms of relative standard deviation from the mean of three replicate test runs, according to Equation (4):
Vn
CSD
nC
i i ji
i jj
nj
n
= ±⎡
⎣⎢
⎤
⎦⎥
×
=
= ∑∑1
1100
1
1,
,
(4)
where: Ci,j = duration of pump operation for pump i, or particle or metal mass concentration (µg/m3)
for sampler during Test Run j SDi = standard deviation of the sample (n=3).
5.3 Metal/Element Detection
The collection ability of the PCIS for a given metal/element was judged against the analytical method detection limits for each target analyte divided by the volume of air sampled by the PCIS during a 48-hour period. The analytical method detection limits (ng/filter) were determined according to EPA Compendium Method IO-3.3, (4) and are presented in Table 3-5. The concentration (CM) of the PCIS (ng/m3) for a given metal/element in ambient air was calculated using Equation (5):
CS
F TM
M
A=
×× 1000 (5)
where: SM = concentration (ng/filter) of the metal/element in the collected substrate sample FA = average flow rate (L/min) during the 48-hour sampling period T = time period air was sampled (min). Target metals/elements were reported as detectable if CM was greater than the analytical detection limit. The analytical detection limits of the XRF analyses are three times the uncertainty for each given metal/element. All detectable analytical results for the test and reference sampler substrates collected are presented and compared.
5.4 Ease of Use, Reliability, and Subject Acceptance/Compliance
Aspects of the PCIS performance such as ease of use, reliability, and subject acceptance and compliance are discussed in Section 6. Also addressed are qualitative observations of the verification staff pertaining to the performance of the PCIS.

38
Chapter 6 Test Results
The performance of the Sioutas PCIS and the Leland Legacy® pump is discussed in the following sections.
6.1 Pump Testing
As described in Section 3, during testing half of the Leland Legacy pumps failed under extreme testing conditions. As a result, the pumps were retrofitted with new pins to correct the source of failure. In the following section we report the results of testing with the original and the retrofitted pumps.
6.1.1 Moderate Temperature and Humidity (25ºC, 30%)
The results of the moderate temperature and humidity tests for the original pumps are summarized in Table 6-1. In general, all pumps operated on battery power at the specified flow rate (9 L/min, corresponding to ~4.5 Vdc) for 28 – 34 hours. Among the four pumps, inter-pump duration of operation deviated by less than 7% for all three tests. Across the three tests, intra-pump duration of operation deviated by less than 6%. During their period of operation, flow rates, measured indirectly as the analog output of the flow meters, deviated by less than 1% for all pumps in all tests. Inter- and intra-pump flow rates deviated less than 4% during each test and among the three tests The results of the moderate temperature and humidity tests for the retrofitted pumps are summarized in Table 6-2. In general, all pumps operated on battery power at the required flow rate for 31 – 35 hours. Among the four pumps, inter-pump duration of operation deviated by less than 5% for all three tests. Across the three tests, intra-pump duration of operation deviated by less than 6%. During their period of operation, flow rates deviated by less than 2% for all pumps in all tests, indicating that the pump flows stayed steady throughout the testing until the battery died and then the flow dropped to zero. Inter- and intra-pump flow rates deviated less than 2% during each test and among the three tests. The retrofitted pumps show a slightly longer duration of battery operation than the original pumps, circa 6%, as shown in Figure 6-1, but approximately the same flow variation.

39
Table 6-1. Flow Rate Variability (L/min) and Duration of Battery-Powered Original Pump Operation (Hours) at 25ºC and 30% Relative Humidity After a 15-hour Battery Charge.
Pump IDa 1 2 3 4
Inter-Pump Mean ± SD,
Vdc (RSD, %) Test 1, 1/16/06 Mean ± SD, L/min
(RSD, %) 8.22 ± 0.04
(0.4%) 8.18 ± 0.05
(0.6%) 8.65 ± 0.05
(0.5%) 8.60 ± 0.04
(0.4%) 8.41 ± 0.25
(2.9%) Operation (hrs) 30.8 31.9 34.2 33.3 32.5 ± 1.5
(4.6%) Test 2, 1/20/06 Mean ± SD, L/min
(RSD %) 8.71 ± 0.05
(0.6%) 8.21 ± 0.06
(0.8%) 8.68 ± 0.06
(0.6%) 8.65 ± 0.06
(0.7%) 8.56 ± 0.24
(2.8%) Operation (hrs) 30.0 33.5 32.1 31.5 31.8 ± 1.5
(4.6%) Test 3, 1/23/06 Mean ± SD, L/min
(RSD %) 8.70 ± 0.04
(0.5%) 8.29 ± 0.05
(0.6%) 8.76 ± 0.05
(0.6%) 8.60 ± 0.04
(0.5%) 8.59 ± 0.21
(2.4%) Operation (hrs) 28.4 33.4 30.4 32.2 31.1 ± 2.2
(7.0%) Intra-Pump Summary Mean ± SD, L/min
(RSD %) 8.54 ± 0.28
(3.3%) 8.23 ± 0.06
(0.7%) 8.69 ± 0.06
(0.7%) 8.62 ± 0.03
(0.3%) Operation (hrs) 29.7 ± 1.2
(4.0%) 32.9 ± 0.9
(2.8%) 32.2 ± 1.9
(5.9%) 32.3 ± 0.9
(2.9%)
a Pump IDs match to the following serial numbers: 1 = SN14168, 2 = SN14359, 3 = SN14140, and 4 = SN14407.

40
Table 6-2. Flow Rate Variability (L/min) and Duration of Battery-Powered Retrofitted Pump Operation (Hours) at 25ºC and 30% Relative Humidity After a 15-hour Battery Charge.
Pump IDa 1 2 3 4
Inter-Pump Mean ± SD,
Vdc (RSD, %) Test 1, 8/8/06
Mean ± SD, Vdc (RSD, %)
8.83 ± 0.06 (0.6%)
8.59 ± 0.05 (0.6%)
8.66 ± 0.06 (0.7%)
8.58 ± 0.13 (1.5%)
8.67 ± 0.11 (1.3%)
Operation (hrs) 32.2 34.7 34.1 31.4 33.1 ± 1.6 (4.8%)
Test 2, 8/10/06 Mean ± SD, Vdc
(RSD %) 8.78 ± 0.05
(0.5%) 8.58 ± 0.03
(0.3%) 8.64 ± 0.03
(0.4%) 8.57 ± 0.03
(0.4%) 8.64 ± 0.10
(1.1%) Operation (hrs) 33.7 35.0 33.6 35.1 34.4 ± 0.8
(2.4%) Test 3, 8/15/06
Mean ± SD, Vdc (RSD %)
8.81 ± 0.07 (0.8%)
8.57 ± 0.03 (0.4%)
8.63 ± 0.03 (0.4%)
8.51 ± 0.04 (0.4%)
8.63 ± 0.13 (1.5%)
Operation (hrs) 34.0 34.5 33.8 32.8 33.8 ± 0.7 (2.2%)
Intra-Pump Summary Mean ± SD, Vdc
(RSD %) 8.81 ± 0.02
(0.3%) 8.58 ± 0.01
(0.1%) 8.64 ± 0.02
(0.2%) 8.56 ± 0.04
(0.4%) Operation (hrs) 33.3 ± 1.0
(3.1%) 34.8 ± 0.2
(0.7%) 33.8 ± 0.3
(0.9%) 33.1 ± 1.9
(5.7%)
a Pump IDs match to the following serial numbers: 1 = SN14168, 2 = SN14359, 3 = SN14140, and 4 = SN14407.

41
Test 1 Test 2 Test 3
Dur
atio
n of
Ope
ratio
n (H
ours
)
0
10
20
30
40 OriginalRetrofitted
Figure 6-1. Battery Operation Duration for Original and Retrofitted Pumps in 25ºC, 30% Relative Humidity Environment, Error Bars Represent One Standard Deviation from the Mean (n = 4 pumps per test).
6.1.2 Sampling Performance at Different Pressure Loads
Duration of Operation
The results of the battery-powered duration of operation sampling under three different pressure drops are shown for the original and retrofitted pumps in Figure 6-2. All of the original and retrofitted pumps sampled for 30 hours or longer under a pressure drop of 11 inch H2O. When sampling under a 15 inch H2O pressure drop, all of the retrofitted pumps sampled for 30 hours or more, whereas 3 of the 12 original pumps failed to sample for at least 24 hours. When sampling under the highest pressure drop tested, 19 inch H2O, all of the retrofitted pumps sampled for 26 hours or longer; whereas 5 of the 12 original pumps failed to sample for a least 24 hours. For each of the three pressure drops, the retrofitted pumps sampled much more consistently and for a longer period of time. This trend was more pronounced at 15 and 19 inch H2O, where the retrofitted pumps sampled for 20% longer and with 90% less variation among the pump sampling periods in a given test, as compared to 11 inch H2O, which showed a 7% longer sampling period and 50% less variation. This is largely due to the fact that three of the original

42
Test Number
1 2 3
Dur
atio
n of
Bat
tery
Ope
ratio
n (H
ours
)
0
10
20
30
40
11" H2O15" H2O19" H2O
Test Number
1 2 3
Dur
atio
n of
Bat
tery
Ope
ratio
n (H
ours
)
0
10
20
30
40
11" H2O15" H2O19" H2O
Figure 6-2. Battery Operation Duration for Original (top) and Retrofitted (bottom) Pumps Sampling Under Different Pressure Drops, Error Bars Represent One Standard Deviation from the Mean (n = 4 pumps per test).

43
Test Number
1 2 3
Aver
age
Flow
(L/m
in)
7.0
7.5
8.0
8.5
9.011" H2O15" H2O19" H2O
Test Number
1 2 3
Ave
rage
Flo
w (L
/min
)
7.0
7.5
8.0
8.5
9.011" H2O15" H2O19" H2O
Figure 6-3. Average Flow (L/min) for Original (top) and Retrofitted (bottom) Pumps Sampling Under Different Pressure Drops, Error Bars Represent One Standard Deviation from the Mean (n = 4 pumps per test).
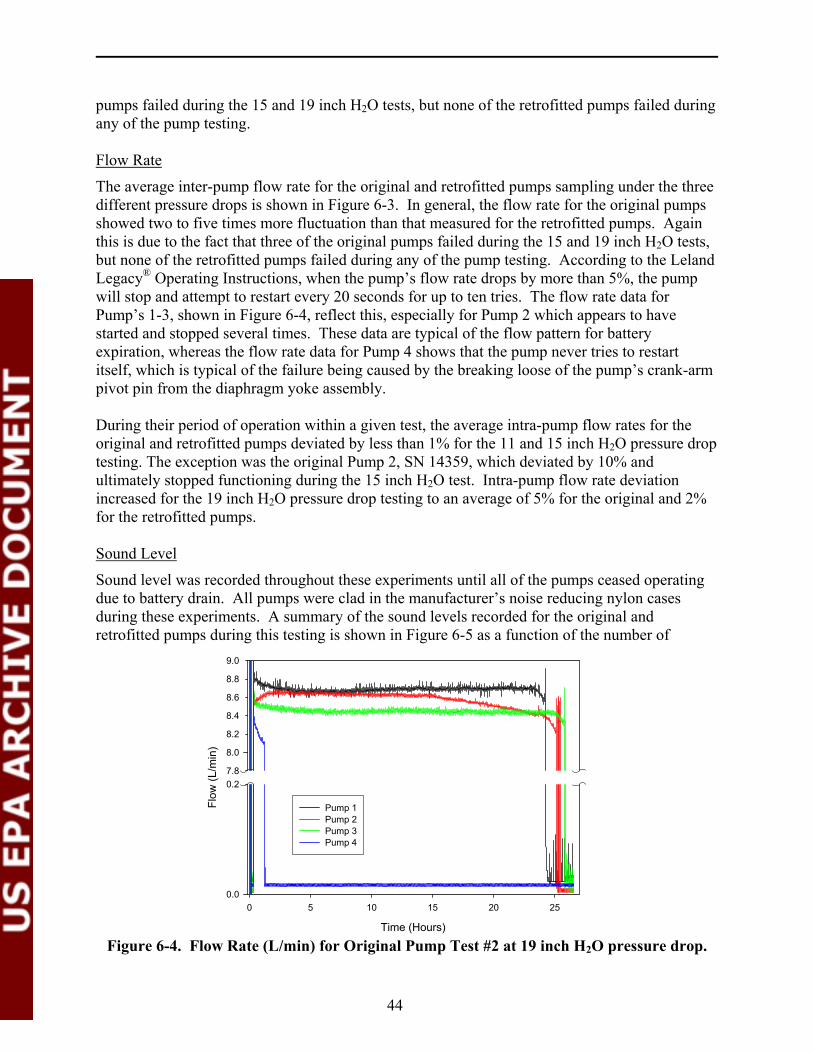
44
pumps failed during the 15 and 19 inch H2O tests, but none of the retrofitted pumps failed during any of the pump testing. Flow Rate
The average inter-pump flow rate for the original and retrofitted pumps sampling under the three different pressure drops is shown in Figure 6-3. In general, the flow rate for the original pumps showed two to five times more fluctuation than that measured for the retrofitted pumps. Again this is due to the fact that three of the original pumps failed during the 15 and 19 inch H2O tests, but none of the retrofitted pumps failed during any of the pump testing. According to the Leland Legacy® Operating Instructions, when the pump’s flow rate drops by more than 5%, the pump will stop and attempt to restart every 20 seconds for up to ten tries. The flow rate data for Pump’s 1-3, shown in Figure 6-4, reflect this, especially for Pump 2 which appears to have started and stopped several times. These data are typical of the flow pattern for battery expiration, whereas the flow rate data for Pump 4 shows that the pump never tries to restart itself, which is typical of the failure being caused by the breaking loose of the pump’s crank-arm pivot pin from the diaphragm yoke assembly. During their period of operation within a given test, the average intra-pump flow rates for the original and retrofitted pumps deviated by less than 1% for the 11 and 15 inch H2O pressure drop testing. The exception was the original Pump 2, SN 14359, which deviated by 10% and ultimately stopped functioning during the 15 inch H2O test. Intra-pump flow rate deviation increased for the 19 inch H2O pressure drop testing to an average of 5% for the original and 2% for the retrofitted pumps. Sound Level
Sound level was recorded throughout these experiments until all of the pumps ceased operating due to battery drain. All pumps were clad in the manufacturer’s noise reducing nylon cases during these experiments. A summary of the sound levels recorded for the original and retrofitted pumps during this testing is shown in Figure 6-5 as a function of the number of
Time (Hours)
0 5 10 15 20 25
Flow
(L/m
in)
0.27.8
8.2
8.4
8.6
8.8
9.0
0.0
8.0
Pump 1Pump 2Pump 3Pump 4
Figure 6-4. Flow Rate (L/min) for Original Pump Test #2 at 19 inch H2O pressure drop.

45
Number of Pumps Running
01234
Sou
nd L
evel
(dB
)
10
20
30
40
50
60
70
11" H2O15" H2O19" H2O
Number of Pumps Running
01234
Sou
nd L
evel
(dB)
10
20
30
40
50
60
7011" H2O15" H2O19" H2O
Figure 6-5. Sound Level (dB) for Original (top) and Retrofitted (bottom) Pumps Sampling Under Different Pressure Drops, Error Bars Represent One Standard Deviation from the Mean (n = 4 pumps per test).

46
pumps operating. The sound level for four pumps increased from operating at the manufacturer’s recommended 11 inch H2O pressure drop. At first glance it appears that the retrofitted pumps were quieter, but in fact, the retrofitted pump testing was conducted in a different vacant laboratory that was more remote from daily people traffic, and thus the background noise level was significantly lower by about 45 dB.
6.1.3 High Temperature and Moderate/High Humidity (40ºC, 60/90%) 40ºC and 60% Relative Humidity
Only one test was performed on the original pumps at high temperature and moderate humidity, after which the fourth pump failed and testing of the original pumps was halted. During that single test, all of the original pumps ran for the required 24 hours, and initial and final flow rates and pressure drops were within the ±10% variance. All of the retrofitted pumps ran for the required 24 hours for each of the three tests, and initial and final flow rates were also within variance. The final pressure drops for four of the pumps fell outside the variance, as summarized in Table 4-1. The recorded flow rate data for both pumps showed no more variance than that exhibited during the moderate temperature and humidity test conditions.
40ºC and 90% Relative Humidity All of the retrofitted pumps ran for the required 24 hours for each of the three tests, and initial and final flow rates were also within variance. The final pressure drops for 5 of the 12 pumps fell outside the variance. The recorded flow rate data for the retrofitted pumps showed slightly more variance, 4%, than that exhibited during the moderate temperature and humidity test conditions.
6.2 Sampling Efficiency Comparison Sampling efficiency was determined gravimetrically as described in Section 3.2, and five comparisons were made between the test and reference samplers for four particle sizes, including total particulate matter (TPM), 0.5 – 1.0 µm, <0.5 µm, and PM2.5, as shown in Table 6-3. A summary of the sampling efficiency comparisons made between the test and reference samplers for the four different particle sizes collected is presented in Table 6-4.

47
Table 6-3. Test and Reference Sampler Gravimetric Comparisons.
Test and Reference Sampler Comparisons
Sampler Stage ID
Cutpoint (µm)
PCIS:DCI-6 TPM
PCIS:PEM TPM
PCIS:DCI-6 0.5 – 1.0 µm
PCIS:DCI-6 <0.5 µm
PCIS:FRM PM2.5
A > 2.5
B 1.0 – 2.5 C 0.5 – 1.0 Stage C
D 0.25 – 0.50
PCIS
AF <0.25
Sum all stages and after-filter
Sum all stages and after-filter
Sum of Stage D and AF
Sum of stages B-D and after-
filter
A >16 B 8.0 - 16 C 4.0 – 8.0 D 2.0 – 4.0 E 1.0 – 2.0 F 0.5 – 1.0 Stage F
DCI-6
AF <0.50
Sum of all stages and after-filter
After-filter PEM Single
PEM 10 Single PEM
FRM Single FRM 2.5
Single FRM

48
Table 6-4. Summary of Comparison Between the Sioutas PCIS, DCI-6, and PEM for Particle Sizes from Test Aerosol.
Samplers Compared
Particle Sizes (µm)
Mean ± S.D.a of the Ratios
Mean Diff. ± S.D., mg/m3 (mean rel. diff.)b p-Valuec
PCIS:DCI-6 TPM 0.87 ± 0.09 -0.49 ± 0.40 (15%) 0.900 PCIS:PEM TPM 0.85 ± 0.09 -0.47 ± 0.29 (17%) 0.036d PCIS:DCI-6 0.5 – 1.0 1.32 ± 0.20 0.17 ± 0.12 (26%) 0.009 e PCIS:DCI-6 [0.5 0.72 ± 0.15 -0.68 ± 0.45 (35%) 0.931 PCIS:FRM [2.5 0.88 ± 0.13 -0.39 ± 0.36 (16%) 0.843
a S.D. = standard deviation b Diff. = difference; mean rel. diff. = mean relative difference c Mann-Whitney rank sum test d Statistically significant difference in values at the p = 0.036 level e Statistically significant difference in values at the p = 0.009 level; data normally distributed (p = 0.084), t-test used, power = 0.737. 6.2.1 PCIS:DCI-6 and PCIS:PEM TPM Comparisons For the PCIS:DCI-6 TPM comparison, the summed gravimetric data for all six stages and the after-filter of the DCI-6 were used as “reference” data and were compared to the summed gravimetric data for all four stages and the after-filter of the Sioutas PCIS. The results of those comparisons are shown in Figure 6-6 and are summarized in Table 6-4. The variability among the PCISs is less than 10% for each test run. Likewise, the reference samplers show similar variability suggesting that the aerosol was well mixed in the chamber. Although ordinarily not directly comparable because of size cutpoint differences, the PEM (10 µm cutpoint) data are also included because our characterization of the test aerosol showed particle size ranged from 0.1 – 10 µm; which is confirmed by the DCI-6 data for aerodynamic sizes m8.0 µm presented in Table 6-5. These results indicate that the Sioutas PCIS data show a negative bias of 15% compared to the DCI-6 data for TPM, and a negative bias of 17% compared to the PEM.

49
1 2 3
TPM
Con
cent
ratio
n (m
g/m
3 )
0
1
2
3
4
5
6
PCIS DCI-6PEM (=< 10 µm)
Test Number Figure 6-6. Comparison of TPM Collected Using Test (Sioutas PCIS) and Reference (DCI-6 and PEM 10 µm cutpoint) Samplers.
Table 6-5. Comparison of Sioutas PCIS, DCI-6, and PEM (10 µm cutpoint) Sampler Gravimetric Results for TPM.
Test Aerosol KCl Concentration (mg/m3) Sampler Cutpoint (µm) Test 1 Test 2 Test 3
<0.25 0.97 ± 0.12 0.26 ± 0.11 0.28 ± 0.08a m0.25 and [0.50 1.31 ± 0.07 0.97 ± 0.05 1.20 ± 0.03 m0.50 and [1.0 0.94 ± 0.04 0.57 ± 0.03 0.63 ± 0.06 m1.0 and [2.5 0.73 ± 0.07 0.48 ± 0.05 0.46 ± 0.01
>2.5 0.20 ± 0.09 0.16 ± 0.03 0.09 ± 0.06
Sioutas PCIS
TPM 4.15 ± 0.05 2.44 ± 0.20 2.75 ± 0.10 DCI-6 <0.50 3.34 ± 0.37 1.67 ± 0.24 1.91 ± 0.08
m0.50 and [1.0 0.66 ± 0.09 0.46 ± 0.07 0.52 ± 0.07 m1.0 and [2.0 0.66 ± 0.06 0.43 ± 0.05 0.46 ± 0.06 m2.0 and [4.0 0.21 ± 0.06 0.12 ± 0.04 0.12 ± 0.05 m4.0 and [8.0 0.04 ± 0.01 0.01 ± 0.01 0.01 ± 0.01 m8.0 and [16 0.01 ± 0.01 0.00 ± 0.01 0.00 >16 0.00 0.00 ± 0.01 0.00 ± 0.01 TPM 4.90 ± 0.47 2.68 ± 0.26 3.03 ± 0.02
PEM [10 4.44 ± 0.14 3.02 ± 0.09b 3.32 ± 0.10 a Filter damaged during removal, n = 3. b Pump failure, n = 3.

50
6.2.2 PCIS:DCI-6 0.5 – 1.0 µm and <0.5 µm Comparisons For evaluating sampling efficiency for the individual impactor stages, the DCI-6 sampler provides “reference” gravimetric data for two of the five stages of the Sioutas PCIS. For particles that are m0.5 and [1.0 µm, gravimetric results from the sixth DCI-6 stage were compared to gravimetric data for the third stage of the Sioutas PCIS. These results are presented in Table 6-6. Likewise, the results from the final stage of the DCI-6 provides “reference” gravimetric data for particles that are <0.5 µm, which are compared to the sum of gravimetric data for the bottom two stages of the Sioutas PCIS, and are presented in Table 6-6. Although not directly comparable, the DCI-6 data for the m1.0 and [2.0 µm stage are also included in Table 6-6. These results indicate that the Sioutas PCIS data show a negative bias of 35% compared to the DCI-6 data for the smaller particles ([0.5 µm), and a positive bias of 26% for particles in the 0.5 to 1.0 µm size range.
6.2.3 PCIS:FRM PM2.5 Comparison For PM2.5 comparisons, the PM2.5 FRMs were used as “reference” gravimetric data and were compared to the summed gravimetric data for stages B – D and the after-filter of the Sioutas PCIS. The results of those comparisons are shown in Figure 6-7. Although not directly comparable because of size cutpoint differences between the DCI-6 sampler and the Sioutas PCIS, the DCI-6 sampler data for the bottom 3 stages, representing particles that were [2.0 µm, are also included in Figure 6-7. The Sioutas PCIS results show a negative bias compared to the data for all of the reference samplers, including the DCI-6 sampler. The inter-sampler variations were less than 15% in all instances. Intra-sampler variation was not evaluated because the aerosol generation time for Test 1 (15 minutes) was longer than for Tests 2 and 3 (10 minutes).
Table 6-6. Comparison of Sioutas PCIS and DCI-6 Sampler Gravimetric Results for Similar Aerodynamic Diameter Cutpoints.
Mean ± Std Dev, mg/m3 (RSD) Test
# PCIS, ≤0.5 µm
DCI-6, <0.5 µm
PCIS, ≥0.5 and ≤1.0 µm
DCI-6, ≥0.5 and ≤1.0 µm
PCIS, ≥1.0 and ≤2.5 µm
DCI-6, ≥1.0 and ≤2.0 µm
1 2.28 ± 0.15 (6.4%)
3.34 ± 0.37 (11%)
0.94 ± 0.04 (4.2%)
0.66 ± 0.09 (14%)
0.73 ± 0.07 (9.1%)
0.66 ± 0.06 (9.0%)
2 1.23 ± 0.14 (14%)
1.67 ± 0.24 (14%)
0.57 ± 0.03 (4.9%)
0.46 ± 0.07 (14%)
0.48 ± 0.05 (10%)
0.43 ± 0.05 (13%)
3 1.57 ± 0.21 (14%)
1.91 ± 0.08 (4.1%)
0.63 ± 0.06 (9.8%)
0.52 ± 0.07 (13%)
0.46 ± 0.01 (1.4%)
0.46 ± 0.06 (12%)

51
1 2 3
PM2.
5 Con
cent
ratio
n (m
g/m
3 )
0
1
2
3
4
5
6
PCIS FRM DCI-6 (=< 2.0 µm)
Test Number Figure 6-7. Comparison of PM2.5 Collected Using Test (Sioutas PCIS) and Reference (FRM PM2.5 and DCI-6) Samplers.
Rank sum tests between the PCIS and reference samplers indicate that the concentrations are not statistically significant at the specified p level for TPM (collected using the DCI-6 sampler), and the [0.5 µm and [2.5 µm particle size diameters. Concentrations were statistically different for TPM collected using the PEM, and the 0.5 – 1.0 µm size range. The reason for the positive bias between the Sioutas PCIS and the DCI-6 for the 0.5 – 1.0 µm size range is not apparent. Although the PEM sampler pumps operated at pressure drops that are greater than recommended by the manufacturer, the negative bias between the Sioutas PCIS and PEM measurements for TPM are not likely due to particle bounce or cutpoint changes due to flow degradation, because the test aerosol size range did not exceed 10 µm.

52
6.3 Sampling Metals in Ambient Air The test (Sioutas PCIS) and reference (PEM, 2.5 µm cutpoint) samplers sampled ambient air in Columbus, Ohio, for a period of 48 hours, and the substrates were collected and analyzed for the 38 target metals/elements listed in Table 3-5 using XRF. Only nine target metals/elements showed detectable levels in the first four stages of the Sioutas PCIS, corresponding to particles with diameters [2.5 µm. Of those nine metals/elements, Al and Na levels were right at the MDL and thus were excluded from this discussion. The concentrations for the after-filter and bottom three stages were summed and those values are compared to the single-stage PEM PM2.5 results for each of the three tests conducted in Figures 6-8, 6-9, and 6-10. For each test, the variability among the Sioutas PCIS samplers was comparable to the variability among the PEMs, and in most cases ranged from 1-13% Note that the y-axis for Figures 6-8 through 6-10 is on a logarithmic scale.
S Cl Si Ca Fe K Zn
PM2.
5 Met
als
Con
cent
ratio
n (n
g/m
3 )
10.0
100.0
PCIS PEM
Figure 6-8. Detectable Metals/Elements Found in Ambient Air PM2.5 Collected Over a 48-hour Period using Test (Sioutas PCIS) and Reference (PEM) Samplers for Test 1, the Error Bars Represent One Standard Deviation from the Mean.

53
S Cl Si Ca Fe K Zn
PM2.
5 Met
als
Con
cent
ratio
n (n
g/m
3 )
10.0
100.0
PCIS PEM
Figure 6-9. Detectable Metals/Elements Found in Ambient Air PM2.5 Collected Over a 48-hour Period using Test (Sioutas PCIS) and Reference (PEM) Samplers for Test 2, the Error Bars Represent One Standard Deviation from the Mean.
S Cl Si Ca Fe K Zn
PM2.
5 Met
als
Con
cent
ratio
n (n
g/m
3 )
10.0
100.0
PCIS PEM
Figure 6-10. Detectable Metals/Elements Found in Ambient Air PM2.5 Collected Over a 48-hour Period using Test (Sioutas PCIS) and Reference (PEM) Samplers for Test 3, the Error Bars Represent One Standard Deviation from the Mean.

54
Comparability between the Sioutas PCIS and the PEM was assessed from a linear regression of the concentration for each detected target metal/element using the PEM data as the independent variable and the Sioutas PCIS results as the dependent variable. The results of this analysis are presented in Figure 6-11, where comparability is expressed in terms of the slope and intercept between the Sioutas PCIS and PEM data, and the degree of correlation between the two. The dataset falls along a line that is significantly statistically different from the unity line, and the y-intercept, -0.54, is not significantly different from zero. Note that the x- and y-axis for Figure 6-11 is on a logarithmic scale. The majority of the data falls below the unity line indicating a negative bias of the Sioutas PCIS results as compared to those obtained using the reference PEMs. This ambient air low concentration of metal/element result is similar to that found in the test aerosol high concentration of particulate result discussed in the sampling efficiency comparisons, Section 6.2. At both concentration levels, sub-µg/m3 of metal/element versus mg/m3 of particulate, the Sioutas PCIS results show a negative bias compared to the data for the reference samplers. The individual comparisons, including the ratio and differences between each metal/element concentration measured in the collected PM2.5 for the test and reference samplers are summarized in Table 6-7. Si shows the highest bias, 74%, between the Sioutas PCIS and PEM. The levels collected on and measured for each Sioutas PCIS impactor stage for Si metals were at, or less than five times the MDL, as shown in Table 4-6. Because the PM2.5 particles are collected onto 4 stages for the Sioutas PCIS, if the level collected on each stage is at or near the
PEM PM2.5 Concentration (ng/m3)
10 100
Siou
tas
PCIS
PM
2.5 C
once
ntra
tion
(ng/
m3 )
10
100
SClCaFeZnSiK
y = 0.73x - 0.54r2 = 0.960
Figure 6-11. Metal/Element Levels Detected in 48-hour Ambient Air PM2.5 Samples Collected Using Test (Sioutas PCIS) and Reference (PEM) samplers.

55
Table 6-7. Summary of Comparison Between 48-hour Ambient Air PM2.5 Metal/Element Levels Collected using the Test (Sioutas PCIS) and Reference (PEM) Samplers.
Metal Mean of the PCIS:PEM
Ratio Mean Difference ± S.D., ng/m3
(mean relative difference) S 0.75 ± 0.05 89 ± 20 (29%) Cl 0.69 ± 0.14 49 ± 33 (38%) Si 0.46 ± 0.07 33 ± 12 (74%) Ca 0.69 ± 0.07 19 ± 6.6 (37%) Fe 0.81 ± 0.14 9.2 ± 6.7 (22%) K 0.76 ± 0.11 10 ± 4.9 (29%) Zn 1.01 ± 0.26 -6 ± 14 (22%)
MDL, results do not correlate as well with a single stage PEM impactor that collects all of the PM2.5 onto one filter. The particle distribution of metals/elements analyzed in PM2.5 collected using the Sioutas PCIS samplers is presented in Figure 6-12. Si appears to be detected equally in ambient air PM2.5 particles with aerodynamic diameters <0.25 µm and ranging from 0.25 – 2.5 µm. Since the particle distribution of Si virtually matches that measured for Zn, and Zn appears to have the least amount of bias between the two samplers, the negative bias does not seem to be related to the size of the particles collected.
Metal
S K Si Zn Fe Ca Cl
Frac
tion
of S
iout
as P
CIS
PM
2.5 C
once
ntra
tion
0.0
0.2
0.4
0.6
0.8
1.0
<0.25 0.25 - 0.5 0.5 - 1.0 1.0 - 2.5
Figure 6-12. Particle Distribution of Detectable Metals/Elements Measured in 48-hour Ambient Air (Columbus, OH) PM2.5 Samples Collected Using Sioutas PCIS Samplers.

56
It should be noted that the Sioutas PCIS is designed with slit-like accelerator plates that produce a thin rectangular deposition pattern on a portion of the substrates, which results in a very small area of the filter that has an even particle distribution. The exception is the PCIS after-filter, which has no accelerator plate in front of it and collects particles that are <0.25 µm. The deposition pattern on this filter is therefore more evenly distributed over the entire area of the filter. Since the XRF instrument is calibrated to measure x-ray fluorescence in µg/cm2, it is necessary to estimate the area of the deposition pattern in order to report µg/filter concentrations. Because the area was estimated and were not measured exactly, these results are classified as semi-quantitative. For the circular distributions, those collected on the PEMs and after-filter for the Sioutas PCIS, the area of the entire filter minus that of the supporting ring was used as the area of the deposition pattern (8.01 cm2 for the 37 mm substrates); for the slit-like distribution collected on Stages B-D of the Sioutas PCIS the area was estimated at 1.0 cm2 (for the 25 mm substrates). This estimation of deposition pattern area may have contributed significantly to the observed negative bias between the Sioutas PCIS and the PEM. To quantify the variability associated with using XRF to measure metals/elements distributed on a filter from a slit-like nozzle, one sample was run in triplicate, and each analysis was done with the deposition pattern having a different orientation: horizontal, diagonal, and vertical. RSDs among the different orientations for all metals/elements averaged to 22%, with the exception of Fe and Zn, which showed much higher RSDs, 41% and 84% respectively. The 22% average is slightly higher than the within-test intersampler variability, which ranged from 1-13%, as shown by the error bars in Figures 6-8 thru 6-10. All of the ambient air filter samples with slit-like patterns were analyzed with the deposition pattern in the horizontal position. 6.4 Sampler Ease of Use, Reliability, and Subject Acceptability/Compliance Prior to allowing subjects to participate in the study, a Battelle technician described the air sampling protocol, answered any of the subject’s questions, and obtained signed informed consent; the Informed Consent Form that all subjects read and signed is provided in Appendix A. Seven non-smoking subjects were recruited to wear the PCIS for a period of 48 hours and keep a simple time/activity diary, included in this report as Appendix B, for that period. At the end of the sampling period, subjects returned to the laboratory and turned in their pumps and completed time/activity diaries. They then filled out a questionnaire, which is presented in Appendix C, to gather information about the pump’s ease of operation, reliability, and their acceptance of the device. The pumps were equipped with small, data-logging multidirectional accelerometers that measured and logged occurrence and intensity of activity. These data provided an objective measure of subject protocol compliance during the 48-hour sampling period. Ease of use and reliability was also evaluated by our Battelle laboratory technicians during sampler setup and return.
6.4.1 Ease of Use and Subject Acceptability Questionnaire Responses
Questionnaire responses for the seven subjects, including the parameter each question was designed to evaluate, are summarized in Table 6-8. Evaluation parameters include pump noise,

57
Table 6-8. Summary of the Ease of Use, Reliability, and Subject Acceptability Questionnaire Responses (n = 7 Subjects).
No. Question Param.a Mean Mode 1. The pump noise was too loud. N 2.3b 3 2. The weight of the pump was uncomfortable. A 3.6 5 3. It was easy to wear the sampler clipped to my shirt. A 3.9 2
4. I could talk on the phone easily while wearing the sampler. N 2.6 2
5. I would volunteer to wear this sampler for another 24 hours. A 2.7 2
6. I could not tell if the sampler was operating. N 5.0 6 7. I was always conscious of the sampler. N, A 2.6 1 8. I had problems putting the sampler back on. E 5.3 6 9. I slept well while the sampler was operating near me.3 N 3.8 5
10. It was hard to take the sampler off in order to shower or bathe. E 5.3 6
11. I was comfortable wearing the pump. A 3.4 3 12. Sometimes I forgot that I was wearing the sampler. A 5.0 6 13. I was not able to wear this sampler for longer than 4 hours. A 5.6 6 14. It was hard to think while wearing the sampler. A 4.6 5 15. I like wearing the sampler. A 4.9 4 16. It was easy to plug the pump into the wall outlet at night E 1.9 1
17. I did not wear the sampler for approximately ___hours during the 48-hr sampling period. C 18.2 !
5.1 16
18. I was able to follow the air sampling instruction that Battelle gave me exactly. E Y = 3 N = 4
19. The sampler drew attention to me so that I had to explain to people what I was doing. A Y = 6 N = 1
20. I felt comfortable wearing the inlet clipped to my shirt. A Y = 3 N = 4 21. The sound of the pump sometimes got louder and/or softer N Y = 4 N = 3
22. The pump stopped running even though I didn’t do anything to it. E Y = 1 N = 6
23. I accidentally dropped the pump. E Y = 0 N = 7 24. I could not sleep with the sampler operating near me. N Y = 1 N = 4c aParam. = parameter question was designed to evaluate; N = pump noise, A = subject acceptability, E = ease of use, C = protocol compliance. bSubject could circle one number ranging from 1 – 6, where 1 = Strongly Agree, and 6 = Strongly Disagree. cTwo subjects turned off the pumps during their sleeping time.

58
subject acceptance, and ease of use. Subjects were primarily female (6 of the 7 subjects), and ranged in ages from 25 – 56 years old. For the first 16 questions, subjects were instructed to circle a number from 1 to 6, with 1 representing Strongly Agree, and 6 representing Strongly Disagree. Question 17, aimed at evaluating sampling protocol compliance, required the subject to input the number of hours (s)he did not wear the sampler. The remainder of the questions required the subject to give True/False responses. Most of the responses given for questions 1-16 were not unanimously strong; however, there were several exceptions, which are further described below according to their evaluation parameter: Noise Most subjects felt strongly that the pump was loud (Q1), they were always conscious of the sampler and could tell it was operating (Q6, Q7, Q12), and they were able to sleep (Yes/No Q 24) but could not sleep very well with it operating near them (Q9). However, they also indicated that they could easily talk on the phone while wearing the sampler (Q4). Ease of Use Most subjects felt strongly that the sampler was easy to use; they had no problems putting it on or taking it off (Q8, Q10) and it was easy to plug the pump into A/C power at night (Q16). Nobody indicated that they accidentally dropped the sampler (Yes/No Q23). Acceptance Most subjects felt strongly that they were always aware of the sampler (Q7, Q12), that they did not like wearing the sampler (Q15), but they were able to wear it for at least four hours (Q13). They felt less strongly, but indicated a positive response to wearing the pump for another 24 hours (Q5) and that they had no trouble thinking while wearing the sampler (Q14). Subject Comments In addition to the close-ended and Yes/No questions, subjects were asked to add any comments or suggestions they had about the sampler; those responses are summarized in Table 6-9. Also included in Table 6-9 are the Battelle Laboratory Technicians’ comments about the pump’s ease of use and reliability. The majority of the subjects’ responses were complaints about the noisiness of the sampler, whereas the majority of the technicians’ responses had to do with the design of the pump and impactor. The comment made by Technician T3 regarding the plastic filter retainers highlights a limitation of the Sioutas PCIS. The plastic filter retainers require quite a bit of force to place them flush on the impaction plate. In our experience, if the retainers were not completely flush to the plate, the pressure drop of the impactor measured greater than 16 inch H2O. As there is no special tool provided to accomplish this, it has to be done very carefully with a gloved thumbnail to avoid damaging the filter. Because the pre-testing pressure drop measurements specified in Section 4.2 were a part of our sampling protocol, our data quality was not affected by the difficulty in securing the plastic retainer rings. Following the two instances where initial pressure drop readings exceeded 16 inch water, the impactor was disassembled, the plastic retainers re-seated, and sampling was conducted only after the pressure drop readings fell within the stated range (11 – 16 inch H2O).

59
Table 6-9. Subjects’ and Laboratory Technicians’ Comments and Suggestions Regarding the Sioutas PCIS Sampler. Subject/Tech
ID Comments/Suggestions
M03 • Noise varied when hose crimped or inlet was blocked. • Charging inlet should be accessible from outside pump case. • Belt attachment should be horizontal instead of vertical. • Arena security denied access to football game due to suspicion of pump.
F04 • This needs to be lighter and less noisy. • The impactor is heavy and awkward, it cuts into the skin after a while and is too heavy
to clip to a shirt, I had to clip it to the strap of the pump case. • It could work better as a backpack. • The impactor should be padded. • Compensation should be increased.
F05 • It was a little noisy. • More clear operating instructions on how to turn it back on. • Also, I felt like I didn’t want to go to public places as much due to people staring at me.
F06 • At times I couldn’t tell if the sampler was operating. • Slept but kept waking up. • Clip was a little heavy/awkward to wear attached to certain clothing. • Liked belt strap and should strap – would use either as needed.
F07 • The noise in work related setting was disruptive but the device didn’t really get in the way.
• The vibration of the motor bothered me. T1 • Pump software was easy to install, but the user interface is not intuitive.
• Pump is difficult to calibrate because of all the sequenced button pushing. • The bottom of the pump is not stable – a broader base would make the pump less
“tippy”. T2 • It is difficult to remove the pump battery without damaging the plastic casing.
• Automatic calibration with the CalChek makes calibrating the pump easy! • The plastic piece that covers the A/C plug-in port is too flimsy and susceptible to
breaking off. • Downloaded pump history data is difficult to understand. • Pump is not user-friendly because the keys have no wording on them; for example,
“ON” or “OFF”. T3 • Impactor operating instructions are mostly informative and very user-friendly.
• Changed one figure to show the placement of the after-filter. • Filter retainers are too snug – need a special tool to install them properly because they
have a tendency to stick up instead of seating flush to the collector plate. • The 37 mm after-filter fits too snugly inside the outlet plate – it is too easy to damage
the filter when removing it. • The 0-ring between the impactor stages was difficult to retrieve – some of the notches
were too shallow and did not allow easy access.

60
6.4.2 Reliability and Subject Compliance One subject indicated that her pump stopped operating during the test, although she did nothing to it. When the pump was returned to Battelle, it operated without problem, so it is unclear why it stopped operating in the field. Because it is incomplete, this subject’s data is not included in the analysis. Two subjects misunderstood the air sampling protocol, and plugged their pumps in but then shut them off while they slept at night instead of allowing them to sample while they slept. Otherwise, all subjects indicated that they followed the sampling protocol, described in Section 3.4 of this report.
Time Activity Diary versus Accelerometer Data
Although all subjects indicated that they followed the sampling protocol, comparing the pump movement data logged by the accelerometers with the subjects’ time/activity diary data indicated differently for several of the subjects. Approximately half of the subjects followed the sampling protocol for the entire 48-hour test period, and the other half followed it for the first day and then stopped carrying the pump with them.
Comparisons of the three compliant subjects’ time/activity level data to the occurrence and intensity of activity automatically logged by the accelerometers attached to their individual pumps are shown in Figure 6-13. The time/activity diary data, graphed on the secondary y-axis in Figures 6-13 and 6-14, shows the subject’s self-rated level of activity, which ranges from low (1) to high (5), in quarter-hour increments over the 48-hour period. Examples of activities and the scalar provided in the time/activity diary to quantify them are: 1 = sleeping, 2 = eating, 3 = sitting, 4 = walking, and 5 = jogging. All of these graphs indicate that not only did each subject wear the pump during their waking activities, they also appear to have kept a fairly accurate time/activity diary.
This same comparison for the three non-compliant subjects is presented in Figure 6-14. The accelerometer data indicates that, in general, these subjects stopped wearing the pump after the first 24 hours of the 48-hour sampling period. None of the subjects were told that their pumps contained a device that logged its movement.

61
Time of Day (M/DD/YY HH:MM AM/PM)
4/27/0
6 3:00
PM
4/27/0
6 7:00
PM
4/27/0
6 11:0
0 PM
4/28/0
6 3:00
AM
4/28/0
6 7:00
AM
4/28/0
6 11:0
0 AM
4/28/0
6 3:00
PM
4/28/0
6 7:00
PM
4/28/0
6 11:0
0 PM
4/29/0
6 3:00
AM
4/29/0
6 7:00
AM
4/29/0
6 11:0
0 AM
4/29/0
6 3:00
PM
Activ
ity C
ount
s fro
m A
ccel
erom
eter
0
2000
4000
6000
8000
10000
Act
ivity
Lev
el fr
om T
ime/
Act
ivity
Dia
ry
1
2
3
4
5
Time of Day (M/DD/YY HH:MM AM/PM)
5/2/06
1:00
PM
5/2/06
5:00
PM
5/2/06
9:00
PM
5/3/06
1:00
AM
5/3/06
5:00
AM
5/3/06
9:00
AM
5/3/06
1:00
PM
5/3/06
5:00
PM
5/3/06
9:00
PM
5/4/06
1:00
AM
5/4/06
5:00
AM
5/4/06
9:00
AM
Activ
ity C
ount
s fro
m A
ccel
erom
eter
0
1000
2000
3000
4000
5000
Act
ivity
Lev
el fr
om T
ime/
Act
ivity
Dia
ry
1
2
3
4
5
Time of Day (M/DD/YY HH:MM AM/PM)
5/16/0
6 5:00
PM
5/16/0
6 9:00
PM
5/17/0
6 1:00
AM
5/17/0
6 5:00
AM
5/17/0
6 9:00
AM
5/17/0
6 1:00
PM
5/17/0
6 5:00
PM
5/17/0
6 9:00
PM
5/18/0
6 1:00
AM
5/18/0
6 5:00
AM
5/18/0
6 9:00
AM
5/18/0
6 1:00
PM
Activ
ity C
ount
s fro
m A
ccel
erom
eter
0
2000
4000
6000
8000
Activ
ity L
evel
from
Tim
e/A
ctiv
ity D
iary
1
2
3
4
5
Figure 6-13. Comparison of the Pump Movement Data Logged by the Accelerometers with the Time/Activity Diary Data (Shown in Red, 5=High Activity) for Three Subjects Who Appeared to Follow the Sampling Protocol for the 48-hour Period.

62
Time of Day (M/DD/YY HH:MM AM/PM)
4/27/0
6 3:00
PM
4/27/0
6 7:00
PM
4/27/0
6 11:0
0 PM
4/28/0
6 3:00
AM
4/28/0
6 7:00
AM
4/28/0
6 11:0
0 AM
4/28/0
6 3:00
PM
4/28/0
6 7:00
PM
4/28/0
6 11:0
0 PM
4/29/0
6 3:00
AM
4/29/0
6 7:00
AM
4/29/0
6 11:0
0 AM
4/29/0
6 3:00
PM
Act
ivity
Cou
nts
from
Acc
eler
omet
er0
2000
4000
6000
8000
Act
ivity
Lev
el fr
om T
ime/
Act
ivity
Dia
ry
1
2
3
4
5
Time of Day (M/DD/YY HH:MM AM/PM)
5/5/06
4:00
PM
5/5/06
8:00
PM
5/6/06
12:00
AM
5/6/06
4:00
AM
5/6/06
8:00
AM
5/6/06
12:00
PM
5/6/06
4:00
PM
5/6/06
8:00
PM
5/7/06
12:00
AM
5/7/06
4:00
AM
5/7/06
8:00
AM
5/7/06
12:00
PM
5/7/06
4:00
PM
Activ
ity C
ount
s fro
m A
ccel
erom
eter
0
1000
2000
3000
4000
5000
6000
Act
ivity
Lev
el fr
om T
ime/
Act
ivity
Dia
ry
1
2
3
4
5
Time of Day (M/DD/YY HH:MM AM/PM)
5/22/0
6 1:00
PM
5/22/0
6 5:00
PM
5/22/0
6 9:00
PM
5/23/0
6 1:00
AM
5/23/0
6 5:00
AM
5/23/0
6 9:00
AM
5/23/0
6 1:00
PM
5/23/0
6 5:00
PM
5/23/0
6 9:00
PM
5/24/0
6 1:00
AM
5/24/0
6 5:00
AM
5/24/0
6 9:00
AM
Act
ivity
Cou
nts
from
Acc
eler
omet
er
0
1000
2000
3000
4000
5000
Act
ivity
Lev
el fr
om T
ime/
Act
ivity
Dia
ry
1
2
3
4
5
Figure 6-14. Comparison of the Pump Movement Data Logged by the Accelerometers with the Time/Activity Diary Data (Shown in Red, 5 = Hi Activity) for Three Subjects Who Appeared to Stop Following the Sampling Protocol After About 24 Hours.

63
Chapter 7 Performance Summary
The Sioutas PCIS, operating in conjunction with the Leland Legacy® pump, is designed to separate and collect airborne PM in specific size ranges. The Sioutas PCIS was evaluated on the basis of comparability with the sampling efficiency of more well-known reference samplers; its ability to collect detectable levels of metals in ambient air; and its ease of use, reliability, and acceptance among volunteer subjects. Additionally, the Leland Legacy® pump was evaluated by itself on the basis of duration of operation on a single battery charge sampling at different pressure drops, and 24-hour performance sampling under moderate and extreme temperature and humidity conditions. During the pump testing, four of the pumps failed and were returned to the vendor, SKC, for analysis. SKC examined the four failed pumps and found that the same internal pin had dislodged in each case. To solve the problem, SKC retrofitted the pumps with a new pin that has a hexagonal head. Both the original and retrofitted pumps were evaluated. This verification test included four separate evaluation phases and the results from each phase are summarized below. 7.1 Pump Testing Both the original and retrofitted pumps sampled under an 11 inch H2O pressure drop via battery power for 28-35 hours in a moderate temperature and humidity (25ºC and 30%) environment after a 15-hour battery charge. Due to repeated pump failures, the original pumps were not evaluated at high temperature-moderate humidity (40ºC-60%) and high temperature-high humidity (40ºC-90%) sampling environments. However, the retrofitted pumps sampled for the prescribed 24-hour period in both environments and maintained flow rates that were within 10% of the manufacturer’s recommended values. None of the retrofitted pumps failed; even when sampling under extreme conditions that included backpressures and sampling periods that exceeded the manufacturer’s specifications. When sampling in extreme conditions, all of the retrofitted pumps sampled for longer than 26 hours before battery drain occurred. When sampling under a 15 inch H2O pressure drop, all of the retrofitted pumps sampled for 30 hours or more, whereas 3 of the 12 original pumps failed to sample for at least 24 hours. When sampling under the highest pressure drop tested, 19 inch

64
H2O, all of the retrofitted pumps sampled for 26 hours or longer; whereas 5 of the 12 original pumps failed to sample for a least 24 hours. On average, the original pumps operated for about 9-10 fewer hours when sampling under a 19 inch H2O pressure drop than under an 11 inch H2O, and sound levels increased by 2.1 dB. On average, the retrofitted pumps operated for about 6-7 fewer hours when sampling under a 19 inch H2O pressure drop than under an 11 inch H2O, and sound levels increased by 4.3 dB. The sound level of a single pump clad in the noise-reducing jacket and operating at the manufacturer’s recommended pressure drop ranged from 48 -64 dB, which is a level similar to normal conversational speech (~60 dB). Sound levels measured for all four pumps operating at the highest pressure drop 19 inch H2O never exceeded 72 dB, which is equivalent to the sound level of a typical household vacuum cleaner. The retrofitted pumps showed less variability than the original pumps in terms of flow rates and duration of operation over the sampling periods. Average duration of operation for the retrofitted pumps never deviated by more than 2.6% for the 11, 15, and 19 inch H2O tests; whereas it deviated by 5.6%, 33%, and 29%, respectively for the same tests, for the original pumps. Differences in average flow rate variability between the original and retrofitted pumps were less pronounced as average flow rates never deviated by more than 5.0% for the original pumps and not more than 2.1% for the retrofitted pumps. 7.2 Sampling Efficiency Comparison Sampling efficiency of the impactors was gravimetrically evaluated for total PM2.5 as well as for individual impaction stages, as appropriate, by sampling a test aerosol generated in a large environmental chamber. The test conditions for the sampling efficiency test were, although optimal for obtaining gravimetrically measurable levels of particles on all stages of the Sioutas PCIS, were several orders of magnitude higher than those experienced in most real-world settings. These aerosol concentrations caused the PEM pumps to operate at backpressures that were greater than the manufacturer’s specifications, although the pump logs did not report any pump failure. Because the upper particle loading limit is a complex function of the ambient particle size distribution and type, humidity, individual filter used, capacity of the sampler flow rate control system, and possibly other parameters, it is not known whether these high concentrations resulted in particle bounce and/or affected the cutpoints of the particles collected for the DCI-6 and PEM reference samplers. The humidity in the environmental chamber did not exceed 29% and the temperature did not increase by more than 1.7°C during the one hour sampling period. The particle loadings did not exceed the manufacturer’s operating specifications for the maximum particle load per stage for the Sioutas PCIS, 3.16 mg/stage, nor did they exceed the federally mandated capability of the FRM, 4.8 mg PM2.5/filter. These particle loadings resulted in backpressures greater than those recommended for the Leland Legacy® pump. However, the samplers performed consistently, as the inter-sampler variability for all samplers in each of the three tests did not exceed 11% for the FRMs, 4% for the PEMs, 15% for the DCI-6, and 10% for the PCISs for each cutpoint in which the gravimetric masses were above three times the method detection limit.

65
For TPM collected, Sioutas PCIS data show a negative bias of 15% compared to the DCI-6 and 17% compared to the PEM data. TPM inter-sampler relative standard deviations among all the PCIS, DCI-6, and PEM samplers for each test were comparable and generally in the 1-10% range. When comparing particles in the [0.5 µm size range, the PCIS data show a negative bias of 35% compared to the DCI-6 data. For slightly larger particles in the 0.5 – 1.0 µm size range, the trend is reversed: the Sioutas PCIS data show a positive bias of 26% compared to the DCI-6 data. The inter-sampler variations for both of these size ranges varied from 4.1 – 14% for both samplers. The PCIS PM2.5 results show a negative bias of 16% compared to the data for both of the reference samplers, including the DCI-6 which is only collecting particles that are [2.0 µm in diameter. The PM2.5 inter-sampler variations for all test and reference samplers were less than 15% in all instances. 7.3 Sampling Metals in Ambient Air The ability of the PCIS to sample PM2.5 with detectable levels of metals/elements in ambient air was evaluated in comparison to reference PEM samplers for a 48-hour sampling period. Seven of the 38 metals/elements analyzed using XRF showed detectable levels in the PM2.5 collected. The dataset of S, Cl, Si, Ca, Fe, K and Zn results falls along a line that is significantly statistically different from the unity line, although the y-intercept, -0.54, is not significantly different from zero. The majority of the data falls below the unity line indicating an overall negative bias, 36%, for the Sioutas PCIS results as compared to those obtained using the reference PEMs. This ambient air low concentration of metal/element result is similar to that found in the test aerosol high concentration of particulate result discussed in the sampling efficiency comparisons, Section 6.2. At both concentration levels, sub-µg/m3 of metal/element versus mg/m3 of particulate, the Sioutas PCIS results show a negative bias compared to the data for the reference samplers. Si showed the highest bias, 74%, between the Sioutas PCIS and PEM. The levels collected on and measured for each Sioutas PCIS impactor stage for Si metals were at, or less than five times the MDL. Because the PM2.5 particles are collected onto 4 stages for the Sioutas PCIS, if the level collected on each stage is at or near the MDL, results may not correlate as well with a single stage PEM impactor that collects all of the PM2.5 onto one filter. The slit-like accelerator plate nozzles in the Sioutas PCIS generated thin deposition patterns on the sampling substrates which made accurate quantitative analysis of the metals/elements by XRF difficult. Because of the shape of the deposition pattern, analysis by ICP-MS is recommended over XRF, although this technique would require an additional wet chemical extraction step. 7.4 Ease of Use, Reliability and Subject Acceptance/Compliance Seven non-smoking subjects were recruited to wear the PCIS for a period of 48 hours and keep a simple time/activity diary. At the end of the sampling period, subjects completed a questionnaire to gather information about the pump’s ease of operation, reliability, and their acceptance of the device. The pumps were equipped with small, data-logging multidirectional accelerometers.
66
Questionnaire responses showed that subjects felt strongly that the PCIS noise was too loud and that they did not like wearing the pump, however; the noise wasn’t loud enough to prevent them from thinking or talking on the phone while wearing the sampler. As discussed in Section 7.1, the sound level of a single pump operating at the manufacturer’s recommended pressure drop ranged from 48 -64 dB, which is a level similar to normal conversational speech (~60 dB). Sound levels measured for all four pumps operating at the highest pressure drop 19 inch H2O never exceeded 72 dB, which is equivalent to the sound level of a typical household vacuum cleaner. Subjects also felt strongly that the sampler (Leland Legacy® pump and Sioutas PCIS combination) was easy to take on and off and plug into the wall to run on A/C power while they slept. Examination of the accelerometer and time/activity diary data showed that although all of the subjects said they followed the sampling protocol, only half of the subjects followed the sampling protocol, and the other half stopped wearing the pump roughly after the first 24 hours. The Sioutas PCIS’s plastic filter retainers require quite a bit of force to place them flush on the impaction plate. It is important that this be accomplished, because if the retainers are not completely flush to the plate, the pressure drop of the impactor was greater than 16 inch H2O. A special tool designed to accomplish this may speed up and improve the quality of substrate loading and unloading.

67
Chapter 8 References
1. Development and evaluation of a personal cascade impactor sampler (PCIS), Misra C., Singh M., Shen S., Sioutas C., and P.M. Hall, J. Aerosol Science, 33, p. 1027-47, 2002.
2. Test/QA Plan for Verification of Personal Cascade Impactor Samplers (PCISs) for
Measuring Ambient Particulate Matter (PM), Battelle, Columbus, Ohio, Jan. 2006. 3. Quality Management Plan (QMP) for the ETV Advanced Monitoring Systems Center,
Version 6.0, U.S. EPA Environmental Technology Verification Program, Battelle, Columbus, Ohio, Nov. 2005.
4. Quality Assurance Guidance Document 2.12, “Monitoring PM2.5 in Ambient Air Using
Designated Reference or Class I Equivalent Methods,” U.S. Environmental Protection Agency, Nov. 1998.
5. Operating Instructions Leland Legacy, SKC, Form #40075 Rev 0701.
6. Operating Instructions Sioutas Cascade Impactor, SKC, Form #40086 Rev 0701.
7. Compendium Method IO-3.3, Determination of Metals in Ambient Particulate Matter
Using X-Ray Fluorescence (XRF) Spectroscopy, U.S. Environmental Protection Agency, Center for Environmental Research Information, Office of Research and Development, June 1999.
8. Personal exposure to particulate matter less than 2.5 micron in Mexico City: a pilot
study, Vallejo M., Lerma C., Infante O., Hermosillo A.G., Riojas-Rodriguez H., and M. Cardenas, J Expo Anal Environ Epidemiol, 14(4), p. 323-9, July 2004.
9. Assessing truck driver exposure at the World Trade Center disaster site: personal and
area monitoring for particulate matter and volatile organic compounds during October 2001 and April 2002, Geyh A.S., Chillrud S., Williams D.L., Herbstman J., Symons J.M., Rees K., Ross J., Kim S.R., Lim H.J., Turpin B., and P. Breysse, J Occup Environ Hyg, 2(3), p. 179-93, Mar. 2005.

68
10. Participants’ exposure to PM2.5 and gaseous/particulate polycyclic aromatic hydrocarbons during the Ma-tsu Goddess parade, Lung S.C., Guo K.J., Chen P.Y., Tsai P.F., and Chen P.C., J Expo Anal Environ Epidemiol, 14(7), p. 536-43, Nov. 2004.
11. Customers’ exposure to PM2.5 and polycyclic aromatic hydrocarbons in
smoking/nonsmoking sections of 24-h coffee shops in Taiwan, Lung S.C., Wu M.J., and C.C. Lin, J Expo Anal Environ Epidemiol, 14(7), p. 529-35, Nov. 2004.
12. Contribution of incense burning to indoor PM10 and particle-bound polycyclic aromatic
hydrocarbons under two ventilation conditions, Lung S.C., Kao M.C., and S.C. Hu, Indoor Air, 13(2), p. 194-9, June 2003.
13. Generation rates and emission factors of particulate matter and particle-bound
polycyclic aromatic hydrocarbons of incense sticks, Lung S.C., and S.C. Hu, Chemosphere, 50(5), p. 673-9, Feb. 2003.
14. Worshippers’ exposure to particulate matter in two temples in Taiwan, Lung S.C., and
M.C. Kao, J Air Waste Manag Assoc, 53(2), p.130-5, Feb. 2003.
15. Fine PM measurements: personal and indoor air monitoring, Jantunen M., Hanninen O., Koistinen K., and J.H. Hashim, Chemosphere, 49(9), p. 993-1007, Dec. 2002.
16. Comparison of light scattering devices and impactors for particulate measurements in
indoor, outdoor, and personal environments, Liu L.J., Slaughter J.C., and T.V. Larson, Environ Sci Technol, 1;36(13), p. 2977-86, July 2002.
17. Particulate matter and particle-attached polycyclic aromatic hydrocarbons in the indoor
and outdoor air of Tokyo measured with personal monitors, Sakai R., Siegmann H.C., Sato H., and A.S. Voorhees, Environ Res, 89(1), p. 66-71, May 2002.
18. The influence of human activity patterns on personal PM exposure: a comparative
analysis of filter-based and continuous particle measurements, Rea A.W., Zufall M.J., Williams R.W., Sheldon L., and C. Howard-Reed, J Air Waste Manag Assoc, 51(9), p. 1271-9, Sep. 2001.
19. Comparison of PM2.5 and PM10 monitors, Williams R., Suggs J., Rodes C., Lawless P.,
Zweidinger R., Kwok R., Creason J., and L. Sheldon, J Expo Anal Environ Epidemiol, 10(5), p.497-505, Sep.-Oct. 2000.
20. Personal exposure to particles in Banska Bystrica, Slovakia, Brauer M., Hruba F.,
Mihalikova E., Fabianova E., Miskovic P., Plzikova A., Lendacka M., Vandenberg J., and A. Cullen, J Expo Anal Environ Epidemiol, 10(5), p.478-87, Sep.-Oct. 2000.
21. Exposure of chronic obstructive pulmonary disease patients to particulate matter:
relationships between personal and ambient air concentrations, Ebelt S.T., Petkau A.J.,

69
Vedal S., Fisher T.V., and M. Brauer, J Air Waste Manag Assoc, 50(7), p. 1081-94, July 2000.
22. Indoor/outdoor PM10 ad PM2.5 in Bankok, Thailand, Tsai F.C., Smith K.R., Vichit-
Vadakan N., Ostro B.D., Chestnut L.G., and N. Kungskulniti, J Expo Anal Environ Epidemiol, 10(1), p. 15-26, Jan.-Feb. 2000.
23. Investigations of the proximity effect for pollutants in the indoor environment, McBride
S.J., Ferro A.R., Ott, W.R., Switzer P., and L.M. Hildemann, J Expo Anal Environ Epidemiol, 9(6), p. 602-21, Nov.-Dec. 1999.
24. Fine particle (PM2.5) measurement methodology, quality assurance procedures, and pilot
results of the EXPOLIS study, Koistinen K.J., Kousa A., Tenhola V., Hanninen O., Jantunen M.J., Oglesby L., Kuenzli N., and L. Georgoulis, J Air Waste Manag Assoc, 49(10), p. 1212-20, Oct. 1999.
25. Combination of direct and indirect approaches for exposure assessment, Duan N. and
D.T. Mage, J Expo Anal Environ Epidemiol, 7(4), p. 439-70, Oct.-Dec. 1997.
26. Reference Method for the Determination of Fine Particulate Matter as PM2.5 in the Atmosphere, Federal Register, Appendix L to Part 50, Vol. 62, No. 138, 1997.
27. Quality Assurance Guidance Document 2.12, Monitoring PM2.5 in Ambient Air Using
Designated Reference or Class I Equivalent Methods, U.S. Environmental Protection Agency, Nov. 1998.
28. Improved cascade impactor for measuring aerosol particle sizes in air pollutants,
commercial aerosols, and cigarette smoke, R.I. Mitchell and J.M. Pilcher, Ind. Eng. Chem., Vol. 51, No. 9, p. 1039-42, Sep. 1959.
29. Next generation pharmaceutical impactor (a new impactor for pharmaceutical inhaler
testing), Part I: Design, Journal of Aerosol Medicine, Vol. 16, No. 3, p. 283-99, Sep. 2003.
30. Formation of polyketones in irradiated toluene/propylene/NOx/air mixtures, E.O. Edney,
D.J. Driscollo, W.S. Weathers, T.E. Kleindienst, T.S. Conver, C.D. McIver and W. Li, Aerosol Sci. and Tech., Vol. 35, p. 998-1008, 2001.
31. Pulmonary distribution and kinetics of inhaled [11C]triamcinolone acetonide, M.S.
Berridge, Z. Lee and D.L. Heald, The J of Nuclear Medicine, Vol. 41 No. 10, p. 1603-11, 2000.
32. Technetium 99m radiolabeling of aerosolized drug particles from metered dose inhalers,
C. Aug, R.J. Perry and GC Smaldone, J Aerosol Med., 4(2), p. 127-38, 1991.

70
33. Optimized inhalation aerosols. II. Inertial testing methods for particle size analysis of pressurized inhalers, E.M. Phillips, P.R. Byron, K. Fults and A.J. Hickey, Pharm Res., 7(12), p. 1228-33, Dec. 1990.
34. A Comparison of Exposure to Airborne Dust in Cotton Processing Plants Estimated from
Personal and Workzone Samples, F.F. Cinkotai, A.C.C. Gibbs and T.C. Sharpe, Ann. Occup. Hyg., Vol. 28, No. 3, p. 347-52, 1984.
35. Growth of hygroscopic aerosols in a model of bronchial airways, P.W. Scherer, F.R.
Haselton, L.M. Hanna and D.R. Stone, Journal of Applied Physiology, Vol 47, Issue 3 544-50, 1979.
36. Design and evaluation of new low-pressure impactor. 1, S.V. Hering, R.C. Flagan and
S.K. Friedlander, Env. Sci. & Tech. Research, Vol. 12, No. 6, p. 667-73, June 1978.
37. Design and evaluation of new low-pressure impactor. 2, S.V. Hering, S.K. Friedlander, J.J. Collins and L.W. Richards, Env. Sci. & Tech. Research, Vol. 13, No. 2, p. 184-88, 1979.

A-1
Appendix A
PCIS Questionnaire

A-2
PCIS Questionnaire StronglyAgree
(please circle onenumber)
StronglyDisagree
1. The pump noise was too loud. StronglyAgree
1 2 3 4 5 6 StronglyDisagree
2. The weight of the pump was uncomfortable. StronglyAgree
1 2 3 4 5 6 StronglyDisagree
3. It was easy to wear the sampler clipped to my shirt. StronglyAgree
1 2 3 4 5 6 StronglyDisagree
4. I could talk on the phone easily while wearing thesampler.
StronglyAgree
1 2 3 4 5 6 StronglyDisagree
5. I would volunteer to wear this sampler for another24 hours.
StronglyAgree
1 2 3 4 5 6 StronglyDisagree
6. I could not tell if the sampler was operating. StronglyAgree
1 2 3 4 5 6 StronglyDisagree
7. I was always conscious of the sampler. StronglyAgree
1 2 3 4 5 6 StronglyDisagree
8. I had problems putting the sampler back on. StronglyAgree
1 2 3 4 5 6 StronglyDisagree
9. I slept well while the sampler was operating nearme.
StronglyAgree
1 2 3 4 5 6 StronglyDisagree
10. It was hard to take the sampler off in order toshower.
StronglyAgree
1 2 3 4 5 6 StronglyDisagree
11. I was comfortable wearing the pump. StronglyAgree
1 2 3 4 5 6 StronglyDisagree
12. Sometimes I forgot that I was wearing thesampler.
StronglyAgree
1 2 3 4 5 6 StronglyDisagree
13. I was not able to wear this sampler for longer than4 hours.
StronglyAgree
1 2 3 4 5 6 StronglyDisagree
14. It was hard to think while wearing the sampler. StronglyAgree
1 2 3 4 5 6 StronglyDisagree
15. I like wearing the sampler. StronglyAgree
1 2 3 4 5 6 StronglyDisagree
16. I did not wear the sampler for approximately _____ hours during the 24-hr samplingperiod.
17. I was able to follow the air sampling instructions that Battelle gave me exactly. Yes No (circle one)
PCIS Questionnaire Page 1 of 2

A-3
PCIS Questionnaire (continued)
18. The sampler drew attention to me so that I had to explain to people what I was doing. Yes No (circle one)
19. I felt comfortable wearing the inlet clipped to my shirt. Yes No (circle one)
20. The sound of the pump sometimes got louder and/or softer. Yes No (circle one)
21. The pump stopped running even though I didn’t do anything to it. Yes No (circle one)
22. I accidentally dropped the pump. Yes No (circle one)
23. I slept for approximately _____ hours while the sampler operated near me.
24. I could not sleep with the sampler operating near me. Yes No (circle one)
Please add any comments or suggestions you may have:
PCIS Questionnaire Page 2 of 2

Appendix B
Time/Activity Diary
B-1

Time/Activity Diary Activity Number:
Day 1 1 = Sleeping
2 = Eating
3 = Sitting
4 = Moderate Activity (e.g., walking)
Subject ID: 5 = Intense Activity (e.g., jogging)
Date:
Location: Inside Home
Outside
At Work
Bath/Shower
Pump Not Operating
Notes:
Activity Number(s): Do NOT leave blank
2 ammidnight 1 am 3 am 4 am12:30 am 1:30 am 2:30 am 3:30 am
Fill in the name of locations not listed; examples:gym, tennis court
B-2

Time/Activity Diary Activity Number:
Day 1 1 = Sleeping
2 = Eating
3 = Sitting
4 = Moderate Activity (e.g., walking)
Subject ID: 5 = Intense Activity (e.g., jogging)
Date:
Location: Inside Home
Outside
At Work
Bath/Shower
Pump Not Operating
Notes:
Activity Number(s): Do NOT leave blank
6 am4 am 5 am 7 am 8 am4:30 am 5:30 am 6:30 am 7:30 am
Fill in the name of locations not listed; examples:gym, tennis court
B-3

Time/Activity Diary Activity Number:
Day 1 1 = Sleeping
2 = Eating
3 = Sitting
4 = Moderate Activity (e.g., walking)
Subject ID: 5 = Intense Activity (e.g., jogging)
Date:
Location: Inside Home
Outside
At Work
Bath/Shower
Pump Not Operating
Notes:
Activity Number(s): Do NOT leave blank
10 am8 am 9 am 11 am noon8:30 am 9:30 am 10:30 am 11:30 am
Fill in the name of locations not listed; examples:gym, tennis court
B-4

Time/Activity Diary Activity Number:
Day 1 1 = Sleeping
2 = Eating
3 = Sitting
4 = Moderate Activity (e.g., walking)
Subject ID: 5 = Intense Activity (e.g., jogging)
Date:
Location: Inside Home
Outside
At Work
Bath/Shower
Pump Not Operating
Notes:
Activity Number(s): Do NOT leave blank
2 pmnoon 1 pm 3 pm 4 pm12:30 pm 1:30 pm 2:30 pm 3:30 pm
Fill in the name of locations not listed; examples:gym, tennis court
B-5

Time/Activity Diary Activity Number:
Day 1 1 = Sleeping
2 = Eating
3 = Sitting
4 = Moderate Activity (e.g., walking)
Subject ID: 5 = Intense Activity (e.g., jogging)
Date:
Location: Inside Home
Outside
At Work
Bath/Shower
Pump Not Operating
Notes:
Activity Number(s): Do NOT leave blank
6 pm4 pm 5 pm 7 pm 8 pm4:30 pm 5:30 pm 6:30 pm 7:30 pm
Fill in the name of locations not listed; examples:gym, tennis court
B-6

Time/Activity Diary Activity Number:
Day 1 1 = Sleeping
2 = Eating
3 = Sitting
4 = Moderate Activity (e.g., walking)
Subject ID: 5 = Intense Activity (e.g., jogging)
Date:
Location: Inside Home
Outside
At Work
Bath/Shower
Pump Not Operating
Notes:
Activity Number(s): Do NOT leave blank
10 pm8 pm 9 pm 11 pm midnight8:30 pm 9:30 pm 10:30 pm 11:30 pm
Fill in the name of locations not listed; examples:gym, tennis court
B-7

Time/Activity Diary Activity Number:
Day 2 1 = Sleeping
2 = Eating
3 = Sitting
4 = Moderate Activity (e.g., walking)
Subject ID: 5 = Intense Activity (e.g., jogging)
Date:
Location: Inside Home
Outside
At Work
Bath/Shower
Pump Not Operating
Notes:
Activity Number(s): Do NOT leave blank
2 ammidnight 1 am 3 am 4 am12:30 am 1:30 am 2:30 am 3:30 am
Fill in the name of locations not listed; examples:gym, tennis court
B-8

Time/Activity Diary Activity Number:
Day 2 1 = Sleeping
2 = Eating
3 = Sitting
4 = Moderate Activity (e.g., walking)
Subject ID: 5 = Intense Activity (e.g., jogging)
Date:
Location: Inside Home
Outside
At Work
Bath/Shower
Pump Not Operating
Notes:
Activity Number(s): Do NOT leave blank
6 am4 am 5 am 7 am 8 am4:30 am 5:30 am 6:30 am 7:30 am
Fill in the name of locations not listed; examples:gym, tennis court
B-9

Time/Activity Diary Activity Number:
Day 2 1 = Sleeping
2 = Eating
3 = Sitting
4 = Moderate Activity (e.g., walking)
Subject ID: 5 = Intense Activity (e.g., jogging)
Date:
Location: Inside Home
Outside
At Work
Bath/Shower
Pump Not Operating
Notes:
Activity Number(s): Do NOT leave blank
10 am8 am 9 am 11 am noon8:30 am 9:30 am 10:30 am 11:30 am
Fill in the name of locations not listed; examples:gym, tennis court
B-10

Time/Activity Diary Activity Number:
Day 2 1 = Sleeping
2 = Eating
3 = Sitting
4 = Moderate Activity (e.g., walking)
Subject ID: 5 = Intense Activity (e.g., jogging)
Date:
Location: Inside Home
Outside
At Work
Bath/Shower
Pump Not Operating
Notes:
Activity Number(s): Do NOT leave blank
2 pmnoon 1 pm 3 pm 4 pm12:30 pm 1:30 pm 2:30 pm 3:30 pm
Fill in the name of locations not listed; examples:gym, tennis court
B-11

Time/Activity Diary Activity Number:
Day 2 1 = Sleeping
2 = Eating
3 = Sitting
4 = Moderate Activity (e.g., walking)
Subject ID: 5 = Intense Activity (e.g., jogging)
Date:
Location: Inside Home
Outside
At Work
Bath/Shower
Pump Not Operating
Notes:
Activity Number(s): Do NOT leave blank
6 pm4 pm 5 pm 7 pm 8 pm4:30 pm 5:30 pm 6:30 pm 7:30 pm
Fill in the name of locations not listed; examples:gym, tennis court
B-12

Time/Activity Diary Activity Number:
Day 2 1 = Sleeping
2 = Eating
3 = Sitting
4 = Moderate Activity (e.g., walking)
Subject ID: 5 = Intense Activity (e.g., jogging)
Date:
Location: Inside Home
Outside
At Work
Bath/Shower
Pump Not Operating
Notes:
Activity Number(s): Do NOT leave blank
10 pm8 pm 9 pm 11 pm midnight8:30 pm 9:30 pm 10:30 pm 11:30 pm
Fill in the name of locations not listed; examples:gym, tennis court
B-13