pdf reprint - university of california, irvineeclectic.ss.uci.edu/~drwhite/pw/galois.pdf · inzage...
TRANSCRIPT
USING GALOIS LATTICES TO REPRESENT NETWORK DATA
Linton C. Freeman* Douglas R. White*
Galois lattices are introduced as a device to provide a general representation for two mode social network data. It is shown that Galois lattices yield a single visual image of such data in cases where most alternative models produce dual images. The inzage provided by the Galois lattice produces, moreover, an inzage that can suggest useful insights about the structuralprop- erties of the data.
A n example, based on data from Davis, Gardner, and Gardner (1 941), is used to spell out in detail the kinds of struc- tural insights that can be gained from this approach. In addi- tion, other potential applications are suggested.
1. INTRODUCTION T O T H E PROBLEM
Social network analysis is focused on the patterning of the social relationships that link social actors. Typically, network data take the form of a square-actor by actor-binary adjacency matrix, where each row and each column in the matrix represents a social actor. A cell entry is 1 if and only if a pair of actors is linked by some social relationship of interest (Freeman 1989).
The success of social network analysis rests in large part on the fact that network analysts have used graph theory to represent the networks they study. Graph theoretic representations permit the visu-
*University of California, Irvine

128 LINTON C. F R E E M A N A N D DOUGLAS R. WHITE
alization of networks. As Hage and Harary (1983. p . 9 ) put it. "graphical models are in some sense iconic; they look like what they represent. "
The images provided by graph theory call attention to struc- tural properties of networks that might not be apparent otherwise. Klovdahl (1981) proposed that without graph theory. or some other means of representing social structure visually. social network analy- sis would not have developed some of its most important ideas (see also Koestler 1964; Arnheim 1970: Taylor 1971; Tukey 1972: and Tufte 1983. all of whom argue the importance of visual metaphors in the development of scientific specialties). Ideas like distance. reach- ability. density. clique. cluster. centrality. betweenness. flow and bridge-ideas that are crucial in the field-have emerged from in- sights gained by representing social networks as graphs.
This commitment to adjacency matrices and their correspond- ing graph theoretic representations. however, has not been without cost. As Seidman (1981). McPherson (1982) and Wilson (1982) have all indicated. by recording only those linkages that connect pairs of actors, we limit our capacity to uncover potentially important struc- tural features of social linkage patterns. We lose the ability to distin- guish between patterns of ties that actually link pairs, and those that link larger collections of actors.
Consider. for example. three individuals-Amy. Bess. and Cheryl. Amy and Bess, let us say. were best friends in grammar school. In high school. Bess and Cheryl were always together, and in college, Amy and Cheryl were very close. What we have. then. is three pairs of individuals who-at different times and different places-have been linked together by close friendship ties.
In contrast. suppose there were three other individuals- Dorothy. Edna. and Florence. All three. let us say. were insep- arable-they made up a tight little threesome-in high school. Theirs was what Wilson (1982) has called a "multiple" relation. They were not simply linked by a disjoint series of pairwise ties, they were simultaneously bound together at a single time and in a single setting.
Intuitively, the distinction between these two patterns of link- age is, as Breiger (1974) suggested, critical. The kind of "multiple" relation that linked Dorothy, Edna. and Florence is usually taken to be an emergent structural form. Bott (1957). among others. has

USING GAL.OIS LATTICES TO REPRESENT NETWORK DATA 129
shown that such emergent forms, that link the members of col- lectivities larger than pairs, can have important consequences for the behaviors of the individual involved.
To maintain the distinction between these two kinds of struc- tures, we need to record information-not simply about the social relationships that link pairs of actors, but about how actors are linked together into collectivities of any size. We need what Wasser- man and Faust (1993) have called two mode network data.
Two mode network data define a triple (A,E,I). One mode is a set of n actors A = {a,, a], . . . . a,) and the other mode is a set containing m social events (or collectivities or organizations) E = {e,, el, . . . , em). These two sets are linked by an involvement (or mem- bership) relation I C A x E. When an actor a, is involved as a participant in an event el, then the (a,, el, E I. A two mode network is recorded as an n x m binary matrix P of participation, where p,, = 1 if (a,, el, E I a n d p , = O otherwise. By definition, then, a social event in E may link more than two of the actors in A .
Given the need to record at least some network data in two mode form, we are faced with a problem. Graph theory is perfectly satisfactory for representing traditional one mode network data. So far, however, network analysts lack a model for representing two mode networks in a manner that facilitates the kind of visualization that graph theory provides in the one mode case.
Various suggestions have been made, but as we will show, none of them is entirely satisfactory. Our aim in the present paper, then, is to introduce a representation that can provide the same kinds of rich structural insights about two mode data that graph theoretic visualization provides for one mode data. We begin, in the next section, by reviewing previous attempts along this line.
2. T H E PROBLEM O F REPRESENTING TWO MODE NETWORK DATA
As Breiger (1974) indicated, two mode network data embody an important structural duality. Two mode data are based explicitly on a relation that links social actors to social events. But the form of that relation determines other structural properties in the data. It deter- mines both the patterning of the linkages among the actors and the patterning of the linkages among the events. To be entirely satisfac-

130 LINTON C. FREEMAN AND DOUGLAS R. WHITE
tory, then, a representation should facilitate the visualization of three kinds of patterning: (1) the actor-event structure, (2) the actor-actor structure, and (3) the event-event structure.
Doreian (1980) and Freeman (1980) both drew on earlier work in discrete algebraic topology by Atkin (1974) and proposed representing two mode network data using Atkin's simplicial com- plexes. In addition, Seidman (1981) showed that the hypergraphs defined by Berge (1973) could be used to provide a similar-and perhaps simpler-representation of two mode data.
Both simplicial complexes and hypergraphs reflect the duality Breiger described. They each provide not one but two images-one revealing the way actors are linked to each other in terms of the patterning of their involvement in events and the other how events are linked to each other in terms of the ways in which they bring actors together. Both images display the relation of actors to events fairly clearly, but, since there are two of them, neither image pro- vides an overall picture of the total, actor-actor, event-event, and actor-event structure.
In 1982 Wilson suggested a way to represent two mode net- works with a single model, using bipartite graphs. Such bipartite representations succeed in providing a single image for two mode data, but they do so by displaying only the actor-event structure. They do not provide a clear image of the linkages among actors nor of those among events.
What is needed, then, is a representation that can display all three of these kinds of relations both clearly and in a single model that can facilitate visualization. In the next section we will introduce a representation, based on Galois lattices, that meets these requirements.
3. GALOIS LATTICES
We will begin by defining the properties of lattices generally and then move on to a discussion of lattices that have the Galois property. A lattice is a special kind of ordered set. Consider a finite nonempty set X = {x, y , 2 , . . .) along with a binary relation s in X x X. Let 5 be a reflexive. antisymmetric, and transitive relation that imposes a partial order on X .
Given a pair of elements x and y in X. a lower bound of x and

USING GALOIS LATTICES TO REPRESENT NETWORK DATA 131
is an element m such that m 5 x and m 5 y. A lower bound m is the greatest lower bound, or meet when there is no other element b such that b 5 x and b 5 y and m 5 b. Equivalently, an upper bound j is an element such that x 5 j, y 5 j. If there is no element b such that x I b, y 5 b, and b 5 j, j is the least upper bound, or join. Any partially ordered set in which every pair of elements has both a meet and a join is a lattice.
An example may clarify these ideas. Consider the set X =
{1,2,3). The power set P(X) consists of all the subsets X , of the set X. P(X), of course, includes X itself and the null set 0. In this case, then, its elements are {1,2,3), {1,2), {1,3), {2,3), {I), {2), (31, and (0 ) .
The elements of this power set form a partial order, based on inclusion, where (Xi) 5 (X,) @ (X, C X,). This order is diagramed in Figure 1. Note that in the figure each pair of elements has both a meet and a join. the elements {1,2) and {2,3), for example, have (2) as their meet and {1,2,3) as their join. The elements {I) and {2,3) have ( 0 ) as their meet and {1,2,3) as their join. Since this power set is partially ordered and every pair of elements in it has both a meet and a join, it is a lattice.
A Galois lattice embodies a dual ordering. The foundations for Galois lattices were introduced by Birkhoff (1940). He character- ized the structure he defined as "Galois" precisely because of its duality. Important generalizations of Birkhoff's original formulation,
FIGURE I. Lattice of the power set P(X) .

F
B

USING GALOIS LATTICES TO REPRESENT NETWORK DATA 133
and S ( E ) = {El J , E, J , . . .), the collection of images of 4 . Since these two mappings, T and J , are both constructed from the same pairs in the relation I, they contain the same number of elements, and subscripts can be assigned in such a way that A, T = E, for some El c P(E) and E l i = A, for some A, C P(A) . In Figure 2 , for example. the subset of actors containing actor 1 is mapped to that subset of events containing events A, C, and D , and the event subset containing events A, C, and D is mapped to the actor subset contain- ing actor 1.
The subsets of P ( A ) that are the elements of S ( E ) form a lattice under inclusion, as do the subsets of P(E) that are the ele- ments of S ( A ) . Moreover, these two lattices are dual inverse:
Thus the order of the elements of S ( A ) is the inverse of the order of the elements of S(E) . A single partial order of pairs (E i 4 , A, f ) can be used 1.0 represent both the order of S ( A ) and the inverse order of S(E) :
An element ( E , J , Ai ) of this dual lattice is a lower bound of another (E, J , A, T ) when Ei J is contained in E, J , or equivalently, when A, T contains A, f . In such a case, (E, J , A, f ) is an upper bound of (E i 4 , Ai f ). The universal upper bound of the lattice contains all the elements in A , and its universal lower bound contains all the elements in E. A dual lattice of this sort, where each element is a pair, is called Galois.
A Galois lattice may be displayed pictorially as a labeled line diagram. In such a diagram, each element is represented as a point and points are linked by ascending and descending lines to show their partial orderings. Each point is assigned two labels, one indicating the subset of elements in A that it represents and the other indicating the subset of elements in E that it represents.
The diagram of the Galois lattice representing the data of Figure 2 is shown in Figure 3.1 The inclusion relation I defines ten
'There is no general theory of lattice drawing, but there are several PC programs for drawing lattices, two of which have been used here. One, written by Vincent Duquenne of the Maison des Science de 1'Homme in Paris, France, is called General Lattice Analysis and Design (GLAD) . The other, prepared by

LINTON C. FREEMAN AND DOUGLAS R. WHITE
ABCD
z FIGURE 3. Lattice of the data of Figure 2-full labeling
relevant subsets of both actors and events. At the bottom is the union of all events; the null symbol 0 indicates that no actor was involved in all four events. Above and to the right, we can see that actor 4 attended events B, C, and D. And to the left, we see that actor 1 was present at events A , C, and D.
Each point in the lattice is labeled with both the actors and the events that define it. As we move up, we encounter larger collections of actors and smaller collections of events. Finally, at the top, we see that there were no events at which all six actors were present.
In practice, it is usually easier to make sense of a lattice in which the labeling is reduced. Each point is labeled only with the names of actors for which it is the least element containing those actors. Similarly, each point gets the names of any events for which it
Frank Vogt and Joerg Bliesener at the Technische Hochschule in Darmstadt, Germany, is named Diagram.

USING GALOIS LATTICES TO REPRESENT NETWORK DATA
FIGURE 4. Lattice of the data of Figure '-reduced labeling.
is the greatest element containing those events. Points that are nei- ther the least element containing any actor nor the greatest element containing any event remain unlabeled. The lattice of Figure 3 with reduced labeling is shown in Figure 4.
Figure 4 provides a pictorial image of which actors were pres- ent at which events. Any actor falling on a line descending from any event was present at that event, and, of course, any event falling on a line ascending from an actor involved that actor.
In addition, the figure also displays the containment structures for both actors and events. Event D, for example, contains event C in the sense that any actor present at event D was certainly present at event C . In the same way, the figure shows that actor 5 was never present at any event unless actors 6 and 4 were both present, and 6's attendance required that 4 be there. Thus from this single pictorial representation we can see all three patterns: (1) the actor-event struc- ture, (2) the event-event structure, and (3) the actor-actor structure. In the next section, we will take up an example using actual two mode data and see what sorts of visual insights a Galois lattice repre- sentation can provide.

136 LINTON C. FREEMAN A N D DOUGLAS R. WHITE
4. AN EXAMPLE: DAVIS, GARDNER, AND GARDNER'S SOUTHERN WOMEN
Systematic two mode data were collected as part of an ethnographic study conducted in a southern community in the United States over a period of two years (Davis, Gardner, and Gardner 1941). The re- searchers used interviews, records of observations, guest lists, and newspaper accounts to discover who was involved with whom in a series of social events in the community. Their data on the participa- tion of 18 women in 14 social events is shown in Figure 5 (from Davis, Gardner, and Gardner, p. 148).
The researchers used these data, along with their general ethno- graphic wisdom, to generate an informal description of social life among these women. They concluded that the women shown in Figure 5 were organized into two main groups and that there were three intuitively determined "levels" of participation in each group. Women 1 through 8 were assigned to group one, with l , 2 , 3, and 4 defined as core members. Women 5 , 6 , and 7 were seen as second level members and woman 8 was described as a third level member. Women 10
EVENT A B C D E F G I I I J K L M N
ACTOR 1 2 3 4 5 6 7 8 9
10
FIGURE 5. Davis, Gardner. and Gardner's two mode data

USING GALOIS LATTICES TO REPRESENT NETWORK DATA
FIGURE 6 . Lattice of the Davis, Gardner, and Gardner data
through 18 were assigned to group two. Women 13, 13, and 15 were defined as core, 11 and 12 as second level and 10, 16, 17, and 18 as third level members. They assigned woman 9 as a third level member of both groups.
A Galois lattice that displays the structure of the data of Fig- ure 5 is shown in Figure 6. All of the paired subset elements in S ( E ) and S(A) are shown in the figure. The topmost point represents the set of all 18 women and, at the same time, it represents the null set of events-there was no event that all 18 women attended. The bot- tommost point represents the set of all 14 events and the null set of actors-there was no actor who attended all the events. Labels on intermediate points show where each event and each actor entered the structure.
As students of social networks, what are we to make of this lattice diagram? Five kinds of patterning are immediate:
1. We can see the pattern of participation of actors in events. Each actor (or set of actors) participated in those events labeled at or
138 LINTON C. FREEMAN A N D DOUGLAS R. WHITE
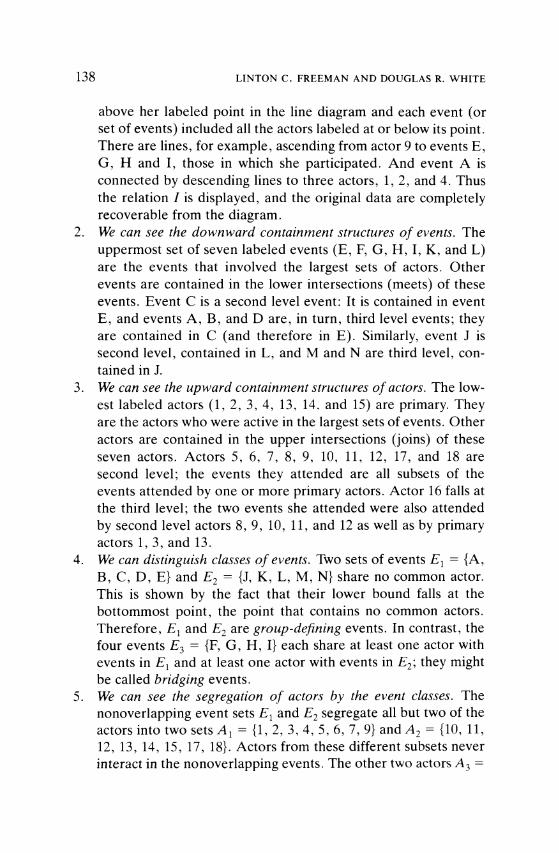
above her labeled point in the line diagram and each event (or set of events) included all the actors labeled at or below its point. There are lines, for example. ascending from actor 9 to events E , G, H and I. those in which she participated. And event A is connected by descending lines to three actors, 1, 2, and 4. Thus the relation I is displayed, and the original data are completely recoverable from the diagram.
2. We can see the downward containment structures of events. The uppermost set of seven labeled events (E, F, G , H. I , K , and L) are the events that involved the largest sets of actors. Other events are contained in the lower intersections (meets) of these events. Event C is a second level event: It is contained in event E, and events A , B. and D are, in turn, third level events; they are contained in C (and therefore in E). Similarly, event J is second level, contained in L, and M and N are third level, con- tained in J.
3. We can see the upward containment structures o f actors. The low- est labeled actors (1. 2. 3. 4, 13. 14. and 15) are primary. They are the actors who were active in the largest sets of events. Other actors are contained in the upper intersections (joins) of these seven actors. Actors 5 , 6, 7. 8 , 9, 10. 11, 12. 17. and 18 are second level; the events they attended are all subsets of the events attended by one or more primary actors. Actor 16 falls at the third level; the two events she attended were also attended by second level actors 8 , 9, 10, 11, and 12 as well as by primary actors 1, 3, and 13.
4. We can distinguish classes of events. Two sets of events El = {A. B, C, D, E} and E2 = {J, K , L, M , N} share no common actor. This is shown by the fact that their lower bound falls at the bottommost point. the point that contains no common actors. Therefore, E, and E2 are group-defining events. In contrast, the four events E, = {F, G , H, I} each share at least one actor with events in E, and at least one actor with events in E2: they might be called bridging events.
5 . W e can see the segregation of actors by the event classes. The nonoverlapping event sets El and E, segregate all but two of the actors into two sets A , = (1. 2. 3. 4. 5. 6, 7, 9) and A , = (10, 11, 12. 13, 14, 15, 17, 18). Actors from these different subsets never interact in the nonoverlapping events. The other two actors A ; =

USING GALOIS LATTICES TO REPRESENT NETWORK DATA 139
(8. 161, attend one or more of the bridging events in E, but none of the group-defining events in either E, or El.
These five patterns capture the same kinds of structural fea- tures of the data as those described by Davis. Gardner, and Gardner. Pattern 5 reveals the two groups that were described in their report. And, in most details, it assigns the women to groups in the same way that they did. The lattice analysis was unable to assign actors 8 and 16 to either group, and it did assign the actor that they put in both groups (woman 9) to the first group. Fifteen of the eighteen actors, however. are assigned to groups exactly as they were in the ethno- graphic report.
In addition, pattern 3 specifies exactly the same core members of the two groups as those listed by Davis, Gardner, and Gardner. Every actor they listed at the second level is also assigned at that level in the present analysis. Here, we did assign more actors to that second level. but the one third level actor uncovered here (woman 16) was also defined as third level in their intuitive description.
Overall, then, it would seem that a Galois lattice can be used to display the form of an actor-event structure in a way that makes it easy to see the kinds of structural features that are important to sociologists.2 A Galois lattice is constructed in such a way that it immediately reveals more structural information than we could see easily in a bipartite graph. Moreover. the use of Galois lattices solves the problem of duality; unlike hypergraphs or simplicia1 complexes, Galois lattices permit the simultaneous examination of the structural features of both actor-actor and event-event patterning.
We suggested in section 1 above, that an effective representa- tion should yield new structural insights. In the final section, we will
21t should be noted that the actor sets, A l , A2, and A3 and the event sets E l , E2, and E 3 uncovered here are almost perfectly regular blocks (White and Reitz 1983), and they are the largest proper set of such blocks in these data. The conditions for regular equivalence can be read directly from the original lattice in Figure 5. Every actor in A1 = {I ,2,3,4,5,6,7,9) attended one or more events in E l = {A,B,C,D,E} and one or more events in E3 = {F,G,H,I}. Every actor in A2 = {10,11,12.13,14,15,17,18) attended one or more events in E2 = {J,K,L,M,N} and one or more in E3. Every actor in A3 = {8,16) attended one or more events in E3. Every event in E l was attended by one or more actors in A l . Every event in E2 was attended by one or more actors in A2. Finally, every event in E3 (with the sole exception of event G in which no actor from A3 was involved) was attended by one or more actors in A l , A2 and A3.

140 LINTON C. FREEMAN A N D DOUGLAS R. WHITE
continue using the Davis, Gardner, and Gardner example to show how Galois lattices can call attention to novel structural features and thereby enrich the analysis of network data.
5. EXTENDING LATTICE REPRESENTATIONS
The lattice representation of the Davis, Gardner. and Gardner data can be extended beyond the description of groups and levels of mem- bership. Pattern 4 above, for example, partitions the events into three classes. The sets E , and E, are group-defining events: They share no actors in common. In contrast, the set containing events F, G , H, and I includes those that are bridging: events that bring the actors associated with El and E, together in common settings. By considering these three classes of events separately, we can learn something about how the actors are linked together into groups and how they are involved in the structure of ties between the groups.
Figure 7 is the lattice of E l . It is constructed from the first five columns of Figure 5 (events A through E ) and includes all the
FIGURE 7. Lattice of the event? in E , .

USING GALOIS LATTICES TO REPRESENT NETWORK DATA 141
women (1 through 18). The women listed at the topmost point (8, and 10 through 18) are those who were not involved in any of these events. Within this group, event E is the most inclusive, C is next, and A, B, and D are the least inclusive. Woman 1 was the most involved in these group activities, and she was followed by women 2, 3, and 4. then 5, then 6, and finally by 7 and 9.
In this group lattice we see not three but rather five levels of participation. Woman 1 is more involved than 2, 3, and 4, but the latter three are all right there at the next level. These are the women that Davis, Gardner, and Gardner located at the core, and here they are all shown to be more involved than any women that those au- thors classified at the second level (5, 6, and 7). Furthermore, woman 9, whom they classified at the third level, appears at the top of this lattice. Thus the present analysis suggests that Davis, Gard- ner, and Gardner's descriptions pretty well capture these women's roles at the level of group participation.
The same can be said for the second group. Its lattice structure (based on events J through N) is shown in Figure 8. This time women
v 1 4
FIGURE 8. Lattice of the events in E,.

142 LINTON C. FREEMAN AND DOUGLAS R. WHITE
1 through 9 and 16 appear at the top because they were not active in these events. Woman 13 is the most active, and she is followed closely by women 12, 13, and 15. Davis. Gardner, and Gardner defined women 13, 14, and 15 as the core members and put woman 12 at the next level. Their other second level woman (11) falls above women 12. 13, and 15, so the agreement is substantial. Finally. the women they assigned to the periphery (10, 17, and 18) are all located near the top-the most peripheral level here. So again, we see a close corrrespondence between the results of lattice analysis at the group level and those described by Davis, Gardner, and Gardner.
Finally, the lattice for events F through I is shown in Figure 9. This is a Boolean lattice 24. The fact that it is Boolean indicates that all of the possible combinations of the four events occur in the data. In the two "group" lattices (Figures 7 and 8) some. but not all, combinations of events were observed. In the case of this "bridging" lattice, however, the women's attendance patterns reflect that every possible combination of the four bridging events occurred.
If we examine the positions of actors in Figure 9, we can see that woman 3 plays the primary bridging role; she was present at all
FIGURE 9. Lattice of the events In E,.

USING GALOIS LATTICES TO REPRESENT NETWORK DATA 143
four bridging events. Women 1, 2 , 4, 7, 8, 9, 10, 13, and 14 all fall at the next level and played significant bridging roles. Women 6, 11, 12, 15, and 16 had a smaller role, and women 5 ,17 , and 18 were involved in bridging only in a very peripheral way.
From these comparisons, we can begin to differentiate not only between core and peripheral roles, but between those roles that solidify the groups and those that bridge across group boundaries. Woman 1 , for example, played a critical role in tying the first group together. In contrast, woman 3, who was also a rather central mem- ber of that same group, had the major role in linking the two groups together. Examined in this way, the lattice structure suggests a new and more subtle basis for differentiating among the roles played by individuals.
All in all, most of the structural properties of the Davis, Gard- ner, and Gardner data that we have uncovered here are quite similar to those described in their ethnography. But while their report was based on impressions, the lattice analysis is systematic. In addition, we have been able to uncover a kind of role differentiation that they did not anticipate. Lattice analysis of structural properties of the data has suggested that some of these women were important to the inte- gration of the groups while others were active primarily as bridges between groups, knitting the whole structure together. This illus- trates precisely the kind of structui-a1 insight that a powerful represen- tation can provide.
Like graph theory, Galois lattices provide an isomorphic im- age of binary data. Like graphs, their principal use is to represent, not to reduce, data. Thus, lattices share the limitation of graphs that, due to the inability of observers to untangle extremely complex im- ages, they may not be useful for displaying large data sets.
Some binary data structures embody restrictions on possible orderings that lend visual simplifications to their lattice representa- tion. Lattices of cliques, for example, generate easily interpretable structures (Freeman 1992), as do dual orderings of kinship relations (White and Jorion 1993).
In addition, statistical or algebraic data reductions may be used prior to lattice representations. Duquenne (1992) and White (1992) show how statistical reductions that are quasiordered (with exceptions) yield relationships between sets that can be usefully rep- resented as lattices. Freeman and Duquenne (1993) also show how

144 LINTON C. FREEMAN AND DOUGLAS R. WHITE
regular equivalence (White and Reitz 1983) can provide a reduction of person by event data prior to its representation.
The visual representation of the dual orderings provided by lattice representations are potentially applicable in a wide range of substantive problems. These include the analysis of group structure illustrated here, but they also may yield important insights in any applications where two mode data appear. A number of potential applications suggest themselves. These include research on voluntary associations (McPherson 1982), the structure of policy domains (Laumann and Knoke 1987; Knoke 1990). upper-class inner circles (Kadushin 1974; Useem 1984), business complexes (Levine 1972: Stokman, Ziegler, and Scott 1985; Mizruchi and Schwartz 1987) and kinship relations (White and Jorion 1993).
REFERENCES
Arnheim, R. 1970. Visual Thinking. London: Faber. Atkin, Ronald H. 1974. Mathematical Structure in Human Affairs. New York:
Crane. Rusak. Barbut, Marc. and Bernard Monjardet. 1970. Ordre et Class{fication. Paris:
Hachette Universite Berge, Claude. 1973. Graphs and Hypergraphs. Amsterdam: North-Holland. Birkhoff. Garrett. 1940. Lattice Theory. Providence: American Mathematical
Society. Bott. Elizabeth. 1957. Family and Social Network. London: Tavistock Publica-
tions. Breiger. Ronald. 1974. "The Duality of Persons and Groups." Social Forces
53:181-90. Davis. Allison, Burleigh B. Gardner. and Mary R. Gardner. 1941. Deep South.
Chicago: University of Chicago Press. Doreian. Patrick. 1980. "On the Evolution of Group and Network Structure."
Social Networks 2:235-52. Duquenne, Vincent. 1987. "Contextual Implications between Attributes and
Some Representation Properties for Finite Lattices." In Beitraege zur Beg- riffsanalyse, edited by Bernard Ganter, Ruldolph Wille. and Karl Erich Wolf. 213-39. Mannheim: Wissenschaftsverlag.
. 1991. "On the Core of Finite Lattices." Discrete Mathematics 88:133- 47.
. 1993. "On Lattice Approximations I: Syntactic Aspects." Social Net- works, forthcoming.
Freeman. Linton C . 1980. "Q-analysis and the Structure of Friendship Net- works." International Journal of Man-Machine Studies 12:367-78.

USING GAL.OIS LATTICES TO REPRESENT NETWORK DATA 145
. 1989. "Network Representations." In Research Methods in Social Net- work Analysis, edited by Linton C . Freeman. Douglas R . White. and A . Kimball Romney, 11-40. Fairfax, Va: George Mason University Press.
. 1902. "La Resurrection des Cliques: Application du Treillis de Galois." Bulletin de M6thodologie Sociologique 37: 3-24.
Freeman. Linton C . , and Vincent Duquenne. 1993. "A Note on Regular Color- ings of Two Mode Data." Social Networks, forthcoming.
Hage, Per, and Frank Harary. 1983. Structural Models in Anthropology. Cam- bridge: Cambridge University Press.
Kadushin, Charles. 1974. The America1 Intellectual Elite. Boston: Little Brown. Klovdahl, Alden S. 1981. "A Note on Images of Networks." Social Networks
3: 197-214. Koestler, A . 1964. The Act of Creation. New York: Macmillan. Knoke, David. 1990. Organization for Collective Action: The Political Econom-
ics of A.~sociation. New York: A . de Gruyter. Laumann. Edward 0.. and David Knoke. 1987. The Organizational State: Social
Choice ,in National Policy Domains. Madison: University of Wisconsin Press. Levine, Joel. 1972. "The Sphere of Influence." American Sociological Review
37: 14-27. McPherson, J. Miller. 1982. "Hypernetwork Sampling: Duality and Differentia-
tion among Voluntary Organizations." Social Networks 3:225-49. Mizruchi. Mark S. , and Michael Schwartz. 1987. Intercorporate Relations: The
Srructural Analysis of Business. New York: Cambridge University Press. Seidman, Steven B. 1981. "Structures Induced by Collections of Subsets: A
Hypergraph Approach." Mathematical Social Sciences 1:381-96. Stokman, Frans N., Rolf Ziegler. and John Scott. 1985. Networks of Corporate
Power. Cambridge: Polity Press. Taylor, A. M. 1971. Imagination and the Growth of Science. New York:
Shocken. Tufte, E . R. 1983. The Visual Display of Quantitati\,e Information. Cheshire,
Conn.: Graphics Press. Tukey, John W. 1972. "Some Graphic and Semigraphic Displays. In Statistical
Papers in Honor of George W. Snedecor, edited by T. A . Bancroft. Ames: Iowa State University Press.
Useem, Michael. 1984. The Inner Circle: Large Corporations and the Rise of Business Political Activity. New York: Oxford University Press.
Wasserman, Stanley, and Katherine Faust. 1993. Social Network Analysis: Meth- ods and Applications. New York: Academic Press.
White, Douglas R. 1992. "On Lattice Approximations 11: Statistical Interpreta- tions from Entailment Analysis." Social Networks, forthcoming.
White. Douglas R . , and Paul Jorion. 1993. "Representing and Analysing Kin- ship: A New Approach." Current Anthropology, forthcoming.
White, Douglas R . . and Karl P. Reitz. 1983. "Graph and Semigroup Homo- morphisms." Social Networks 5 : 193-234.
Wille. Rudolph. 1982. "Restructuring Lattice Theory: An Approach Based on

146 LINTON C. FREEMAN A N D DOUGLAS R. WHITE
Hierarchies of Concepts." In Ordered Sets, edited by I . R~val . Boston: Reidel, Dordrecht.
. 1984. "Line Diagrams of Hierarchical Concept Systems." International Classification 11 :77-86.
Wilson. Thomas P. 1982. "Relational Networks: An Extension of Sociometric Concepts." Social Networks 4:105-16.