appendix f capital improvement plan documentation improvement plan documentation 1 capital...
TRANSCRIPT
Appendix F
Capital Improvement Plan Documentation
Updated December 2012


Capital Improvement Plan Documentation i
Capital Improvement Plan Documentation
Table of Contents
What is the CIP? .................................................................................................. 1
How to Use the CIP ............................................................................................... 1
2012 CIP Update .................................................................................................. 1
How Are the CIP Criteria Linked to the TMP? ................................................................ 2
How Is The Matrix Used? ........................................................................................ 3
CIP Ranking Process .............................................................................................. 3
Project Evaluation Criteria ..................................................................................... 4
Project Grouping ................................................................................................. 5
Project Costs and Revenue Summary ......................................................................... 6
CIP List Legend ................................................................................................... 8
CIP Lists ............................................................................................................ 9
Grouped Project Details ....................................................................................... 36
Maps .............................................................................................................. 50


Capital Improvement Plan Documentation 1
CAPITAL IMPROVEMENT PLAN UPDATE PROCESS
What is the CIP? The Transportation Capital Improvement Plan (CIP) presents a list of transportation projects that are needed to achieve the vision of the Transportation Master Plan (TMP). The projects represent all modes of transportation, and range from projects that address existing basic deficiencies to those necessary in the future to achieve the high standards of a world class city. The CIP is also a tool that facilitates the allocation of resources based on project and system level prioritization reflecting the TMP visions and community needs.
How to Use the CIP The CIP list and spreadsheet tool are dynamic, and can reflect changes in City vision, transportation needs, and resource availability over time. Updates to the CIP are expected every two years and can be related to new opportunities, partnerships, and funding strategies. The CIP update process includes the following steps:
Update the project lists; Reassess project cost and benefits for adherence to the vision, principles, and policies; Reassess the relative weight of each scoring category to reflect City priorities; Re-sort project lists based on revised input; Identify high priority projects within each category; Identify funding resource needs and gaps; and Use the prioritized list as information for selecting projects during the bi-annual budgeting and strategic
planning efforts
The updated CIP includes the specific projects needed through 2035 for the various categories to achieve our community’s long-term goals. It is important to note that additional projects may be added to the City’s CIP lists over time based upon the outcome of the master plans for each of the remaining Enhanced Travel Corridors as well as other changes resulting from updates to future sub-areas plans. In addition, the City may pursue inter-agency partnerships to construct regional infrastructure projects such as interchanges along I-25, regional transit improvements, and/or multi-use trails as opportunities for collaboration come forward in the future.
2012 CIP Update The focus of the 2012 CIP update was to ensure that the CIP is accurate, up-to-date, and more user-friendly. The update also supports the next steps laid out in the 2011 CIP:
Refining project rankings; Better identifying a fiscally constrained list; and Assisting with the project selection process for funding and grant applications.
Specific updates include:
Removing projects that have been constructed; Adding projects from recently completed plans, based on public input, and based on a review of the
Master Street Plan; Reorganizing project groupings for consistency and understandability; Refining project details, with a particular focus on the highest need, highest priority projects; Adding cross-references for projects in separate categories that coincide and should be coordinated; and Adding Trails category to eliminate duplication of projects in both Bicycle and Pedestrian categories and
to coordinate with Park Planning efforts. Ongoing efforts include:
Developing a fiscally constrained CIP project list; and
Capital Improvement Plan Documentation 2
Incorporating transportation CIP data into the citywide CIP online tool.
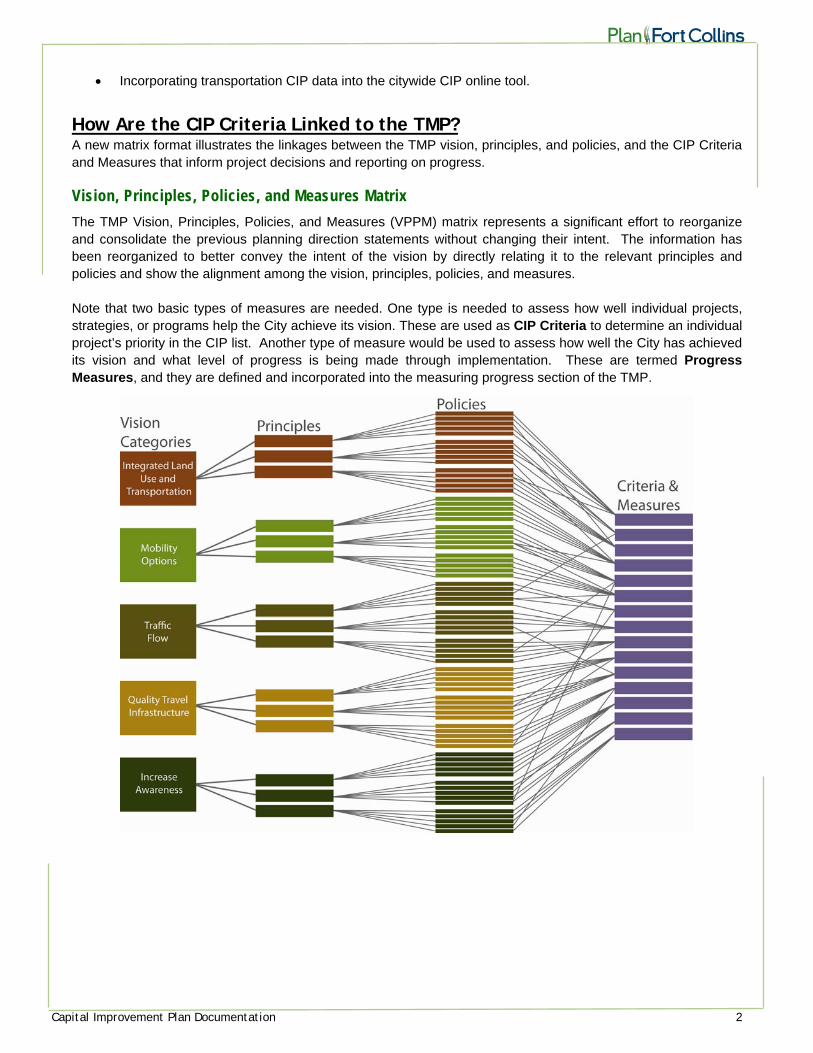
How Are the CIP Criteria Linked to the TMP? A new matrix format illustrates the linkages between the TMP vision, principles, and policies, and the CIP Criteria and Measures that inform project decisions and reporting on progress.
Vision, Principles, Policies, and Measures Matrix
The TMP Vision, Principles, Policies, and Measures (VPPM) matrix represents a significant effort to reorganize and consolidate the previous planning direction statements without changing their intent. The information has been reorganized to better convey the intent of the vision by directly relating it to the relevant principles and policies and show the alignment among the vision, principles, policies, and measures. Note that two basic types of measures are needed. One type is needed to assess how well individual projects, strategies, or programs help the City achieve its vision. These are used as CIP Criteria to determine an individual project’s priority in the CIP list. Another type of measure would be used to assess how well the City has achieved its vision and what level of progress is being made through implementation. These are termed Progress Measures, and they are defined and incorporated into the measuring progress section of the TMP.
Capital Improvement Plan Documentation 3
How Is The Matrix Used? The matrix helps illustrate how the vision is connected to the principles, the principles to the policies, and the policies to measures and criteria. The nearly direct connection from measures to visions is easy to observe and facilitates a better understanding of how the measures are applied. The matrix was used to consolidate the information in the TMP, making the TMP easier to comprehend. It also forms the basis for the revised CIP tool. The CIP has a much more direct connection to the overall TMP. Project prioritization is based largely on maximizing the overall attainment of the transportation vision as determined by each individual project’s ability to address the vision, principles and policies.
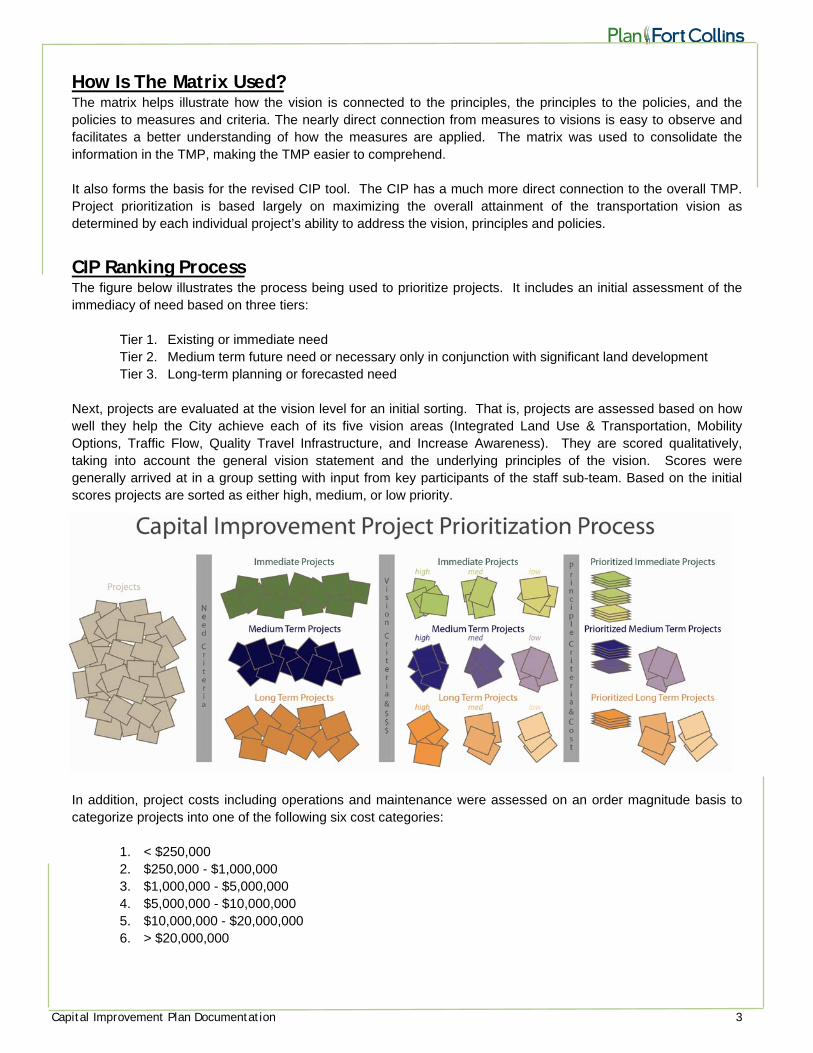
CIP Ranking Process The figure below illustrates the process being used to prioritize projects. It includes an initial assessment of the immediacy of need based on three tiers:
Tier 1. Existing or immediate need Tier 2. Medium term future need or necessary only in conjunction with significant land development Tier 3. Long-term planning or forecasted need
Next, projects are evaluated at the vision level for an initial sorting. That is, projects are assessed based on how well they help the City achieve each of its five vision areas (Integrated Land Use & Transportation, Mobility Options, Traffic Flow, Quality Travel Infrastructure, and Increase Awareness). They are scored qualitatively, taking into account the general vision statement and the underlying principles of the vision. Scores were generally arrived at in a group setting with input from key participants of the staff sub-team. Based on the initial scores projects are sorted as either high, medium, or low priority.
In addition, project costs including operations and maintenance were assessed on an order magnitude basis to categorize projects into one of the following six cost categories:
1. < $250,000 2. $250,000 - $1,000,000 3. $1,000,000 - $5,000,000 4. $5,000,000 - $10,000,000 5. $10,000,000 - $20,000,000 6. > $20,000,000
Capital Improvement Plan Documentation 4
A combination of cost and vision level scoring was used in the prioritization process, which resulted in a cost adjusted vision score. This adjustment allowed for large projects with a high impact on the City’s vision to be compared with smaller projects which do not have as much of an impact on the City’s vision.
Project Evaluation Criteria Within project categories and programs, projects were evaluated using criteria specific to the project types. The following factors were evaluated in each project category and are consistent with the intent of the vision statements, principles, and policies in the Transportation Master Plan. Order of magnitude capital costs as well as operating and maintenance costs were factored into the scoring.
ATMS
Advanced Traffic Management System (ATMS) projects were scored and ranked based on traffic engineering criteria related to safety and traffic flow that also take into account traffic operations. These projects were categorized as high priority video detection intersections, serial radio intersections, signalized intersections, countdown pedestrian heads, pushbutton accessibility, pedestrian signal locations, traffic operations center, medium priority video detection, low priority video detection intersections, or traffic operations.
Bicycle
Projects were ranked individually on the following criteria from the 2008 Bicycle Plan: connectivity, convenience, priority bicycle routes, completing existing gaps in the network, and safety. Then, projects were grouped into programs for the CIP list and designated as Tier 1, 2, or 3 projects.
Bridge
Projects were scored and ranked based on engineering criteria related to safety and quality infrastructure that also take into account structural ratings. The inspections of major bridges are performed under the National Bridge Inspection Standard (NBIS) developed by the Federal Highway Administration (FHWA). The NBIS also determines the rating criteria. For Colorado, this is administered through the Colorado Department of Transportation (CDOT). The City’s bridge inspection consultant uses the same NBIS criteria for our minor bridge inspections.
Intersection
The recent intersection priority study was used as the basis for intersection evaluation. Projects were ranked based on the following indicators: Crashes Design Cost Cost/Benefit Project Leveraging Implementation Congestion Buffering Noise Consistency with Adjacent Land Uses
Adverse Impacts
Ability to Accommodate All Users Pedestrian/Bicycle Crashes Operation & Maintenance Costs Minimizes Emissions Environmental Impacts Movement of Goods, Services and Freight Advances Adequate Public Facilities Project Funding Supports Development Objectives
Parking
Each of the items in the parking list was scored relative to the vision categories. This list will be updated as a result of the 2012 Parking Plan Update.
Capital Improvement Plan Documentation 5
Pedestrian
Projects were ranked individually on the following criteria: Needs Assessment Partnership Opportunity Pedestrian Volume ROW needed ADA Concern Economic Development Opportunity Proximity to Pedestrian Destinations Pedestrian Accidents
Street Classification Pedestrian Corridor/Activity Center Transit Connector Directness Continuity Street Crossings Visual Interest and Amenity Security
Projects were then grouped into programs for the CIP list and designated as Tier 1, 2, or 3 projects.
Railroad
Projects were scored and ranked based on engineering criteria related to safety and quality infrastructure and take into account traffic volumes and pavement condition.
Roadway
Projects were scored and ranked based on relationship to all five vision categories by an interdisciplinary panel including personnel from Engineering, Traffic Operations, Transit, Street Maintenance, Land Use Planning, Transportation Planning, Utilities, and Natural Resources. Each project was scored on how well they supported the following:
Integrated Land Use and Transportation Mobility Options Traffic Flow Quality Travel Infrastructure Increase Awareness
Within each vision category, supporting principles were considered in determining the vision score as well as supporting measures and criteria such as multimodal Level of Service, safety, and pavement condition. The vision scores for each project were adjusted to include order of magnitude cost estimates.
Trails
The new Trail CIP list contains projects related to paved trails (i.e., multi-use paths) and grade-separated crossings (i.e., underpasses and overpasses), including trail projects identified by Park Planning and those in the Bicycle Plan and Pedestrian Plan. Projects were grouped and scored relative to the vision categories.
Transit
Projects represent the phasing recommendations from the 2009 Transfort Strategic Operating Plan. The phases were designated as Tier 1, 2, or 3 projects. Four program phases consisting of existing service, TSP Phase I, TSP Phase II, and TSP Phase III were scored on how well they contribute towards the City’s visions.
Project Grouping A very large undertaking, the list of projects exceeded 700 at one point. To facilitate a more efficient review process many projects were grouped into ‘programs’ which were then evaluated on their aggregated ability to achieve the City’s vision. For instance, railroad grade crossing improvements were grouped in this list into several upgrade programs, rather than list each individual grade crossing that is planned for upgrades. This was done for the following:
ATMS projects Bicycle projects
Capital Improvement Plan Documentation 6
Bridge projects Intersection improvements Parking Pedestrian projects Railroad grade crossing upgrades Trail projects Transit projects
Roadway projects were all scored individually.
Project Costs and Revenue Summary The following summarizes the estimated project costs and revenue forecasts for the short-term and long-term horizons. The lists of projects in the CIP and the resulting costs reflect the continued commitment to a multimodal transportation system. Of the capital costs, automobile related transportation needs represent approximately 55% of near-term needs and 77% of long-term needs. Bicycle and pedestrian related costs reflect approximately 13% of near-term needs and approximately 9% of long-term needs, and transit capital costs are approximately 32% of near-term needs and 15% of long-term needs. The summary table on the next page includes transit capital costs, but it should be noted that a large amount of transit costs also goes towards operations and maintenance (O&M). The Transfort Strategic Operating Plan estimates annual O&M costs for Phases I - III respectively as follows: $11.5M, $18.8M and $25.9M. Short-term project costs are the sum of costs for all those projects identified as having Tier 1 needs, i.e., immediate or existing needs. Short-term funding sources are based on funding that has been allocated specifically to bicycle, pedestrian, and intersection improvements from the remaining Building on Basics (BOB) funds, from other sources specified in the 2013-14 biennial budget, along with the anticipated six year revenue stream from the other transportation portion of 2B and the Street Oversizing Fund and state and federal grants that have been secured. The six-year funding shortfall is expected to be over $157 million. The short-term project funding needs are clearly and dramatically in excess of the anticipated available revenue. The long-term funding shortfall is expected to exceed $986 million, including the short-term funding gap. The long-term project funding needs are also dramatically in excess of the anticipated available revenue. Long-term project costs are the sum of costs for all those projects identified in the CIP list and encompass existing needs, midterm needs, and long-term or planned project needs. While the City is appreciative of local support for existing and new transportation funding initiatives, the short-term and long-term funding gaps represent an annual gap of $26 to $41 million per year from now through 2035. It also signifies that less than 25% percent of the needed capital project funding revenue has been secured in the long term. Allocated revenue in the table shows known funding for each category in each term and also shows known capital funding from other sources such as 2B and the Street Oversizing Fund. The resulting gap in needed funding to complete all of the projects identified on the CIP category lists ($986.7 million) is slightly more than the $936.2 million funding gap in the 2011 TMP, largely because of the inclusion of Transit needs in the 2012 table. The funding gap is substantial and underscores the need for the Transportation Master Plan principle and policies related to responsible stewardship of transportation resources. To continue making progress on the CIP, the City will need to seek and secure long-term sustainable funding for capital, operating, and maintenance needs, as well as continue to exercise fiscal responsibility with available resources and pursue new and innovative funding strategies and partnerships.
Capital Improvement Plan Documentation 7
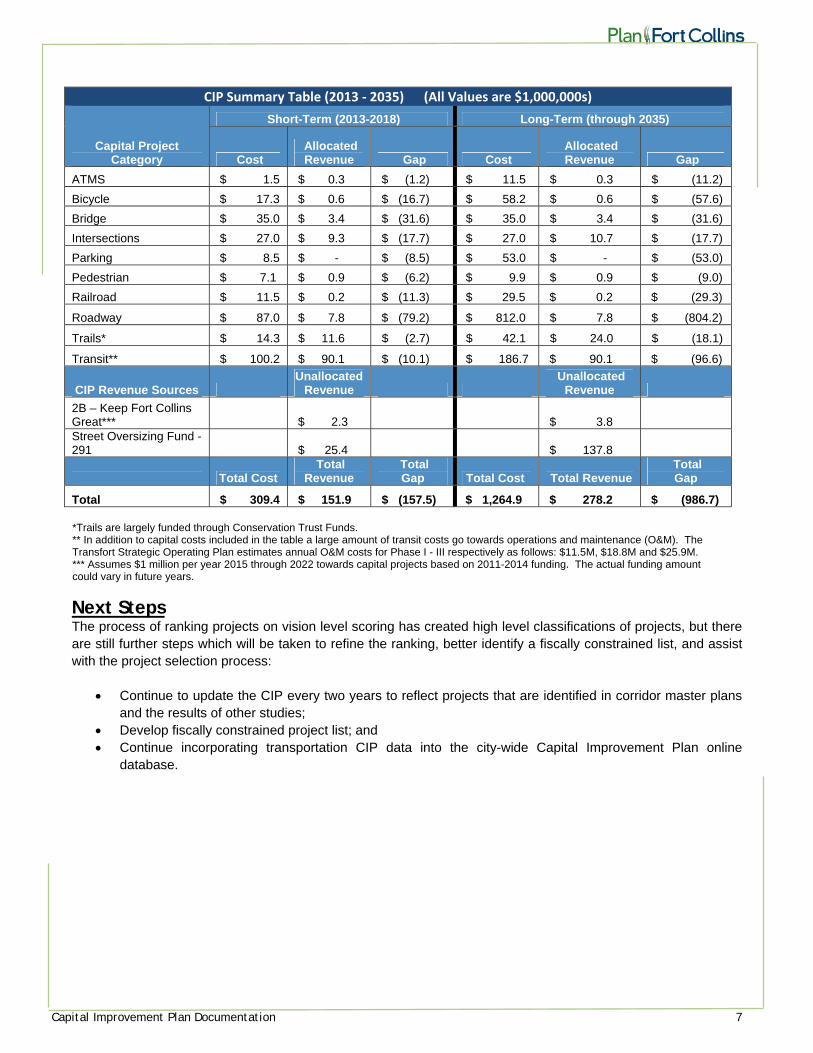
CIP Summary Table (2013 ‐ 2035) (All Values are $1,000,000s)
Capital Project Category
Short-Term (2013-2018) Long-Term (through 2035)
Cost Allocated Revenue Gap Cost
Allocated Revenue Gap
ATMS $ 1.5 $ 0.3 $ (1.2) $ 11.5 $ 0.3 $ (11.2)
Bicycle $ 17.3 $ 0.6 $ (16.7) $ 58.2 $ 0.6 $ (57.6)
Bridge $ 35.0 $ 3.4 $ (31.6) $ 35.0 $ 3.4 $ (31.6)
Intersections $ 27.0 $ 9.3 $ (17.7) $ 27.0 $ 10.7 $ (17.7)
Parking $ 8.5 $ - $ (8.5) $ 53.0 $ - $ (53.0)
Pedestrian $ 7.1 $ 0.9 $ (6.2) $ 9.9 $ 0.9 $ (9.0)
Railroad $ 11.5 $ 0.2 $ (11.3) $ 29.5 $ 0.2 $ (29.3)
Roadway $ 87.0 $ 7.8 $ (79.2) $ 812.0 $ 7.8 $ (804.2)
Trails* $ 14.3 $ 11.6 $ (2.7) $ 42.1 $ 24.0 $ (18.1)
Transit** $ 100.2 $ 90.1 $ (10.1) $ 186.7 $ 90.1 $ (96.6)
CIP Revenue Sources Unallocated
Revenue Unallocated
Revenue
2B – Keep Fort Collins Great*** $ 2.3 $ 3.8 Street Oversizing Fund - 291 $ 25.4 $ 137.8
Total Cost Total
Revenue TotalGap Total Cost Total Revenue
TotalGap
Total $ 309.4 $ 151.9 $ (157.5) $ 1,264.9 $ 278.2 $ (986.7) *Trails are largely funded through Conservation Trust Funds. ** In addition to capital costs included in the table a large amount of transit costs go towards operations and maintenance (O&M). The Transfort Strategic Operating Plan estimates annual O&M costs for Phase I - III respectively as follows: $11.5M, $18.8M and $25.9M. *** Assumes $1 million per year 2015 through 2022 towards capital projects based on 2011-2014 funding. The actual funding amount could vary in future years.
Next Steps The process of ranking projects on vision level scoring has created high level classifications of projects, but there are still further steps which will be taken to refine the ranking, better identify a fiscally constrained list, and assist with the project selection process:
Continue to update the CIP every two years to reflect projects that are identified in corridor master plans and the results of other studies;
Develop fiscally constrained project list; and Continue incorporating transportation CIP data into the city-wide Capital Improvement Plan online
database.
Capital Improvement Plan Documentation 8
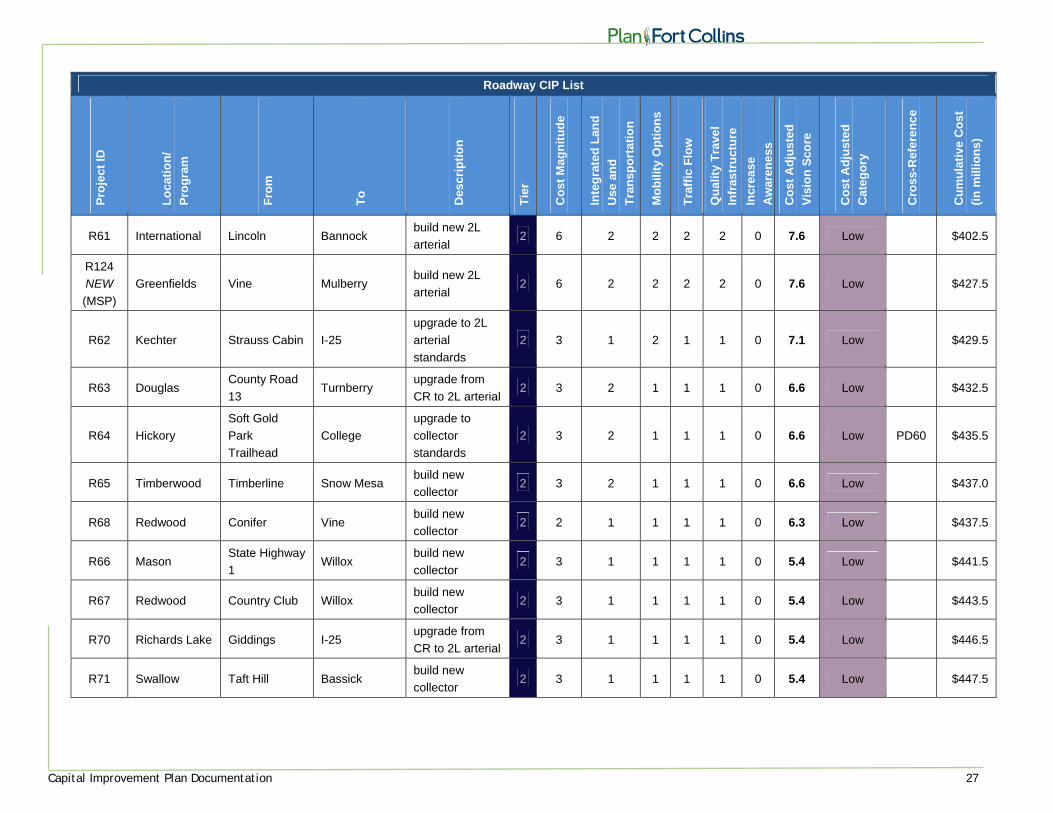
CIP List Legend Using the CIP tool developed as part of the 2011 TMP, all individual projects and grouped projects (programs) were ranked against other projects of the same category. The CIP tables show a prioritized list for each of the project categories with summary attributes of the scoring process. The CIP tool is flexible in this process and could be used to rank all project types against each other, but this would require careful calibration. The first four columns of most tables have descriptor attributes of the project including Location/Program, From, To, and Description. For some project types, the Location/Program field describes the program of projects, and for other project types it describes the street or intersection of the project. The From and To fields are used as descriptors for the start and end of some projects. The Description field gives additional information for many of the projects. The Tier column of each table is an initial assessment of the immediacy of need based on three categories:
1. Existing or immediate need 2. Midterm future need or necessary only in conjunction with significant land development 3. Long-term planning or forecasted need
There may be projects shown with a different Tier number on separate lists. For example, a roadway project with a bridge or railroad crossing component may be shown as a Tier 3 project on the roadway list, but the bridge or railroad crossing may be shown as a Tier 1 or 2 due to the unique evaluation criteria for each category. In the Cost Magnitude column, project costs including operations and maintenance were assessed on an order magnitude basis to categorize projects into one of the following six cost categories:
1. < $250,000 2. $250,000 - $1,000,000 3. $1,000,000 - $5,000,000 4. $5,000,000 - $10,000,000 5. $10,000,000 - $20,000,000 6. > $20,000,000
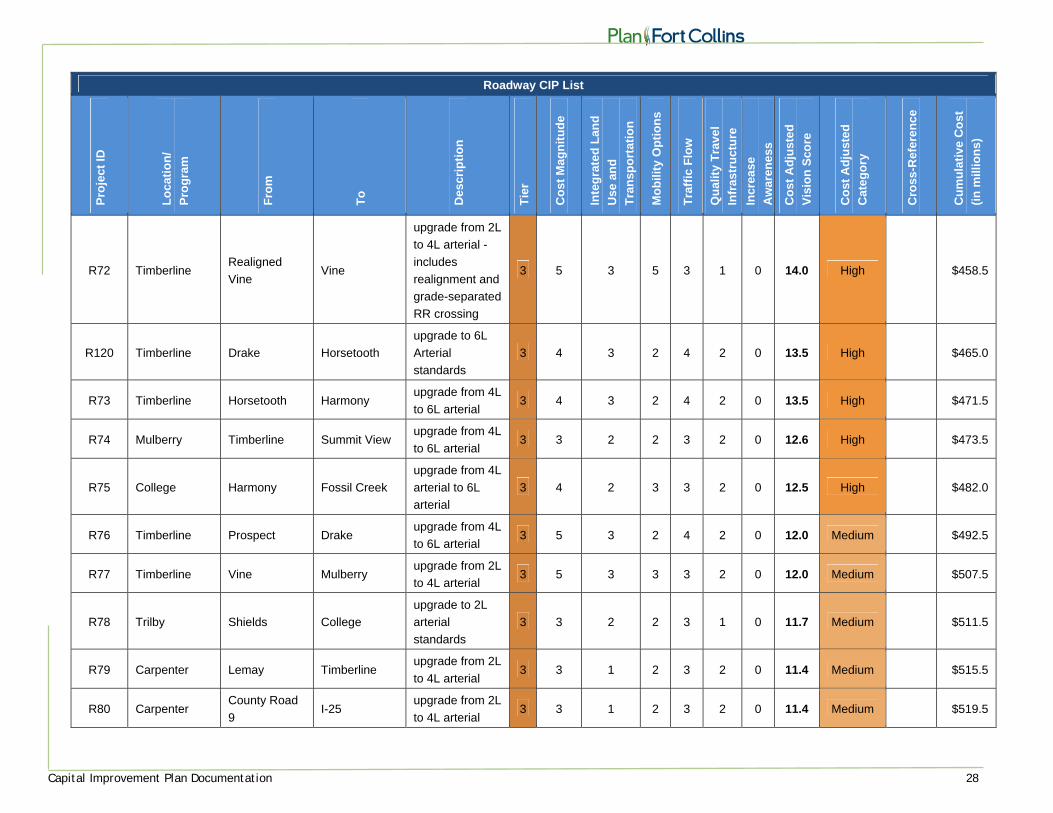
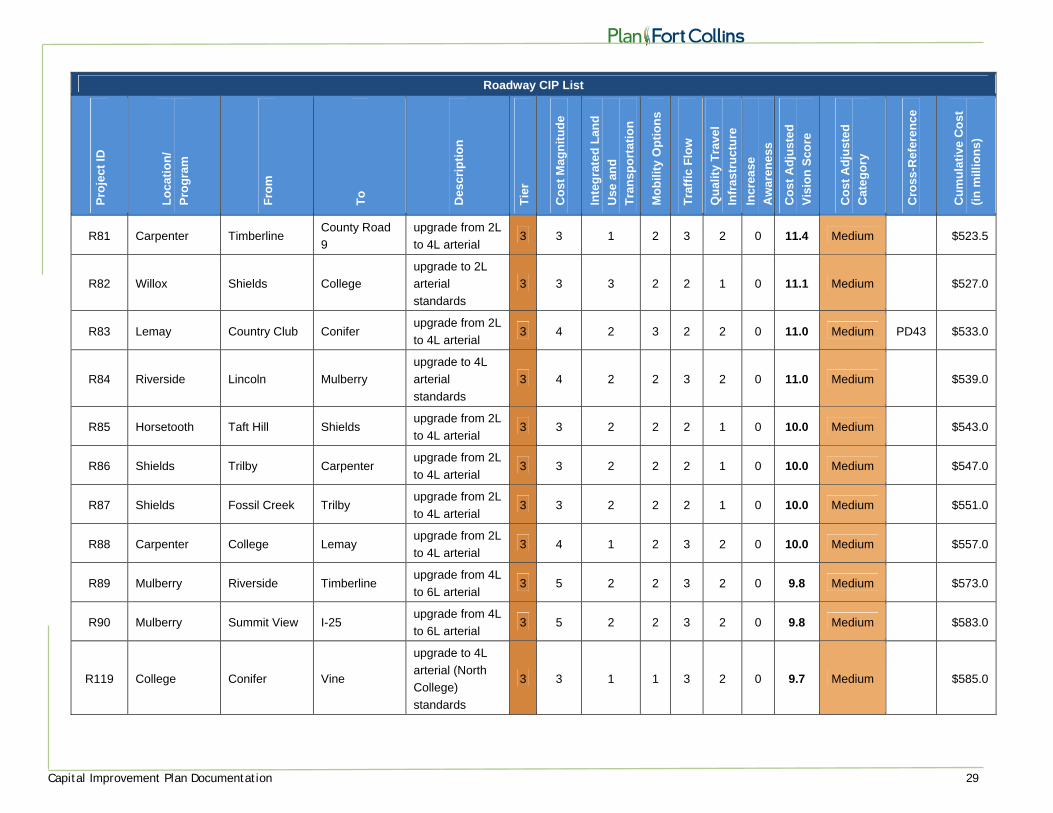
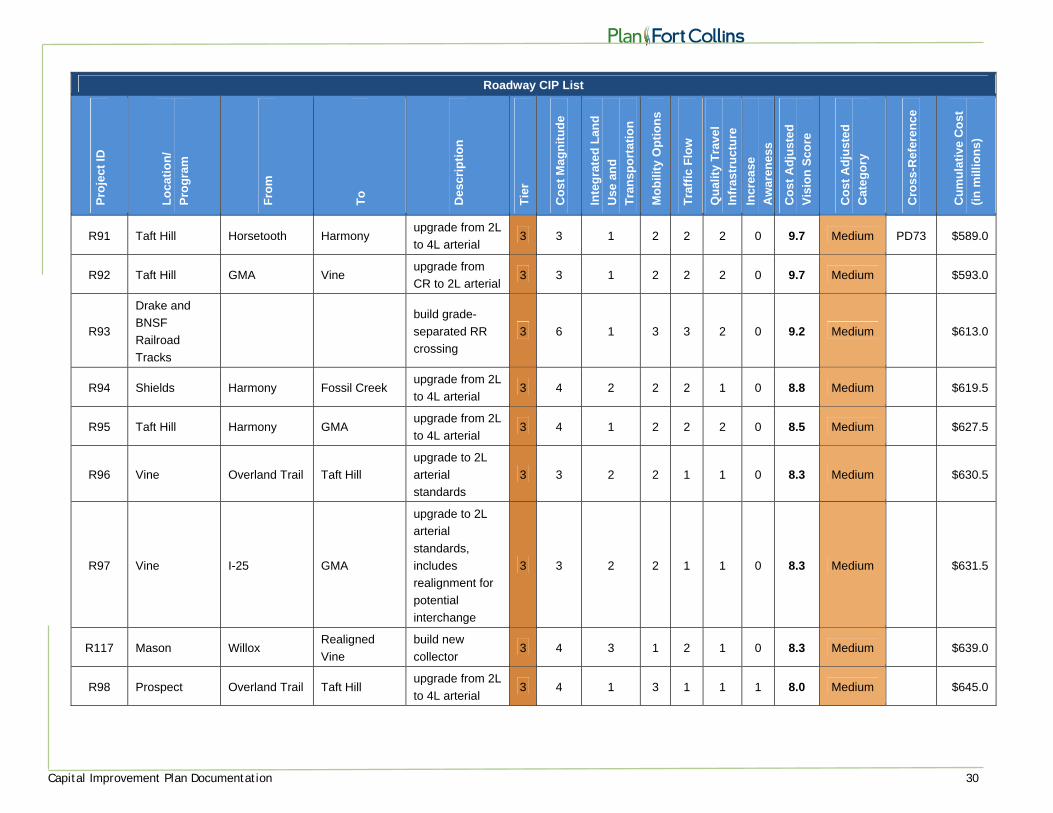
The Cost Adjusted Vision Score column was calculated based on how well the project scored in each of the five vision areas, and the score was adjusted by a factor that reflects the cost magnitude of the project. The Cost Adjusted Category column indicates a priority level of High, Medium, or Low, based on the Cost Adjusted Vision Score. The break point for this classification is different for each project category to allow for differences in the ranking process between categories. The Cumulative Cost column displays a running total of projects in the category rounded to the nearest $500,000. This column is limited by the accuracy of cost estimation of some projects, but it provides an indication of which projects can be funded as well as the total funding needs for each category. Each of the nine project categories are sorted in separate tables based on type and then sorted by tier and Cost Adjusted Vision Score. Only projects of the same tier were ranked against each other. These high level scores do not imply the level of granularity that they may suggest, and a more detailed cost analysis as well as finer-leveled principle-level scoring on projects near the top of the list could result in a more precise ranking. Summary tables (“CIP Lists”) are presented first, and more detailed tables are provided in the Grouped Project Details section. Maps showing the locations of the various projects are provided at the end of the document.
Capital Improvement Plan Documentation 9
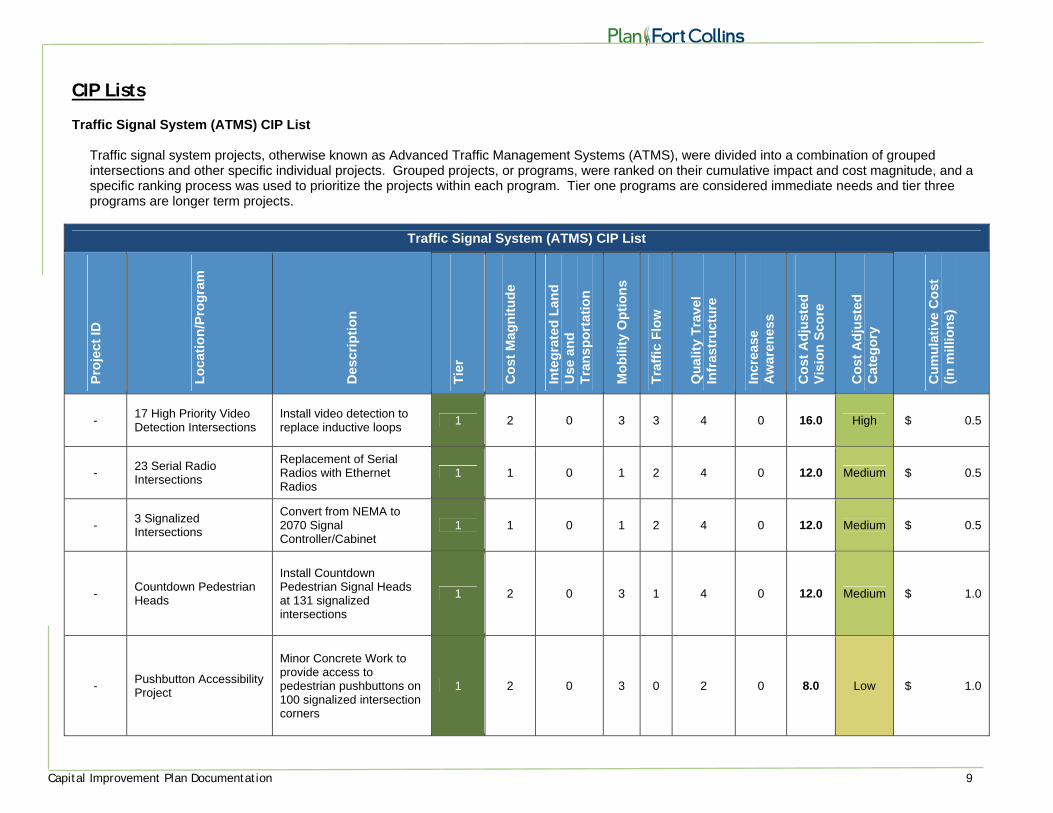
CIP Lists Traffic Signal System (ATMS) CIP List
Traffic signal system projects, otherwise known as Advanced Traffic Management Systems (ATMS), were divided into a combination of grouped intersections and other specific individual projects. Grouped projects, or programs, were ranked on their cumulative impact and cost magnitude, and a specific ranking process was used to prioritize the projects within each program. Tier one programs are considered immediate needs and tier three programs are longer term projects.
Traffic Signal System (ATMS) CIP List
Pro
ject
ID
Lo
cati
on
/Pro
gra
m
Des
crip
tio
n
Tie
r
Co
st M
agn
itu
de
Inte
gra
ted
Lan
d
Use
an
d
Tra
nsp
ort
atio
n
Mo
bili
ty O
pti
on
s
Tra
ffic
Flo
w
Qu
alit
y T
rave
l In
fras
tru
ctu
re
Incr
ease
A
war
enes
s
Co
st A
dju
sted
V
isio
n S
core
Co
st A
dju
sted
C
ateg
ory
Cu
mu
lati
ve C
ost
(i
n m
illio
ns)
- 17 High Priority Video Detection Intersections
Install video detection to replace inductive loops
1 2 0 3 3 4 0 16.0 High $ 0.5
- 23 Serial Radio Intersections
Replacement of Serial Radios with Ethernet Radios
1 1 0 1 2 4 0 12.0 Medium $ 0.5
- 3 Signalized Intersections
Convert from NEMA to 2070 Signal Controller/Cabinet
1 1 0 1 2 4 0 12.0 Medium $ 0.5
- Countdown Pedestrian Heads
Install Countdown Pedestrian Signal Heads at 131 signalized intersections
1 2 0 3 1 4 0 12.0 Medium $ 1.0
- Pushbutton Accessibility Project
Minor Concrete Work to provide access to pedestrian pushbuttons on 100 signalized intersection corners
1 2 0 3 0 2 0 8.0 Low $ 1.0
Capital Improvement Plan Documentation 10
Traffic Signal System (ATMS) CIP List P
roje
ct ID
Lo
cati
on
/Pro
gra
m
Des
crip
tio
n
Tie
r
Co
st M
agn
itu
de
Inte
gra
ted
Lan
d
Use
an
d
Tra
nsp
ort
atio
n
Mo
bili
ty O
pti
on
s
Tra
ffic
Flo
w
Qu
alit
y T
rave
l In
fras
tru
ctu
re
Incr
ease
A
war
enes
s
Co
st A
dju
sted
V
isio
n S
core
Co
st A
dju
sted
C
ateg
ory
Cu
mu
lati
ve C
ost
(i
n m
illio
ns)
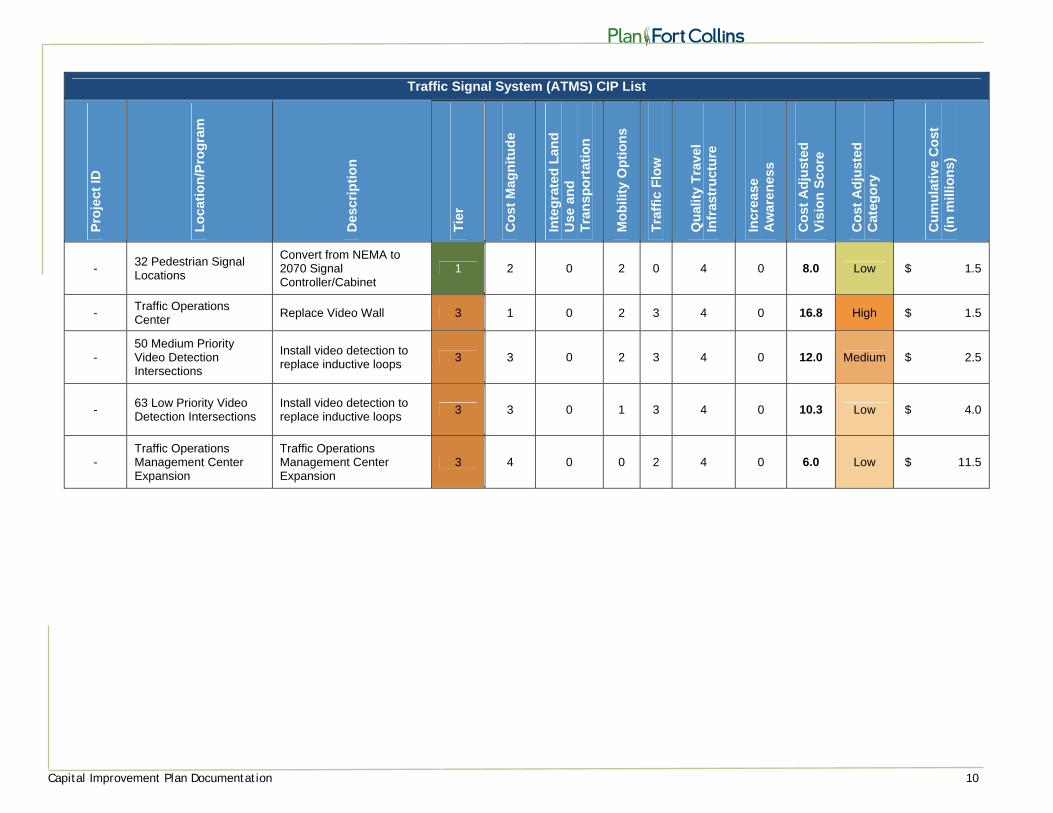
- 32 Pedestrian Signal Locations
Convert from NEMA to 2070 Signal Controller/Cabinet
1 2 0 2 0 4 0 8.0 Low $ 1.5
- Traffic Operations Center
Replace Video Wall 3 1 0 2 3 4 0 16.8 High $ 1.5
- 50 Medium Priority Video Detection Intersections
Install video detection to replace inductive loops
3 3 0 2 3 4 0 12.0 Medium $ 2.5
- 63 Low Priority Video Detection Intersections
Install video detection to replace inductive loops
3 3 0 1 3 4 0 10.3 Low $ 4.0
- Traffic Operations Management Center Expansion
Traffic Operations Management Center Expansion
3 4 0 0 2 4 0 6.0 Low $ 11.5
Capital Improvement Plan Documentation 11
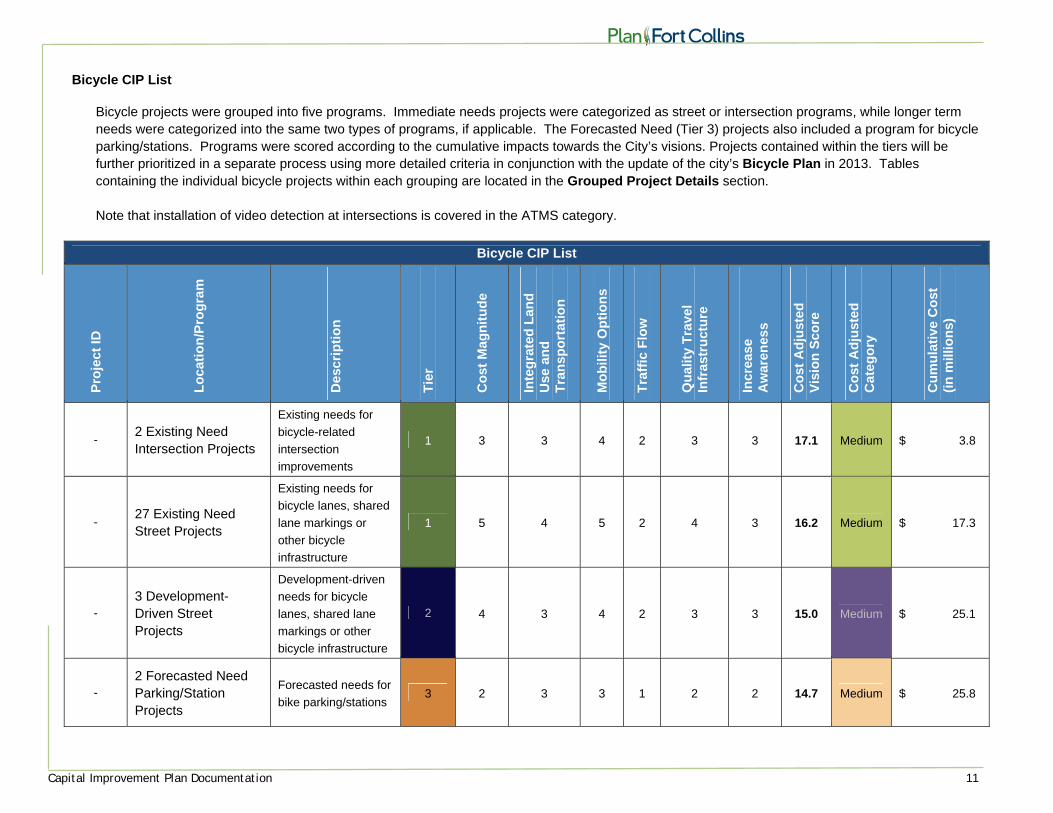
Bicycle CIP List
Bicycle projects were grouped into five programs. Immediate needs projects were categorized as street or intersection programs, while longer term needs were categorized into the same two types of programs, if applicable. The Forecasted Need (Tier 3) projects also included a program for bicycle parking/stations. Programs were scored according to the cumulative impacts towards the City’s visions. Projects contained within the tiers will be further prioritized in a separate process using more detailed criteria in conjunction with the update of the city’s Bicycle Plan in 2013. Tables containing the individual bicycle projects within each grouping are located in the Grouped Project Details section. Note that installation of video detection at intersections is covered in the ATMS category.
Bicycle CIP List
Pro
ject
ID
Lo
cati
on
/Pro
gra
m
Des
crip
tio
n
Tie
r
Co
st M
agn
itu
de
Inte
gra
ted
Lan
d
Use
an
d
Tra
nsp
ort
atio
n
Mo
bili
ty O
pti
on
s
Tra
ffic
Flo
w
Qu
alit
y T
rave
l In
fras
tru
ctu
re
Incr
ease
A
war
enes
s
Co
st A
dju
sted
V
isio
n S
core
Co
st A
dju
sted
C
ateg
ory
Cu
mu
lati
ve C
ost
(i
n m
illio
ns)
- 2 Existing Need Intersection Projects
Existing needs for
bicycle-related
intersection
improvements
1 3 3 4 2 3 3 17.1 Medium $ 3.8
- 27 Existing Need Street Projects
Existing needs for
bicycle lanes, shared
lane markings or
other bicycle
infrastructure
1 5 4 5 2 4 3 16.2 Medium $ 17.3
- 3 Development-Driven Street Projects
Development-driven
needs for bicycle
lanes, shared lane
markings or other
bicycle infrastructure
2 4 3 4 2 3 3 15.0 Medium $ 25.1
- 2 Forecasted Need Parking/Station Projects
Forecasted needs for
bike parking/stations 3 2 3 3 1 2 2 14.7 Medium $ 25.8
Capital Improvement Plan Documentation 12
Bicycle CIP List P
roje
ct ID
Lo
cati
on
/Pro
gra
m
Des
crip
tio
n
Tie
r
Co
st M
agn
itu
de
Inte
gra
ted
Lan
d
Use
an
d
Tra
nsp
ort
atio
n
Mo
bili
ty O
pti
on
s
Tra
ffic
Flo
w
Qu
alit
y T
rave
l In
fras
tru
ctu
re
Incr
ease
A
war
enes
s
Co
st A
dju
sted
V
isio
n S
core
Co
st A
dju
sted
C
ateg
ory
Cu
mu
lati
ve C
ost
(i
n m
illio
ns)
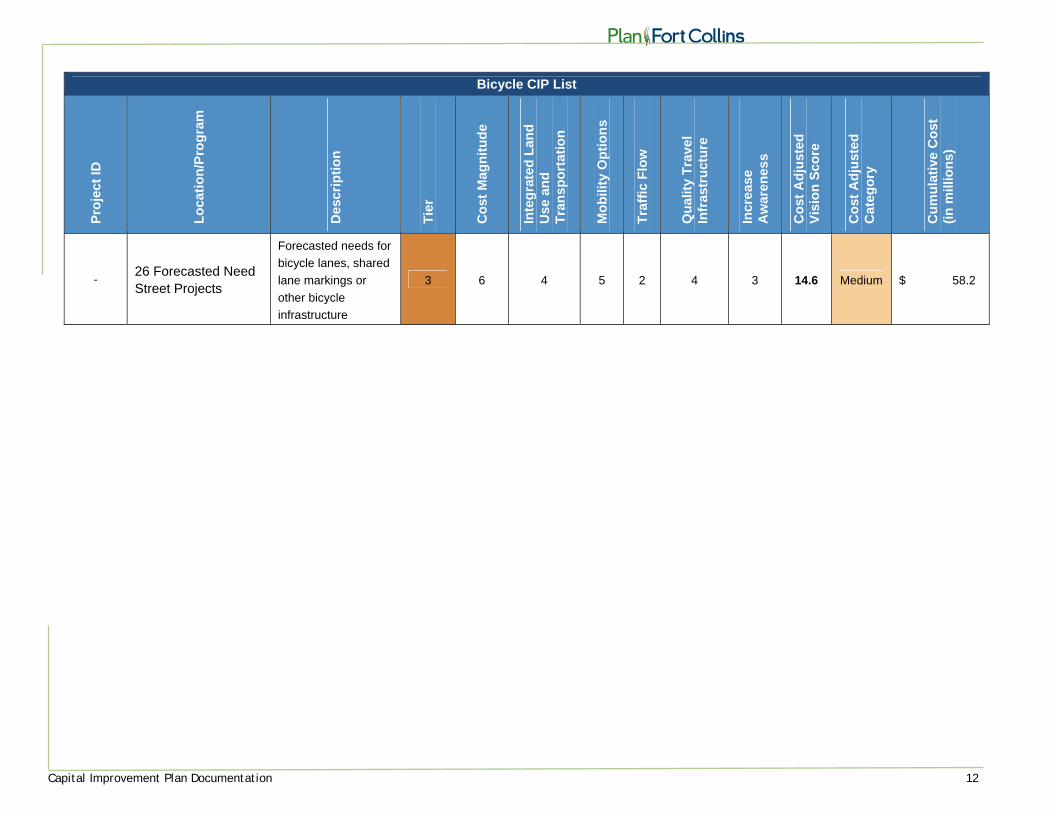
- 26 Forecasted Need Street Projects
Forecasted needs for
bicycle lanes, shared
lane markings or
other bicycle
infrastructure
3 6 4 5 2 4 3 14.6 Medium $ 58.2
Capital Improvement Plan Documentation 13
Bridge CIP List
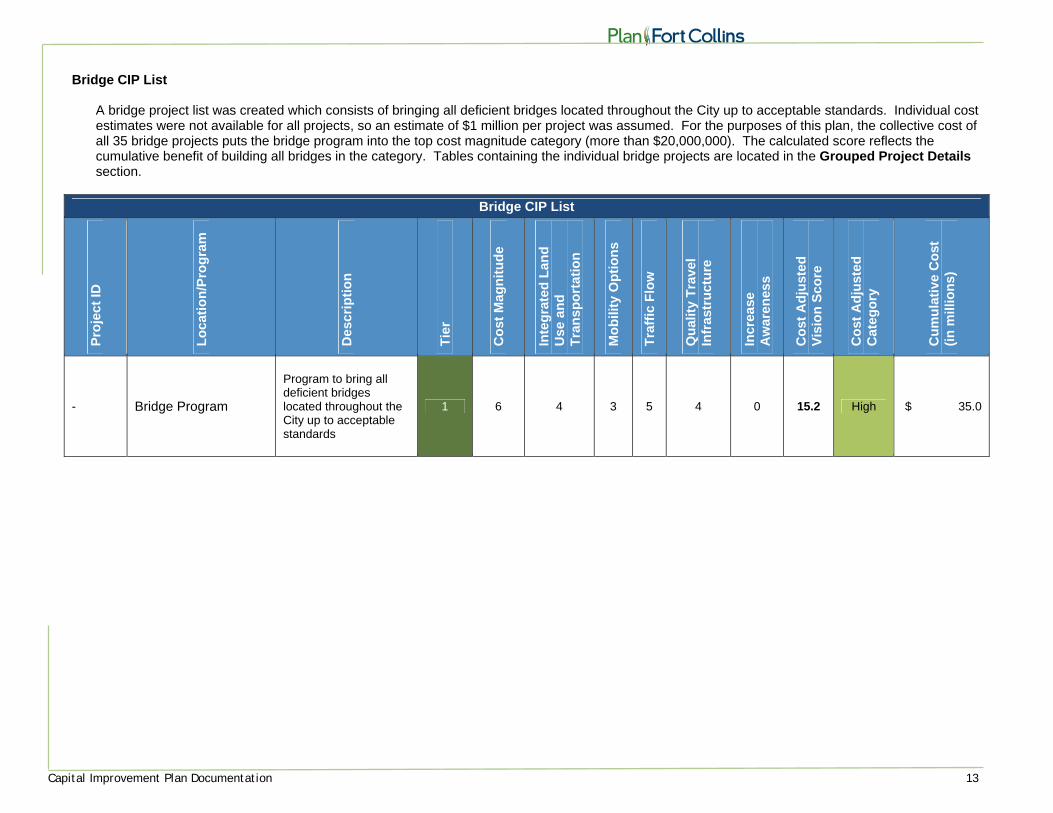
A bridge project list was created which consists of bringing all deficient bridges located throughout the City up to acceptable standards. Individual cost estimates were not available for all projects, so an estimate of $1 million per project was assumed. For the purposes of this plan, the collective cost of all 35 bridge projects puts the bridge program into the top cost magnitude category (more than $20,000,000). The calculated score reflects the cumulative benefit of building all bridges in the category. Tables containing the individual bridge projects are located in the Grouped Project Details section.
Bridge CIP List
Pro
ject
ID
Lo
cati
on
/Pro
gra
m
Des
crip
tio
n
Tie
r
Co
st M
agn
itu
de
Inte
gra
ted
Lan
d
Use
an
d
Tra
nsp
ort
atio
n
Mo
bili
ty O
pti
on
s
Tra
ffic
Flo
w
Qu
alit
y T
rave
l In
fras
tru
ctu
re
Incr
ease
A
war
enes
s
Co
st A
dju
sted
V
isio
n S
core
Co
st A
dju
sted
C
ateg
ory
Cu
mu
lati
ve C
ost
(i
n m
illio
ns)
- Bridge Program
Program to bring all deficient bridges located throughout the City up to acceptable standards
1 6 4 3 5 4 0 15.2 High $ 35.0
Capital Improvement Plan Documentation 14
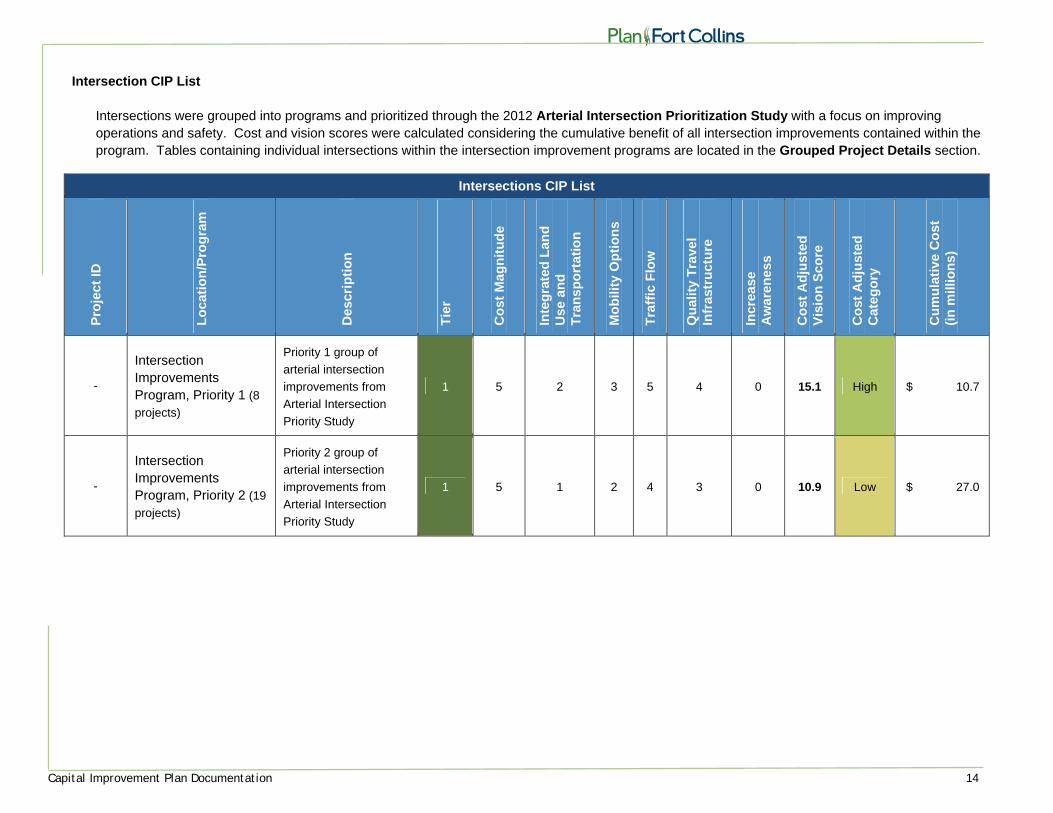
Intersection CIP List Intersections were grouped into programs and prioritized through the 2012 Arterial Intersection Prioritization Study with a focus on improving operations and safety. Cost and vision scores were calculated considering the cumulative benefit of all intersection improvements contained within the program. Tables containing individual intersections within the intersection improvement programs are located in the Grouped Project Details section.
Intersections CIP List
Pro
ject
ID
Lo
cati
on
/Pro
gra
m
Des
crip
tio
n
Tie
r
Co
st M
agn
itu
de
Inte
gra
ted
Lan
d
Use
an
d
Tra
nsp
ort
atio
n
Mo
bili
ty O
pti
on
s
Tra
ffic
Flo
w
Qu
alit
y T
rave
l In
fras
tru
ctu
re
Incr
ease
A
war
enes
s
Co
st A
dju
sted
V
isio
n S
core
Co
st A
dju
sted
C
ateg
ory
Cu
mu
lati
ve C
ost
(i
n m
illio
ns)
-
Intersection Improvements Program, Priority 1 (8
projects)
Priority 1 group of
arterial intersection
improvements from
Arterial Intersection
Priority Study
1 5 2 3 5 4 0 15.1 High $ 10.7
-
Intersection Improvements Program, Priority 2 (19
projects)
Priority 2 group of
arterial intersection
improvements from
Arterial Intersection
Priority Study
1 5 1 2 4 3 0 10.9 Low $ 27.0

Capital Improvement Plan Documentation 15
Parking CIP List
Parking projects were prioritized using parking improvement categories consisting of individual projects grouped according to project need. This list will be updated with the results of the ongoing Parking Plan Update (2012).
Parking CIP Projects
Pro
ject
ID
Lo
cati
on
/Pro
gra
m
Des
crip
tio
n
Tie
r
Co
st M
agn
itu
de
Inte
gra
ted
Lan
d
Use
an
d
Tra
nsp
ort
atio
n
Mo
bili
ty O
pti
on
s
Tra
ffic
Flo
w
Qu
alit
y T
rave
l In
fras
tru
ctu
re
Incr
ease
A
war
enes
s
Co
st A
dju
sted
V
isio
n S
core
Co
st A
dju
sted
C
ateg
ory
Cu
mu
lati
ve C
ost
(i
n m
illio
ns)
PK1 Downtown Parking improvements
1 4 5 2 3 3 1 15.0 Medium $ 8.5
PK2 Downtown Parking improvements
2 4 5 2 3 3 1 15.0 Medium $ 17.0
PK3 Harmony/I-25 Additional park and ride parking spaces
3 3 3 3 3 2 1 15.7 High $ 18.0
PK4 Downtown Parking improvements
3 4 5 2 3 3 1 15.0 Medium $ 26.5
PK5 Downtown Parking improvements
3 4 5 2 3 3 1 15.0 Medium $ 35.0
PK6 Downtown Parking improvements
3 4 5 2 3 3 1 15.0 Medium $ 43.5
PK7 Downtown Parking improvements
3 4 5 2 3 3 1 15.0 Medium $ 52.0
PK8 Mulberry/I-25 New park and ride facility
3 3 2 3 3 2 1 14.6 Medium $ 53.0
Capital Improvement Plan Documentation 16
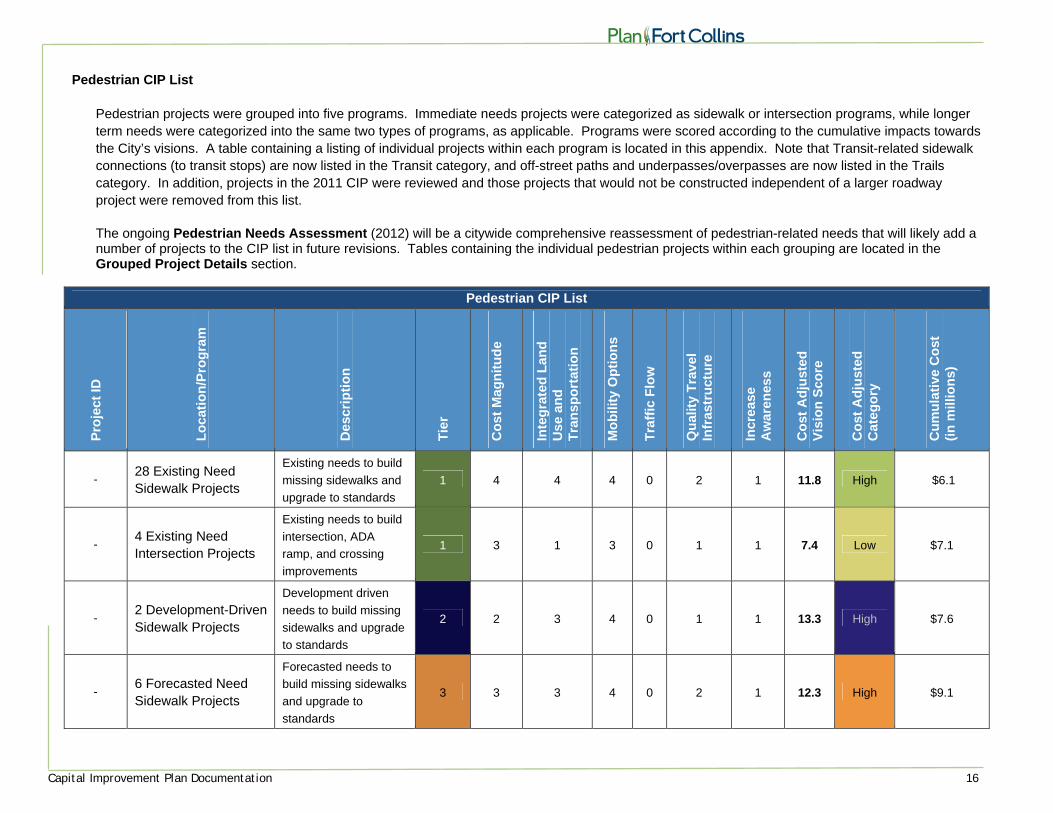
Pedestrian CIP List Pedestrian projects were grouped into five programs. Immediate needs projects were categorized as sidewalk or intersection programs, while longer term needs were categorized into the same two types of programs, as applicable. Programs were scored according to the cumulative impacts towards the City’s visions. A table containing a listing of individual projects within each program is located in this appendix. Note that Transit-related sidewalk connections (to transit stops) are now listed in the Transit category, and off-street paths and underpasses/overpasses are now listed in the Trails category. In addition, projects in the 2011 CIP were reviewed and those projects that would not be constructed independent of a larger roadway project were removed from this list.
The ongoing Pedestrian Needs Assessment (2012) will be a citywide comprehensive reassessment of pedestrian-related needs that will likely add a number of projects to the CIP list in future revisions. Tables containing the individual pedestrian projects within each grouping are located in the Grouped Project Details section.
Pedestrian CIP List
Pro
ject
ID
Lo
cati
on
/Pro
gra
m
Des
crip
tio
n
Tie
r
Co
st M
agn
itu
de
Inte
gra
ted
Lan
d
Use
an
d
Tra
nsp
ort
atio
n
Mo
bili
ty O
pti
on
s
Tra
ffic
Flo
w
Qu
alit
y T
rave
l In
fras
tru
ctu
re
Incr
ease
A
war
enes
s
Co
st A
dju
sted
V
isio
n S
core
Co
st A
dju
sted
C
ateg
ory
Cu
mu
lati
ve C
ost
(i
n m
illio
ns)
- 28 Existing Need Sidewalk Projects
Existing needs to build
missing sidewalks and
upgrade to standards
1 4 4 4 0 2 1 11.8 High $6.1
- 4 Existing Need Intersection Projects
Existing needs to build
intersection, ADA
ramp, and crossing
improvements
1 3 1 3 0 1 1 7.4 Low $7.1
- 2 Development-Driven Sidewalk Projects
Development driven
needs to build missing
sidewalks and upgrade
to standards
2 2 3 4 0 1 1 13.3 High $7.6
- 6 Forecasted Need Sidewalk Projects
Forecasted needs to
build missing sidewalks
and upgrade to
standards
3 3 3 4 0 2 1 12.3 High $9.1
Capital Improvement Plan Documentation 17
Pedestrian CIP List P
roje
ct ID
Lo
cati
on
/Pro
gra
m
Des
crip
tio
n
Tie
r
Co
st M
agn
itu
de
Inte
gra
ted
Lan
d
Use
an
d
Tra
nsp
ort
atio
n
Mo
bili
ty O
pti
on
s
Tra
ffic
Flo
w
Qu
alit
y T
rave
l In
fras
tru
ctu
re
Incr
ease
A
war
enes
s
Co
st A
dju
sted
V
isio
n S
core
Co
st A
dju
sted
C
ateg
ory
Cu
mu
lati
ve C
ost
(i
n m
illio
ns)
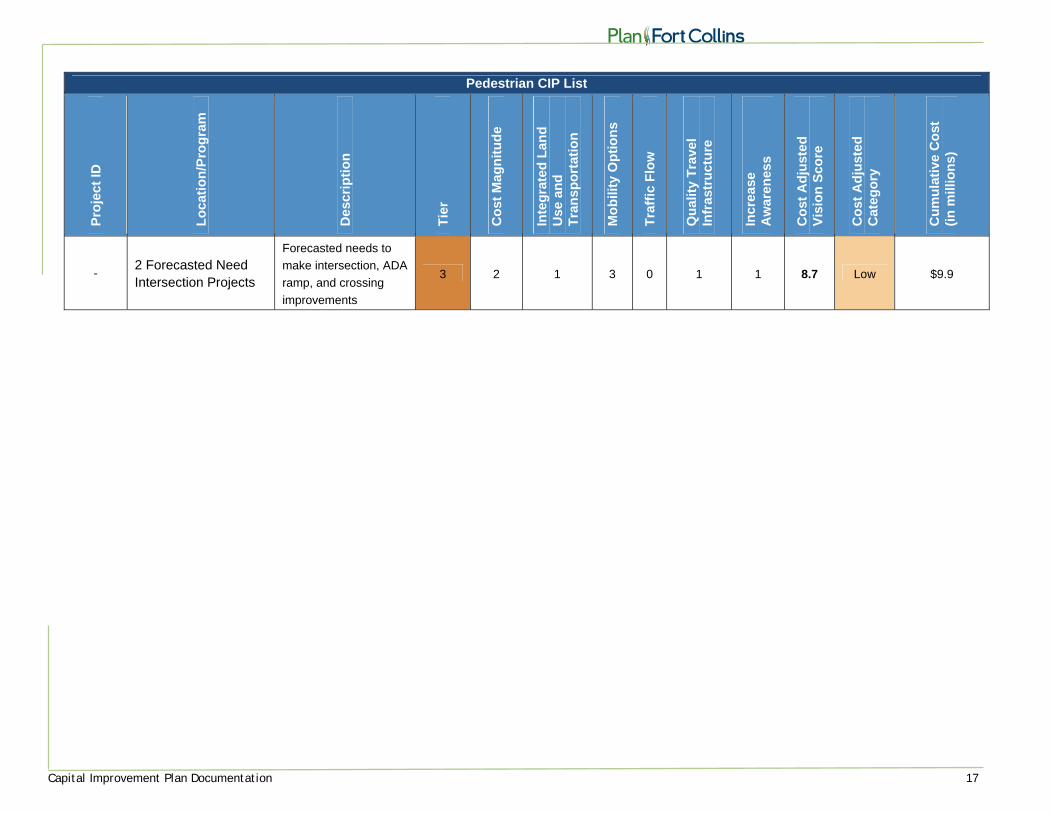
- 2 Forecasted Need Intersection Projects
Forecasted needs to
make intersection, ADA
ramp, and crossing
improvements
3 2 1 3 0 1 1 8.7 Low $9.9
Capital Improvement Plan Documentation 18
Railroad CIP List
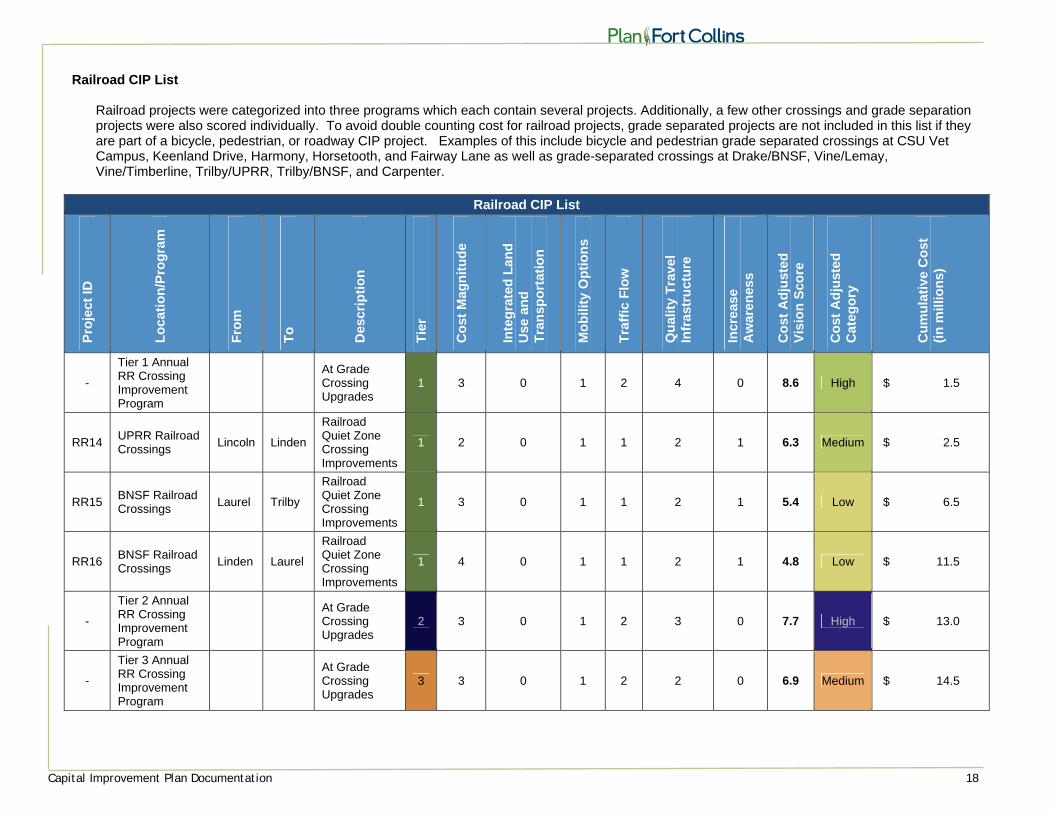
Railroad projects were categorized into three programs which each contain several projects. Additionally, a few other crossings and grade separation projects were also scored individually. To avoid double counting cost for railroad projects, grade separated projects are not included in this list if they are part of a bicycle, pedestrian, or roadway CIP project. Examples of this include bicycle and pedestrian grade separated crossings at CSU Vet Campus, Keenland Drive, Harmony, Horsetooth, and Fairway Lane as well as grade-separated crossings at Drake/BNSF, Vine/Lemay, Vine/Timberline, Trilby/UPRR, Trilby/BNSF, and Carpenter.
Railroad CIP List
Pro
ject
ID
Lo
cati
on
/Pro
gra
m
Fro
m
To
Des
crip
tio
n
Tie
r
Co
st M
agn
itu
de
Inte
gra
ted
Lan
d
Use
an
d
Tra
nsp
ort
atio
n
Mo
bili
ty O
pti
on
s
Tra
ffic
Flo
w
Qu
alit
y T
rave
l In
fras
tru
ctu
re
Incr
ease
A
war
enes
s
Co
st A
dju
sted
V
isio
n S
core
Co
st A
dju
sted
C
ateg
ory
Cu
mu
lati
ve C
ost
(i
n m
illio
ns)
-
Tier 1 Annual RR Crossing Improvement Program
At Grade Crossing Upgrades
1 3 0 1 2 4 0 8.6 High $ 1.5
RR14 UPRR Railroad Crossings
Lincoln Linden
Railroad Quiet Zone Crossing Improvements
1 2 0 1 1 2 1 6.3 Medium $ 2.5
RR15 BNSF Railroad Crossings
Laurel Trilby
Railroad Quiet Zone Crossing Improvements
1 3 0 1 1 2 1 5.4 Low $ 6.5
RR16 BNSF Railroad Crossings
Linden Laurel
Railroad Quiet Zone Crossing Improvements
1 4 0 1 1 2 1 4.8 Low $ 11.5
-
Tier 2 Annual RR Crossing Improvement Program
At Grade Crossing Upgrades
2 3 0 1 2 3 0 7.7 High $ 13.0
-
Tier 3 Annual RR Crossing Improvement Program
At Grade Crossing Upgrades
3 3 0 1 2 2 0 6.9 Medium $ 14.5
Capital Improvement Plan Documentation 19
Railroad CIP List P
roje
ct ID
Lo
cati
on
/Pro
gra
m
Fro
m
To
Des
crip
tio
n
Tie
r
Co
st M
agn
itu
de
Inte
gra
ted
Lan
d
Use
an
d
Tra
nsp
ort
atio
n
Mo
bili
ty O
pti
on
s
Tra
ffic
Flo
w
Qu
alit
y T
rave
l In
fras
tru
ctu
re
Incr
ease
A
war
enes
s
Co
st A
dju
sted
V
isio
n S
core
Co
st A
dju
sted
C
ateg
ory
Cu
mu
lati
ve C
ost
(i
n m
illio
ns)
RR19 Sharpe Point Drive
GNRR RR crossing 3 4 0 0 2 1 0 3.8 Low $ 22.0
RR20 Greenfield Ct. RR spur
RR grade separation
3 4 0 0 2 1 0 3.8 Low $ 29.5
Capital Improvement Plan Documentation 20
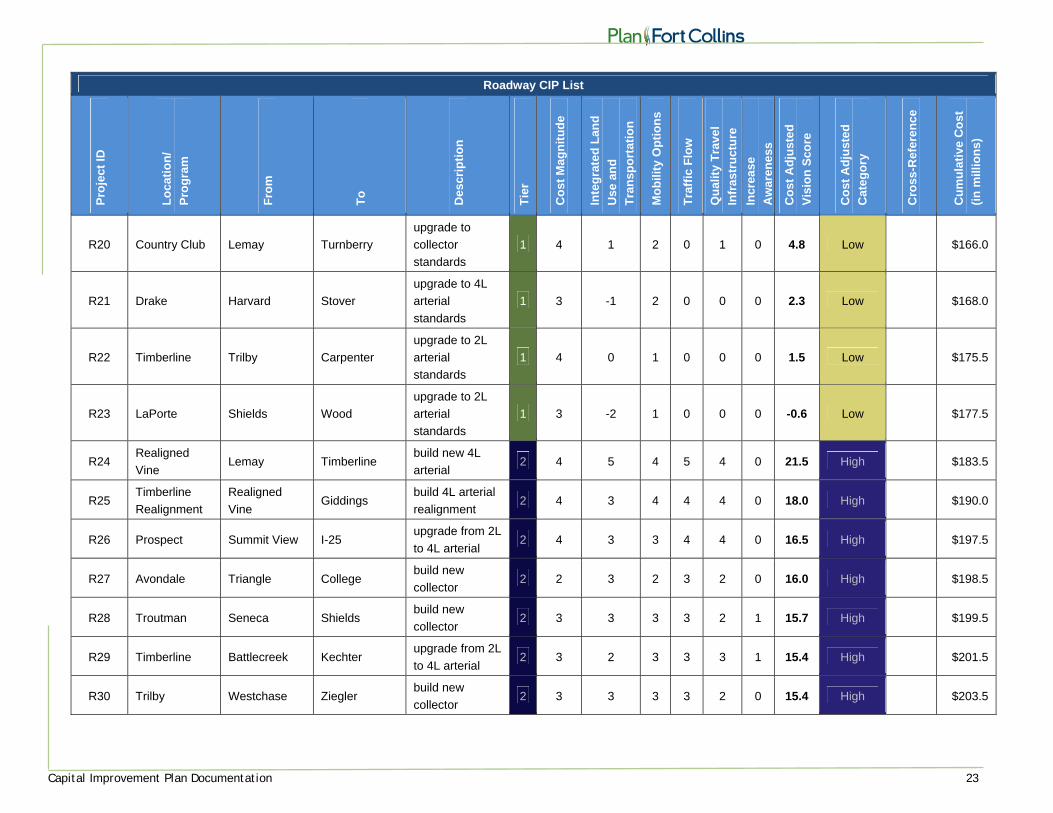
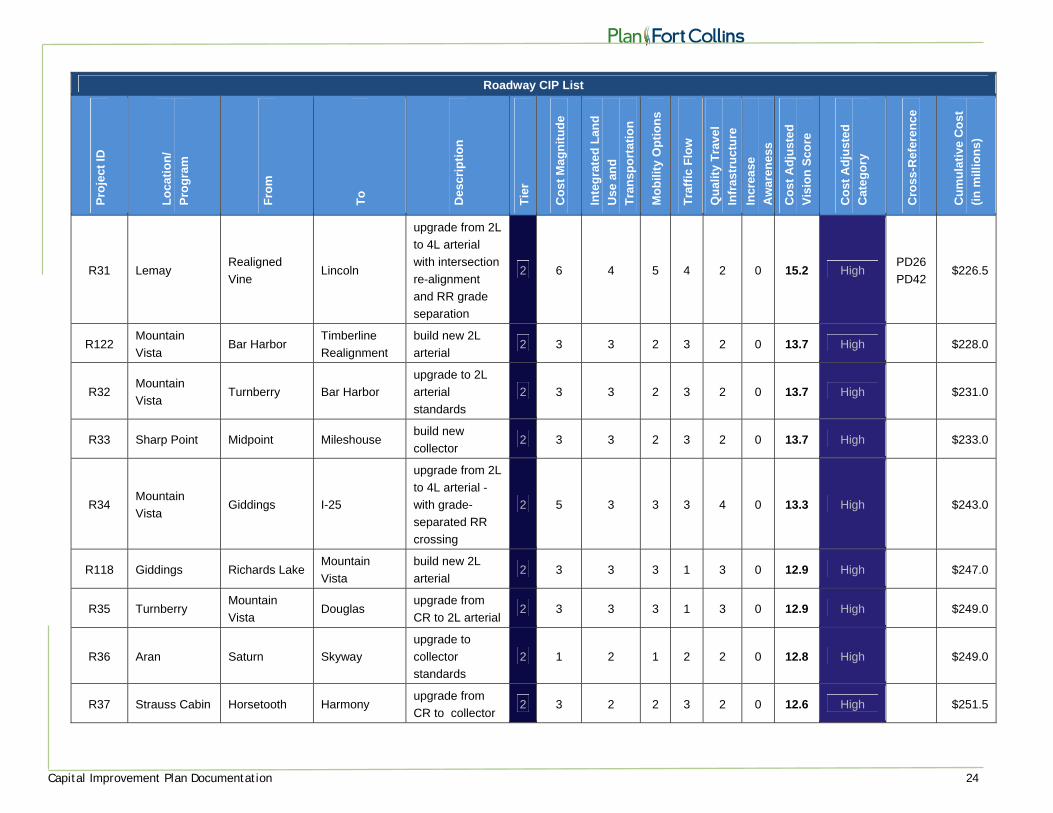
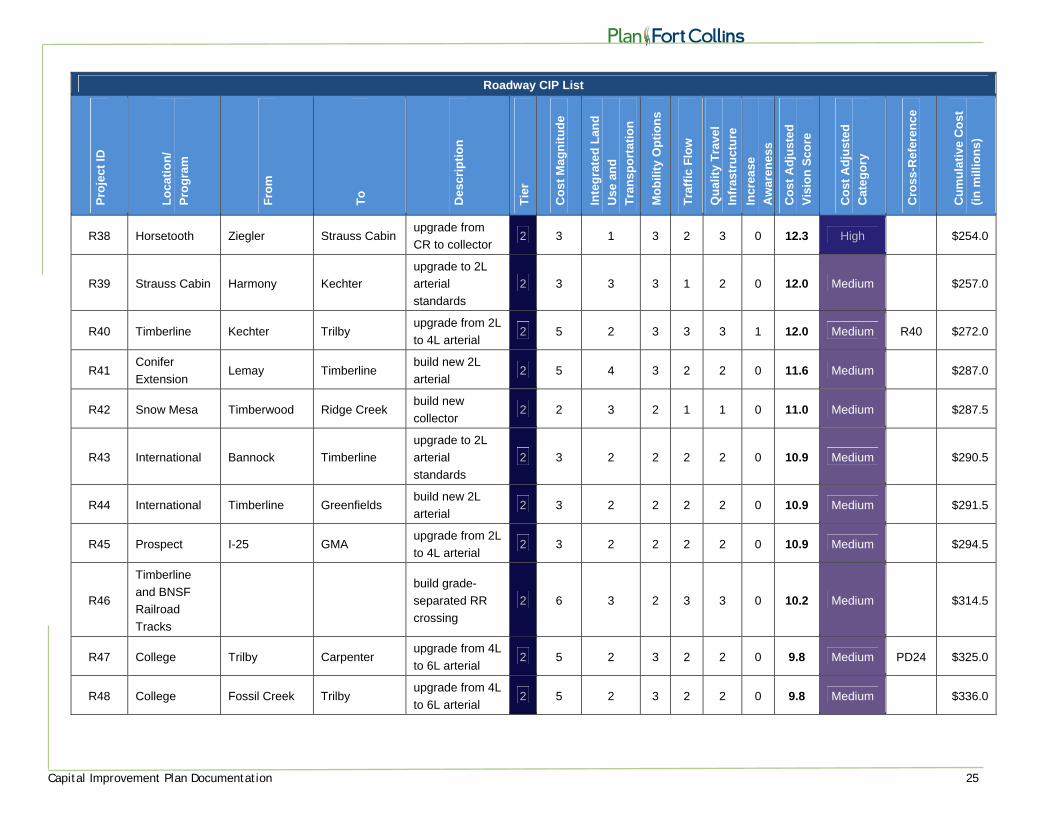
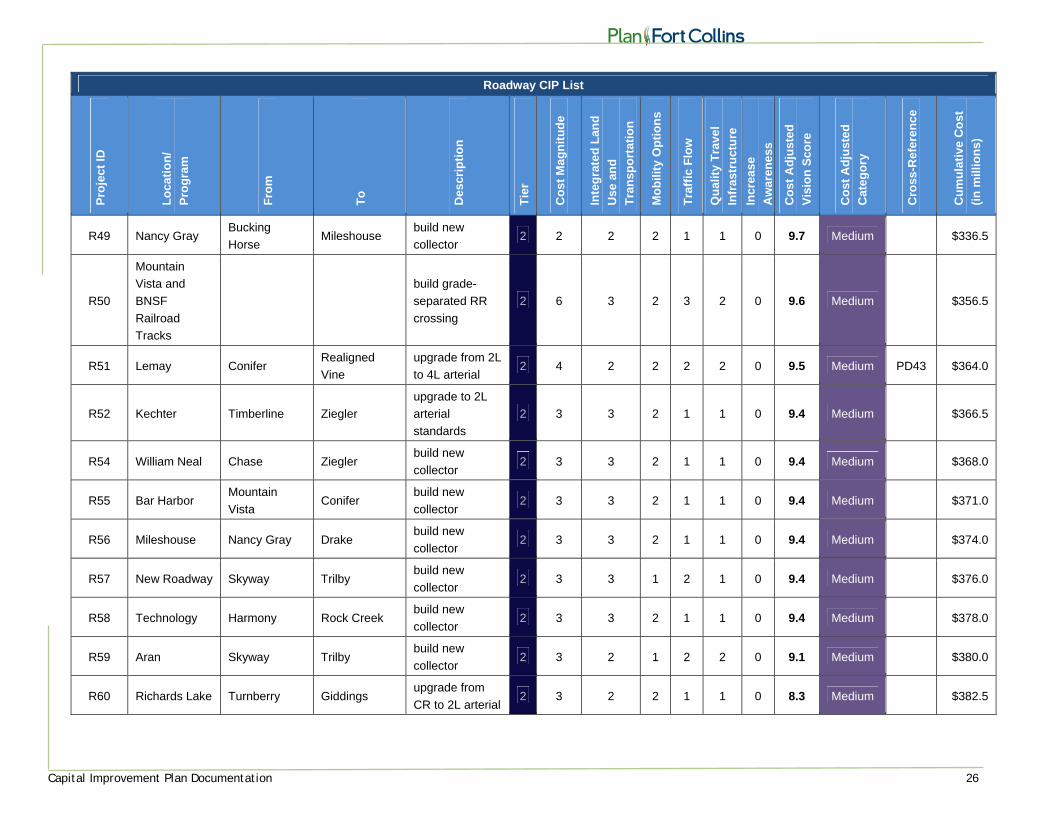
Roadway/Complete Street CIP List
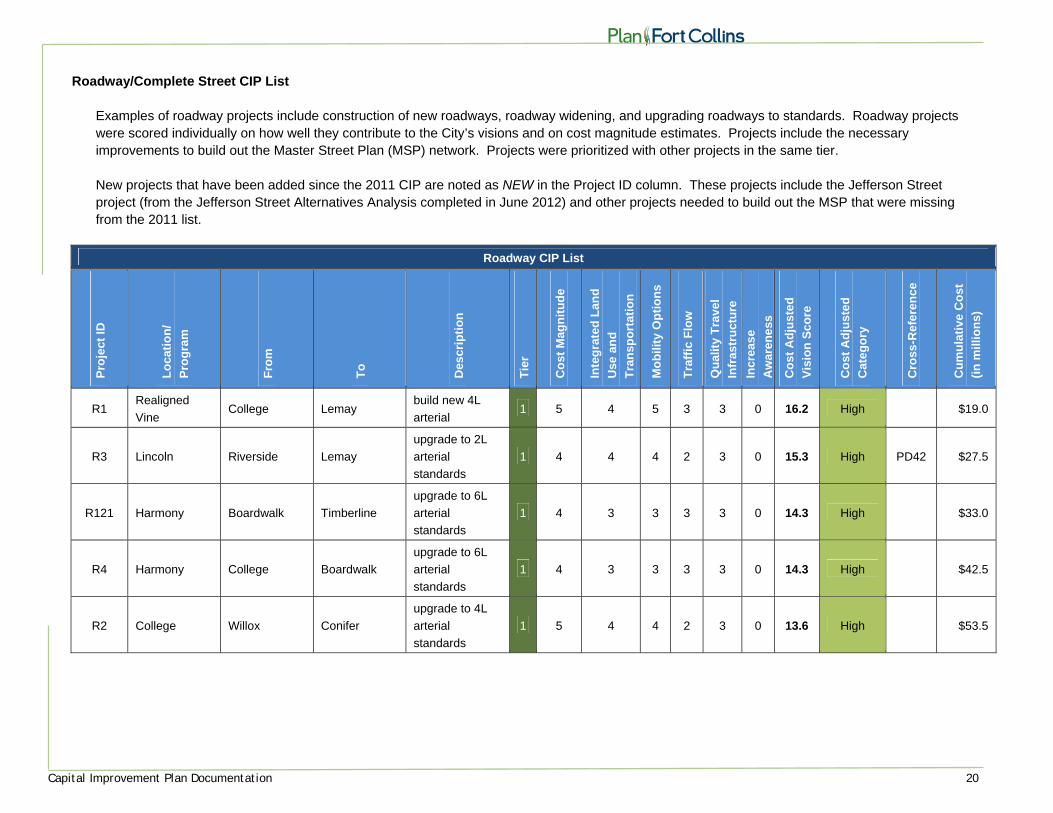
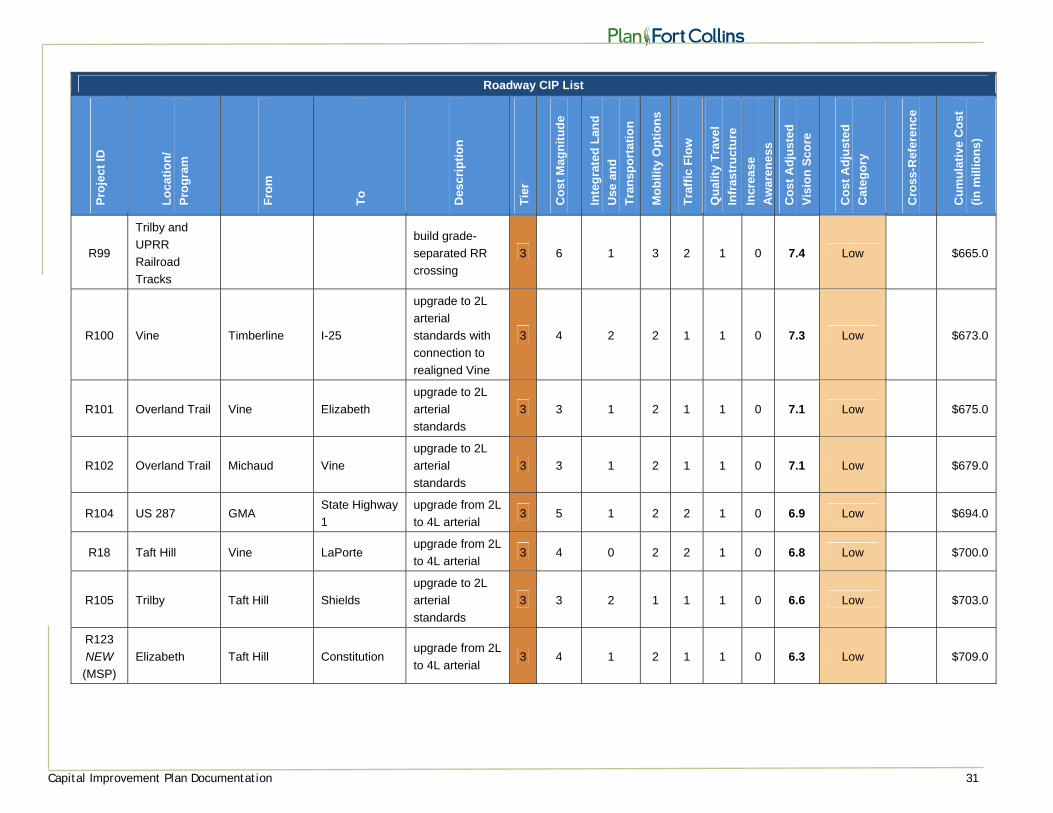
Examples of roadway projects include construction of new roadways, roadway widening, and upgrading roadways to standards. Roadway projects were scored individually on how well they contribute to the City’s visions and on cost magnitude estimates. Projects include the necessary improvements to build out the Master Street Plan (MSP) network. Projects were prioritized with other projects in the same tier. New projects that have been added since the 2011 CIP are noted as NEW in the Project ID column. These projects include the Jefferson Street project (from the Jefferson Street Alternatives Analysis completed in June 2012) and other projects needed to build out the MSP that were missing from the 2011 list.
Roadway CIP List
Pro
ject
ID
Lo
cati
on
/
Pro
gra
m
Fro
m
To
Des
crip
tio
n
Tie
r
Co
st M
agn
itu
de
Inte
gra
ted
Lan
d
Use
an
d
Tra
nsp
ort
atio
n
Mo
bili
ty O
pti
on
s
Tra
ffic
Flo
w
Qu
alit
y T
rave
l
Infr
astr
uct
ure
Incr
eas
e
Aw
aren
ess
Co
st A
dju
sted
Vis
ion
Sco
re
Co
st A
dju
sted
Cat
ego
ry
Cro
ss-R
efe
ren
ce
Cu
mu
lati
ve C
ost
(in
mill
ion
s)
R1 Realigned
Vine College Lemay
build new 4L
arterial 1 5 4 5 3 3 0 16.2 High $19.0
R3 Lincoln Riverside Lemay
upgrade to 2L
arterial
standards
1 4 4 4 2 3 0 15.3 High PD42 $27.5
R121 Harmony Boardwalk Timberline
upgrade to 6L
arterial
standards
1 4 3 3 3 3 0 14.3 High $33.0
R4 Harmony College Boardwalk
upgrade to 6L
arterial
standards
1 4 3 3 3 3 0 14.3 High $42.5
R2 College Willox Conifer
upgrade to 4L
arterial
standards
1 5 4 4 2 3 0 13.6 High $53.5
Capital Improvement Plan Documentation 21
Roadway CIP List P
roje
ct ID
Lo
cati
on
/
Pro
gra
m
Fro
m
To
Des
crip
tio
n
Tie
r
Co
st M
agn
itu
de
Inte
gra
ted
Lan
d
Use
an
d
Tra
nsp
ort
atio
n
Mo
bili
ty O
pti
on
s
Tra
ffic
Flo
w
Qu
alit
y T
rave
l
Infr
astr
uct
ure
Incr
eas
e
Aw
aren
ess
Co
st A
dju
sted
Vis
ion
Sco
re
Co
st A
dju
sted
Cat
ego
ry
Cro
ss-R
efe
ren
ce
Cu
mu
lati
ve C
ost
(in
mill
ion
s)
R9 Willow College Lincoln
upgrade to
collector
(Downtown
River District)
standards
1 3 5 4 -1 3 0 13.4 High $55.5
R125
NEW (AA)
Jefferson College Lincoln/
Mountain
upgrade to 3L
section with
Jefferson/
Riverside/
Lincoln/
Mountain
intersection
improvements
1 4 5 4 0 3 0 13.3 High $63.0
R5 LaPorte Impala Taft Hill
upgrade to 2L
arterial
standards
1 3 2 3 2 2 1 12.9 High $65.0
R117 Linden Vine Poudre River
upgrade to
collector
standards
1 3 4 3 0 3 0 12.3 High $67.0
R10
Lemay and
BNSF
Railroad
Tracks
build grade-
separated RR
crossing
1 6 2 2 4 4 0 11.2 Medium $87.0
R7 Trilby Lemay Timberline
upgrade from 2L
to 4L arterial -
with grade-
separated RR
crossing
1 5 1 3 2 2 0 11.1 Medium $104.5

Capital Improvement Plan Documentation 22
Roadway CIP List P
roje
ct ID
Lo
cati
on
/
Pro
gra
m
Fro
m
To
Des
crip
tio
n
Tie
r
Co
st M
agn
itu
de
Inte
gra
ted
Lan
d
Use
an
d
Tra
nsp
ort
atio
n
Mo
bili
ty O
pti
on
s
Tra
ffic
Flo
w
Qu
alit
y T
rave
l
Infr
astr
uct
ure
Incr
eas
e
Aw
aren
ess
Co
st A
dju
sted
Vis
ion
Sco
re
Co
st A
dju
sted
Cat
ego
ry
Cro
ss-R
efe
ren
ce
Cu
mu
lati
ve C
ost
(in
mill
ion
s)
R11 Elizabeth Overland Taft Hill
upgrade to 2L
arterial
standards
1 4 3 3 1 2 0 10.5 Medium $112.0
R6 LaPorte GMA Impala upgrade from
CR to 2L arterial 1 5 2 3 2 2 1 10.0 Medium $122.0
R12 LaPorte Taft Hill Shields
upgrade to 2L
arterial
standards
1 5 2 3 2 2 0 9.8 Medium $137.0
R13 Buckingham Linden Lemay
upgrade to
collector
standards
1 3 3 3 0 1 0 9.4 Medium $139.0
R14 Prospect College Lemay
upgrade to 4L
arterial
standards
1 4 -2 4 2 3 0 9.3 Medium $147.0
R15 Vine Taft Hill Shields
upgrade to 2L
arterial
standards
1 3 1 3 1 1 0 8.9 Medium $151.0
R16 Trilby College Lemay upgrade from 2L
to 4L arterial 1 3 0 3 1 1 0 7.7 Low $155.0
R17 Shields Vine LaPorte
upgrade to 2L
arterial
standards
1 3 -1 2 2 1 0 6.6 Low $158.0
R19 Country Club State Highway
1 Lemay
upgrade to
collector
standards
1 3 1 2 0 1 0 5.4 Low $161.0
Capital Improvement Plan Documentation 23
Roadway CIP List P
roje
ct ID
Lo
cati
on
/
Pro
gra
m
Fro
m
To
Des
crip
tio
n
Tie
r
Co
st M
agn
itu
de
Inte
gra
ted
Lan
d
Use
an
d
Tra
nsp
ort
atio
n
Mo
bili
ty O
pti
on
s
Tra
ffic
Flo
w
Qu
alit
y T
rave
l
Infr
astr
uct
ure
Incr
eas
e
Aw
aren
ess
Co
st A
dju
sted
Vis
ion
Sco
re
Co
st A
dju
sted
Cat
ego
ry
Cro
ss-R
efe
ren
ce
Cu
mu
lati
ve C
ost
(in
mill
ion
s)
R20 Country Club Lemay Turnberry
upgrade to
collector
standards
1 4 1 2 0 1 0 4.8 Low $166.0
R21 Drake Harvard Stover
upgrade to 4L
arterial
standards
1 3 -1 2 0 0 0 2.3 Low $168.0
R22 Timberline Trilby Carpenter
upgrade to 2L
arterial
standards
1 4 0 1 0 0 0 1.5 Low $175.5
R23 LaPorte Shields Wood
upgrade to 2L
arterial
standards
1 3 -2 1 0 0 0 -0.6 Low $177.5
R24 Realigned
Vine Lemay Timberline
build new 4L
arterial 2 4 5 4 5 4 0 21.5 High $183.5
R25 Timberline
Realignment
Realigned
Vine Giddings
build 4L arterial
realignment 2 4 3 4 4 4 0 18.0 High $190.0
R26 Prospect Summit View I-25 upgrade from 2L
to 4L arterial 2 4 3 3 4 4 0 16.5 High $197.5
R27 Avondale Triangle College build new
collector 2 2 3 2 3 2 0 16.0 High $198.5
R28 Troutman Seneca Shields build new
collector 2 3 3 3 3 2 1 15.7 High $199.5
R29 Timberline Battlecreek Kechter upgrade from 2L
to 4L arterial 2 3 2 3 3 3 1 15.4 High $201.5
R30 Trilby Westchase Ziegler build new
collector 2 3 3 3 3 2 0 15.4 High $203.5
Capital Improvement Plan Documentation 24
Roadway CIP List P
roje
ct ID
Lo
cati
on
/
Pro
gra
m
Fro
m
To
Des
crip
tio
n
Tie
r
Co
st M
agn
itu
de
Inte
gra
ted
Lan
d
Use
an
d
Tra
nsp
ort
atio
n
Mo
bili
ty O
pti
on
s
Tra
ffic
Flo
w
Qu
alit
y T
rave
l
Infr
astr
uct
ure
Incr
eas
e
Aw
aren
ess
Co
st A
dju
sted
Vis
ion
Sco
re
Co
st A
dju
sted
Cat
ego
ry
Cro
ss-R
efe
ren
ce
Cu
mu
lati
ve C
ost
(in
mill
ion
s)
R31 Lemay Realigned
Vine Lincoln
upgrade from 2L
to 4L arterial
with intersection
re-alignment
and RR grade
separation
2 6 4 5 4 2 0 15.2 High PD26
PD42 $226.5
R122 Mountain
Vista Bar Harbor
Timberline
Realignment
build new 2L
arterial 2 3 3 2 3 2 0 13.7 High $228.0
R32 Mountain
Vista Turnberry Bar Harbor
upgrade to 2L
arterial
standards
2 3 3 2 3 2 0 13.7 High $231.0
R33 Sharp Point Midpoint Mileshouse build new
collector 2 3 3 2 3 2 0 13.7 High $233.0
R34 Mountain
Vista Giddings I-25
upgrade from 2L
to 4L arterial -
with grade-
separated RR
crossing
2 5 3 3 3 4 0 13.3 High $243.0
R118 Giddings Richards Lake Mountain
Vista
build new 2L
arterial 2 3 3 3 1 3 0 12.9 High $247.0
R35 Turnberry Mountain
Vista Douglas
upgrade from
CR to 2L arterial 2 3 3 3 1 3 0 12.9 High $249.0
R36 Aran Saturn Skyway
upgrade to
collector
standards
2 1 2 1 2 2 0 12.8 High $249.0
R37 Strauss Cabin Horsetooth Harmony upgrade from
CR to collector 2 3 2 2 3 2 0 12.6 High $251.5
Capital Improvement Plan Documentation 25
Roadway CIP List P
roje
ct ID
Lo
cati
on
/
Pro
gra
m
Fro
m
To
Des
crip
tio
n
Tie
r
Co
st M
agn
itu
de
Inte
gra
ted
Lan
d
Use
an
d
Tra
nsp
ort
atio
n
Mo
bili
ty O
pti
on
s
Tra
ffic
Flo
w
Qu
alit
y T
rave
l
Infr
astr
uct
ure
Incr
eas
e
Aw
aren
ess
Co
st A
dju
sted
Vis
ion
Sco
re
Co
st A
dju
sted
Cat
ego
ry
Cro
ss-R
efe
ren
ce
Cu
mu
lati
ve C
ost
(in
mill
ion
s)
R38 Horsetooth Ziegler Strauss Cabin upgrade from
CR to collector 2 3 1 3 2 3 0 12.3 High $254.0
R39 Strauss Cabin Harmony Kechter
upgrade to 2L
arterial
standards
2 3 3 3 1 2 0 12.0 Medium $257.0
R40 Timberline Kechter Trilby upgrade from 2L
to 4L arterial 2 5 2 3 3 3 1 12.0 Medium R40 $272.0
R41 Conifer
Extension Lemay Timberline
build new 2L
arterial 2 5 4 3 2 2 0 11.6 Medium $287.0
R42 Snow Mesa Timberwood Ridge Creek build new
collector 2 2 3 2 1 1 0 11.0 Medium $287.5
R43 International Bannock Timberline
upgrade to 2L
arterial
standards
2 3 2 2 2 2 0 10.9 Medium $290.5
R44 International Timberline Greenfields build new 2L
arterial 2 3 2 2 2 2 0 10.9 Medium $291.5
R45 Prospect I-25 GMA upgrade from 2L
to 4L arterial 2 3 2 2 2 2 0 10.9 Medium $294.5
R46
Timberline
and BNSF
Railroad
Tracks
build grade-
separated RR
crossing
2 6 3 2 3 3 0 10.2 Medium $314.5
R47 College Trilby Carpenter upgrade from 4L
to 6L arterial 2 5 2 3 2 2 0 9.8 Medium PD24 $325.0
R48 College Fossil Creek Trilby upgrade from 4L
to 6L arterial 2 5 2 3 2 2 0 9.8 Medium $336.0
Capital Improvement Plan Documentation 26
Roadway CIP List P
roje
ct ID
Lo
cati
on
/
Pro
gra
m
Fro
m
To
Des
crip
tio
n
Tie
r
Co
st M
agn
itu
de
Inte
gra
ted
Lan
d
Use
an
d
Tra
nsp
ort
atio
n
Mo
bili
ty O
pti
on
s
Tra
ffic
Flo
w
Qu
alit
y T
rave
l
Infr
astr
uct
ure
Incr
eas
e
Aw
aren
ess
Co
st A
dju
sted
Vis
ion
Sco
re
Co
st A
dju
sted
Cat
ego
ry
Cro
ss-R
efe
ren
ce
Cu
mu
lati
ve C
ost
(in
mill
ion
s)
R49 Nancy Gray Bucking
Horse Mileshouse
build new
collector 2 2 2 2 1 1 0 9.7 Medium $336.5
R50
Mountain
Vista and
BNSF
Railroad
Tracks
build grade-
separated RR
crossing
2 6 3 2 3 2 0 9.6 Medium $356.5
R51 Lemay Conifer Realigned
Vine
upgrade from 2L
to 4L arterial 2 4 2 2 2 2 0 9.5 Medium PD43 $364.0
R52 Kechter Timberline Ziegler
upgrade to 2L
arterial
standards
2 3 3 2 1 1 0 9.4 Medium $366.5
R54 William Neal Chase Ziegler build new
collector 2 3 3 2 1 1 0 9.4 Medium $368.0
R55 Bar Harbor Mountain
Vista Conifer
build new
collector 2 3 3 2 1 1 0 9.4 Medium $371.0
R56 Mileshouse Nancy Gray Drake build new
collector 2 3 3 2 1 1 0 9.4 Medium $374.0
R57 New Roadway Skyway Trilby build new
collector 2 3 3 1 2 1 0 9.4 Medium $376.0
R58 Technology Harmony Rock Creek build new
collector 2 3 3 2 1 1 0 9.4 Medium $378.0
R59 Aran Skyway Trilby build new
collector 2 3 2 1 2 2 0 9.1 Medium $380.0
R60 Richards Lake Turnberry Giddings upgrade from
CR to 2L arterial 2 3 2 2 1 1 0 8.3 Medium $382.5
Capital Improvement Plan Documentation 27
Roadway CIP List P
roje
ct ID
Lo
cati
on
/
Pro
gra
m
Fro
m
To
Des
crip
tio
n
Tie
r
Co
st M
agn
itu
de
Inte
gra
ted
Lan
d
Use
an
d
Tra
nsp
ort
atio
n
Mo
bili
ty O
pti
on
s
Tra
ffic
Flo
w
Qu
alit
y T
rave
l
Infr
astr
uct
ure
Incr
eas
e
Aw
aren
ess
Co
st A
dju
sted
Vis
ion
Sco
re
Co
st A
dju
sted
Cat
ego
ry
Cro
ss-R
efe
ren
ce
Cu
mu
lati
ve C
ost
(in
mill
ion
s)
R61 International Lincoln Bannock build new 2L
arterial 2 6 2 2 2 2 0 7.6 Low $402.5
R124
NEW (MSP)
Greenfields Vine Mulberry build new 2L
arterial 2 6 2 2 2 2 0 7.6 Low $427.5
R62 Kechter Strauss Cabin I-25
upgrade to 2L
arterial
standards
2 3 1 2 1 1 0 7.1 Low $429.5
R63 Douglas County Road
13 Turnberry
upgrade from
CR to 2L arterial 2 3 2 1 1 1 0 6.6 Low $432.5
R64 Hickory
Soft Gold
Park
Trailhead
College
upgrade to
collector
standards
2 3 2 1 1 1 0 6.6 Low PD60 $435.5
R65 Timberwood Timberline Snow Mesa build new
collector 2 3 2 1 1 1 0 6.6 Low $437.0
R68 Redwood Conifer Vine build new
collector 2 2 1 1 1 1 0 6.3 Low $437.5
R66 Mason State Highway
1 Willox
build new
collector 2 3 1 1 1 1 0 5.4 Low $441.5
R67 Redwood Country Club Willox build new
collector 2 3 1 1 1 1 0 5.4 Low $443.5
R70 Richards Lake Giddings I-25 upgrade from
CR to 2L arterial 2 3 1 1 1 1 0 5.4 Low $446.5
R71 Swallow Taft Hill Bassick build new
collector 2 3 1 1 1 1 0 5.4 Low $447.5
Capital Improvement Plan Documentation 28
Roadway CIP List P
roje
ct ID
Lo
cati
on
/
Pro
gra
m
Fro
m
To
Des
crip
tio
n
Tie
r
Co
st M
agn
itu
de
Inte
gra
ted
Lan
d
Use
an
d
Tra
nsp
ort
atio
n
Mo
bili
ty O
pti
on
s
Tra
ffic
Flo
w
Qu
alit
y T
rave
l
Infr
astr
uct
ure
Incr
eas
e
Aw
aren
ess
Co
st A
dju
sted
Vis
ion
Sco
re
Co
st A
dju
sted
Cat
ego
ry
Cro
ss-R
efe
ren
ce
Cu
mu
lati
ve C
ost
(in
mill
ion
s)
R72 Timberline Realigned
Vine Vine
upgrade from 2L
to 4L arterial -
includes
realignment and
grade-separated
RR crossing
3 5 3 5 3 1 0 14.0 High $458.5
R120 Timberline Drake Horsetooth
upgrade to 6L
Arterial
standards
3 4 3 2 4 2 0 13.5 High $465.0
R73 Timberline Horsetooth Harmony upgrade from 4L
to 6L arterial 3 4 3 2 4 2 0 13.5 High $471.5
R74 Mulberry Timberline Summit View upgrade from 4L
to 6L arterial 3 3 2 2 3 2 0 12.6 High $473.5
R75 College Harmony Fossil Creek
upgrade from 4L
arterial to 6L
arterial
3 4 2 3 3 2 0 12.5 High $482.0
R76 Timberline Prospect Drake upgrade from 4L
to 6L arterial 3 5 3 2 4 2 0 12.0 Medium $492.5
R77 Timberline Vine Mulberry upgrade from 2L
to 4L arterial 3 5 3 3 3 2 0 12.0 Medium $507.5
R78 Trilby Shields College
upgrade to 2L
arterial
standards
3 3 2 2 3 1 0 11.7 Medium $511.5
R79 Carpenter Lemay Timberline upgrade from 2L
to 4L arterial 3 3 1 2 3 2 0 11.4 Medium $515.5
R80 Carpenter County Road
9 I-25
upgrade from 2L
to 4L arterial 3 3 1 2 3 2 0 11.4 Medium $519.5
Capital Improvement Plan Documentation 29
Roadway CIP List P
roje
ct ID
Lo
cati
on
/
Pro
gra
m
Fro
m
To
Des
crip
tio
n
Tie
r
Co
st M
agn
itu
de
Inte
gra
ted
Lan
d
Use
an
d
Tra
nsp
ort
atio
n
Mo
bili
ty O
pti
on
s
Tra
ffic
Flo
w
Qu
alit
y T
rave
l
Infr
astr
uct
ure
Incr
eas
e
Aw
aren
ess
Co
st A
dju
sted
Vis
ion
Sco
re
Co
st A
dju
sted
Cat
ego
ry
Cro
ss-R
efe
ren
ce
Cu
mu
lati
ve C
ost
(in
mill
ion
s)
R81 Carpenter Timberline County Road
9
upgrade from 2L
to 4L arterial 3 3 1 2 3 2 0 11.4 Medium $523.5
R82 Willox Shields College
upgrade to 2L
arterial
standards
3 3 3 2 2 1 0 11.1 Medium $527.0
R83 Lemay Country Club Conifer upgrade from 2L
to 4L arterial 3 4 2 3 2 2 0 11.0 Medium PD43 $533.0
R84 Riverside Lincoln Mulberry
upgrade to 4L
arterial
standards
3 4 2 2 3 2 0 11.0 Medium $539.0
R85 Horsetooth Taft Hill Shields upgrade from 2L
to 4L arterial 3 3 2 2 2 1 0 10.0 Medium $543.0
R86 Shields Trilby Carpenter upgrade from 2L
to 4L arterial 3 3 2 2 2 1 0 10.0 Medium $547.0
R87 Shields Fossil Creek Trilby upgrade from 2L
to 4L arterial 3 3 2 2 2 1 0 10.0 Medium $551.0
R88 Carpenter College Lemay upgrade from 2L
to 4L arterial 3 4 1 2 3 2 0 10.0 Medium $557.0
R89 Mulberry Riverside Timberline upgrade from 4L
to 6L arterial 3 5 2 2 3 2 0 9.8 Medium $573.0
R90 Mulberry Summit View I-25 upgrade from 4L
to 6L arterial 3 5 2 2 3 2 0 9.8 Medium $583.0
R119 College Conifer Vine
upgrade to 4L
arterial (North
College)
standards
3 3 1 1 3 2 0 9.7 Medium $585.0
Capital Improvement Plan Documentation 30
Roadway CIP List P
roje
ct ID
Lo
cati
on
/
Pro
gra
m
Fro
m
To
Des
crip
tio
n
Tie
r
Co
st M
agn
itu
de
Inte
gra
ted
Lan
d
Use
an
d
Tra
nsp
ort
atio
n
Mo
bili
ty O
pti
on
s
Tra
ffic
Flo
w
Qu
alit
y T
rave
l
Infr
astr
uct
ure
Incr
eas
e
Aw
aren
ess
Co
st A
dju
sted
Vis
ion
Sco
re
Co
st A
dju
sted
Cat
ego
ry
Cro
ss-R
efe
ren
ce
Cu
mu
lati
ve C
ost
(in
mill
ion
s)
R91 Taft Hill Horsetooth Harmony upgrade from 2L
to 4L arterial 3 3 1 2 2 2 0 9.7 Medium PD73 $589.0
R92 Taft Hill GMA Vine upgrade from
CR to 2L arterial 3 3 1 2 2 2 0 9.7 Medium $593.0
R93
Drake and
BNSF
Railroad
Tracks
build grade-
separated RR
crossing
3 6 1 3 3 2 0 9.2 Medium $613.0
R94 Shields Harmony Fossil Creek upgrade from 2L
to 4L arterial 3 4 2 2 2 1 0 8.8 Medium $619.5
R95 Taft Hill Harmony GMA upgrade from 2L
to 4L arterial 3 4 1 2 2 2 0 8.5 Medium $627.5
R96 Vine Overland Trail Taft Hill
upgrade to 2L
arterial
standards
3 3 2 2 1 1 0 8.3 Medium $630.5
R97 Vine I-25 GMA
upgrade to 2L
arterial
standards,
includes
realignment for
potential
interchange
3 3 2 2 1 1 0 8.3 Medium $631.5
R117 Mason Willox Realigned
Vine
build new
collector 3 4 3 1 2 1 0 8.3 Medium $639.0
R98 Prospect Overland Trail Taft Hill upgrade from 2L
to 4L arterial 3 4 1 3 1 1 1 8.0 Medium $645.0
Capital Improvement Plan Documentation 31
Roadway CIP List P
roje
ct ID
Lo
cati
on
/
Pro
gra
m
Fro
m
To
Des
crip
tio
n
Tie
r
Co
st M
agn
itu
de
Inte
gra
ted
Lan
d
Use
an
d
Tra
nsp
ort
atio
n
Mo
bili
ty O
pti
on
s
Tra
ffic
Flo
w
Qu
alit
y T
rave
l
Infr
astr
uct
ure
Incr
eas
e
Aw
aren
ess
Co
st A
dju
sted
Vis
ion
Sco
re
Co
st A
dju
sted
Cat
ego
ry
Cro
ss-R
efe
ren
ce
Cu
mu
lati
ve C
ost
(in
mill
ion
s)
R99
Trilby and
UPRR
Railroad
Tracks
build grade-
separated RR
crossing
3 6 1 3 2 1 0 7.4 Low $665.0
R100 Vine Timberline I-25
upgrade to 2L
arterial
standards with
connection to
realigned Vine
3 4 2 2 1 1 0 7.3 Low $673.0
R101 Overland Trail Vine Elizabeth
upgrade to 2L
arterial
standards
3 3 1 2 1 1 0 7.1 Low $675.0
R102 Overland Trail Michaud Vine
upgrade to 2L
arterial
standards
3 3 1 2 1 1 0 7.1 Low $679.0
R104 US 287 GMA State Highway
1
upgrade from 2L
to 4L arterial 3 5 1 2 2 1 0 6.9 Low $694.0
R18 Taft Hill Vine LaPorte upgrade from 2L
to 4L arterial 3 4 0 2 2 1 0 6.8 Low $700.0
R105 Trilby Taft Hill Shields
upgrade to 2L
arterial
standards
3 3 2 1 1 1 0 6.6 Low $703.0
R123
NEW
(MSP)
Elizabeth Taft Hill Constitution upgrade from 2L
to 4L arterial 3 4 1 2 1 1 0 6.3 Low $709.0
Capital Improvement Plan Documentation 32
Roadway CIP List P
roje
ct ID
Lo
cati
on
/
Pro
gra
m
Fro
m
To
Des
crip
tio
n
Tie
r
Co
st M
agn
itu
de
Inte
gra
ted
Lan
d
Use
an
d
Tra
nsp
ort
atio
n
Mo
bili
ty O
pti
on
s
Tra
ffic
Flo
w
Qu
alit
y T
rave
l
Infr
astr
uct
ure
Incr
eas
e
Aw
aren
ess
Co
st A
dju
sted
Vis
ion
Sco
re
Co
st A
dju
sted
Cat
ego
ry
Cro
ss-R
efe
ren
ce
Cu
mu
lati
ve C
ost
(in
mill
ion
s)
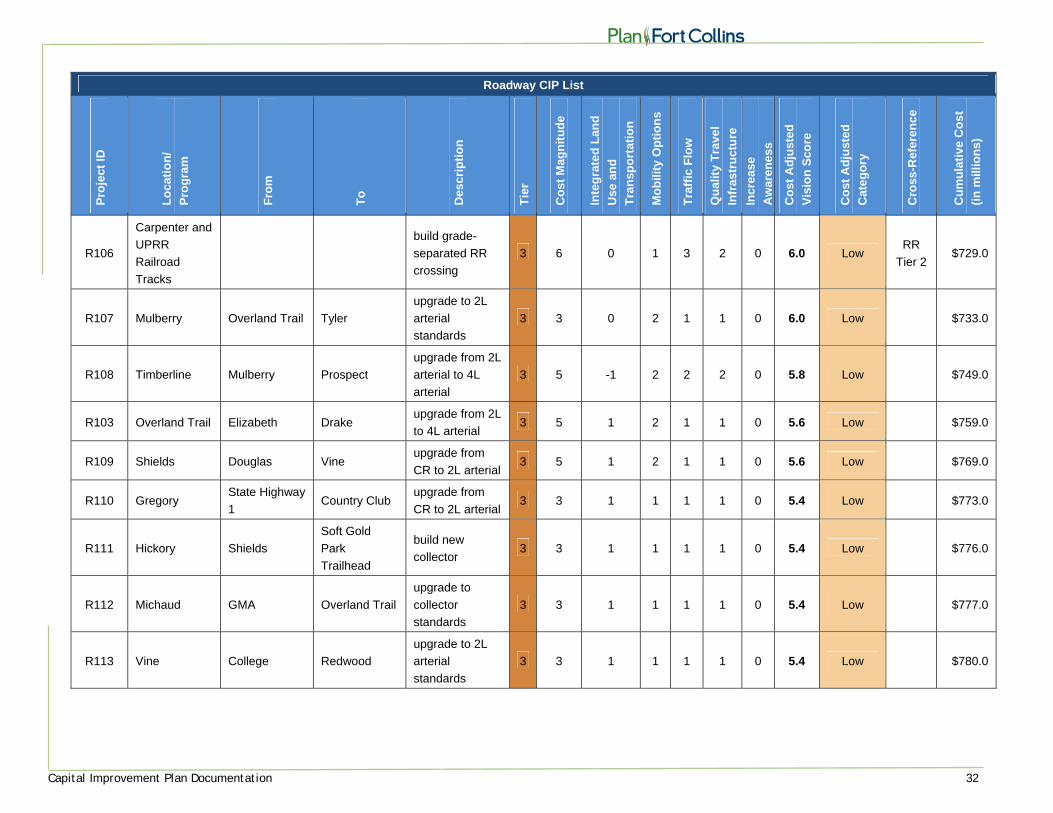
R106
Carpenter and
UPRR
Railroad
Tracks
build grade-
separated RR
crossing
3 6 0 1 3 2 0 6.0 Low RR
Tier 2 $729.0
R107 Mulberry Overland Trail Tyler
upgrade to 2L
arterial
standards
3 3 0 2 1 1 0 6.0 Low $733.0
R108 Timberline Mulberry Prospect
upgrade from 2L
arterial to 4L
arterial
3 5 -1 2 2 2 0 5.8 Low $749.0
R103 Overland Trail Elizabeth Drake upgrade from 2L
to 4L arterial 3 5 1 2 1 1 0 5.6 Low $759.0
R109 Shields Douglas Vine upgrade from
CR to 2L arterial 3 5 1 2 1 1 0 5.6 Low $769.0
R110 Gregory State Highway
1 Country Club
upgrade from
CR to 2L arterial 3 3 1 1 1 1 0 5.4 Low $773.0
R111 Hickory Shields
Soft Gold
Park
Trailhead
build new
collector 3 3 1 1 1 1 0 5.4 Low $776.0
R112 Michaud GMA Overland Trail
upgrade to
collector
standards
3 3 1 1 1 1 0 5.4 Low $777.0
R113 Vine College Redwood
upgrade to 2L
arterial
standards
3 3 1 1 1 1 0 5.4 Low $780.0
Capital Improvement Plan Documentation 33
Roadway CIP List P
roje
ct ID
Lo
cati
on
/
Pro
gra
m
Fro
m
To
Des
crip
tio
n
Tie
r
Co
st M
agn
itu
de
Inte
gra
ted
Lan
d
Use
an
d
Tra
nsp
ort
atio
n
Mo
bili
ty O
pti
on
s
Tra
ffic
Flo
w
Qu
alit
y T
rave
l
Infr
astr
uct
ure
Incr
eas
e
Aw
aren
ess
Co
st A
dju
sted
Vis
ion
Sco
re
Co
st A
dju
sted
Cat
ego
ry
Cro
ss-R
efe
ren
ce
Cu
mu
lati
ve C
ost
(in
mill
ion
s)
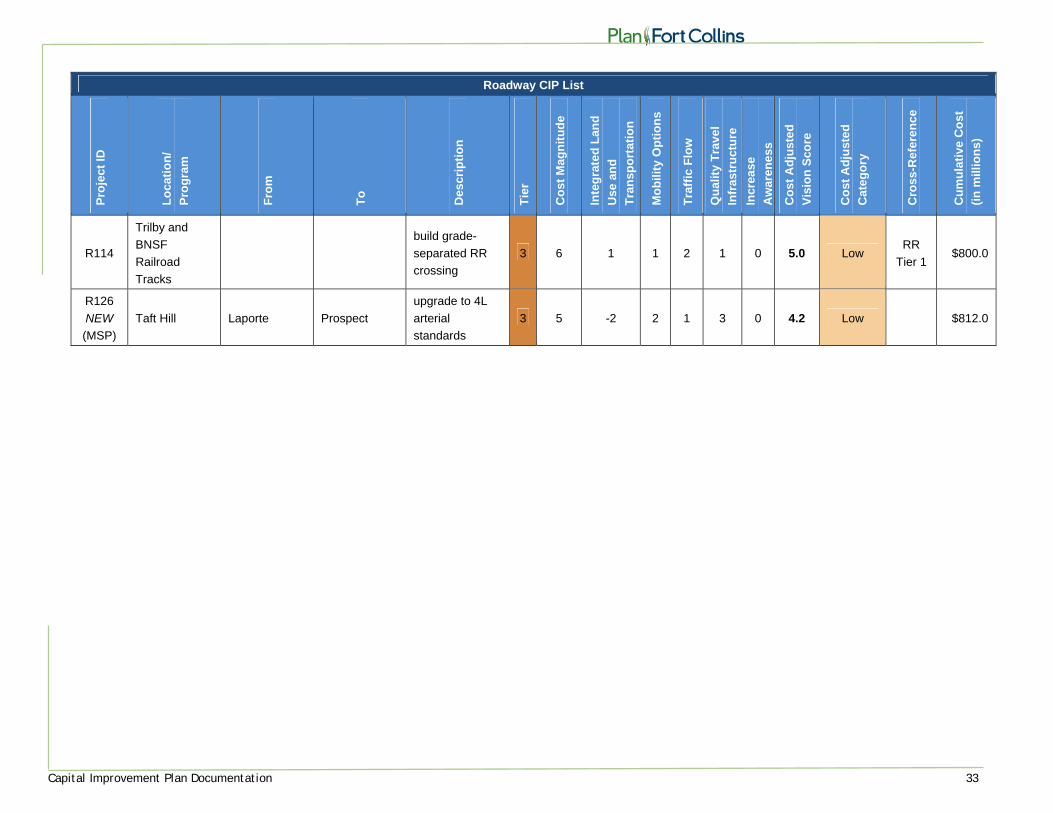
R114
Trilby and
BNSF
Railroad
Tracks
build grade-
separated RR
crossing
3 6 1 1 2 1 0 5.0 Low RR
Tier 1 $800.0
R126
NEW
(MSP)
Taft Hill Laporte Prospect
upgrade to 4L
arterial
standards
3 5 -2 2 1 3 0 4.2 Low $812.0
Capital Improvement Plan Documentation 34
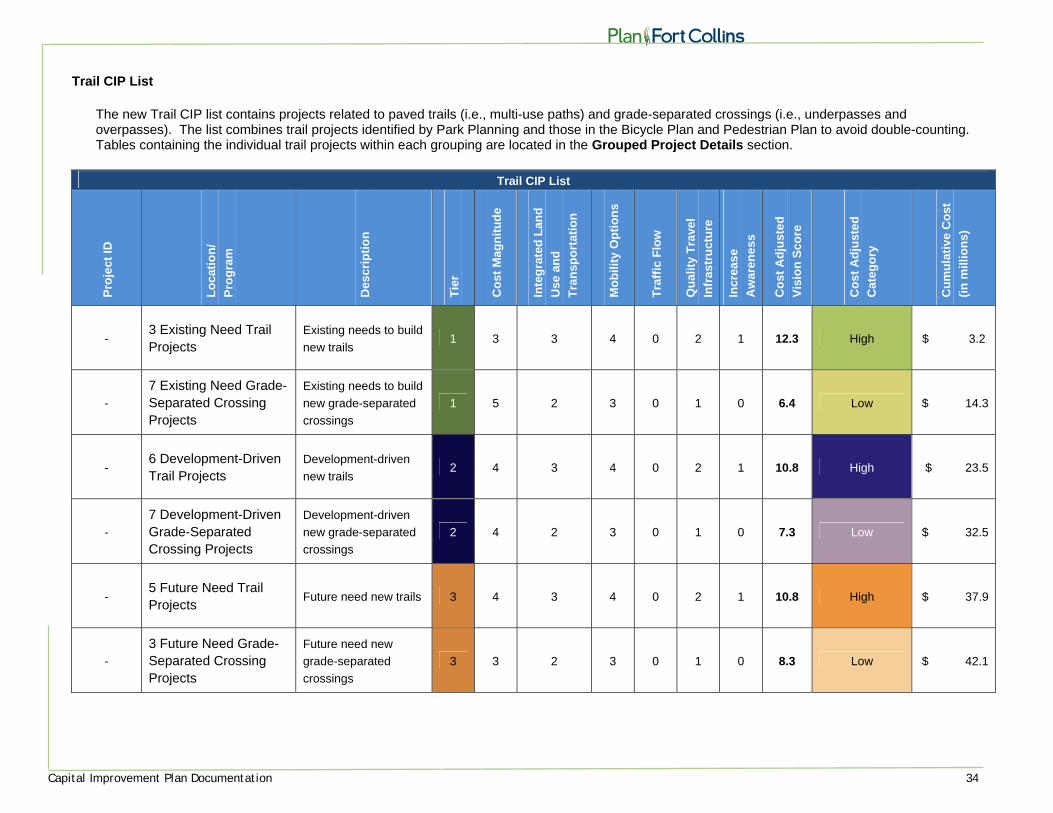
Trail CIP List
The new Trail CIP list contains projects related to paved trails (i.e., multi-use paths) and grade-separated crossings (i.e., underpasses and overpasses). The list combines trail projects identified by Park Planning and those in the Bicycle Plan and Pedestrian Plan to avoid double-counting. Tables containing the individual trail projects within each grouping are located in the Grouped Project Details section.
Trail CIP List
Pro
ject
ID
Lo
cati
on
/
Pro
gra
m
Des
crip
tio
n
Tie
r
Co
st M
agn
itu
de
Inte
gra
ted
Lan
d
Use
an
d
Tra
nsp
ort
atio
n
Mo
bili
ty O
pti
on
s
Tra
ffic
Flo
w
Qu
alit
y T
rave
l
Infr
astr
uct
ure
Incr
eas
e
Aw
aren
ess
Co
st A
dju
sted
Vis
ion
Sco
re
Co
st A
dju
sted
Cat
ego
ry
Cu
mu
lati
ve C
ost
(in
mill
ion
s)
- 3 Existing Need Trail Projects
Existing needs to build
new trails 1 3 3 4 0 2 1 12.3 High $ 3.2
-
7 Existing Need Grade-Separated Crossing Projects
Existing needs to build
new grade-separated
crossings
1 5 2 3 0 1 0 6.4 Low $ 14.3
- 6 Development-Driven Trail Projects
Development-driven
new trails 2 4 3 4 0 2 1 10.8 High $ 23.5
-
7 Development-Driven Grade-Separated Crossing Projects
Development-driven
new grade-separated
crossings
2 4 2 3 0 1 0 7.3 Low $ 32.5
- 5 Future Need Trail Projects
Future need new trails 3 4 3 4 0 2 1 10.8 High $ 37.9
-
3 Future Need Grade-Separated Crossing Projects
Future need new
grade-separated
crossings
3 3 2 3 0 1 0 8.3 Low $ 42.1
Capital Improvement Plan Documentation 35
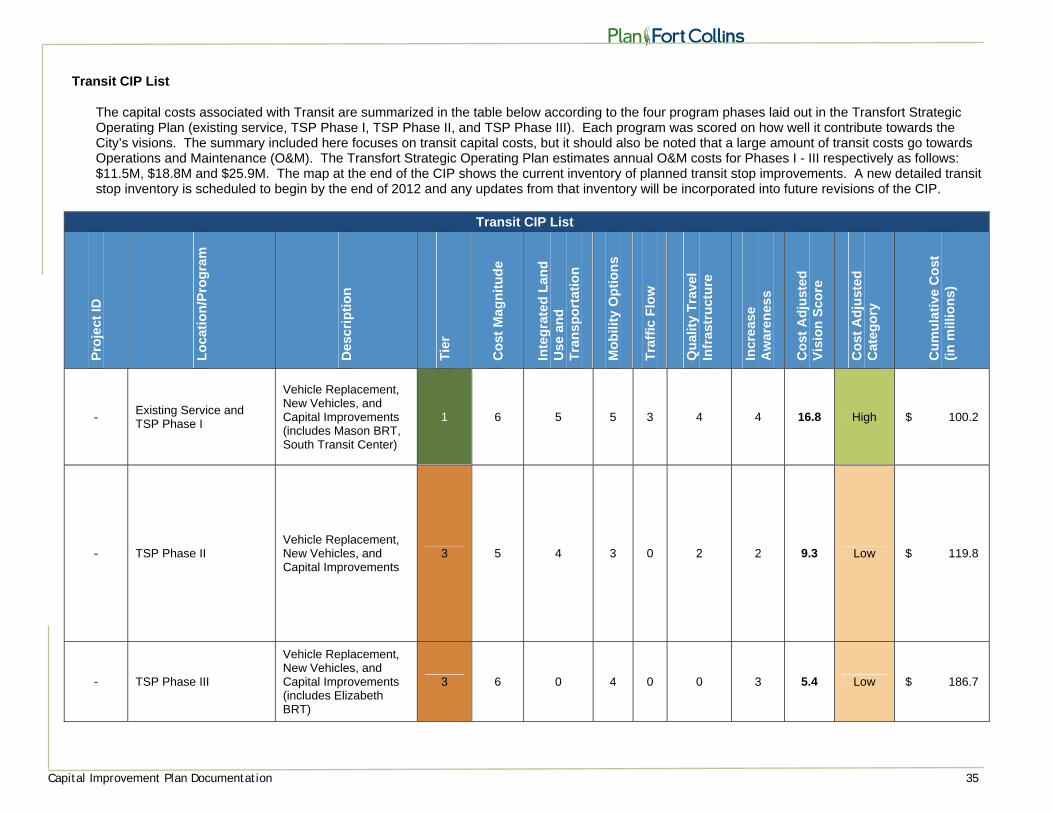
Transit CIP List
The capital costs associated with Transit are summarized in the table below according to the four program phases laid out in the Transfort Strategic Operating Plan (existing service, TSP Phase I, TSP Phase II, and TSP Phase III). Each program was scored on how well it contribute towards the City’s visions. The summary included here focuses on transit capital costs, but it should also be noted that a large amount of transit costs go towards Operations and Maintenance (O&M). The Transfort Strategic Operating Plan estimates annual O&M costs for Phases I - III respectively as follows: $11.5M, $18.8M and $25.9M. The map at the end of the CIP shows the current inventory of planned transit stop improvements. A new detailed transit stop inventory is scheduled to begin by the end of 2012 and any updates from that inventory will be incorporated into future revisions of the CIP.
Transit CIP List
Pro
ject
ID
Lo
cati
on
/Pro
gra
m
Des
crip
tio
n
Tie
r
Co
st M
agn
itu
de
Inte
gra
ted
Lan
d
Use
an
d
Tra
nsp
ort
atio
n
Mo
bili
ty O
pti
on
s
Tra
ffic
Flo
w
Qu
alit
y T
rave
l In
fras
tru
ctu
re
Incr
ease
A
war
enes
s
Co
st A
dju
sted
V
isio
n S
core
Co
st A
dju
sted
C
ateg
ory
Cu
mu
lati
ve C
ost
(i
n m
illio
ns)
- Existing Service and TSP Phase I
Vehicle Replacement, New Vehicles, and Capital Improvements (includes Mason BRT, South Transit Center)
1 6 5 5 3 4 4 16.8 High $ 100.2
- TSP Phase II Vehicle Replacement, New Vehicles, and Capital Improvements
3 5 4 3 0 2 2 9.3 Low $ 119.8
- TSP Phase III
Vehicle Replacement, New Vehicles, and Capital Improvements (includes Elizabeth BRT)
3 6 0 4 0 0 3 5.4 Low $ 186.7
Capital Improvement Plan Documentation 36
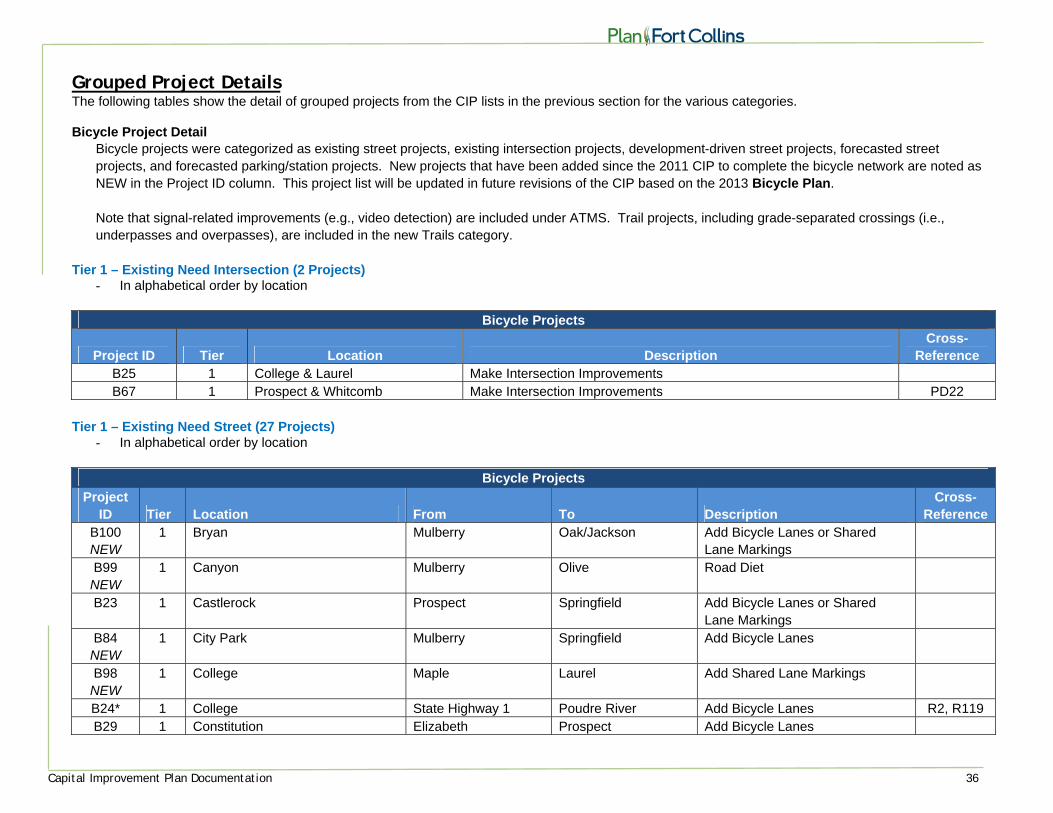
Grouped Project Details The following tables show the detail of grouped projects from the CIP lists in the previous section for the various categories. Bicycle Project Detail
Bicycle projects were categorized as existing street projects, existing intersection projects, development-driven street projects, forecasted street projects, and forecasted parking/station projects. New projects that have been added since the 2011 CIP to complete the bicycle network are noted as NEW in the Project ID column. This project list will be updated in future revisions of the CIP based on the 2013 Bicycle Plan.
Note that signal-related improvements (e.g., video detection) are included under ATMS. Trail projects, including grade-separated crossings (i.e., underpasses and overpasses), are included in the new Trails category.
Tier 1 – Existing Need Intersection (2 Projects)
- In alphabetical order by location
Bicycle Projects
Project ID Tier Location Description Cross-
Reference B25 1 College & Laurel Make Intersection Improvements B67 1 Prospect & Whitcomb Make Intersection Improvements PD22
Tier 1 – Existing Need Street (27 Projects)
- In alphabetical order by location
Bicycle Projects
Project ID Tier Location From To Description
Cross-Reference
B100 NEW
1 Bryan Mulberry Oak/Jackson Add Bicycle Lanes or Shared Lane Markings
B99 NEW
1 Canyon Mulberry Olive Road Diet
B23 1 Castlerock Prospect Springfield Add Bicycle Lanes or Shared Lane Markings
B84 NEW
1 City Park Mulberry Springfield Add Bicycle Lanes
B98 NEW
1 College Maple Laurel Add Shared Lane Markings
B24* 1 College State Highway 1 Poudre River Add Bicycle Lanes R2, R119 B29 1 Constitution Elizabeth Prospect Add Bicycle Lanes
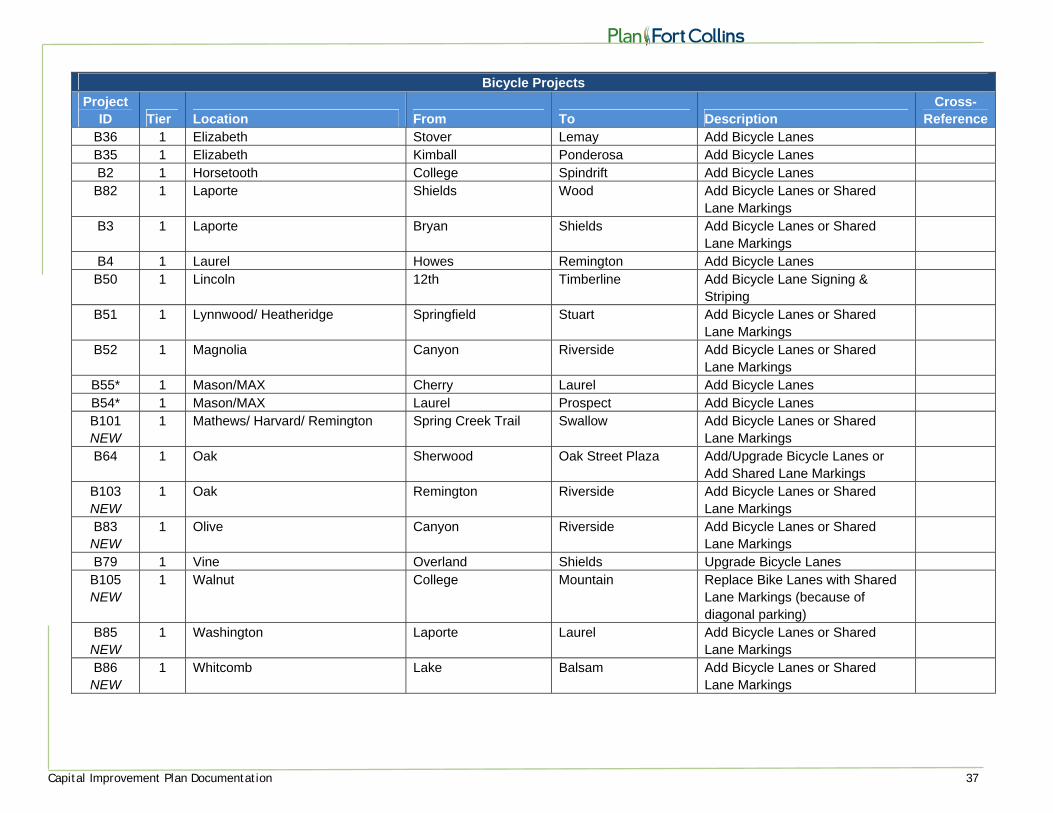
Capital Improvement Plan Documentation 37
Bicycle Projects
Project ID Tier Location From To Description
Cross-Reference
B36 1 Elizabeth Stover Lemay Add Bicycle Lanes B35 1 Elizabeth Kimball Ponderosa Add Bicycle Lanes B2 1 Horsetooth College Spindrift Add Bicycle Lanes B82 1 Laporte Shields Wood Add Bicycle Lanes or Shared
Lane Markings
B3 1 Laporte Bryan Shields Add Bicycle Lanes or Shared Lane Markings
B4 1 Laurel Howes Remington Add Bicycle Lanes B50 1 Lincoln 12th Timberline Add Bicycle Lane Signing &
Striping
B51 1 Lynnwood/ Heatheridge Springfield Stuart Add Bicycle Lanes or Shared Lane Markings
B52 1 Magnolia Canyon Riverside Add Bicycle Lanes or Shared Lane Markings
B55* 1 Mason/MAX Cherry Laurel Add Bicycle Lanes B54* 1 Mason/MAX Laurel Prospect Add Bicycle Lanes B101 NEW
1 Mathews/ Harvard/ Remington Spring Creek Trail Swallow Add Bicycle Lanes or Shared Lane Markings
B64 1 Oak Sherwood Oak Street Plaza Add/Upgrade Bicycle Lanes or Add Shared Lane Markings
B103 NEW
1 Oak Remington Riverside Add Bicycle Lanes or Shared Lane Markings
B83 NEW
1 Olive Canyon Riverside Add Bicycle Lanes or Shared Lane Markings
B79 1 Vine Overland Shields Upgrade Bicycle Lanes B105 NEW
1 Walnut College Mountain Replace Bike Lanes with Shared Lane Markings (because of diagonal parking)
B85 NEW
1 Washington Laporte Laurel Add Bicycle Lanes or Shared Lane Markings
B86 NEW
1 Whitcomb Lake Balsam Add Bicycle Lanes or Shared Lane Markings
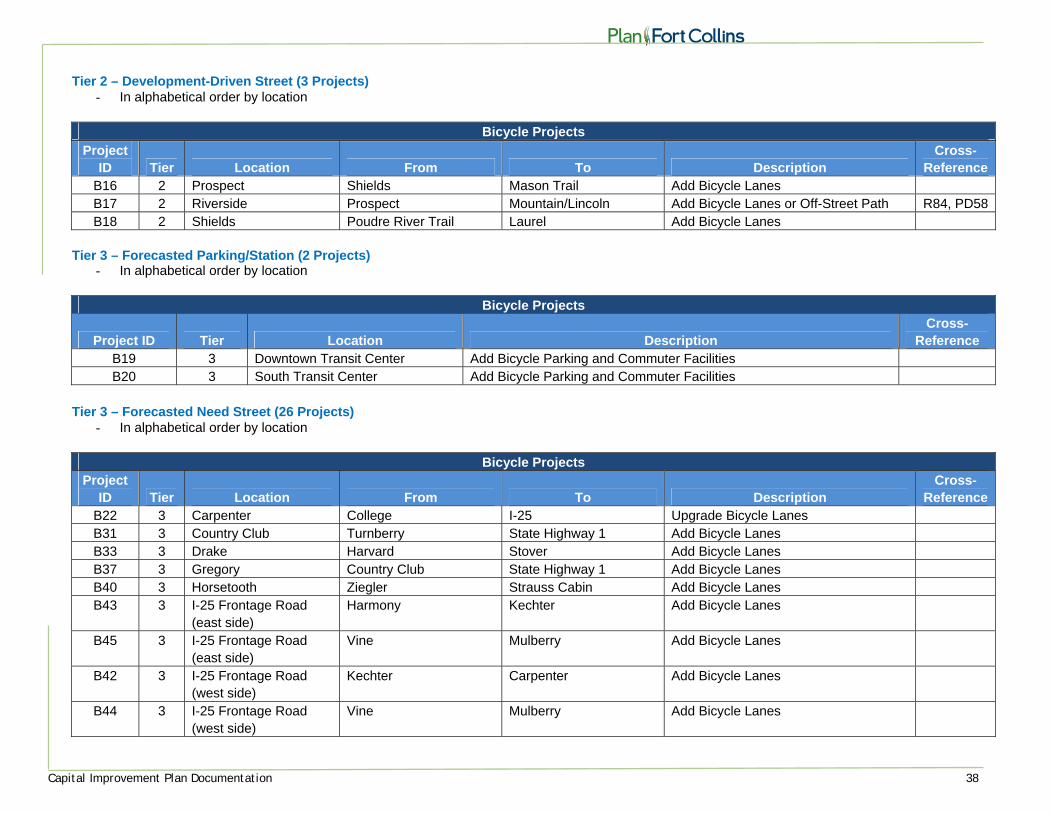
Capital Improvement Plan Documentation 38
Tier 2 – Development-Driven Street (3 Projects) - In alphabetical order by location
Project ID Tier Location From To Description
Cross-Reference
B16 2 Prospect Shields Mason Trail Add Bicycle Lanes B17 2 Riverside Prospect Mountain/Lincoln Add Bicycle Lanes or Off-Street Path R84, PD58 B18 2 Shields Poudre River Trail Laurel Add Bicycle Lanes
Tier 3 – Forecasted Parking/Station (2 Projects)
- In alphabetical order by location
Bicycle Projects
Project ID Tier Location Description Cross-
Reference B19 3 Downtown Transit Center Add Bicycle Parking and Commuter Facilities B20 3 South Transit Center Add Bicycle Parking and Commuter Facilities
Tier 3 – Forecasted Need Street (26 Projects)
- In alphabetical order by location
Bicycle Projects Project
ID Tier Location From To Description Cross-
Reference B22 3 Carpenter College I-25 Upgrade Bicycle Lanes B31 3 Country Club Turnberry State Highway 1 Add Bicycle Lanes B33 3 Drake Harvard Stover Add Bicycle Lanes B37 3 Gregory Country Club State Highway 1 Add Bicycle Lanes B40 3 Horsetooth Ziegler Strauss Cabin Add Bicycle Lanes B43 3 I-25 Frontage Road
(east side) Harmony Kechter Add Bicycle Lanes
B45 3 I-25 Frontage Road (east side)
Vine Mulberry Add Bicycle Lanes
B42 3 I-25 Frontage Road (west side)
Kechter Carpenter Add Bicycle Lanes
B44 3 I-25 Frontage Road (west side)
Vine Mulberry Add Bicycle Lanes
Bicycle Projects
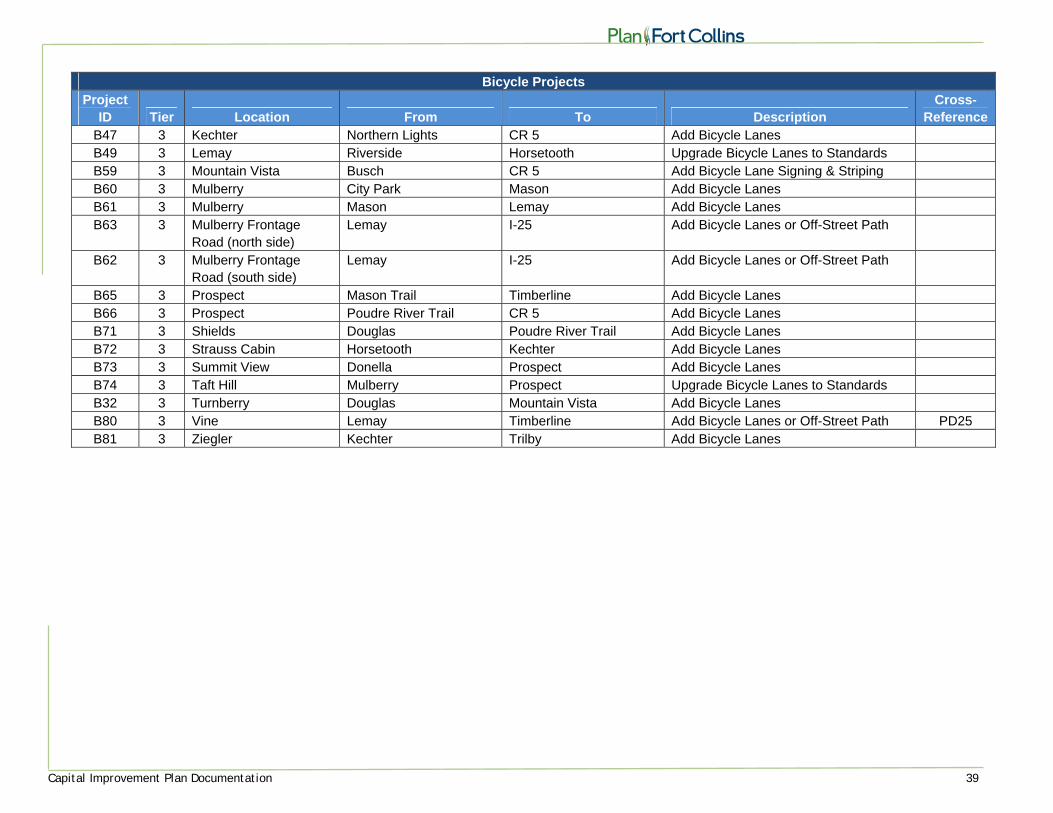
Capital Improvement Plan Documentation 39
Bicycle Projects Project
ID Tier Location From To Description Cross-
Reference B47 3 Kechter Northern Lights CR 5 Add Bicycle Lanes B49 3 Lemay Riverside Horsetooth Upgrade Bicycle Lanes to Standards B59 3 Mountain Vista Busch CR 5 Add Bicycle Lane Signing & Striping B60 3 Mulberry City Park Mason Add Bicycle Lanes B61 3 Mulberry Mason Lemay Add Bicycle Lanes B63 3 Mulberry Frontage
Road (north side) Lemay I-25 Add Bicycle Lanes or Off-Street Path
B62 3 Mulberry Frontage Road (south side)
Lemay I-25 Add Bicycle Lanes or Off-Street Path
B65 3 Prospect Mason Trail Timberline Add Bicycle Lanes B66 3 Prospect Poudre River Trail CR 5 Add Bicycle Lanes B71 3 Shields Douglas Poudre River Trail Add Bicycle Lanes B72 3 Strauss Cabin Horsetooth Kechter Add Bicycle Lanes B73 3 Summit View Donella Prospect Add Bicycle Lanes B74 3 Taft Hill Mulberry Prospect Upgrade Bicycle Lanes to Standards B32 3 Turnberry Douglas Mountain Vista Add Bicycle Lanes B80 3 Vine Lemay Timberline Add Bicycle Lanes or Off-Street Path PD25 B81 3 Ziegler Kechter Trilby Add Bicycle Lanes
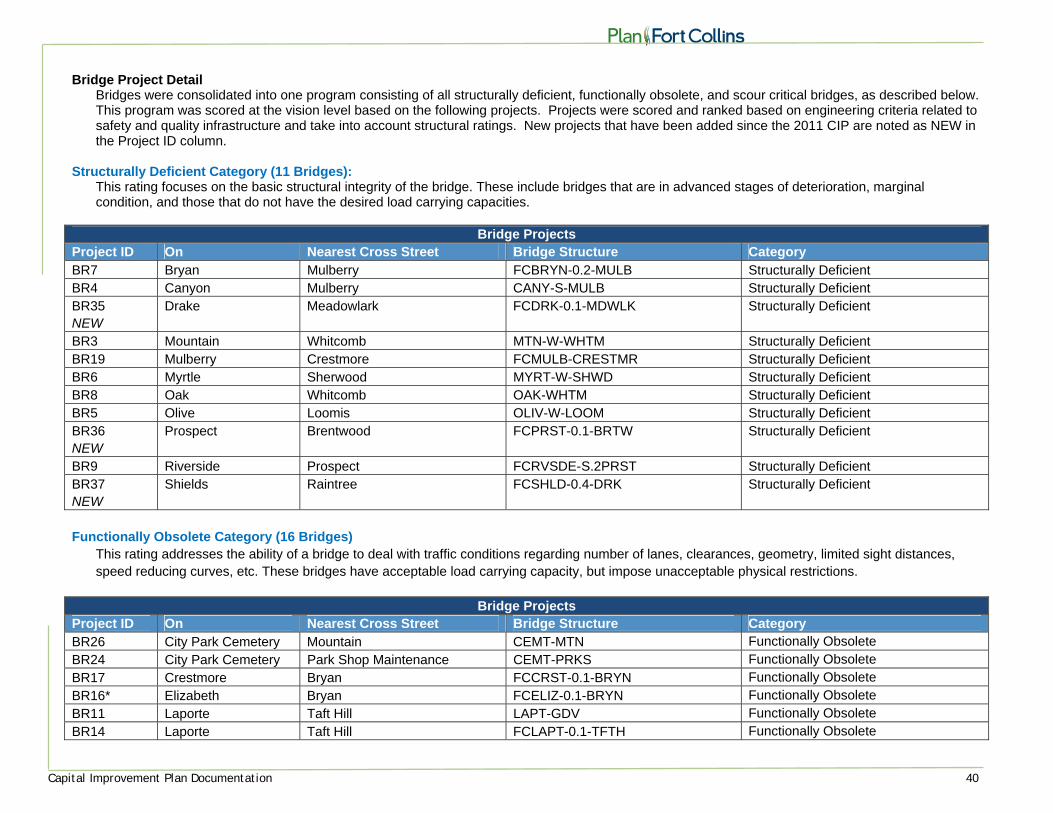
Capital Improvement Plan Documentation 40
Bridge Project Detail Bridges were consolidated into one program consisting of all structurally deficient, functionally obsolete, and scour critical bridges, as described below. This program was scored at the vision level based on the following projects. Projects were scored and ranked based on engineering criteria related to safety and quality infrastructure and take into account structural ratings. New projects that have been added since the 2011 CIP are noted as NEW in the Project ID column.
Structurally Deficient Category (11 Bridges):
This rating focuses on the basic structural integrity of the bridge. These include bridges that are in advanced stages of deterioration, marginal condition, and those that do not have the desired load carrying capacities.
Bridge Projects
Project ID On Nearest Cross Street Bridge Structure Category BR7 Bryan Mulberry FCBRYN-0.2-MULB Structurally Deficient BR4 Canyon Mulberry CANY-S-MULB Structurally Deficient BR35 NEW
Drake Meadowlark FCDRK-0.1-MDWLK Structurally Deficient
BR3 Mountain Whitcomb MTN-W-WHTM Structurally Deficient BR19 Mulberry Crestmore FCMULB-CRESTMR Structurally Deficient BR6 Myrtle Sherwood MYRT-W-SHWD Structurally Deficient BR8 Oak Whitcomb OAK-WHTM Structurally Deficient BR5 Olive Loomis OLIV-W-LOOM Structurally Deficient BR36 NEW
Prospect Brentwood FCPRST-0.1-BRTW Structurally Deficient
BR9 Riverside Prospect FCRVSDE-S.2PRST Structurally Deficient BR37 NEW
Shields Raintree FCSHLD-0.4-DRK Structurally Deficient
Functionally Obsolete Category (16 Bridges)
This rating addresses the ability of a bridge to deal with traffic conditions regarding number of lanes, clearances, geometry, limited sight distances, speed reducing curves, etc. These bridges have acceptable load carrying capacity, but impose unacceptable physical restrictions.
Bridge Projects
Project ID On Nearest Cross Street Bridge Structure Category BR26 City Park Cemetery Mountain CEMT-MTN Functionally Obsolete BR24 City Park Cemetery Park Shop Maintenance CEMT-PRKS Functionally Obsolete BR17 Crestmore Bryan FCCRST-0.1-BRYN Functionally Obsolete BR16* Elizabeth Bryan FCELIZ-0.1-BRYN Functionally Obsolete BR11 Laporte Taft Hill LAPT-GDV Functionally Obsolete BR14 Laporte Taft Hill FCLAPT-0.1-TFTH Functionally Obsolete
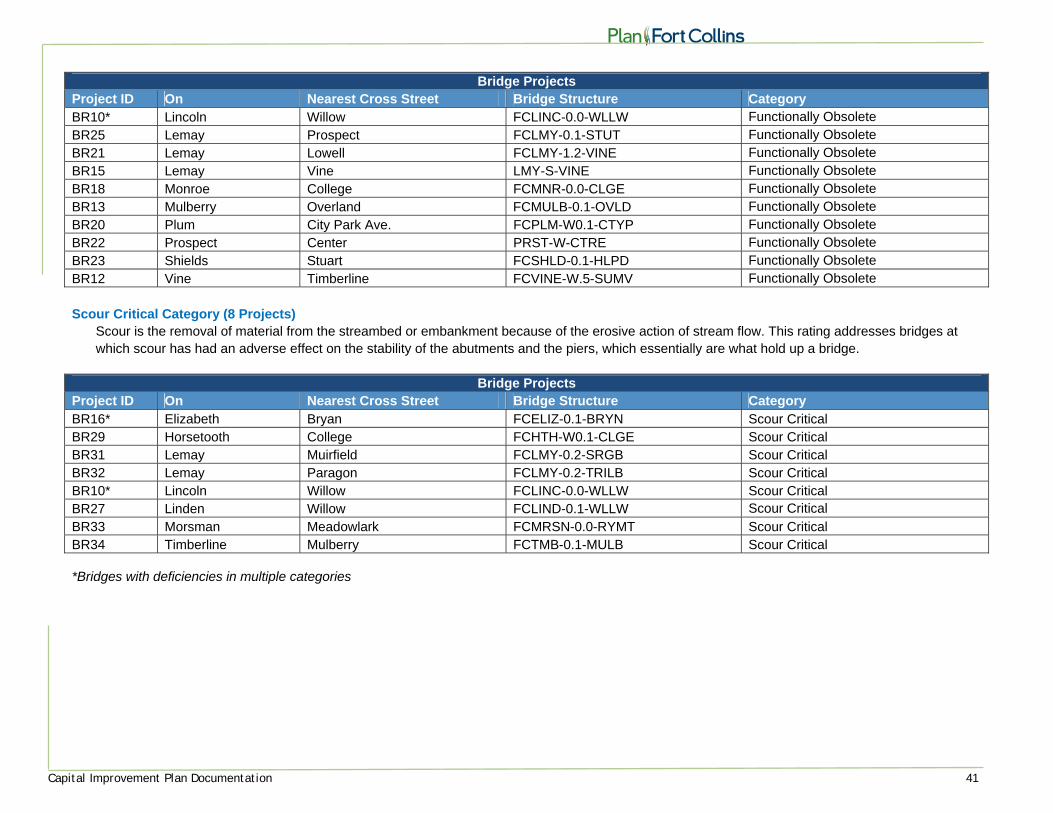
Capital Improvement Plan Documentation 41
Bridge Projects Project ID On Nearest Cross Street Bridge Structure Category BR10* Lincoln Willow FCLINC-0.0-WLLW Functionally Obsolete BR25 Lemay Prospect FCLMY-0.1-STUT Functionally Obsolete BR21 Lemay Lowell FCLMY-1.2-VINE Functionally Obsolete BR15 Lemay Vine LMY-S-VINE Functionally Obsolete BR18 Monroe College FCMNR-0.0-CLGE Functionally Obsolete BR13 Mulberry Overland FCMULB-0.1-OVLD Functionally Obsolete BR20 Plum City Park Ave. FCPLM-W0.1-CTYP Functionally Obsolete BR22 Prospect Center PRST-W-CTRE Functionally Obsolete BR23 Shields Stuart FCSHLD-0.1-HLPD Functionally Obsolete BR12 Vine Timberline FCVINE-W.5-SUMV Functionally Obsolete Scour Critical Category (8 Projects)
Scour is the removal of material from the streambed or embankment because of the erosive action of stream flow. This rating addresses bridges at which scour has had an adverse effect on the stability of the abutments and the piers, which essentially are what hold up a bridge.
Bridge Projects
Project ID On Nearest Cross Street Bridge Structure Category BR16* Elizabeth Bryan FCELIZ-0.1-BRYN Scour Critical BR29 Horsetooth College FCHTH-W0.1-CLGE Scour Critical BR31 Lemay Muirfield FCLMY-0.2-SRGB Scour Critical BR32 Lemay Paragon FCLMY-0.2-TRILB Scour Critical BR10* Lincoln Willow FCLINC-0.0-WLLW Scour Critical BR27 Linden Willow FCLIND-0.1-WLLW Scour Critical BR33 Morsman Meadowlark FCMRSN-0.0-RYMT Scour Critical BR34 Timberline Mulberry FCTMB-0.1-MULB Scour Critical *Bridges with deficiencies in multiple categories
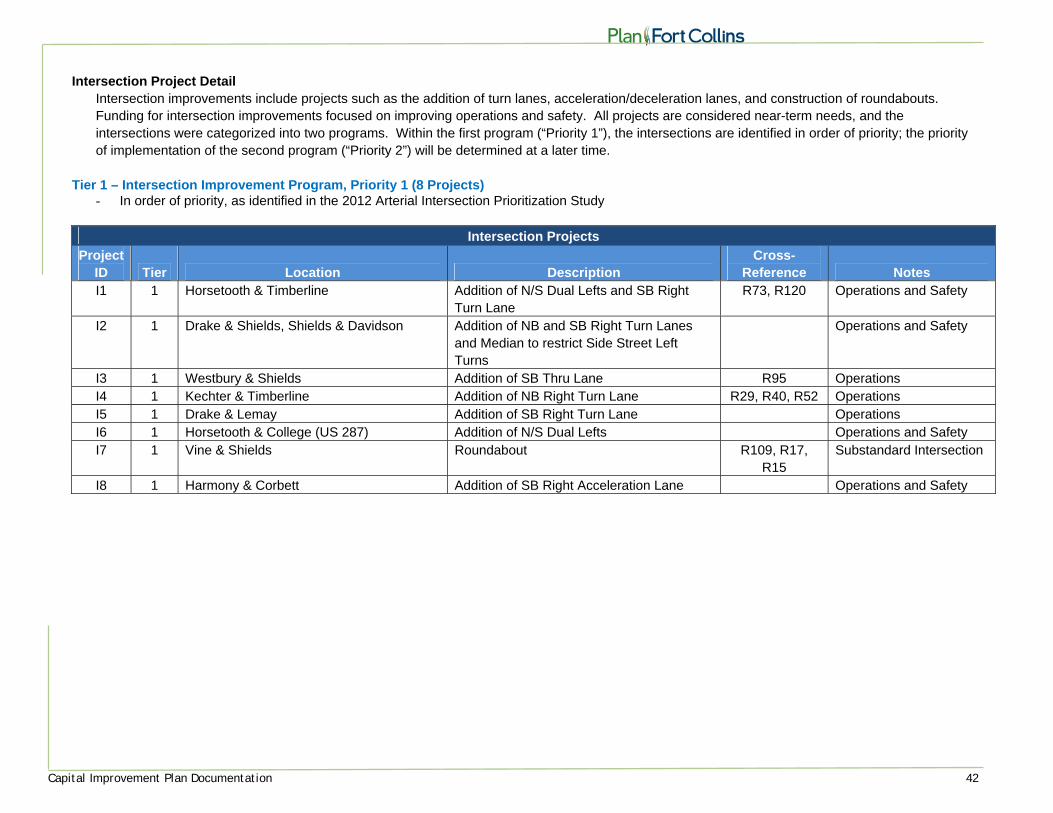
Capital Improvement Plan Documentation 42
Intersection Project Detail Intersection improvements include projects such as the addition of turn lanes, acceleration/deceleration lanes, and construction of roundabouts. Funding for intersection improvements focused on improving operations and safety. All projects are considered near-term needs, and the intersections were categorized into two programs. Within the first program (“Priority 1”), the intersections are identified in order of priority; the priority of implementation of the second program (“Priority 2”) will be determined at a later time.
Tier 1 – Intersection Improvement Program, Priority 1 (8 Projects)
- In order of priority, as identified in the 2012 Arterial Intersection Prioritization Study
Intersection Projects
Project ID Tier Location Description
Cross-Reference Notes
I1 1 Horsetooth & Timberline Addition of N/S Dual Lefts and SB Right Turn Lane
R73, R120 Operations and Safety
I2 1 Drake & Shields, Shields & Davidson Addition of NB and SB Right Turn Lanes and Median to restrict Side Street Left Turns
Operations and Safety
I3 1 Westbury & Shields Addition of SB Thru Lane R95 Operations I4 1 Kechter & Timberline Addition of NB Right Turn Lane R29, R40, R52 Operations I5 1 Drake & Lemay Addition of SB Right Turn Lane Operations I6 1 Horsetooth & College (US 287) Addition of N/S Dual Lefts Operations and Safety I7 1 Vine & Shields Roundabout R109, R17,
R15 Substandard Intersection
I8 1 Harmony & Corbett Addition of SB Right Acceleration Lane Operations and Safety

Capital Improvement Plan Documentation 43
Tier 1 – Intersection Improvement Program, Priority 2 (19 Projects) - In alphabetical order by location
Project ID Tier Location Description
Cross-Reference Notes
I9 1 Drake & College (US 287) E/W Dual Lefts R93, I29 Operations and Safety I10 1 Drake & Lemay (Option 1) EB Dual Left Operations I11 1 Drake & Shields (Option 1) E/W Dual Lefts Operations and Safety I12 1 Harmony & McMurry SB Dual Left R121 Operations I13 1 Horsetooth & Lemay (E) EB Right Decel Lane; EB Free Right Safety I14 1 Horsetooth & Lemay (W) WB Right Decel Lane; WB Free Right Operations I15 1 Horsetooth & Taft Hill SB Dual Left R85, R91 Safety I16 1 Mulberry & College (US 287) (Option 1) SB Dual Left Operations I17 1 Mulberry & College (US 287) (Option 2) WB Dual Left; Convert WB Right to
Thru/Right Operations
I18 1 Mulberry & Link Lane (Option 1) SB Left Turn Protected Phasing R89 Operations I19 1 Mulberry & Link Lane (Option 2) Offset E/W Lefts to Improve Sight Distance R89 Operations I20 1 Prospect & College (US 287) Extend WB Left Turn Lane R14 Operations and Safety I21 1 Prospect & Lemay EB Right Turn Lane R14 Operations I22 1 Prospect & Prospect Parkway NB Dual Left Operations I23 1 Prospect & Timberline EB Right Accel Lane R108, R76 Operations I24 1 Shields & Laporte Roundabout R17, R23, R12 Substandard Intersection I25 1 Stover & Prospect Coordinate Ped Signal R14 Safety I26 1 Vine & Lemay N/S Left Turn Lanes R31, R10, R51 Operations I27 1 Welch & Prospect Coordinate Ped Signal Safety
Intersection Projects
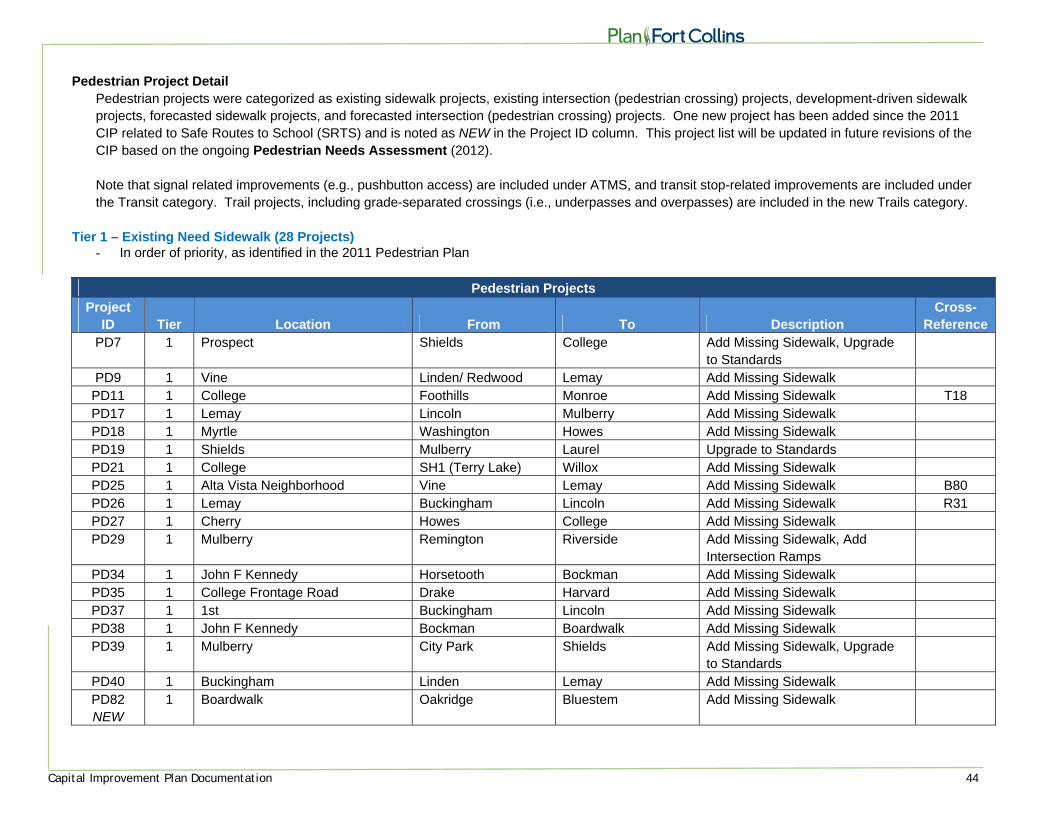
Capital Improvement Plan Documentation 44
Pedestrian Project Detail Pedestrian projects were categorized as existing sidewalk projects, existing intersection (pedestrian crossing) projects, development-driven sidewalk projects, forecasted sidewalk projects, and forecasted intersection (pedestrian crossing) projects. One new project has been added since the 2011 CIP related to Safe Routes to School (SRTS) and is noted as NEW in the Project ID column. This project list will be updated in future revisions of the CIP based on the ongoing Pedestrian Needs Assessment (2012).
Note that signal related improvements (e.g., pushbutton access) are included under ATMS, and transit stop-related improvements are included under the Transit category. Trail projects, including grade-separated crossings (i.e., underpasses and overpasses) are included in the new Trails category.
Tier 1 – Existing Need Sidewalk (28 Projects)
- In order of priority, as identified in the 2011 Pedestrian Plan
Pedestrian Projects
Project ID Tier Location From To Description
Cross-Reference
PD7 1 Prospect Shields College Add Missing Sidewalk, Upgrade to Standards
PD9 1 Vine Linden/ Redwood Lemay Add Missing Sidewalk PD11 1 College Foothills Monroe Add Missing Sidewalk T18 PD17 1 Lemay Lincoln Mulberry Add Missing Sidewalk PD18 1 Myrtle Washington Howes Add Missing Sidewalk PD19 1 Shields Mulberry Laurel Upgrade to Standards PD21 1 College SH1 (Terry Lake) Willox Add Missing Sidewalk PD25 1 Alta Vista Neighborhood Vine Lemay Add Missing Sidewalk B80 PD26 1 Lemay Buckingham Lincoln Add Missing Sidewalk R31 PD27 1 Cherry Howes College Add Missing Sidewalk PD29 1 Mulberry Remington Riverside Add Missing Sidewalk, Add
Intersection Ramps
PD34 1 John F Kennedy Horsetooth Bockman Add Missing Sidewalk PD35 1 College Frontage Road Drake Harvard Add Missing Sidewalk PD37 1 1st Buckingham Lincoln Add Missing Sidewalk PD38 1 John F Kennedy Bockman Boardwalk Add Missing Sidewalk PD39 1 Mulberry City Park Shields Add Missing Sidewalk, Upgrade
to Standards
PD40 1 Buckingham Linden Lemay Add Missing Sidewalk PD82 NEW
1 Boardwalk Oakridge Bluestem Add Missing Sidewalk
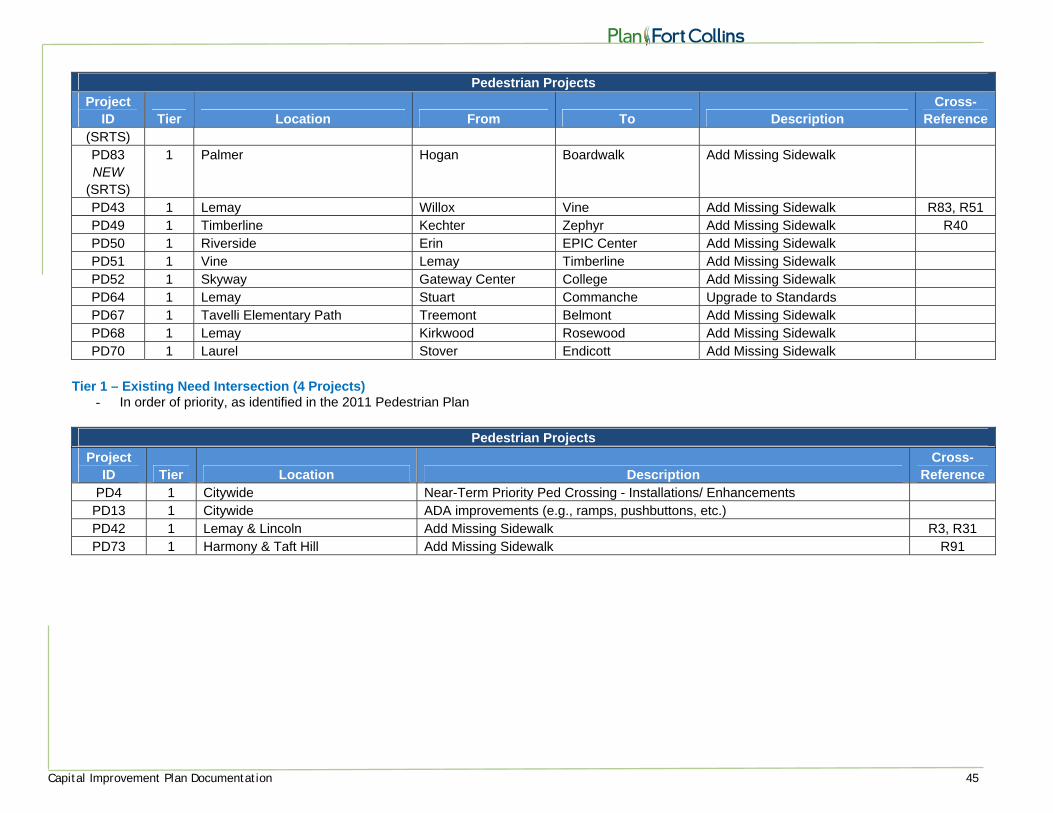
Capital Improvement Plan Documentation 45
Pedestrian Projects
Project ID Tier Location From To Description
Cross-Reference
(SRTS) PD83 NEW
(SRTS)
1 Palmer Hogan Boardwalk Add Missing Sidewalk
PD43 1 Lemay Willox Vine Add Missing Sidewalk R83, R51 PD49 1 Timberline Kechter Zephyr Add Missing Sidewalk R40 PD50 1 Riverside Erin EPIC Center Add Missing Sidewalk PD51 1 Vine Lemay Timberline Add Missing Sidewalk PD52 1 Skyway Gateway Center College Add Missing Sidewalk PD64 1 Lemay Stuart Commanche Upgrade to Standards PD67 1 Tavelli Elementary Path Treemont Belmont Add Missing Sidewalk PD68 1 Lemay Kirkwood Rosewood Add Missing Sidewalk PD70 1 Laurel Stover Endicott Add Missing Sidewalk
Tier 1 – Existing Need Intersection (4 Projects)
- In order of priority, as identified in the 2011 Pedestrian Plan
Project ID Tier Location Description
Cross-Reference
PD4 1 Citywide Near-Term Priority Ped Crossing - Installations/ Enhancements PD13 1 Citywide ADA improvements (e.g., ramps, pushbuttons, etc.) PD42 1 Lemay & Lincoln Add Missing Sidewalk R3, R31 PD73 1 Harmony & Taft Hill Add Missing Sidewalk R91
Pedestrian Projects
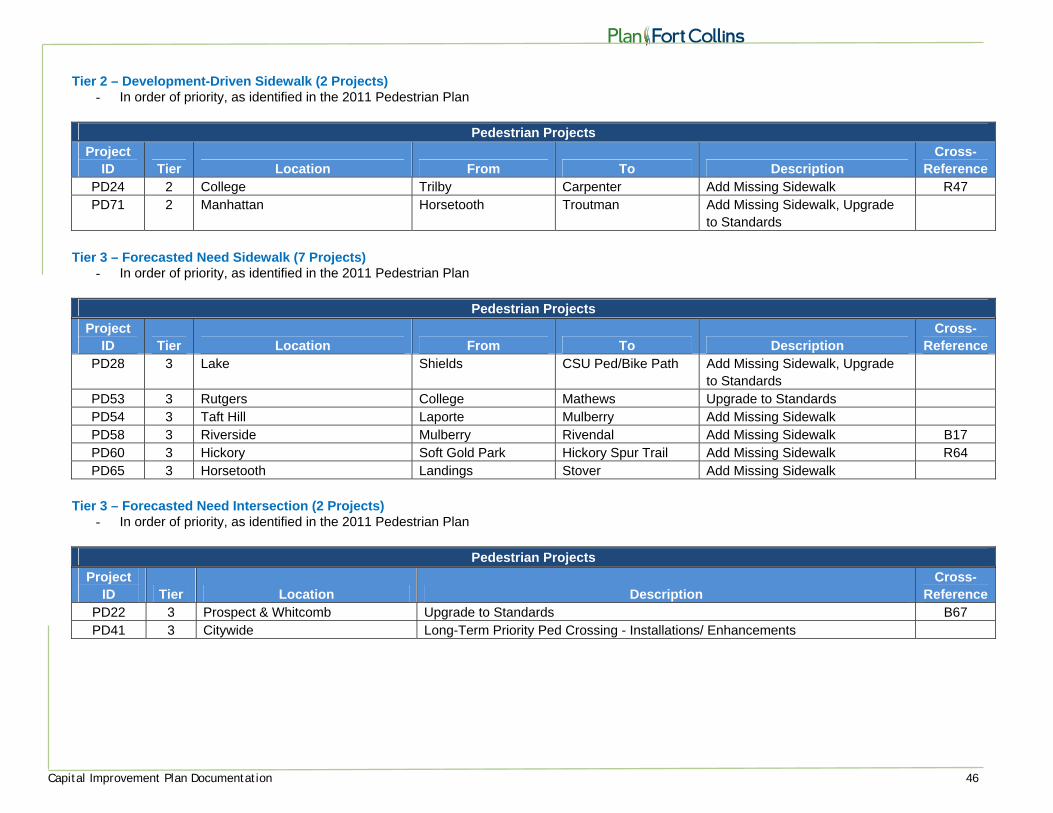
Capital Improvement Plan Documentation 46
Tier 2 – Development-Driven Sidewalk (2 Projects) - In order of priority, as identified in the 2011 Pedestrian Plan
Pedestrian Projects
Project ID Tier Location From To Description
Cross-Reference
PD24 2 College Trilby Carpenter Add Missing Sidewalk R47 PD71 2 Manhattan Horsetooth Troutman Add Missing Sidewalk, Upgrade
to Standards
Tier 3 – Forecasted Need Sidewalk (7 Projects)
- In order of priority, as identified in the 2011 Pedestrian Plan
Project ID Tier Location From To Description
Cross-Reference
PD28 3 Lake Shields CSU Ped/Bike Path Add Missing Sidewalk, Upgrade to Standards
PD53 3 Rutgers College Mathews Upgrade to Standards PD54 3 Taft Hill Laporte Mulberry Add Missing Sidewalk PD58 3 Riverside Mulberry Rivendal Add Missing Sidewalk B17 PD60 3 Hickory Soft Gold Park Hickory Spur Trail Add Missing Sidewalk R64 PD65 3 Horsetooth Landings Stover Add Missing Sidewalk
Tier 3 – Forecasted Need Intersection (2 Projects)
- In order of priority, as identified in the 2011 Pedestrian Plan
Project ID Tier Location Description
Cross-Reference
PD22 3 Prospect & Whitcomb Upgrade to Standards B67 PD41 3 Citywide Long-Term Priority Ped Crossing - Installations/ Enhancements
Pedestrian Projects
Pedestrian Projects
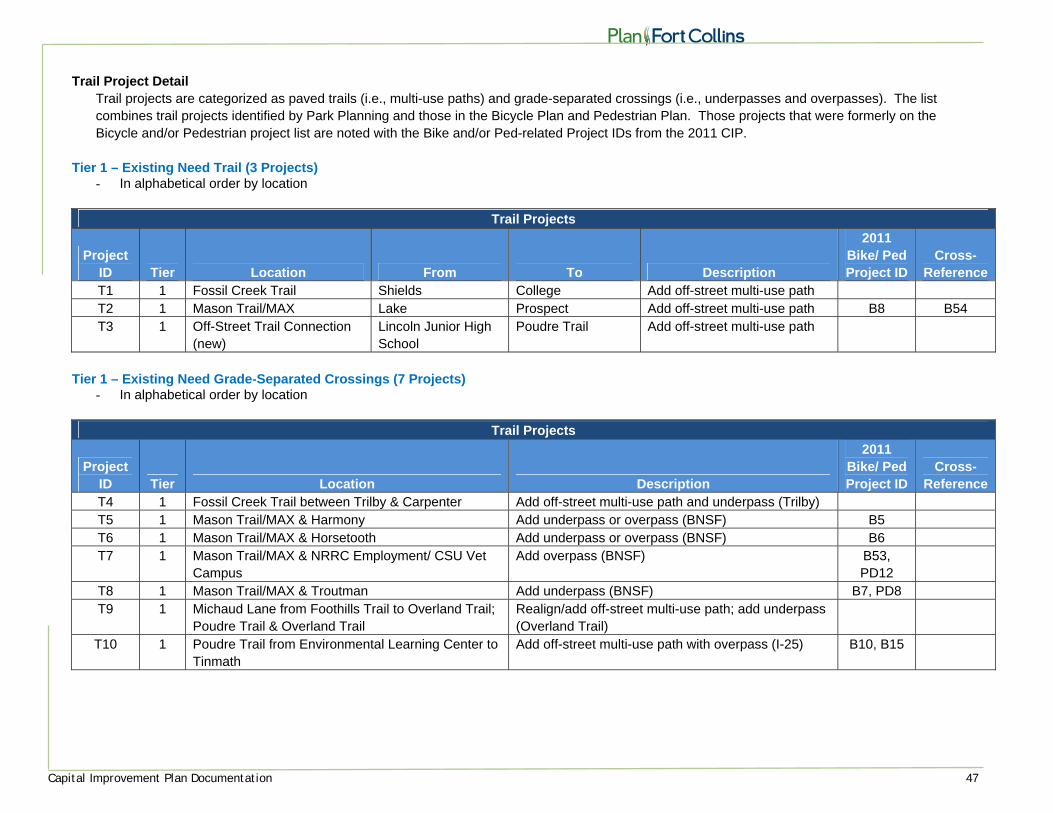
Capital Improvement Plan Documentation 47
Trail Project Detail Trail projects are categorized as paved trails (i.e., multi-use paths) and grade-separated crossings (i.e., underpasses and overpasses). The list combines trail projects identified by Park Planning and those in the Bicycle Plan and Pedestrian Plan. Those projects that were formerly on the Bicycle and/or Pedestrian project list are noted with the Bike and/or Ped-related Project IDs from the 2011 CIP.
Tier 1 – Existing Need Trail (3 Projects)
- In alphabetical order by location
Trail Projects
Project ID Tier Location From To Description
2011 Bike/ Ped Project ID
Cross-Reference
T1 1 Fossil Creek Trail Shields College Add off-street multi-use path T2 1 Mason Trail/MAX Lake Prospect Add off-street multi-use path B8 B54 T3 1 Off-Street Trail Connection
(new) Lincoln Junior High School
Poudre Trail Add off-street multi-use path
Tier 1 – Existing Need Grade-Separated Crossings (7 Projects)
- In alphabetical order by location
Trail Projects
Project ID Tier Location Description
2011 Bike/ Ped Project ID
Cross-Reference
T4 1 Fossil Creek Trail between Trilby & Carpenter Add off-street multi-use path and underpass (Trilby) T5 1 Mason Trail/MAX & Harmony Add underpass or overpass (BNSF) B5 T6 1 Mason Trail/MAX & Horsetooth Add underpass or overpass (BNSF) B6 T7 1 Mason Trail/MAX & NRRC Employment/ CSU Vet
Campus Add overpass (BNSF) B53,
PD12
T8 1 Mason Trail/MAX & Troutman Add underpass (BNSF) B7, PD8 T9 1 Michaud Lane from Foothills Trail to Overland Trail;
Poudre Trail & Overland Trail Realign/add off-street multi-use path; add underpass (Overland Trail)
T10 1 Poudre Trail from Environmental Learning Center to Tinmath
Add off-street multi-use path with overpass (I-25) B10, B15
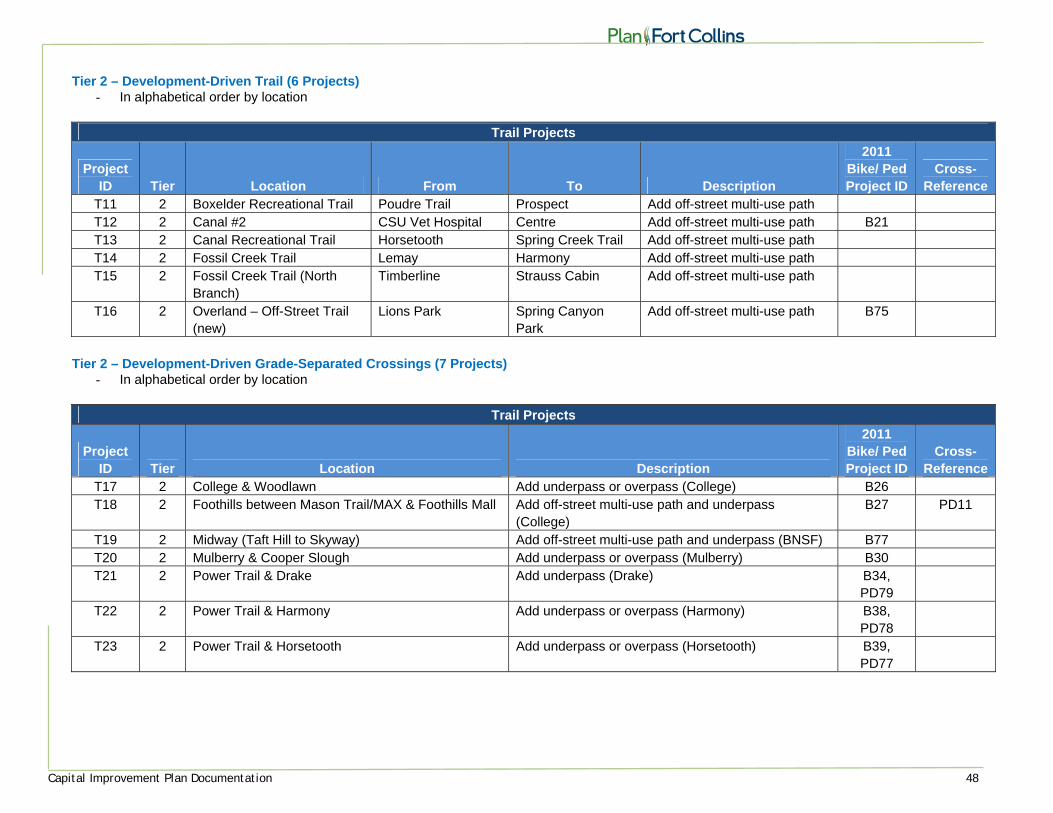
Capital Improvement Plan Documentation 48
Tier 2 – Development-Driven Trail (6 Projects) - In alphabetical order by location
Trail Projects
Project ID Tier Location From To Description
2011 Bike/ Ped Project ID
Cross-Reference
T11 2 Boxelder Recreational Trail Poudre Trail Prospect Add off-street multi-use path T12 2 Canal #2 CSU Vet Hospital Centre Add off-street multi-use path B21 T13 2 Canal Recreational Trail Horsetooth Spring Creek Trail Add off-street multi-use path T14 2 Fossil Creek Trail Lemay Harmony Add off-street multi-use path T15 2 Fossil Creek Trail (North
Branch) Timberline Strauss Cabin Add off-street multi-use path
T16 2 Overland – Off-Street Trail (new)
Lions Park Spring Canyon Park
Add off-street multi-use path B75
Tier 2 – Development-Driven Grade-Separated Crossings (7 Projects)
- In alphabetical order by location
Trail Projects
Project ID Tier Location Description
2011 Bike/ Ped Project ID
Cross-Reference
T17 2 College & Woodlawn Add underpass or overpass (College) B26 T18 2 Foothills between Mason Trail/MAX & Foothills Mall Add off-street multi-use path and underpass
(College) B27 PD11
T19 2 Midway (Taft Hill to Skyway) Add off-street multi-use path and underpass (BNSF) B77 T20 2 Mulberry & Cooper Slough Add underpass or overpass (Mulberry) B30 T21 2 Power Trail & Drake Add underpass (Drake) B34,
PD79
T22 2 Power Trail & Harmony Add underpass or overpass (Harmony) B38, PD78
T23 2 Power Trail & Horsetooth Add underpass or overpass (Horsetooth) B39, PD77
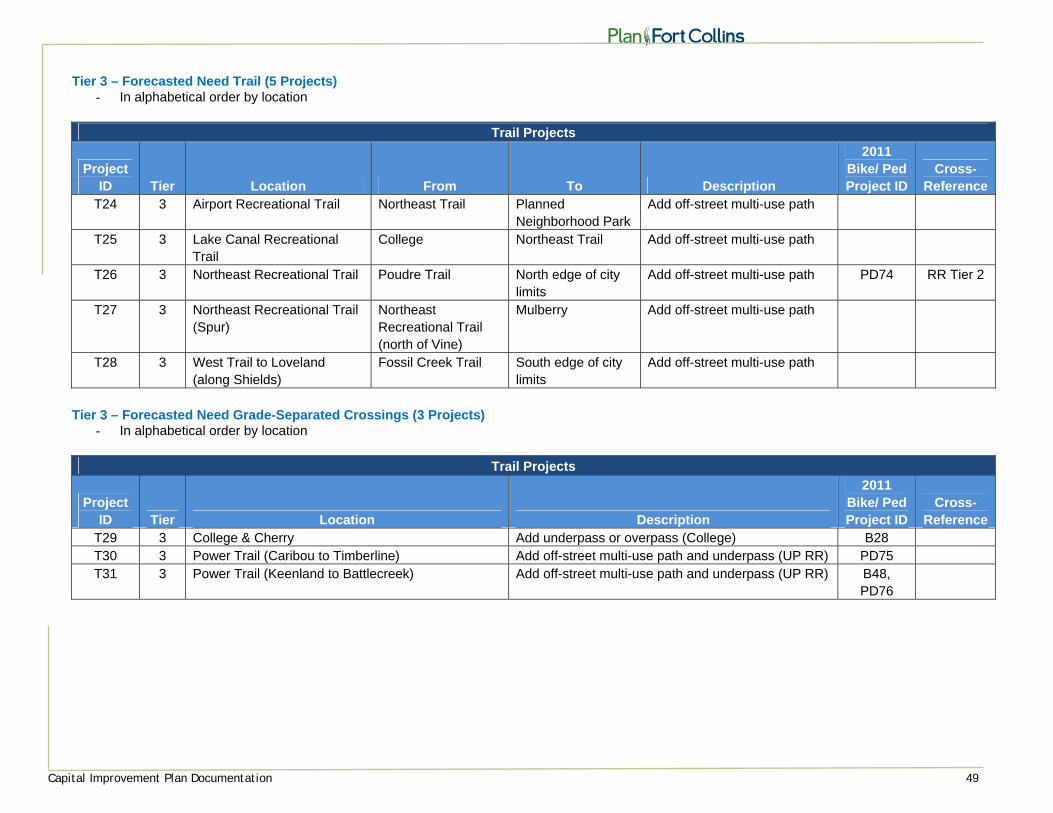
Capital Improvement Plan Documentation 49
Tier 3 – Forecasted Need Trail (5 Projects) - In alphabetical order by location
Trail Projects
Project ID Tier Location From To Description
2011 Bike/ Ped Project ID
Cross-Reference
T24 3 Airport Recreational Trail Northeast Trail Planned Neighborhood Park
Add off-street multi-use path
T25 3 Lake Canal Recreational Trail
College Northeast Trail Add off-street multi-use path
T26 3 Northeast Recreational Trail Poudre Trail North edge of city limits
Add off-street multi-use path PD74 RR Tier 2
T27 3 Northeast Recreational Trail (Spur)
Northeast Recreational Trail (north of Vine)
Mulberry Add off-street multi-use path
T28 3 West Trail to Loveland (along Shields)
Fossil Creek Trail South edge of city limits
Add off-street multi-use path
Tier 3 – Forecasted Need Grade-Separated Crossings (3 Projects)
- In alphabetical order by location
Trail Projects
Project ID Tier Location Description
2011 Bike/ Ped Project ID
Cross-Reference
T29 3 College & Cherry Add underpass or overpass (College) B28 T30 3 Power Trail (Caribou to Timberline) Add off-street multi-use path and underpass (UP RR) PD75 T31 3 Power Trail (Keenland to Battlecreek) Add off-street multi-use path and underpass (UP RR) B48,
PD76
Capital Improvement Plan Documentation 50
Maps Maps showing the location of projects in each category are provided on the following pages. Maps are included for:
Bicycle Projects Bridge Projects Intersection Projects Pedestrian Projects Railroad Projects Roadway/Complete Street Projects Trail Projects Transit Stop Projects
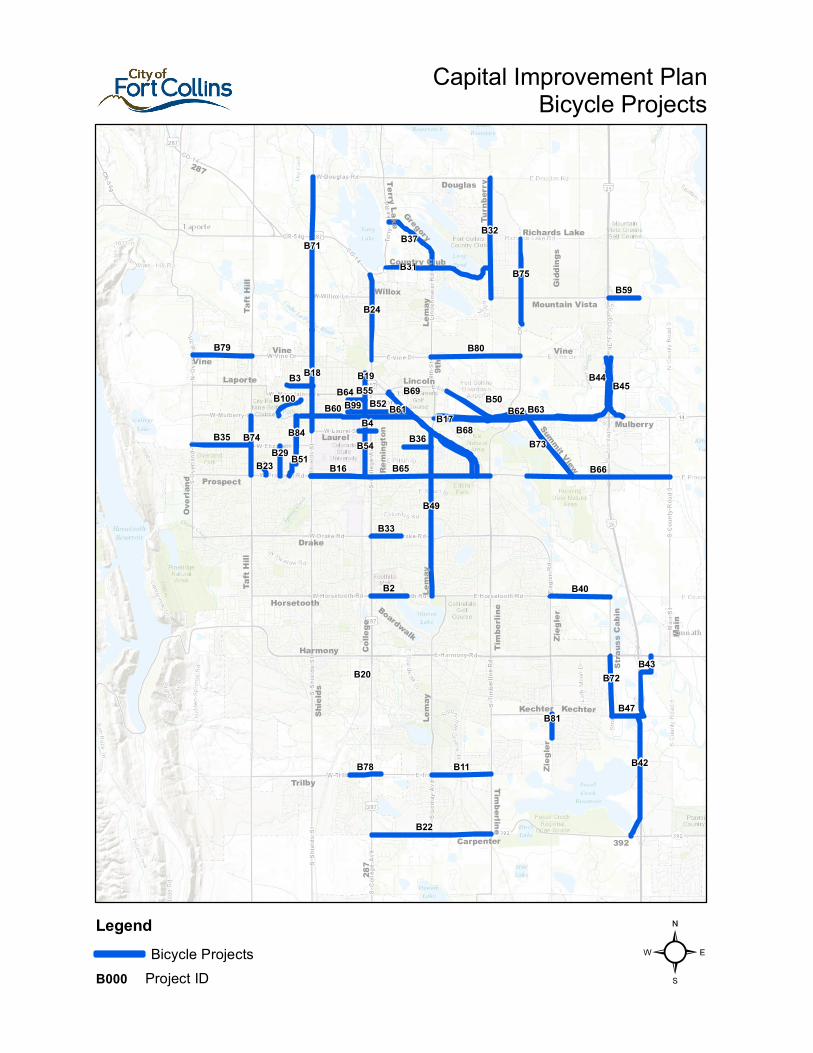
B65
B49
B62 B63
B71
B66
B42
B17
B32
B22
B31
B18
B68
B80
B24
B75
B50
B73B84
B43
B37
B44 B45
B60
B11
B52
B74
B40
B72
B79
B35
B55
B16
B61
B2
B54
B69B3
B78
B59
B33
B29
B47
B36
B81
B4
B64B100
B51B23
B99
B20
B19
Shield
s
Colleg
e
Drake
392
Prospect
Vine
Taft H
ill
Trilby
Overla
nd
Timber
line
Harmony
Douglas
Lemay
Horsetooth
Laporte
Mulberry
287
Ziegle
r
Willox
Lincoln
Carpenter
Main
Turnbe
rry
Country Club
LaurelTerry Lak e
Reming
ton
Richards Lake
Gregory
Mountain Vista
Straus
s Cabi
n
Giddin
gs
9th
Kechter
Summit View
Boardwalk
Vine
Lemay
Timberline
Lemay
287Vine
Taft H
ill
Ziegle
r
Kechter
Capital Improvement PlanBicycle Projects
²Legend
Bicycle ProjectsProject IDB000
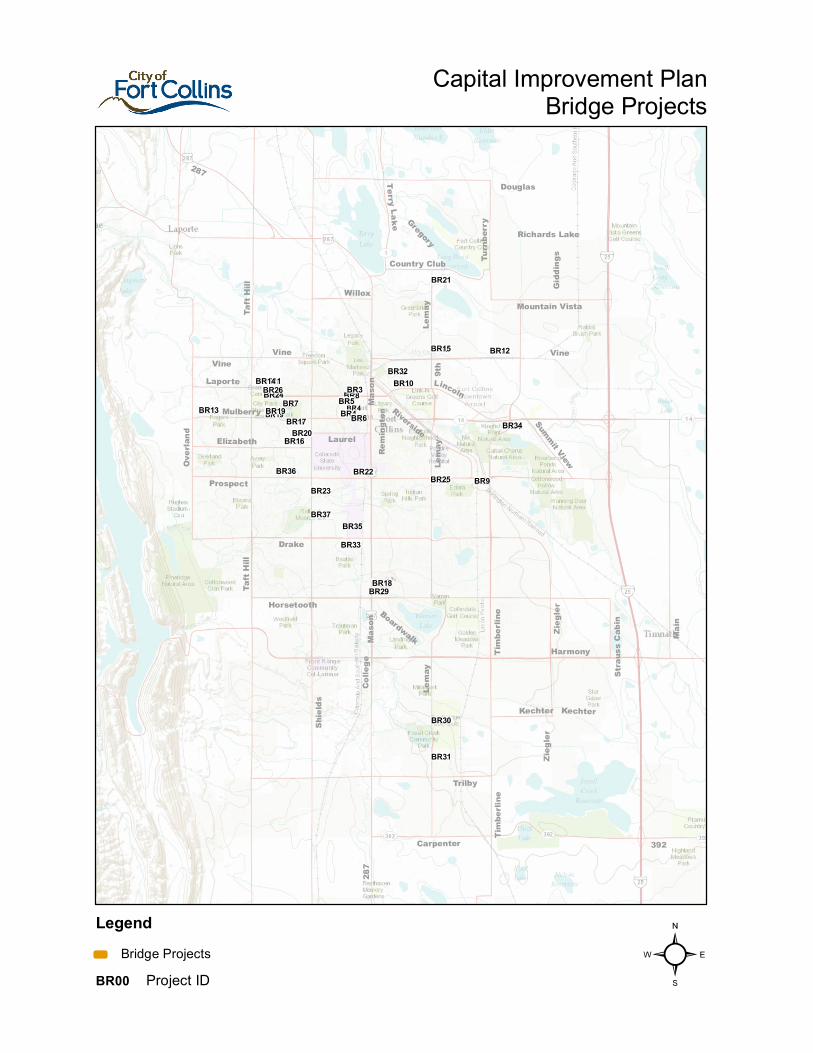
BR9
BR8
BR6BR7 BR4
BR11BR24
BR25
BR32
BR23
BR31
BR29
BR17BR19
BR16
BR15
BR30
BR12
BR34BR13
BR21
BR33
BR22
BR18
BR10
BR5BR3BR26
BR14
BR28BR20
BR27
BR4
BR37
BR36
BR35
Shield
s
Colleg
e
Drake
Mulberry
392
Prospect
Vine
Taft H
ill
Trilby
Overla
nd
Timber
line
Douglas
Lemay
Horsetooth
Laporte
287
Ziegle
r
Willox
Lincoln
Harmony
Carpenter
Elizabeth
Riverside
Main
Turnbe
rry
Mason
Country Club
LaurelTerry Lak e
Reming
ton
Richards Lake
Gregory
Mountain Vista
Straus
s Cabi
n
Giddin
gs
9th
Kechter
Summit View
Boardwalk
Vine
Lemay
Vine
Taft H
ill
Lemay
287Ma
son
Timber
line
Ziegle
r
Kechter
BR9
BR8
BR6BR5BR7
BR3BR11BR24BR26
BR25
BR14BR32
BR23
BR31
BR29
BR17BR19
BR28BR16
BR30
BR12BR15
BR34BR13
BR21
BR33
BR22
BR20
BR18
BR27BR10
Capital Improvement PlanBridge Projects
²Legend
Bridge ProjectsProject IDBR00
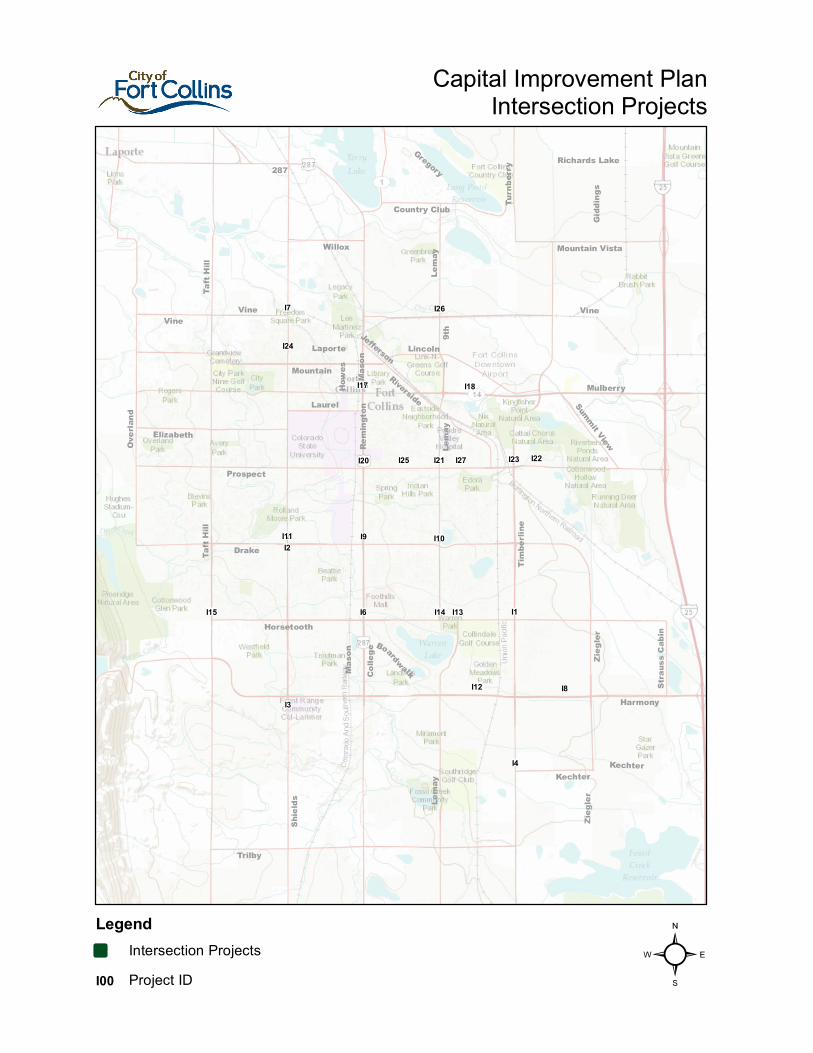
I2I2
I8I3
I4
I9
I1
I7
I6
I5
I20
I16
I15
I21
I14
I25
I19
I22I27
I24
I13
I12
I26
I23
Shield
s
Colleg
e
Drake
Vine
Taft H
ill
Prospect
Trilby
Timber
line
Overla
nd
Horsetooth
Lemay
Laporte
287
Ziegle
r
Willox
Lincoln
Mulberry
Harmony
Elizabeth
Riverside
Mason
Country Club
Laurel
Turnbe
rry
Reming
tonHo
wesMountain
Richards LakeGregory
Mountain Vista
Straus
s Cabi
n
Giddin
gs
9th
Kechter
Summit View
Boardwalk
Jefferson
Vine
Lemay
Lemay
Ziegle
r
Vine
Taft H
ill
Mason
Kechter
I11
I17 I18
I10
Capital Improvement PlanIntersection Projects
²Legend
Intersection ProjectsProject IDI00
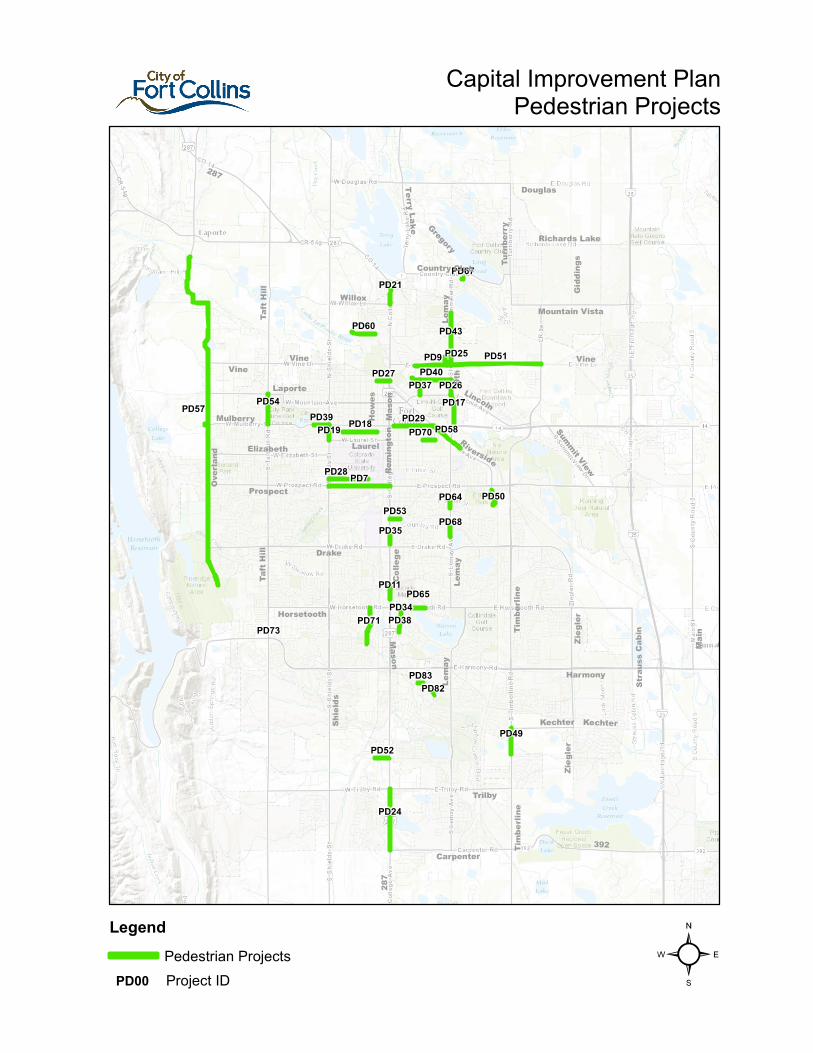
PD57
PD51
PD7
PD24
PD43
PD9
PD29
PD28
PD40
PD71
PD58PD18PD17PD54
PD49
PD60
PD21
PD50
PD26PD37
PD39
PD34
PD19
PD65
PD68
PD52
PD11
PD27
PD70
PD35PD53
PD38
PD25
PD64
PD83PD82
PD67
PD73
Shield
s
Colleg
eDrake
Mulberry
Prospect
Vine
Taft H
ill
392
Trilby
Overla
nd
Timber
line
Douglas
Lemay
Horsetooth
Laporte
287
Ziegle
r
Willox
Lincoln
Harmony
Carpenter
Elizabeth Riverside
Main
Turnbe
rry
Mason
Country Club
Laurel
Terry LakeRem
ington
Howe
s
Richards Lake
Gregory
Mountain Vista
Straus
s Cabi
n
Giddin
gs
9th
Kechter
Summit View
Vine
Lemay
Vine
Taft H
ill
Lemay
287Ma
son
Timber
line
Ziegle
r
Kechter
Capital Improvement PlanPedestrian Projects
LegendPedestrian ProjectsProject IDPD00 ²

RR15
RR16RR14
RR20
RR19
Shield
s
Colleg
e
287
Drake
Mulberry
Prospect
Vine
Taft H
ill
392
Trilby
Overla
nd
Timber
line
Harmony
Douglas
Lemay
Horsetooth
Laporte
Ziegle
r
Willox
Lincoln
Carpenter
Elizabeth
Riverside
Main
Turnbe
rry
Mason
Country Club
LaurelTerr y Lak e
Reming
ton
Howe
s
Richards Lake
Gregory
Mountain Vista
Straus
s Cabi
n
Giddin
gs
9th
Kechter
Summit View
Boardwalk
287
Lemay
VineVine
Timber
line
Lemay
Mason
Taft H
ill
Ziegle
r
Kechter
Capital Improvement PlanRailroad Projects
²Legend
Railroad ProjectsProject IDRR00
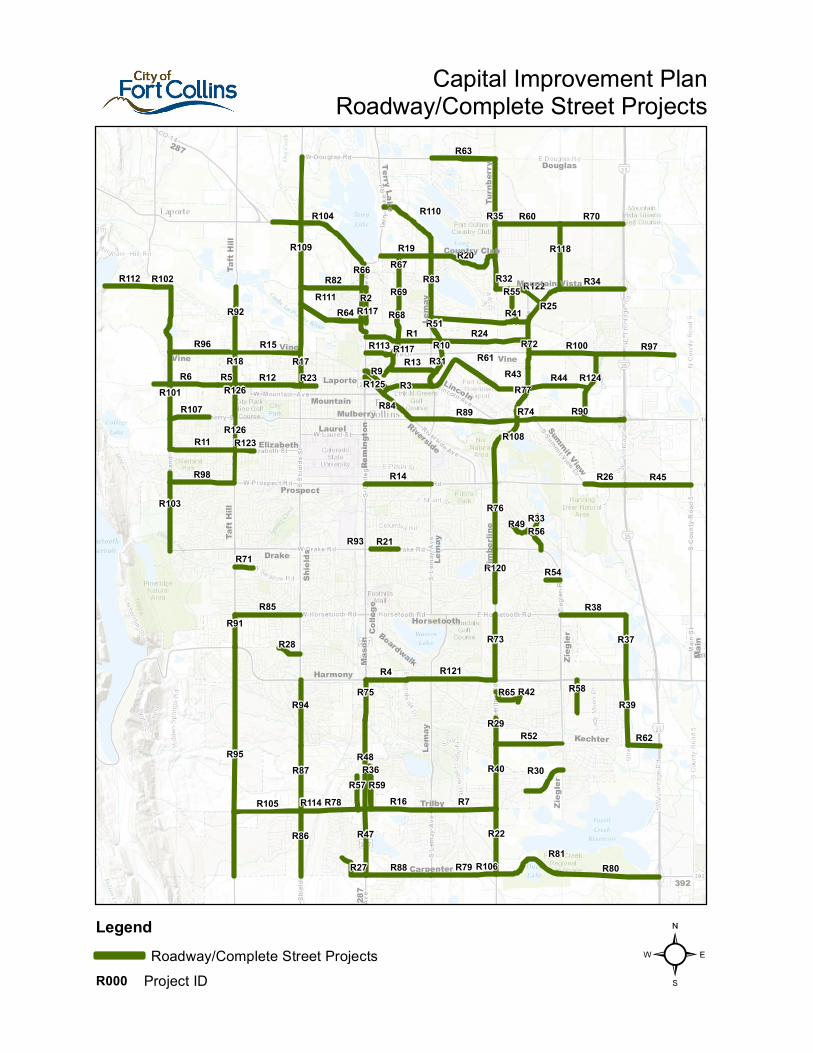
R95
R109
R35
R89
R41R24
R80
R1
R48
R90
R7
R6
R104
R81
R101
R61R100
R20
R121
R3
R25
R11
R52
R16
R88
R47
R12
R73
R94
R76
R102
R45
R22
R87
R82
R86
R85 R38
R60
R14
R39
R79
R78
R15
R40
R98
R92
R37
R96
R70
R63
R34
R110
R83
R103
R108
R77
R4
R118
R105
R124
R19
R44R31
R97
R2
R30
R13R43
R120
R64
R75
R26
R112
R9
R84
R27
R117 R68
R67
R57
R55
R91
R17
R59
R69
R58
R18
R62
R65
R107
R72
R122
R21
R29
R51
R56
R111
R28
R5
R113
R66
R126
R49
R125
R117
R33
R74
R71
R23
R32
R123
R54
R36
R126
R42
R93
R10
R114
R106
Shield
s
Colleg
e
287
Drake
Mulberry
Prospect
Vine
Taft H
ill
392
Trilby
Timber
line
Harmony
Douglas
Lemay
Horsetooth
Laporte
Ziegle
r
Lincoln
Carpenter
ElizabethRiverside
Main
Turnbe
rry
Mason
Country Club
LaurelTerr y Lak e
Reming
ton
Mountain
Mountain Vista
Kechter
Summit View
Boardwalk
287
Lemay
VineVine
Lemay
Taft H
ill
Ziegle
r
Capital Improvement PlanRoadway/Complete Street Projects
²Legend
Roadway/Complete Street ProjectsProject IDR000
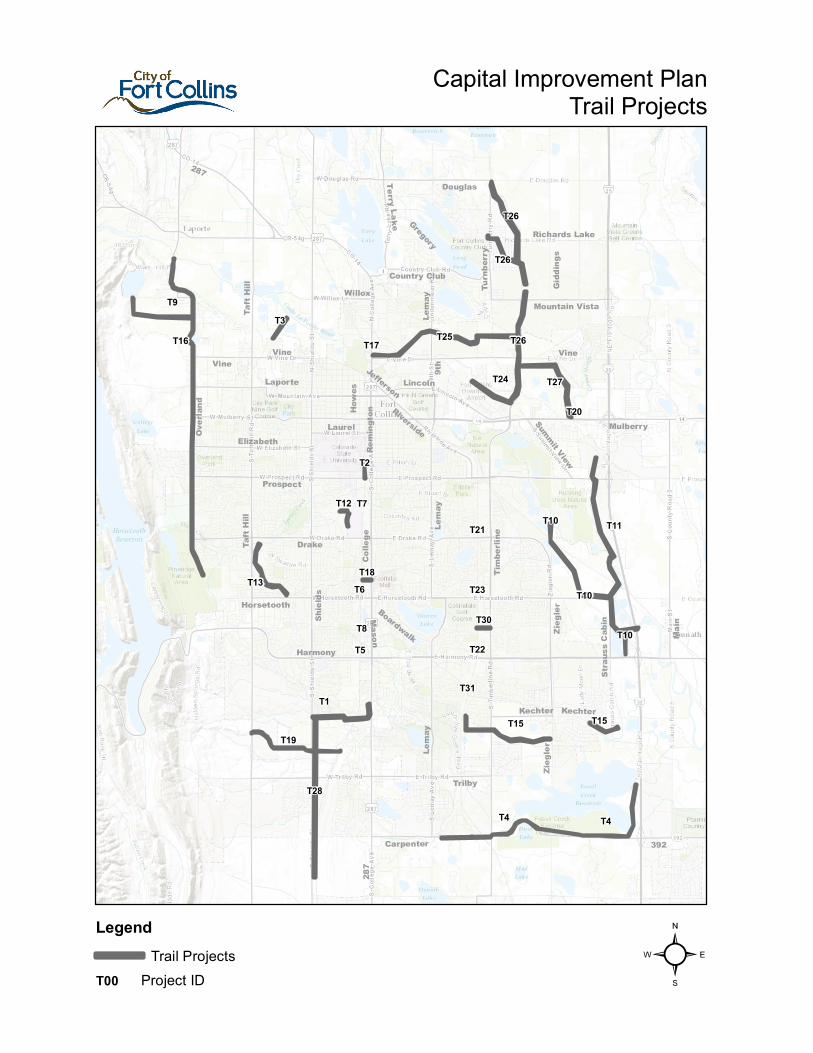
T28
T16 T25
T11
T1
T10
T26
T26
T27
T4
T26
T9
T15
T13
T19
T4
T24
T15
T3
T12
T2
T10T30
T10
T18
T5
T7
T8
T6
T20
T31
T22
T21
T17
T23
Shield
s
Colleg
e
Drake
392
Prospect
Vine
Taft H
ill
Trilby
Overla
nd
Timber
line
Harmony
Douglas
Lemay
Horsetooth
Laporte
Mulberry
287
Ziegle
r
Willox
Lincoln
Carpenter
Elizabeth
Riverside
Main
Turnbe
rry
Mason
Country Club
LaurelTerry Lak e
Reming
tonHowe
s
Richards Lake
Gregory
Mountain Vista
Straus
s Cabi
n
Giddin
gs
9th
Kechter
Summit View
Boardwalk
Jefferson
Vine
Lemay
Vine
Taft H
ill
Lemay
287
Ziegle
r
Kechter
Capital Improvement PlanTrail Projects
²Legend
Trail ProjectsProject IDT00
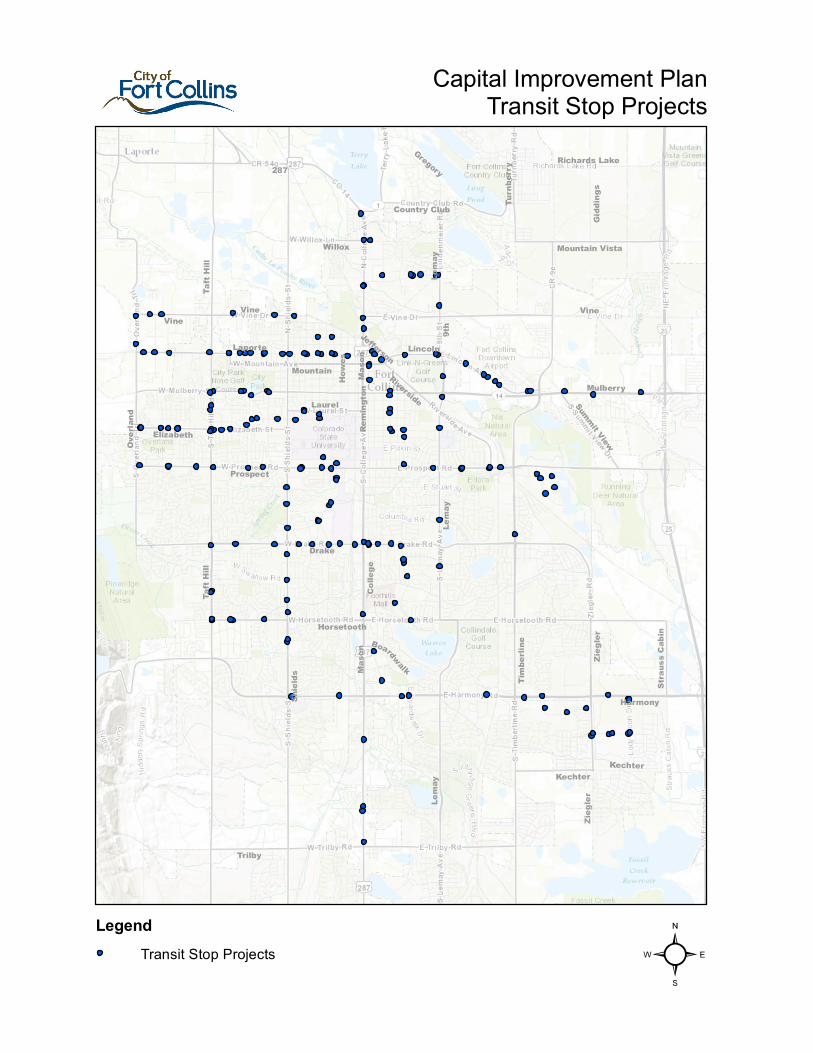
Shield
s
Colleg
e
Drake
Vine
Taft H
ill
Prospect
Trilby
Timber
line
Overla
nd
Horsetooth
Lemay
Laporte
287
Ziegle
r
Willox
Lincoln
Mulberry
Harmony
Elizabeth
Riverside
Mason
Country Club
Laurel
Turnbe
rry
Reming
tonHo
wes
Mountain
Richards LakeGregory
Mountain Vista
Straus
s Cabi
n
Giddin
gs
9th
Kechter
Summit View
Boardwalk
Jefferson
Vine
Lemay
Lemay
Ziegle
r
Vine
Taft H
ill
Mason
Kechter
Capital Improvement PlanTransit Stop Projects
²Legend
Transit Stop Projects