configurations of strategy, structure and …web.mit.edu/bpsmini/2008/peer-c-fiss.pdfconfigurations...
TRANSCRIPT

CONFIGURATIONS OF STRATEGY, STRUCTURE AND ENVIRONMENT:
A FUZZY SET ANALYSIS OF HIGH TECHNOLOGY FIRMS*
PEER C. FISS
Marshall School of Business
University of Southern California
Hoffman Hall 521
Los Angeles, CA 90089-0808, USA
Phone: 213-821-1471
Fax: 213-740-3582
Email: [email protected]
Working Paper – Version 2008-04-21
Please do not quote, cite, or circulate without the permission of the author.
First draft—comments and suggestions welcome.
* The author would like to thank Charles Ragin, Phil Birnbaum-More, Paul Adler, and seminar
participants at the University of Illinois at Urbana Champaign, the Rotterdam School of
Management, the University of Southern California, and the Administrative Sciences Academy
of Canada Conference, Banff, Alberta for their helpful comments on the ideas expressed here. I
gratefully acknowledge financial support from the Social Sciences and Humanities Research
Council of Canada and from the Office of the Provost and the Grant Program for Advancing
Scholarship in the Humanities and Social Sciences at the University of Southern California.

CONFIGURATIONS OF STRATEGY, STRUCTURE AND ENVIRONMENT:
A FUZZY SET ANALYSIS OF HIGH TECHNOLOGY FIRMS
Abstract
Configurations are central to the organizational and strategy literatures and continue to play a
crucial role in understanding the determinants of competitive advantage. However,
configurational theory also faces a number of challenges, including questions regarding the
nature of configurations and the instrumentation used to assess configurational effects. In the
current study, I build on prior work by developing a definition of configurational centrality and
periphery based on how elements of the configuration are causally connected to a specific
outcome, a view that allows for a better assessment of both equifinality and causal asymmetry in
configurations. Using a recent dataset of high technology firms, I empirically investigate
configurations of strategy, structure, and environment using fuzzy set s and Qualitative
Comparative Analysis (QCA). In comparing the results from conventional cluster and deviation
score analyses with fuzzy set analyses, I show how the use of set-theoretic methods helps clarify
mixed findings in the prior literature and that hybrid configurations can lead to high
performance, but very high performance is only achieved by embracing tradeoffs and choosing a
―pure‖ configuration.

1
The study of organizational configurations—―commonly occurring clusters of attributes of
organizational strategies, structures, and processes‖ (Ketchen, Thomas, and Snow, `1993:
1278)—forms a central pillar of both organizational research and the strategic management
literature. Organizational typologies such as those of Burns and Stalker (1961), Etzioni (1961),
Blau and Scott (1962), Perrow (1970), Miles and Snow (1978), Mintzberg (1983), Porter (1980),
and others have figured prominently in both fields of research and continue to draw considerable
attention (e.g. Meyer, Tsui, and Hinings, 1993; Desarbo et al., 2005; Kabanoff and Brown,
2008). Similarly, empirically derived taxonomies that aim to group organizations into clusters
sharing certain characteristics have formed an important stream of research on organizational
configurations (e.g. Pugh, Hickson, Hinings, 1969; Hambrick 1984; Miller and Friesen, 1984).
Although such empirical classifications have recently enjoyed less attention than the
theoretically derived typologies that lend themselves more readily to theory testing, taxonomies
continue to exert an important influence on empirical research (e.g. Corso et al., 2003; Uhl-Bien
and Maslyn, 2003; Lim, Acito, and Rusetski, 2006).
The continuing attention to configurational theories stems to a large extent from the fact
that such theories are theoretically attractive to organizational researchers for a number of
reasons. Because of their multidimensional nature, they acknowledge the complexity and
interdependent nature or organizations where fit and competitive advantage frequently rests not
on a single attribute but instead resides in the relationships and complementarities between
multiple characteristics (e.g. Miller, 1996; Porter, 1996; Siggelkow, 2001). As such, they are
more likely to lead to comprehensive explanations that account for a world where outcomes are
more often than not multiply determined, resulting in integrative theories that aim to model
systematic interconnections of organizational characteristics and multiple causal directions

2
linking structure, strategy, and environment (Child, 1972; McPhee and Scott Poole, 2001).
Configurational approaches are also helpful for both academic researchers and practitioners since
they provide handy shortcuts for these systematic interconnections by simplifying them into a
few typified and easy to remember profiles or Gestalten (McPhee and Scott Poole, 2001). While
these ideal types will arguably not always be consistent with the data at hand, they nevertheless
provide a useful shorthand for more complex phenomena and thus frequently prove useful as
heuristics (Mintzberg, 1979).
Finally, configurational theories are relevant to theory building because they focus our
attention towards the concept of equifinality, that is, the notion that ―a system can reach the same
final state from different initial conditions and by a variety of different paths‖ (Katz and Kahn,
1978: 30). This idea of equifinal configurations has more recently received increasing attention
in the management literature (e.g. Doty, Glick, and Huber 1993; Gresov and Drazin, 1997;
Payne, 2006; Fiss, 2007; Marlin et al., 2007). Equifinality in organizations may for instance arise
when different structural design alternatives are available to deal with environmental
contingencies, resulting in the same functional effect (Gresov and Drazin, 1997). The concept is
arguably very promising for organizational and strategy research in explaining the persistence of
a variety of design choices that can all lead to the desired outcome, offering considerable
promise to organization theory (e.g. Ashmos and Huber, 1987).
However, for all their theoretical attractiveness, configurational theories also face some
unique challenges. The same features that make configurational theories so attractive to
researchers and practitioners—namely, their ability to marrying complexity with parsimony—
also lead to some of their greatest disadvantages. Perhaps most importantly in this regard,
configurational theories tend to be based on a logic of consistency—that is, they are usually

3
based on the notion of fit between the different parts that make up the organizational
configuration. This fit is commonly the result of one of two mechanisms. First, fit can be based
on internal, adaptive learning about how the various elements of the organization are best
configured so that engaging in one type of activity will increase returns from another one (Miller,
1990; Milgrom and Roberts, 1995). Second, fit may be based on an external, environmental
selection mechanism such as organizational birth and death due to e.g. market competition,
which reduces variation in organizational configurations to a smaller number of viable forms
(e.g. Hannan and Freeman, 1977, 1984). Regardless of the mechanism, the logic of consistency
may in fact frequently be too strong an assumption. Existing configurations are likely to contain
inconsistencies, tradeoffs, and irrelevant elements, yet teasing apart the causally relevant
characteristics from those that are causally irrelevant is challenging both theoretically and
empirically. For instance, not all parts of a configuration are likely to be equally important. The
question thus is, what really matters in a configuration, and what are peripheral aspects? In other
words, configurations are likely to consist of a core and a periphery, where core elements are
essential while peripheral elements are less important and perhaps expendable or exchangeable
(Hannan, Burton, and Baron, 1996). Most prior typologies have neglected such consideration by
asking us to accept the typology in toto. Although a holistic approach is thus a strength of
configurational theories, theorizing is more likely to end once a configuration is identified, thus
limiting our understanding as to what causal mechanisms are at work and is driving the effect
(Reynolds, 1971; McPhee and Scott Poole, 2001).
Furthermore, configurational theories have also faced challenges due to insufficient
instrumentation. For instance, Gresov and Drazin (1997) discuss qualitative research, surveys,
and factor analysis as several ways to examine the degree of consistency of an organizational

4
configuration, yet each of these methods is quite limited in its ability to accomplish this. As a
result, when tradeoffs in configurations due to inconsistencies have been theorized, they have so
far rarely been tested (Gresov and Drazin, 1997). Similarly, the concept of equifinality remains
underutilized in empirical research since testing for equifinal effects is not easily accommodated
within the standard framework of linear modeling (Gresov & Drazin, 1997; Fiss, 2007). These
challenges are amplified by data needs that include a considerable number of measures to assess
the multidimensional nature of organizational configurations. As a result, most prior research has
focused on contingency arguments and has rarely tested theories that concern the simultaneous
effects of strategy, structure, and environment, examining for instance partial aspects of a
configuration such as fit between structure and strategy or between strategy and environment.
To overcome these challenges, some authors have recently tried to shed a new light on
the fundamental question as to how organizational configurations are structured and what is the
relationship between their elements. For instance, Siggelkow (2002) has argued it is necessary to
develop a better understanding of what the nature of core elements in organizational
configurations is. In pointing out that the organizational literature contains no agreement as to
what particular elements constitute the organization‘s core, he notes that there is agreement that
core elements feature a high interdependency with other organizational elements and exert a
large influence on future organizational elements. He accordingly defines ―coreness‖ as
connectedness and an organizational core element as ―an element that interacts with many other
current or future organizational elements‖ (Siggelkow, 2002: 126-127). Core elements of a
configuration are thus surrounded by a series of elaborating elements that reinforce these central
features.

5
In the current paper, I build on this prior work that aims to develop a better understanding
of how configurations are structured. Extending Siggelkow‘s understanding of the core and
periphery of a configuration as based on the notion of centrality within a network of
configurational elements, I suggest a definition of coreness based on what elements are causally
connected to a specific outcome. Accordingly, I define core elements as those causal conditions
that are necessary or sufficient elements of a configuration exhibiting the outcome of interest. In
contrast, peripheral elements are those where the evidence for a causal relationship with the
outcome is weaker. While maintaining a concern for what makes elements central, this
understanding shifts the focus from the connectedness to other organizational elements to the
causal role they play within the configuration relative to the outcome.
Shifting the focus from connectedness with other organizational elements to the causal
relation between configurational elements and the outcome in question has several advantages.
First, it fits closely with the central concern of organization theory that core elements are those
that are important to organizational survival (e.g. Singh, House, and Tucker, 1986; Romanelli
and Tushman, 1994). In contrast, connectedness to other organizational elements may frequently
be related to outcomes but such connectedness presents only an indirect measure of this
relationship.
Second, by basing the a focus on the causal relationship between configurational
elements and the outcome in question, the current approach redirects the study of configurations
towards the concept of equifinality. Specifically, causal centrality and periphery emphasizes the
idea of several causal paths to an outcome. Specifically, the current approach enriches the study
of equifinal configurations through the notion of neutral permutations of a given configuration,
that is, within a given configuration the core causal condition may be surrounded by more than

6
one constellation of different peripheral causes, with the permutations not affecting the overall
performance of the configuration. The concept goes beyond the current concept of equifinality as
different paths to the outcome by pointing to the fact that while different permutations may be
equifinal regarding the outcome, they are not equifinal regarding future states of development
(Stadler et al., 2001). As such, an understanding of the causal nature of a configuration is
essential for understanding trajectories of organizational change, an issue that has largely been
neglected in the study of configurations.
Finally, the notion of centrality based on causal necessity and sufficiency rather than a
correlation between the configuration and performance is attractive because it assumes causal
asymmetry (Ragin, 2008), that is, the idea that the causes leading to an outcome may be quite
different from those leading to the absence of the outcome. In contrast, a correlational
understanding of causality assumes causal symmetry since correlations are by their very nature
symmetric. For instance, if one were to model the inverse of the outcome the question, then the
results of a correlational analysis will be unchanged except for the sign of the coefficients.
However, a causal understanding of necessary and sufficient conditions is causally asymmetric,
that is, the set of causal conditions leading to the outcome may frequently be different from the
set of conditions leading to the absence of the outcome. Shifting to a causal understanding of
configurations allows for differing sets of causal conditions leading for instance to average
performance, high performance, and very high performance. For the study of organizational
configurations, this suggests that ―coreness‖ may change relative to different levels of the
outcome, allowing for different configurations as one moves from e.g. average performance to
high and very high levels of performance.

7
The definition proposed here, which views core elements of a configuration as causally
defined, draws on prior work that has aimed to place the concepts of causal necessity and
sufficiency at the center of theory building and analysis (e.g. Ragin, 1987; 2000). Specifically, it
suggests that causal relations in organizations as well as the social world more broadly are
usually better understood in terms of set-theoretic relations rather than correlations (Ragin, 1987;
2000; 2008; Fiss, 2007; Ragin and Fiss, 2008). To show its utility and how using a different
instrumentation may allow for a much more fine-grained understanding of organizational
configurations, I conduct an analysis of configurations of structure, strategy, and environment
among a sample of UK high technology firms. In comparing the results from both conventional
taxonomic and typological analyses with an analysis focusing on causal necessity and
sufficiency, I aim to demonstrate the added value of the approach outlined here for both
organizational studies and strategy research.
CONFIGURATIONS AND THE MILES & SNOW TYPOLOGY
In the current study, I draw on the Miles and Snow typology of generic organizational
configurations (Miles and Snow, 1978; 2003). As a framework to study configurations and their
nature, this typology is particularly attractive for a number of reasons. First, it among the most
widely used typologies of organizations, and a number of the classic studies on configurations
have tested it and found considerable support for it (e.g. Hambrick, 1983; Doty, Glick, and
Huber, 1993; Ketchen, Thomas, and Snow, 1993). In fact, as Hambrick (2003) has noted, is
presents one of the most widely tested, validated, and enduring strategy frameworks over the last
25 years, with researchers finding strong and consistent support for the typology across a variety

8
of settings ranging from hospitals to industrial products and life insurance. Moreover, the Miles
and Snow typology has recently enjoyed renewed attention, with several studies revisiting it to
generate new knowledge (e.g. Slater and Olson, 2000; Desarbo et al., 2005; Kabanoff and
Brown, 2008). Finally, the framework is attractive for my current purposes because it explicitly
links assumptions that cross several domains, including organizational structures, strategies, and
their relationship to the environment. In sum, given its wide usage and continued relevance
(Ghoshal, 2003), it is particularly suitable for examining the configurational model presented
here.
Miles and Snow‘s typology is based upon three organizational types which they label the
Prospector, Analyzer, and Defender. A fourth type, the Reactor, is largely a residual type since in
contrast to the previous three types the Reactor ―lacks a consistent strategy-structure
relationship‖(Miles and Snow, 2003: 29) and thus rather presents an instance of strategy absence
rather than a viable strategy (Zajac and Shortell, 1989; Inkpen and Chowdhury, 1995). Table 1
provides an overview of the three ideal type profiles of Prospector, Analyzer, and Defender as
they relate to structure and strategy.
----- Insert Table 1 about here -----
The Prospector is typically a small but growing organization continually in search of new
product and market opportunities. Change is a prime challenge for this organization, and the
administrative challenge is thus how to facilitate rather than control operations. Accordingly,
Prospectors tend to score relatively low in regards to formalization and centralization. The need
to alter the organizational structure in response to a changing environment means that
Prospectors tend to have a less extensive division of labor and flatter organizational structures,

9
resulting in lower degrees of organizational complexity.1 In terms of their strategy, their focus on
innovation and product features makes them highly similar to Porter‘s differentiators, while the
same features mean they score low regarding a cost leadership strategy (e.g. Miller, 1986, Segev,
1989; Parnell, 1997).
In contrast, the Defender is more typically a large and established firm that aims to
protect its prominence in a product market. While the Prospector is focused on change, the
Defender is focused on stability, which is reflected in its organizational structures. Management
usually aims for highly centralized control of the organizational operations and more often use
formalized processes and policies to specify the appropriate behaviors for organizational
members. Defenders are usually marked by an extensive division of labor and a greater number
of hierarchies, indicating a higher degree of administrative complexity. In terms of their strategy,
Defenders typically pursue a cost leadership rather than a differentiation strategy (Miller, 1986;
Segev, 1989).
As Miles and Snow now, Prospectors and Defenders ―reside at opposite ends of a
continuum‖ of strategies, while the Analyzer lies ―between these two extremes‖(Miles & Snow,
2003: 68). Table 1 reflects this in showing the Analyzer taking an intermediate position between
Prospectors and Defenders in terms of its structural attributes and strategy, with the exception of
its complexity. The reason for this lies in the hybrid nature of the Analyzer, which has to be able
to accommodate both stability and change, indicating that the ideal profile of analyzers will be
marked by very complex structures (Miles and Snow, 2003: 79).
1 The definition of organizational complexity I use here calculates complexity as the product of horizontal and
vertical differentiation (Singh, 1986; Wong and Birnbaum-More, 1994). My conceptualization of Prospectors having
a low degree of administrative complexity is thus consistent with Miles and Snow‘s characterization of Prospectors‘
use of coordinators or integrators to coordinate across ―organic‖ structures using e.g. project groups. As Miles and
Snow note, such coordination challenges are arguably also complex, albeit in a different manner.

10
Regarding the performance of the three types described by Miles and Snow, the literature
has offered conflicting results. For instance, Hambrick (1983) found that analyzers tended to
outperform both prospectors and defenders on performance measures such as return on
investment and market share and suggested that ―in general the ‗superior‘ strategy was neither of
the two extreme strategies‖ (Hambrick, 1983: 18). Similarly, Kabanoff and Brown (2008) found
that analyzers performed relatively well in profitability when compared to the other types, as did
Snow and Hrebiniak (1980), although they caution that the sample size for this strategic type was
relatively small. These findings would suggest that taking a middle position that ―combines the
strengths of both the Prospector and the Defender into a single system‖ (Miles and Snow, 2003:
68) would result in relatively higher levels of organizational performance relative to the extreme
types.
In contrast to these findings, other authors have pointed to the importance of tradeoffs in
strategy. For instance, Porter (1980; 1995) has argued that differentiation and cost leadership can
be combined only on rare occasions. As a result, organizations should pursue either a
differentiation or cost leadership strategy but should not try to combine both strategies to avoid
getting ―stuck in the middle‖ with relatively lower performance. The rationale for this argument
is that both strategies usually involve specific tradeoffs in terms of e.g. production processes,
product positioning, and administrative structures, and aiming to take a middle position on these
tradeoffs and thus failing to align with either strategy will result in low profitability. As Desarbo
et al. (2005) point out, more research is thus needed on the topic of strategic type and
performance. In the current study, I revisit the question regarding the relative performance of
Prospectors, Defenders, and Analyzers by aiming to show what causal factors and tradeoffs

11
actually result in improved firm performance. Building on the notion of tradeoffs within
organizational configurations thus leads to the first research question:
Research Question 1: Do firms fitting the Prospector or Defender type outperform firms fitting
the Analyzer type and what accounts for the relationship between configurational types and
performance?
Another important aspect of the Miles and Snow typology relates to whether the typology is
universally applicable across environments or whether it is context dependent. For instance,
Hambrick (1983: 7) notes that the generic character of the typology ignores industry and
environmental peculiarities, while Zajac and Shortell (1989: 413) similarly point out that Miles
and Snow‘s notion of generic strategies tends to ―assume that the various strategies are equally
viable across environmental contexts and, by implication, across time.‖ Building on the notion
that strategy selection is usually dependent on the environment (e.g. Hofer and Schendel, 1978),
these researchers have instead argued that the performance of Prospectors, Defenders, and
Analyzers will depend on the fit of these configurations with the environment they operate in
(e.g. Govindarajan, 1986). In this regard, Hambrick (1983) found that Prospectors performed
better in innovative environments while Defenders performed worse in such environments.
Similarly, Zajac and Shortell report that Defenders were significantly less profitable than other
generic strategies in environments calling for proactive strategies. However, as Desarbo et al.
(2005) point out, there are very few studies that have empirically examined this relationship
between the nature of the environment and strategic type. In fact, apart from the study of Doty,
Glick, and Huber (1993), no other research appears to have simultaneously examined
configurations of organizational structure, strategy, and environment. This leads to the second
research question:

12
Research Question 2: What is the relationship between Prospector, Defender, and Analyzer
types and the nature of the environment and how does it affect firm performance?
Finally, answers to the questions outlined here are to a considerable extent influenced by the
analytical approach used. So far, apart from self-typing, two main approaches have been used to
study the Miles & Snow typology and its relationship to performance. The first is inductive in
nature and primarily uses cluster analysis to derive an empirical solution (e.g. Ketchen, Thomas,
and Snow, 1993). The second approach is deductive and uses deviation score analysis to examine
the fit with a theoretically defined profile (e.g. Doty, Glick, and Huber, 1993). Which approach
and analytical method provides superior results has been contested in the literature. For instance,
Ketchen et al. (1993) find that deductively defined configurations were considerably superior to
inductively defined configurations in predicting performance differences. In contrast, Hambrick
has questioned the ability of deductive typologies to accurately describe reality as ―they may
serve for descriptive purposes but have limited explanatory or predictive power‖ (1984: 28).
Likewise, Desarbo et al. (2005) have pointed to the advantages of an empirically derived solution
based on a clustering procedure and report that their solution also outperformed a classification
based on self-typing regarding the Miles and Snow types.
Furthermore, both cluster analysis and deviation score approaches face difficulties
regarding their ability to provide insights into the causal nature of the configuration, that is, they
are not well suited to shed light on just what aspect of a configuration leads to e.g. high
performance (Fiss, 2007; 2008). For instance, cluster analysis assigns cases to clusters based on
their similarity along a number of characteristics regardless of the relationship between these
characteristics and outcomes of interest. However, in situations where not all characteristics

13
included in the analysis are in fact causally relevant regarding the outcome (which is likely to be
the rule rather than the exception), cluster analysis will not be able to distinguish between these
characteristics. If cases are similar along causally irrelevant characteristics but differ along a few
but causally important characteristics, cluster analysis will nevertheless usually assign these
cases to the same cluster, resulting in undesirable causally heterogeneous clusters that are
undesirable. Accordingly, while cluster analysis is an excellent exploratory tool for discovering
structures in the data without specifying a priori what those structures might be, it is a much less
useful tool for understanding what aspects of clusters are causally related to the outcome.
Deviation score analyses likewise face challenges in examining what aspects of the fit
between a hypothesized ideal type and empirically observed configuration in fact relate to
performance. In this respect, Doty et al. (1993) use canonical analysis to examine what measures
of their configurational model had the strongest relationship with model fit, but while such an
approach is preferable to cluster analysis it is still quite limited in its ability to determine
contextually dependent causal relations within a configuration. In addition, deviation score
analyses like cluster analyses exhibit a considerable sample dependence regarding in how
profiles are derived (e.g. Drazin and Van de Ven, 1985) and face reliability issues (Gupta &
Govindarajan, 1993).
In the current paper, I aim to offer a fresh view of these issues by using set-theoretic
methods for studying cases as configurations. The current study builds on the set-theoretic
methods first introduced by Ragin (1987) and extended by Ragin (2000, 2008) and Ragin & Fiss
(2008). I argue that set-theoretic methods such as fuzzy set Qualitative Comparative Analysis
(fs/QCA) are uniquely suitable for configurational theory as such methods explicitly
conceptualize cases as combinations of attributes and emphasize that it is these very

14
combinations that give cases their unique nature. Set-theoretic methods thereby differ from
conventional, variable-based approaches in that they do not disaggregate cases into independent,
analytically separate aspects but instead treat configurations as different types of cases. These
features make set-theoretic methods particularly attractive for organizational and strategy
researchers, as indicated by several recent studies that have argued for applying QCA and fuzzy
sets in organizational settings (e.g. Jackson, 2005; Fiss, 2007, 2008; Greckhamer et al., 2008;
Pajunen, 2008). The methodological approach used here thus sheds new light on the causal
relationship between the characteristics of a configuration and the outcome of interest. Drawing
on these set-theoretic methods, I thus aim to show how instrumentation can affect what we may
learn about a configuration, leading to the third research question:
Research Question 3: How do method and instrumentation affect results for Prospector,
Defender, and Analyzer types and does a fuzzy set approach offer an improved understanding of
causal relationships here?
STUDY DESIGN AND METHODS
For this study, I selected a recent dataset of 205 high-technology manufacturing firms in the UK
(Cosh et al., 2002). The data were collected in 1999 via a survey sent to the CEOs and managing
directors of these firms as part of a research project that examined strategy in the context of
changing environmental conditions. The data are particularly useful for my purposes for several
reasons. First, the dataset contains a rich set of measures on the firms‘ strategy, structure,
environment, and performance, thus allowing me to examine the effectiveness of different
configurations. Second, the data are restricted to manufacturing firms, assuring comparability
regarding operations by excluding for instance service firms that frequently have very different
operational requirements. Third, while the data come from the high technology manufacturing

15
sector, they include firms operating in several industries, thus offering variety in terms of the
velocity and uncertainty of the competitive environment that is not available in a single industry
study. Finally, the data are unusual in that they offer actual financial performance data as
opposed to perceived performance data relative to competitors, thereby assuring greater
comparability.
While the data are uniquely appropriate for the current study, they also have some
limitations. The survey‘s response rate of 14 percent was somewhat lower than is usually
desirable, although it is still slightly above the 10-12 percent response rate that is typical for
surveys mailed to U.S. CEOs (e.g. Hambrick et al., 1993; Geletkanycz, 1997). For confidentially
reasons, the original investigators were not able to provide response bias analyses or the firm
names, and I could therefore not conduct my own analyses. However, response bias is less of a
threat to validity than usual in the current study for at least two reasons. First, my interests are
not with the UK high technology sector per se, but I instead use the data as the setting to test
arguments relating to configurational theory. Accordingly, even if there was some response bias
(for instance, if a greater number of smaller or high-performing firms responded), this would not
threaten the validity of the findings because the focus of the current study is on configurations
and not on the actual population or representativeness of the sample. Nevertheless, the final
sample included firms with considerable variation in terms of size, performance, structure, and
environment, indicating that the sample is likely representative of the underlying population.
Second, the non-parametric nature of fs/QCA as a method of analysis should further alleviate
concerns about sample bias. Finally, some of the most influential and path breaking studies such
as those of Ketchen et al. (1993) and Doty et al. (1993) have used non-random samples of
organizations selected based on geographical proximity and social contacts, indicating that

16
random samples are not an essential feature of the current research context. In sum, the
advantages of the data heavily outweigh their limitations, making them a useful setting to test
configurational arguments.
Outcome measures
The primary outcome of interest in my study is organizational performance, measured as
return on assets (ROA), and calculated as pre-tax profits (losses) before deduction of interest and
directors' emoluments divided by total assets. I calibrate this measure by benchmarking it to
overall performance of the high technology manufacturing sector rather than using a sample-
dependent anchor such as the mean for firms in the sample. Data on average industry
performance in the UK high technology manufacturing sector came from ICC Business Ratio
reports, various years. I averaged ROA across for the main industries in this sector, such as
manufacturers of computer equipment, printed circuits, scientific and electronic instruments,
electronic component manufacturers, and the aerospace industry. The average ROA for the
sector was 7.8%, which is very similar to a median ROA of 7.2% for the US high technology
sector in the same time period. While data regarding the variation in performance was very
limited in the UK sector, I use upper and lower quartile information for the US sector. These data
came from RMA Annual Statement Studies.
I create two fuzzy set measures of above average firm performance. The first,
membership in the set of high performing firms, was coded 0 if a firm showed average or below
average performance (ROA ≤ 7.8%, i.e. about 50th
percentile) and was coded 1 if the firm
showed high performance (ROA ≥ 16.3%, i.e. 75th
percentile or higher). As the crossover point, I
chose the halfway mark of about 12%. The second set, membership in the set of very high

17
performing firms, was again coded 0 if a firm showed average or below average performance
(ROA ≤ 7.8%, i.e. about 50th
percentile) and but was coded 1 if the firm showed an ROA of
25%—arguably very high performance in the eyes of most analysts. As the crossover point for
very high performance, I chose an ROA of 16.3% (i.e. the 75th
percentile or full membership in
the previous set of high performing firms).
Further, to examine issues of causal symmetry or asymmetry, I also created a measure of
membership in the set of firms with not high performance. This measure is coded as the negation
of the measure of high performance described above. Note that this measure takes a value of 1 if
a firm has average or below average performance and a value of 0 if the firm has high
performance.
Independent Measures
I assess organizational structure using four different measures usually employed with the
Miles and Snow typology as well as other classic studies of organizational structure (e.g. Pugh et
al., 1968). The first one, formalization, is measured using a set of nine survey items that assess to
what extent a firm e.g. uses formal policies and procedures guide decisions, in how far
communications are documented by memos, whether reporting relationships are formally
defined, and whether plans are formal and written. The items were measured on a 5-point scale
ranging and were combined into a scale that showed very good reliability (Cronbach‘s = 0.83).
Based on the scale, I created a set of membership in the set of firms with a high degree of
formalization, with membership coded as fully out for a response of (1) (―almost never‖) and
fully in for a response of (5) (―nearly always‖), while the crossover point corresponded to the
middle of the scale (3) (―about half the time‖).

18
The second measure, centralization, is based on five survey items that assess the last
decision maker whose permission must be obtained for organizational decisions such as the
addition of a new product or service, unbudgeted expenses, or the selection of the type or brand
of new equipment. The items were again measured on a 6-point scale, but actual responses were
essentially restricted to four levels (department head, division head, CEO, Board of Directors).
The items were combined into a scale that showed acceptable reliability with a Cronbach‘s of
0.74, above the frequently recommended value of 0.70 (e.g. Nunnally, 1978). Based on this
scale, firms with decision making at the level of the department head was coded as fully out of
the set of highly centralized firms, while firms with decision making at the board level were
coded as fully in the set, with the scale mid-point (between division head and CEO) serving as
the crossover point.
The third measure is administrative complexity, which is created using a combined
measure of vertical and horizontal differentiation. Following Pugh et al. (1968), vertical
differentiation was measured as the number of levels in the longest line between direct worker
and CEO, while horizontal differentiation was measured using the number of functions with at
least one full-time employee. Administrative complexity was then calculated as the product of
horizontal and vertical differentiation (Singh, 1986; Wong and Birnbaum-More, 1994). The
measure was coded into the fuzzy set of firms with high degree of administrative complexity by
coding firms in the 1st percentile (1 Level / 1 Function) as fully out of the set and firms in the
99th
percentile (6 Levels / 17 Functions) as fully in the set. As a crossover point, I chose the
50th percentile (3 Levels / 9 Functions), which is largely consistent with the mean score of prior
studies using a complexity measure (e.g. Wong and Birnbaum-More, 1994).

19
The last measure of organizational structure is size, which is based on the average
number of full time employees, with groupings based on the European Union enterprise size-
classes (1-9, 10-49, 50-249, 250+). Specifically, firms with 250 or more employees were coded
as fully in the set of large firms, while those with 10 employees or less were coded as fully out of
the set, with the midpoint at 50 employees.
Consistent with prior research, I use Porter‘s (1980) strategy framework, which is
consistent with Miles and Snow‘s typology and prior research (David et al., 2002; Doty et al.,
1993). Specifically, I develop measures for Porter‘s two generic strategies, cost leadership and
differentiation. Both items are based on a factor analysis of six items relating to the firms‘
competitive capabilities. The first four related to low labor cost, low material consumption, low
energy consumption, and low inventory cost as elements of the firm‘s competitive capability
over the past 3 years, while the last two related to new product introduction and product features
as such elements of competitive capability. A principal component factor analysis with varimax
rotation showed a two factor solution, with all items loading highly and cleanly on two factors,
as shown in Table 2.
----- Insert Table 2 about here -----
The items were combined into two scales that showed strong reliability ( = 0.86 for cost
leadership and = 0.80 for differentiation). Based on these scales, I created two fuzzy set
measures. Membership in the set of firms with a cost leadership strategy, was coded as fully out
for a value of 1 (―not important‖) and fully in for a value of 5 (―critically important‖), with the

20
scale midpoint of 3 as the crossover point. Coding of membership in the set of firms with a
differentiation strategy followed the same approach.
I measure environmental context using the two constructs of environmental velocity and
uncertainty. The first measure, environmental velocity, measures the speed of technological and
competitive change (Bourgeois and Eisenhardt, 1988). In high velocity environments, firms face
difficulties earning above average profits for prolonged periods of time based on a single
innovation or product (Bogner and Barr, 2000). Velocity here is operationalized as the length of
firm‘s main product‘s life cycle. A product life cycle of 3 months or less (98th
percentile) was
coded as full membership in a high velocity environment, a life cycle of 3 years (77th
percentile)
was set as the crossover point, and a product life cycle of 10 years (25th
percentile) was coded as
full non-membership in a high velocity environment.
The second measure, environmental uncertainty, was assessed using two items that asked
how predictable changes were in the business environment over the past three years. The two
items assessed the predictability of technological change for manufacturing products and
technology related to product improvement, both measured on a 5-point scale ranging from 1
(―easily predictable‖) to 5 (―completely unpredictable‖). Both items were combined into a scale
that showed very good reliability ( = 0.81). The fuzzy set measure of high environmental
uncertainty was based on this scale and coded as fully out of the set for values of 1 (―easily
predictable). Because the maximum observed value was 4, I coded this value as fully in the set of
high environmental uncertainty and used the observed scale mid-point of 2.5 as the crossover
point. Finally, the measures of velocity and uncertainty tap into different constructs as shown by
their low and non-significant correlation of 0.04 (p = 0.64).2
2 While environmental uncertainty is arguably a multi-faceted construct that can also relate to e.g. political
uncertainty or uncertainty relating to the supply of inputs and factor prices, the current measure relating to

21
Information on the survey items used to construct the independent measures was missing
for on average 14 percent of cases, and listwise deletion would have significantly reduced the
overall sample size and likely resulted in biased results (Little and Rubin, 1987). I therefore
imputed the missing values using maximum likelihood estimation based on information from all
measures (Schafer, 1997). However, I do not impute missing values for my outcome measure,
and deleting cases with missing performance information resulted in a valid sample size of 139
cases. All subsequent analyses refer to this final sample.
Calibration
As described above, the process of transforming variables into sets requires the
specification of full membership, full non-membership, and the crossover point of maximum
ambiguity regarding membership in the set of interest. Given these three qualitative anchors, the
transformation of a variable into a set measure is relatively simple. In the current study, I follow
the ―direct method‖ described by Ragin (2008). The transformation proceeds in two steps. In the
first, variables scores are translated into the metric of log odds. For instance, scores associated
with ≥ .99 membership are translated to log odds values of ≥ 5, while scores associated with the
crossover point of .5 membership are translated to log odds values of 0. In the second step, set
membership scores are calculated using the formula below.
Degree of Membership = 𝑒
( log 𝑝
1−𝑝 )
1+𝑒(log
𝑝1−𝑝
)
technological uncertainty is arguably most closely related to the strategies of cost leadership and differentiation and
consistent with prior work (e.g. Desarbo et al. 2005).

22
Accordingly, the degree of membership in a set is the exponentiated log odds divided by
unity plus the exponentiated log odds. The advantage of the log odd transformation is that it
converts any interval variable into a set by using a metric that is symmetric around zero and has
no floor or ceiling. The rescaled measures range from 0 to 1 and the converted scores are tied to
the thresholds of full membership, full non-membership, and the crossover point. In the current
version of fs/QCA (2.0), the transformation is automated once the three thresholds are defined.
To assure comparability in the coding of the outcome across different analysis methods, I use the
fuzzy set outcome for performance in all models. However, I also note any differences in results
if the conventional, uncalibrated performance measure is used. The uncalibrated measure is
simply the raw ROA score for the firms in the sample.
Plan of Analysis
In order to examine the effect of instrumentation on understanding the nature of
configurations, my analysis proceeds in three steps that move from standard statistical
approaches for configurational analysis to set-theoretic analyses using fuzzy sets and QCA. In a
first step, I generate an empirically derived taxonomy of configurations based on cluster analysis.
In a second step, I use a theoretically derived typology based on Miles and Snow and employ
deviation score analysis to generate profiles. I combine both the empirically and theoretically
derived solutions with regression analysis to examine their ability to explain performance
differences across types and environments. After thus establishing a baseline of findings using
the standard methodology, the third step employs a set-theoretic approach based on QCA. Using
Boolean algebra, I analyze the dataset for the presence of set-theoretic relationships between the
different aspects of organizational configurations and again examine the ability of this analysis to

23
explain performance and to examine what causes are central in a configurational analysis of the
observed types.
RESULTS
Table 3 presents descriptive statistics and correlations for all measures. The table shows the
expected positive correlations between size, formalization, and administrative complexity. In
contrast, centralization is negatively correlated with these three measures, which is consistent
with the notion of smaller organizations with few levels of hierarchy concentrating decision
making at the executive level. As would be expected, there is also a significant and high negative
correlation between environmental uncertainty and cost leadership strategy.
----- Insert Table 3 about here -----
Cluster Analysis
To derive an empirical taxonomy of organizational configurations, I use a two-step
cluster analysis, which has been the dominant tool of analysis for configurations and strategic
groups (Ketchen and Shook, 1996). I use the four structural and two strategy variables and then
examine how the derived configurations perform given differing environments. In a first step,
hierarchical cluster analyses using Ward‘s minimum variance method suggested a three-cluster
solution based on cutoff values and inspection of dendrograms (Ferguson et al., 2000; Marlin et
al., 2007). After determining this three-cluster solution, I used K-means cluster analysis in a
second step with the centroid values of the hierarchical analysis as seeds (e.g. Payne 2006; Lim
et al., 2006). To assure comparability across variables, all measures were standardized prior to

24
the analysis. Results of the cluster analysis with final cluster centers are presented in Table 4 and
are essentially stable across different clustering algorithms.
----- Insert Table 4 about here -----
As the table shows, the solution includes three clusters that map somewhat imperfectly on
the Miles and Snow typology. Group 1 (N=93) corresponds roughly to the prospector type,
scoring low on size formalization, complexity, and cost leadership, and high on a differentiation
strategy. At the other end of the continuum, Group 3 (N=59) approximates the defender type,
scoring high on size, formalization, and complexity. However, its score of 0.42 on cost
leadership is only slightly higher than that of group 1, while its differentiation score is only
slightly lower. Furthermore, again diverging from the ideal typology, centralization scores are
high for prospectors and low for defenders. Finally, Group 2 (N=41) does appear to fit the
analyzer profile, mostly occupying a middle position except for differentiation, where this group
has the lowest score of the three groups.
The empirical results thus bear some resemblance to the Miles and Snow ideal types of
prospector, analyzer, and defender, although the fit is less than perfect. To examine the
relationship between these ideal types and performance, I regressed dummy variables for cluster
membership on the performance measure, with interaction terms for environmental velocity and
uncertainty. I use two-limit Tobit regression, which is the appropriate model when the dependent
variable is truncated (Long, 1997), as is the case with the fuzzy set measure that calibrates the
measure by introducing cutoffs for full membership and non-membership in the set of high

25
performing firms.3 In the models, the analyzer type is used as the omitted category. Results are
presented in Table 5.
----- Insert Table 5 about here -----
Model 1 shows the effect of prospector and defender types on performance, while models
2 to 5 add interaction terms for environmental velocity and uncertainty to examine whether the
types perform better or worse in these environments as predicted by the typology. As model 1
shows, only the prospector type exhibits significantly higher performance than the analyzer type.
Furthermore, models 2 through 5 offer no evidence that the performance of either the prospector
or defender type depends on the environment in which it operates. Alternative models using the
defender type as the omitted category also showed no performance differences or dependence of
performance on the environment for the analyzer type. Because models using the alternative
measure of very high performance resulted in essentially identical results, these models are not
reported here but are available from the author on request. In addition, note that model fit is less
than desirable, with pseudo R-squared values between 0.04 and 0.05. In sum, the models offer
only very limited support for performance differences between these types and they offer no
support for performance being contingent on the nature of the environment, as specified by the
theory.
Deviation Score Analyses
I follow prior studies in using deviation scores to test the relationship between the fit with
a theoretical typology and performance (Doty et al. 1993; Doty and Glick, 1994; Delery and
3 I also estimated models that used OLS regression in combination with the uncalibrated performance measure. The
results were substantively identical with the exception that in these models the coefficient for the prospector type is
significant at the .01 instead of the .05 level.

26
Doty, 1996). The profiles are defined based on the Miles and Snow ideal types of prospector,
analyzer, and defender. For each profile, fit is calculated as the deviation of an organization from
an ideal type and across all attributes. Based on the fit scores, ideal profile fit is calculated as the
minimum deviation across the three profiles according to the formula below.
𝐹𝑖𝑡𝐼𝑇 = − 𝑙
min𝐷𝑖𝑜
𝑖 = 1
Here, Dio is the distance between ideal type i and organization o, and the formula takes
the minimum of this distance across all ideal type (Doty et al., 1993). Using the fuzzy set
measures constructed above, high ideal profile scores corresponded to full membership while
low score corresponded to full non-membership, with medium scores tied to the crossover
threshold. Because the prospector and defender ideal types specified by the Miles and Snow
typology are the opposite of each other, their deviation scores are inversely correlated with each
other. I again use two-limit Tobit regression to then model the relationship between ideal profile
deviation and performance. In the models, the analyzer type is used as the omitted category.
Results are presented in Table 6.
----- Insert Table 6 about here -----
Model 1 shows the results of an organization‘s overall ideal profile fit across all profiles.
The fit coefficient is positive and significant, indicating that such fit is indeed associated with
higher performance. To examine whether this finding was driven by fit with any particular ideal
type, models 2 to 4 show the coefficient for deviation from the individual prospector, analyzer,

27
and defender profile. Only the coefficient for the analyzer profile is marginally significant,
suggesting that it is not simply one profile that is superior but that likely firms may achieve
higher performance by achieving fit with any of the three profile. Note also that the findings
using this theoretically derived typology differ from the empirically derived solution based on
cluster analysis, where only the prospector type showed increased performance.
Models 5 through 8 show the interaction between deviation from the three ideal types and
environmental velocity and uncertainty. As suggested by a model of environmental contingency,
model 6 indicates that deviation from the prospector profile decreases performance in high
uncertainty environments, although the coefficient is only marginally significant. The models did
not indicate any support for the dependence of ideal type fit on the velocity of the environment.
Alternative models using the very high performance measure as the dependent variable resulted
in essentially identical models and are therefore omitted here. Note also that model fit as
measured by the Pseudo R-squared is again rather poor, with values between 0.02 and 0.03 for
the overall model. Compared to a baseline model with only environmental controls, the Pseudo
R-squared increases only by 0.01 when the ideal type fit measure is included. Accordingly,
although the models offer some evidence that ideal type fit is positive for performance and at
least for fit with the prospector type does depend on environmental uncertainty, it would not
appear that ideal type fit is a crucial ingredient in attaining high performance.4
Fuzzy Set Analyses
Most previous fuzzy set analyses have used the inclusion algorithm described in Ragin
(2000) to examine the relationship between membership in causal conditions and the outcome of
4 The results are again identical for OLS regression in combination with the uncalibrated performance measure, the
only exception being that the interaction between prospector type deviation and environmental uncertainty is now
significant at the 0.05 level instead of the 0.10 level.

28
interest (e.g. Kogut, MacDuffie, and Ragin, 2004; Kogut and Ragin, 2006). While this algorithm
is particularly useful in small-N situations, it circumvents the creation of a truth table and thus
forfeits some analytical advantages when e.g. analyzing limited diversity. To overcome this
limitation, Ragin (2005; 2008) introduced a truth table algorithm that takes full advantage of the
rich information contained in fuzzy sets while also allowing the constructing of a conventional
truth table that can be analyzed using standard methods of Boolean algebra. I use this new
algorithm in all subsequent analyses.5
The truth table algorithm of QCA is based on a counterfactual analysis of causal
conditions, which allows for a categorization of causal conditions into core and peripheral
causes. Counterfactual analysis is relevant to configurational analysis since even relatively few
elements of a configuration quickly lead to an astronomically large number of different possible
complex configurations. As Stouffer (1941) has pointed out, for the researcher this means that
there are so many configurations that there will frequently be very few or no empirical instances
of any particular configuration. This challenge of configurational approaches is known as the
problem of limited diversity (e.g. Ragin, 2000), and counterfactual analysis offers a way to
overcome the limitations of a lack of empirical instances.
To deal with the problem of limited diversity using counterfactual analysis, the truth table
algorithm distinguishes between parsimonious and intermediate solutions based on ―easy‖ and
―difficult‖ counterfactuals (Ragin, 2008). ―Easy‖ counterfactuals refer to situations where a
redundant causal condition is added to a set of causal conditions that by themselves already lead
to the outcome in question. In contrast, ―difficult‖ counterfactuals refer to situations where a
5 The truth table algorithm is now the standard algorithm implemented in the fs/QCA software package version 2.0
(Ragin, Drass, and Davies 2006). The current paper does not aim to explain the algorithm in detail and but the
interested reader can find an extensive description in the current book by Ragin (2008).

29
condition is removed from a set of causal conditions leading to the outcome on the assumption
that this condition is redundant.
Using both ―easy‖ and ―difficult‖ counterfactuals, the researcher can easily establish two
kinds of solutions. The first is a parsimonious solution that includes all simplifying assumptions
regardless of whether they are based on ―easy‖ or ―difficult‖ counterfactuals. The second is an
intermediate solution that only includes simplifying assumptions based on ―easy‖
counterfactuals.6 The notion of conditions that are causally central or peripheral in configurations
is based on these parsimonious and intermediate solutions. Core conditions are those that are part
of both parsimonious and intermediate solutions, while peripheral conditions are those that are
eliminated in the parsimonious solution and thus only appear in the intermediate solution.
Accordingly, this approach defines causal coreness based on the strength of the evidence relative
to the outcome.
The truth table algorithm used here additionally allows the calculation of consistency and
coverage scores, thus permitting a finer-grained understanding of the reliability and importance
of different causal paths to an outcome. Consistency assesses the degree to which cases sharing a
given condition or combination of conditions agree in displaying the outcome in question. A
simple way to estimate consistency when using fuzzy sets is the proportion of cases consistent
with the outcome. However, this gives undue weight to cases displaying only low membership in
the condition of interest. For example, a case with high membership in the set of high performing
organizations should have more weight than one with low membership since such a case is
arguably of greater interest to the researcher. To address this issue, Ragin (2006) has introduced
as an alternative measure of consistency the sum of consistent fuzzy membership scores divided
6 A third solution, of course, is the most complex one that includes neither easy nor difficult counterfactuals.
However, such a solution is usually needlessly complex and provides rather little insight into causal configurations.

30
by the sum of all membership scores. This measure is further refined by adding to the numerator
the part of each inconsistent causal membership score that is consistent with the outcome. As
Ragin (2008) notes, this adjustment improves on the previous consistency measure by giving
small penalties for minor inconsistencies and large penalties for major inconsistencies. I follow
standard practice by setting the minimum acceptable consistency for the solutions at 0.75 (e.g.
Ragin, 2006, 2008). Also, the minimum acceptable solution frequency was set at two.
Coverage is a measure of how important a cause or causal combination is to the outcome.
It is similar to an R-Square by indicating the number of cases that take this path to the outcome,
allowing to evaluate the importance of different causal paths. Coverage is further subdivided into
unique coverage of causal conditions, similar to unique R-Squared calculations in regression
analysis.
Table 7 shows the results of a fuzzy set analysis of high performance. I use the notation
recently introduced by Ragin and Fiss (2008). In this notation, full circles indicate the presence
of a condition, while crossed-out circles indicate the absence of a condition. Furthermore, large
circles indicate core conditions that are part of the parsimonious and intermediate solutions,
while small circles refer to peripheral conditions that only occur in intermediate solutions.
Intermediate solutions incorporate only "easy" counterfactuals, while the parsimonious solution
incorporates both ―easy‖ and ―difficult‖ counterfactuals based on the actual evidence available
(Ragin, 2008).
----- Insert Table 7 about here -----

31
The table shows that the fuzzy set analysis results in four solutions showing acceptable
consistency (i.e. consistency ≥ 0.75). Regarding core conditions, Solutions 1 and 2 indicate that a
cost leadership strategy combined with either high centralization or the absence of a high
velocity environment are sufficient for achieving high performance, a profile that fits the
defender type. These findings suggest that, with a cost leadership strategy, there are tradeoffs
between a high degree of centralization and environmental velocity: greater centralization allows
for high performance regardless of whether the environment changes at high speeds or not, but in
the absence of centralization high velocity becomes a problem for achieving high performance.
Regarding peripheral conditions, both solutions 1 and 2 show that these core conditions are
usually combined with a high degree of formalization and complexity as well as a differentiation
strategy and the absence of high uncertainty in the environment.
Solutions 4a and 4b indicate another path to high performance combining a
differentiation strategy with greater decentralization as indicated by low levels of complexity,
which is consistent with a prospector strategy. Indeed, in terms of structure and strategy, solution
4a is perfectly consistent with the prospector ideal profile defined by Miles and Snow when
peripheral conditions are also taken into account. Solution 4b differs slightly from 4a in that this
solution combines centralization with operating in an uncertain environment as peripheral
conditions. Note that for both solutions, however, the environment is not a core condition,
although high velocity appears to hinder high returns when using a differentiation strategy. In
fact, it would appear that, in contrast to the Miles and Snow assumption, a centralized defender
configuration (solution 1) is better positioned to operate in a high velocity environment than any
prospector (solutions 4a and 4b).

32
Interestingly, the fuzzy set analysis also indicates the existence of a successful hybrid
configuration (solution 3), which combines differentiation and cost leadership strategies with low
levels of complexity while avoiding high velocity environments. In terms of overall coverage,
the combined models account for about 35% of membership in the outcome. While this value
appears high relative to e.g. the R-Squared values of the previous regression models, it also
indicates considerable elements of randomness or idiosyncrasy within configurations that lead to
high performance.
Table 8 shows the results for the fuzzy set analysis of very high performance. The results
indicate the existence of two distinct configurational groupings leading to very high
performance. Solutions 1a-1c all rely on a cost leadership strategy in combination with a high
degree of formalization and either centralization, not high velocity environments, or both.
Solutions 1a and 1b also show clear tradeoffs, with complexity and differentiation associated
with 1a being replaced by no differentiation and not high velocity environments in 1b. Note also
that for all solutions in Table 8, the minimum number of core conditions has increased from 2 to
three, indicating the existence of fewer choices when aiming for very high performance.
----- Insert Table 8 about here -----
The table also shows the existence of a highly successful prospector configuration in
solution 4, which largely resembles the prospector configuration of the previous table but
includes uncertainty as a core condition. This finding is consistent with the prospector prototype
of a small, centralized firm that is highly decentralized, pursuing a differentiation strategy only in

33
a highly uncertain but not too quickly changing environment. It also indicates that very high
performance is possible even in usually unfavorable environments given the right configuration.
Note also that the results of Table 8 indicate there is no hybrid configuration that achieves very
high performance. This is an important finding, as it indicates that tradeoffs may become
increasingly pronounced as one moves up the performance scale. Accordingly, it may still be
possible to achieve high performance using a hybrid type, but as one approaches very high
performance, tradeoffs between e.g. differentiation and cost leadership strategies as well as their
associated characteristics of organizational structure appear to make hybrid types such as the
analyzer infeasible.
Finally, I conducted fuzzy set analyses modeling the absence of high performance. Note
again that in the previous regression analyses, this kind of analysis is always part of the process
because of the symmetric nature of relationships in regression. For instance, the results of a
regression analysis are unchanged except for the sign if one uses the inverse of the outcome.
However, in fuzzy set analyses, causal conditions leading to the outcome may frequently be
different from those conditions leading to the absence of the outcome.
As suggested by an asymmetric understanding of causality in configurations, a fuzzy set
analysis of the absence of high performance indicated that there was no consistently identifiable
solution.7 The consistency scores for all solutions remained considerably below the acceptable
level of 0.75, indicating the absence of a clear set-theoretic relationship. Put differently, there are
few configurations that consistently lead to high performance and even fewer that consistency
lead to very high performance, but no configuration of strategy, structure, and environment that
consistently leads to average or below performance. While such a finding is not part of the
7 In a regression framework, one might think of this findings as roughly similar to a lack of significance for any of
the causal configurations.

34
regression framework, it is in fact quite common in fs/QCA to find that the specified conditions
are linked to either the outcome or its negation but not both.
As a robustness check, I created an additional measure of membership in the set of firms
with low performance. This measure was coded 1 if the firm had no or a negative return and was
coded 0 if the firm had an average ROA (7.8%). Note that this measure of low performance is
thus different from the measure of not high performance. For instance, an average performing
firm will have a membership score of 1 for not high performance but will have a membership
score of 0 for low performance. However, this measure likewise failed to result in solutions with
an acceptable level of consistency. For the current setting, the finding of asymmetric causality
indicates a specific feature of organizational configurations, namely that certain configurational
choices reliably achieve high performance, but that average or low performance can be the result
of many configurational choices, with none being particular ones that have to be avoided.
DISCUSSION
While configurational theory has figured prominently in organization and strategy research, and
while the configurations retains their attraction as evidenced by a number of recent studies, the
promise of configurational theory remains still unfulfilled. The current study has aimed to offer a
fresh view of the challenges involved in configurational research by shifting the focus towards a
definition of configurational centrality that focuses on causal relations with the outcome in
question. In doing so, I have argued that such a shift overcomes a number of theoretical and
instrumentation issues that have so far plagued configurational research, and that this shift
further allows for the analysis of causal asymmetry, an issue that is hard to examine using
conventional econometric methods for studying configuration.
35
In terms of its contribution, I have argued that prior work on organizational
configurations has either neglected to specify a clear definition of center and periphery of
organizational configurations or this work has employed a definition that is causally only
indirectly related to the outcome in question. In contrast, the current understanding of causal
centrality relative to the outcome draws on counterfactual analysis in defining central and
peripheral elements of a configuration. Building on the notions of limited diversity and
counterfactual analysis, I have argued here that fuzzy set analysis allows researchers to gain a
clearer understanding just what elements of a configuration are relevant for an outcome and how
these elements combine to achieve their effects. Specifically, the solutions found for the sample
of high technology firms here demonstrated the existence of several configurations that included
several permutations. In this regard, the set-theoretic methods used here hold considerable
promise to overcome the current challenges and allow for a detailed analysis of the necessary
and sufficient conditions of high performance configurations. The current study thus presents a
step towards a stronger capability for building high performance organizations.
Furthermore, the set-theoretic methods used here allow for the analysis of causal
asymmetry in configurations, that is, they take into account the fact that the configurations
leading to very high performance are frequently different from those leading to merely high or
average performance. So far, causal asymmetry has for the most part been neglected both in
configurational analysis and in organizational research more broadly. However, causal
asymmetry is arguably pervasive in both domains, and failing to take this causal structure into
account is likely to lead to incomplete or incorrect recommendations. Specifically, the analysis
of causal asymmetry in the current study showed that hybrid analyzer configurations combining
elements from both the prospector and defender type were indeed able to achieve high

36
performance, but that such hybrid types were not able to achieve very high performance. Instead,
configurations exhibiting very high performance resembled ―pure‖ types rather than hybrids,
indicating that to achieve such levels of very high performance, an organizational configuration
apparently needed to embrace tradeoffs between different elements.
Finally, I have aimed to examine the role of instrumentation in understanding
organizational configurations. By comparing cluster and deviation score analysis with fuzzy set
analysis using the same data, the current study provides an opportunity to examine just what each
method allows us to see regarding configurational analysis. My goal here was not to discredit
either cluster analysis or approaches deviation scores—both arguably have a considerable and
successful history in both classifying and evaluating organizational configurations. In fact, the
current study found generally support for the utility of both approaches, even though the model
fit for both approaches was less than desirably. Instead, my aim has been to demonstrate the
added value that a fuzzy set analysis using QCA can bring to the study of configurations, both in
terms of providing a greater understanding of how causes combine to create an outcome and a
more direct way to model equifinality in organizational configurations. In this regard, fs/QCA
would appear to be a particularly useful tool for understanding both complementarities and
substitutes in configurations.
Naturally, the current study also has limitations. As Miller (1986) notes, the concepts of
strategy, structure, and environment are quite broad and involve multiple dimensions.
Accordingly, any given study drawing on these three domains can only select a representative set
of categories for characterizing each of them. The current study is no exception in that it has
focused on some measures to the exclusion of others that could be used to, for instance,
characterize the nature of the environment. Nevertheless, the measures selected for this study are

37
arguably central to the three domains examined here and the current study is quite
comprehensive in that it is one of the few to include simultaneously measures of structure,
strategy, and environment. As such, while it is no different from other configurational studies in
having to select certain measures in favor of others, it goes beyond much previous work in
offering a holistic assessment of configurations across a multidimensional property space.
Furthermore, the limited sample size of the current study allowed for statistical
significance testing when using conventional econometric analysis such as Tobit regressions but
did not permit such testing for the fuzzy set analyses. While fs/QCA can generally employ
significance tests to examine for instance consistency of a solution, the specific causal structure
of the current sample which included a number of viable solutions resulted in too few cases for
each solution to permit statistical tests. This necessarily limits the ability to draw definite
conclusions from this dataset and calls for further studies to verify the current results. Similarly,
while the current study was able to draw on cross-industry data, the findings are restricted to the
high technology sector. While this sector includes a number of important and highly relevant
industries such as semiconductors, computer equipment, or scientific instruments, future research
would naturally aim to expand the scope beyond the current empirical setting. However,
although the findings of the current study are limited in their generalizability, the logic of the
configurational approach here is not context specific and thus offers ample opportunity for more
research.
The current study, I believe, opens up a number of opportunities to expand
configurational analysis. I have argued elsewhere that configurations are arguably pervasive and
that a variety of theoretical approaches ranging from complementarities theory (e.g. Milgrom and
Roberts, 1995; Siggelkow, 2002) over strategic human resource management (e.g. MacDuffie,

38
1995) the resource based view (e.g. Barney, 1991), and that the set-theoretic methods employed
here can provide different insights that speak well to the assumptions of synergistic, non-linear
effects that inform these literatures. As such, there would appear to be ample opportunities to
apply the tools of Qualitative Comparative Analysis, and several researchers have already done
this in examining for instance the causes informing foreign direct investment decisions (Pajunen,
2008) and the interplay of industry, corporate, and firm level effects in explaining performance
(Greckhamer et al., 2008).
Configurational approaches are likely to continue playing a central role in management
and strategy research, not the least since configurations arguably present the essence of strategy
and are likely to be a far greater source of competitive advantage than any single aspect of the
organizational system (Miller, 1986: 510). The current study has argued that our theory of
configurations might benefit both conceptually and empirically from a reorientation towards the
concepts of causal necessity and sufficiency. I hope that I have made a case for more empirical
research to extend this approach and further show its utility in developing a theory of
organizational configurations. Given the success that fuzzy set methods are beginning to enjoy in
related disciplines such as sociology and political science, the current study will hopefully be but
a first step towards the use of QCA in management and strategy research.

39
REFERENCES
Ashmos, D.P. & G.P. Huber.
1987 ―The Systems Paradigm in Organization Theory: Correcting the Record and Suggesting
the Future.‖ Academy of Management Review, 12, 607- 621.
Barney, J. B.
1991 ―Firm resources and sustained competitive advantage.‖ Journal of Management, 17: 99–
120.
Blau, P, and W.R. Scott
1962 Formal Organizations. San Francisco: Chandler.
Bogner, W.C., and P.S. Barr
2000 Making sense in hypercompetitive environments: A cognitive explanation for the
persistence of high velocity competition. Organization Science 11: 212-226.
Bourgeois, L. J., III, and K.M. Eisenhardt.
1988 Strategic decision processes in high velocity environments. Management Science, 34:
816-835.
Burns, T., and G.M. Stalker.
1961 The management of innovation. London: Tavistock.
Child, J.
1972 ―Organization structure and strategies of control: A replication of the Aston study.‖
Administrative Science Quarterly, 17: 163-177.
Corso, M., and A. Martini, L. Pellegrini, E. Paolucci.
2003 ―Technological and Organizational Tools for Knowledge Management: In Search of
Configurations.‖ Small Business Economics, 21: 397-408.
Cosh, A.D., A. Hughes, M. Gregory, and S. Jayanthi
2002 Cambridge Centre for Business Research Manufacturing Strategy and
Competitiveness Dataset, 1994-1999 [computer file]. Colchester, Essex: UK Data
Archive [distributor], March 2002. SN: 4434.
David, J.S., and Y. Hwang, B.K.W. Pei, J.H. Reneau.
2002 ―The performance effects of congruence between product competitive strategies and
purchasing management design.‖ Management Science, 48: 866-885.
Delery, J. E., and D.H. Doty
1996 ―Modes of theorizing in strategic human resource management: Tests of universalistic,
contingency, and configurational performance predictions.‖ Academy of Management
Journal, 39: 802-835.

40
Desarbo, W.S., and C.A. Di Benedetto, M. Song, I. Sinha.
2005 ―Revisiting the Miles and Snow Strategic Framework: Uncovering Interrelationships
between Strategic Types, Capabilities, Environmental Uncertainty, and Firm
Performance.‖ Strategic Management Journal, 26: 47-74.
Doty, D. H., and Glick, W. H.
1994 Typologies as a unique form of theory building: Toward improved understanding and
modeling. Academy of Management Review, 19: 230-251.
Doty, D. H., and W. H. Glick, G. P. Huber.
1993 ―Fit, equifinality, and organizational effectiveness: A test of two configurational
theories.‖ Academy of Management Journal, 36: 1196-1250.
Drazin, R., and A. H. Van de Ven.
1985 ―Alternative forms of fit in contingency theory.‖ Administrative Science Quarterly, 30:
514-539.
Etzioni, A.
1961 A comparative analysis of complex organizations. New York: Free Press.
Ferguson, T. D., Deephouse, D. L., and Ferguson, W. L.
2000 ―Do strategic groups differ in reputation?‖ Strategic Management Journal, 21: 1195–
1214.
Fiss, P.C.
2007 ―A set-theoretic approach to organizational configurations.‖ Academy of Management
Review, 32: 1180-1198.
2008 ―Case studies and the configurational analysis of organizational phenomena.‖
Forthcoming in the Handbook of Case Study Methods, edited by Charles Ragin and
David Byrne. Thousand Oaks, CA: Sage.
Geletkanycz, M.A.
1997 ―The salience of ‗culture‘s consequence‘: The effects of cultural values on top executive
commitment to the status quo.‖ Strategic Management Journal, 18: 615-634.
Govindarajan, V.
1986 ―Decentralization, Strategy, and Effectiveness of Strategic Business Units in
Multibusiness Organizations.‖ Academy of Management Review, 11: 844-856.
Greckhamer, T., and V.F. Misangyi, H. Elms, R. Lacey.
2008 ―Using Qualitative Comparative Analysis in Strategic Management Research
An Examination of Combinations of Industry, Corporate, and Business-Unit Effects.‖
Organizational Research Methods, in press.
Gresov, C., and R. Drazin.

41
1997 ―Equifinality: Functional equivalence in organization design.‖ Academy of Management
Review, 22: 403-428.
Gupta, A. K., and V. Govindarajan.
1993. ―Methodological issues in testing contingency theories: An assessment of alternative
approaches.‖ Pp. 453-471 in Yuji Ijiri (Ed.), Creative and innovative approaches to the
science of management. Westport, CT: Quorum Books.
Hambrick, D. C.
1983 ―Some tests of the effectiveness and functional attributes of Miles and Snow‘s strategic
types.‖ Academy of Management Journal, 26: 5-26.
1984 ―Taxonomic approaches to studying strategy: Some conceptual and methodological
issues.‖ Journal of Management, 10: 27-41.
2003 ―On the staying power of defenders, analyzers, and prospectors.‖ Academy of
Management Executive, 178: 115-118.
Hambrick, D. C., and M. A. Geletkanycz, J. W. Fred- Levinson
1993 ―Top executive commitment to the status quo: Some tests of its determinants.‖ Strategic
Management Journal, 14: 401–418.
Hannan, M.T., M.D. Burton, and J.N. Baron.
1996 ―Inertia and change in early years: Employment relations in young, high-technology
firms.‖ Industrial and Corporate Change, 5: 503-536.
Hannan, M.T., and J. Freeman.
1977 ―The population ecology of organizations.‖ American Journal of Sociology, 82: 929-964.
1984 ―Structural inertia and organizational change.‖ American Sociological Review, 49: 149-
164.
Hofer, C.W., and D. Schendel.
1978 Strategy Formulation: Analytical Concepts. St. Paul, MN: West.
Inkpen, A., and N. Choudhury.
1995 ―The Seeking of Strategy Where it is Not: Towards a Theory of Strategy Absence.‖
Strategic Management Journal, 16: 313-323.
Jackson, G.
2005 ―Employee Representation in the Board Compared: A Fuzzy Sets Analysis of Corporate
Governance, Unionism, and Political Institutions.‖ Industrielle Beziehungen, 12: 1-28.
Kabanoff, B., and S. Brown.
2008 ―Knowledge Structures of Prospectors, Analyzers, and Defenders: Content, Structure,
Stability, and Performance.‖ Strategic Management Journal, 29: 149-171.
Katz, D., and R.L. Kahn.
1978 The Social Psychology of Organizations. Second edition. New York: Wiley.

42
Ketchen, David J., and J. B. Thomas, C. C. Snow.
1993 ―Organizational configurations and performance: A comparison of theoretical
approaches.‖ Academy of Management Journal, 36: 1278-1313.
Ketchen, David J., and C. L. Shook.
1996 ―The application of cluster analysis in strategic management research: An analysis and
critique.‖ Strategic Management Journal, 17: 441-485.
Kogut, B., and MacDuffie, J. P, Ragin, C. C.
2004 ―Prototypes and strategy: Assigning causal credit using fuzzy sets.‖ European
Management Review, 1: 114–131.
Kogut, Bruce, and Charles C. Ragin.
2006 ―Exploring complexity when diversity is limited: Institutional complementarity in
theories of rule of law and national systems revisited.‖ European Management Review, 3:
44–59.
Lim, L.K.S., and F. Acito, A. Rusetski.
2006 ―Development of archetypes of international marketing strategy.‖ Journal of International
Business Studies, 37: 499-524.
Little, R. J. A. and D. B. Rubin
1987 Statistical analysis with missing data. John Wiley and Sons, New York.
Long. J.S.
1997 Regression models for categorical and limited dependent variables. Advanced
Quantitative Techniques in the Social Sciences Series, volume 7. Thousand Oaks, CA:
Sage.
MacDuffie, J. P.
1995 ―Human resource bundles and manufacturing performance: Organizational logic and
flexible production systems in the world auto industry.‖ Industrial and Labor Relations
Review, 48: 197–221.
Marlin, Dan, and David J. Ketchen, Bruce Lamont.
2007 ―Equifinality and the Strategic Group-Performance Relationship.‖ Journal of Managerial
Issues, 19: 208-232.
McPhee, R.D., and M. Scott Poole.
2001 ―Organizational Structures and Configurations.‖ Pp. 503-543 in F. Jablin and L. Putnam
(eds.), The New Handbook of Organizational Communication: Advances in Theory,
Research, and Methods. Thousand Oaks, CA: Sage.
Meyer, A.D., and A.S. Tsui, C.R. Hinings.

43
1993 ―Configurational approaches to organizational analysis.‖ Academy of Management
Journal, 36: 1175-1195.
Miles, R.E., and C.C. Snow.
1978 Organizational Strategy, Structure, and Process. In collaboration with Alan D. Meyer and
with contributions by Henry J. Coleman, Jr. Stanford. New York: McGraw Hill.
2003 Organizational Strategy, Structure, and Process. In collaboration with Alan D. Meyer and
with contributions by Henry J. Coleman, Jr. Stanford, CA: Stanford Business Classics.
Milgrom, P., and J. Roberts.
1995 ―Complementarities and fit: Strategy, structure, and organizational change in
manufacturing.‖ Journal of Accounting and Economics, 19: 179-208.
Miller, D.
1986 Configurations of Strategy and Structure: A Synthesis.‖ Strategic Management Journal,
7: 233-249.
1990 Organizational Configurations: Cohesion, Change, and Prediction. Human Relations, 43:
771-789.
Miller, D., and P.H. Friesen.
1984 Organizations: A Quantum View. Englewood-Cliffs, N.J.: Prentice-Hall
Mintzberg, H.
1979 The Structuring of Organizations: A Synthesis of the Research. Englewood Cliffs, NJ:
Prentice Hall.
1983 Structures in Fives: Designing Effective Organizations. Englewood Cliffs, NJ: Prentice-
Hall.
Nunnally, J.C.
1978 Psychometric Theory. 2nd
edition. New York: McGraw Hill.
Pajunen, K.
2008 ―Institutions and inflows of foreign direct investment: a fuzzy-set analysis.‖ Journal of
International Business Studies, in press.
Parnell, J.A.
1997 ―Top Management Team Fit in the U.S. Airline Industry.‖ British Journal of
Management, 8: 175-181.
Payne, G.T.
2006 ―Examining configurations and firm performance in a suboptimal equifinality context.‖
Organization Science, 17: 756-770.
Perrow, C.
1970 Complex Organizations: A sociological View. Belmont, CA: Wadsworth.

44
Porter, M.E.
1980 Competitive Strategy. The Free Press, New York
1996 ―What is strategy?‖ Harvard Business Review, November-December: 61-78.
Pugh, D.S., and D.J. Hickson, C.R. Hinings.
1968 ―Dimensions of organization structure.‖ Administrative Science Quarterly, 13: 65-105.
Pugh, D.S., and D.J. Hickson, C.R. Hinings.
1969 ―An Empirical Taxonomy of Structures of Work Organizations.‖ Administrative Science
Quarterly, 14: 115-126.
Ragin, C. C.
2000 Fuzzy set social science. Chicago: University of Chicago Press.
Ragin, C. C.
2005 From fuzzy sets to crisp truth tables. Working paper, University of Arizona, Tucson,
available at http://www.compasss.org/Raginfztt_April05.pdf.
Ragin, C. C.
2006 Set relations in social research: Evaluating their consistency and courage. Political
Analysis, 14: 291–310.
Ragin, C. C.
2008 Redesigning Social Inquiry: Fuzzy Sets and Beyond. Chicago: University of Chicago
Press.
Ragin, C. C., and P. C. Fiss
2008 ―Net effects analysis versus configurational analysis: An empirical demonstration.‖
Chapter 11 in Ragin, C.C, Redesigning Social Inquiry: Set Relations in Social Research.
In press. Chicago, University of Chicago Press.
Reynolds, P.D.
1971 A Primer in Theory Construction. Indianapolis, IN: Bobbs-Merrill Educational
Publishing.
Schafer, J.L.
1997 Analysis of incomplete multivariate data. Book No. 72, Chapman and Hall series
Monographs on Statistics and Applied Probability. Chapman and Hall: London.
Segev, E.
1989 ―A Systematic Comparative Analysis and Synthesis of Two Business-Level Strategic
Typologies.‖ Strategic Management Journal, 10: 487-505.
Siggelkow, Nicolaj.
2002 ―Evolution Towards Fit.‖ Administrative Science Quarterly, 47: 25-159.

45
Singh, J.V.
1986 ―Technology, size, and organizational structure: A reexamination of the Okayama study
data.‖ Academy of Management Journal, 29: 800-812.
Singh, J.V., and R.J. House, D.J. Tucker.
1986 ―Organizational change and organizational mortality.‖ Administrative Science Quarterly,
31: 587-611.
Slater, S.F., and E.M. Olson.
2000 ―Strategy type and performance: The influence of sales force management.‖ Strategic
Management Journal, 21: 813-829.
Snow, C.C., and L.G. Hrebiniak.
1980 ―Strategy, Distinctive Competence, and Organizational Performance.‖ Administrative
Science Quarterly, 25: 317-336.
Stadler, B.M.R., and P.F. Stadler, G.P.Wagner, W. Fontana
2001 ―The Topology of the Possible: Formal Spaces Underlying Patterns of Evolutionary
Change.‖ Journal of Theoretical Biology, 213: 241-274.
Stouffer, S. A.
1941 ―Notes on the Case-Study and the Unique Case.‖ Sociometry, 4: 349-357.
Tushman, M.L., and E. Romanelli.
1985 ―Organizational evolution: A metamorphosis model of convergence and reorientation.‖
L.L. Cummings and B. M. Staw (eds.), Research in Organizational Behavior, 7: 171-222.
Greenwich, CT: JAI Press.
Uhl-Bien, M., and J. M. Maslyn.
2003 ―Reciprocity in Manager-Subordinate Relationships: Components, Configurations, and
Outcomes.‖ Journal of Management, 29: 511-532.
Wong, G.Y.Y., and P.H. Birnbaum-More
1994 ―Culture, Context and Structure: A Test of Hong Kong Banks.‖ Organization Studies, 15:
99-123.
Zajac, E.J., and S.M. Shortell.
1989 ―Changing generic strategies: Likelihood, direction, and performance implications.‖
Strategic Management Journal, 10: 413-430.

46
Table 1: Ideal Profiles Based on Miles and Snow (1978)
Prospector Analyzer Defender
Structure
Size Low Medium High
Formalization Low Medium High
Centralization Low Medium High
Complexity Low High High
Strategy
Differentiation High Medium Low
Low Cost Low Medium High
Table 2: Principal Component Factor Analysis for Strategy Construct*
Survey Item Factor 1 Factor 2
1. Low labor cost 0.81 -0.08
2. Low materials consumption 0.84 0.02
3. Low energy consumption 0.86 -0.03
4. Low inventory cost 0.84 -0.01
5. New product introduction -0.07 0.91
6. Product features 0.03 0.91
Eigenvalue 2.81 1.67
Proportion of variance explained by eigenvector 0.47 0.28
* All items were measured using a 5-point scale ranging from 1 ("not important") to
5 ("critically important")

47
Mean S.D. 1 2 3 4 5 6 7 8 9
1. Size 0.31 0.29
2. Formalization 0.62 0.24 0.35
3. Centralization 0.52 0.24 -0.20 -0.11
4. Administrative Complexity 0.51 0.25 0.53 0.42 -0.20
5. Differentiation strategy 0.66 0.30 -0.02 0.18 -0.02 0.14
6. Cost leadership strategy 0.40 0.25 0.09 0.12 0.05 0.14 -0.02
7. Environmental velocity 0.35 0.30 0.04 -0.03 -0.01 0.13 0.01 0.17
8. Environmental uncertainty 0.41 0.29 0.03 -0.19 -0.06 -0.20 -0.17 -0.27 0.05
9. High performance 0.68 0.44 -0.05 -0.10 0.12 -0.01 0.09 0.03 0.11 -0.07
10. Very high performance 0.63 0.44 -0.08 -0.08 0.14 -0.02 0.11 0.05 0.13 -0.09 0.97
* Correlations of 0.17 or higher are significant at ≤.05
Table 3: Descriptive Statistics and Correlation Coefficients*
Variable

48
Table 4: Cluster Analysis Results
1 2 3
Structure
Size 0.13 0.22 0.64
Formalization 0.52 0.49 0.76
Centralization 0.62 0.52 0.39
Complexity 0.40 0.42 0.71
Strategy
Differentiation 0.82 0.19 0.75
Low Cost 0.37 0.42 0.42
N 93 41 59
Final Cluster Centers
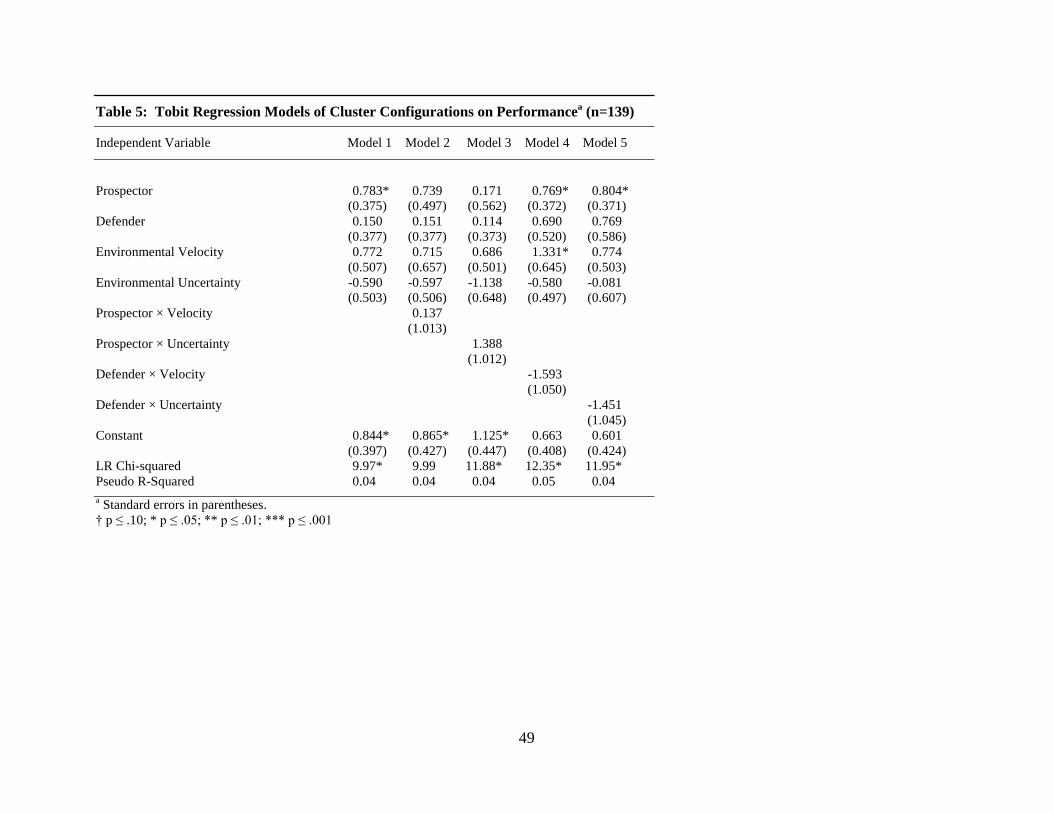
49
Table 5: Tobit Regression Models of Cluster Configurations on Performancea (n=139)
Independent Variable Model 1 Model 2 Model 3 Model 4 Model 5
Prospector 0.783* 0.739 0.171 0.769* 0.804*
(0.375) (0.497) (0.562) (0.372) (0.371)
Defender 0.150 0.151 0.114 0.690 0.769
(0.377) (0.377) (0.373) (0.520) (0.586)
Environmental Velocity 0.772 0.715 0.686 1.331* 0.774
(0.507) (0.657) (0.501) (0.645) (0.503)
Environmental Uncertainty -0.590 -0.597 -1.138 -0.580 -0.081
(0.503) (0.506) (0.648) (0.497) (0.607)
Prospector × Velocity 0.137
(1.013)
Prospector × Uncertainty 1.388
(1.012)
Defender × Velocity -1.593
(1.050)
Defender × Uncertainty -1.451
(1.045)
Constant 0.844* 0.865* 1.125* 0.663 0.601
(0.397) (0.427) (0.447) (0.408) (0.424)
LR Chi-squared 9.97* 9.99 11.88* 12.35* 11.95*
Pseudo R-Squared 0.04 0.04 0.04 0.05 0.04
a Standard errors in parentheses.
† p ≤ .10; * p ≤ .05; ** p ≤ .01; *** p ≤ .001

50
Table 6: Tobit Regression Models of Profile Fit and Deviation on Performancea (n=139)
Independent Variable Model 1 Model 2 Model 3 Model 4 Model 5 Model 6 Model 7 Model 8
Ideal Type Fit (min) 1.011*
(0.459)
Prospector Dev. -0.158 0.030 0.564
(0.259) (0.392) (0.463)
Analyzer Dev. -0.662† -0.869 -0.724
(0.400) (0.588) (0.719)
Defender Dev. 0.158
(0.259)
Prospector × Velocity -0.509
(0.806)
Prospector × Uncertainty -1.556†
(0.850)
Analyzer × Velocity 0.657
(1.350)
Analyzer × Uncertainty 0.139
(1.347)
Environmental Velocity 0.854 0.842 0.810 0.842 2.077 0.800 -0.192 0.816
(0.508) (0.525) (0.511) (0.525) (2.042) (0.515) (2.109) (0.514)
Environmental Uncertainty -0.752 -0.726 -0.656 -0.726 -0.718 3.063 -0.627 -0.862
(0.505) (0.527) (0.506) (0.527) (0.525) (2.109) (0.508) (2.067)
Constant 2.688*** 1.655* 2.222*** 0.863 1.205 -0.145 2.523** 2.311*
(0.748) (0.719) (0.681) (0.723) (0.998) (1.167) (0.932) (1.106)
LR Chi-squared 9.18* 4.35 6.81† 4.35 4.75 7.99† 7.05 6.82
Pseudo R-squared 0.03 0.02 0.03 0.02 0.02 0.03 0.03 0.03
Observations 139 139 139 139 139 139 139 139
a Standard errors in parentheses.
† p ≤ .10; * p ≤ .05; ** p ≤ .01; *** p ≤ .001

51
Table 7: Configurations for Achieving High Performance
Solution
1 2 3 4a 4b
Structure
Large Size
Formalization
Centralization
Complexity
Strategy
Differentiation
Low Cost
Environment
Velocity
Uncertainty
Consistency 0.76
0.77
0.76
0.76 0.76
Raw Coverage 0.21
0.15
0.21
0.18 0.21
Unique Coverage 0.03
0.02
0.01
0.02 0.04
Overall Solution Consistency
0.76 Overall Solution Coverage
0.35

52
Table 8: Configurations for Achieving Very High Performance
Solution
1a 1b 1c 2
Structure
Large Size
Formalization
Centralization
Complexity
Strategy
Differentiation
Low Cost
Environment
Velocity
Uncertainty
Consistency 0.77 0.77 0.76
0.76
Raw Coverage 0.22 0.23 0.16
0.22
Unique Coverage 0.02 0.01 0.02
0.07
Overall Solution Consistency 0.75 Overall Solution Coverage
0.34