cost benefit analysis of private sector environmental ... discussion paper number 30 cost benefit...
TRANSCRIPT

IFC Discussion Paper Number 30
Cost Benefit Analysis of Private Sector
Environmental Investments
A Case Study of the Kunda Cement Factory
Yannis Karmokolias

2
ContentsAbbreviations .................................................................................................................................. 3
Foreword ......................................................................................................................................... 4
Acknowledgments ........................................................................................................................... 5
I. Executive Summary .................................................................................................................... 6
II. Introduction................................................................................................................................ 7
Statement of the Problem...................................................................................................... 7Objectives of the Study......................................................................................................... 8Methodology......................................................................................................................... 8
III. Description of the Region and of the Kunda Cement Plant ................................................... 12
Characteristics of the Region.............................................................................................. 12Plant Description and Process ............................................................................................ 12Pollution from the Kunda Plant .......................................................................................... 12
IV. Investment Program ............................................................................................................... 15
New Company Environmental Policy ................................................................................ 15Environmental Investment Program ................................................................................... 15
V. Impacts of the Environmental Investments ............................................................................. 17
Description of Impacts........................................................................................................ 17Quantifiable and Non-Quantifiable Impacts....................................................................... 18
VI. Economic Quantification of Environmental Impacts............................................................. 20
Raw Materials and Operating Benefits and Costs .............................................................. 20Soiling and Material Effects ............................................................................................... 21Real Estate .......................................................................................................................... 22Health.................................................................................................................................. 22Forestry ............................................................................................................................... 24Agriculture .......................................................................................................................... 25Tourism and Recreation...................................................................................................... 25SO2 and NOx Reduction Impacts....................................................................................... 26
VII. Cost-Benefit Analysis ........................................................................................................... 28
Return on Investment.......................................................................................................... 28Beneficiaries ....................................................................................................................... 30
VIII. Major Findings..................................................................................................................... 31
Bibliography.................................................................................................................................. 33

3
Abbreviations
CIF Cost, insurance, freightCOI Cost of illnessCVM Contingent valuation methodEEK Estonian kroonERR Economic rate of returnESP Electrostatic precipitatorFIM Finnish markFOB Free on boardIFC International Finance CorporationIRR Internal rate of returnKNC Kunda Nordic Cement CorporationNEFCO Nordic Environment Finance CorporationNOx Nitrogen Oxides; mainly NO2NPV Net present valuePM10 Particulate matter below 10 microns in diameterPV Present valueSO2 Sulfur dioxideTSP Total suspended particles (concentration in ambient air)US$ United States dollarsWTP Willingness to pay
Note: Exchange rates used in this study (prevailing in 1993): US$1=FIM5,2= EEK13

4
Foreword
This Discussion Paper breaks new ground for IFC. It considers the case of a cement plantin Estonia and tries to answer the question: how do the (private) costs of curbing pollutioncompare to the (social) benefits to the population? While it is often easy to estimate costs, it isexceedingly difficult to capture the benefits, especially in developing and transition countries.This pioneering empirical study concludes that in the case of Kunda Cement, the social benefitsexceed private costs by a margin wide enough to justify the environmental investment ineconomic terms.
Guy PfeffermannDirector, Economics Department
& Economic Adviser of the Corporation
5
Acknowledgments
The study was made possible thanks to the generous financial support provided by theInternational Finance Corporation (IFC) — Government of Finland Trust Fund. Additionalfunds were contributed by the Nordic Environment Finance Corporation (NEFCO); FinnFund;the Kunda Nordic Cement Corp. (KNC); and IFC.
Yannis Karmokolias of IFC developed the conceptual framework for the study andmanaged its implementation. Field work and preliminary analysis were carried out by Soil andWater Ltd., under Fjalar Kommonen, while work pertaining to the health impact was performedby Pekka Roto of the Tampere Regional Institute of Occupational Health. The support andparticipation of Harro Pitkanen of NEFCO is gratefully acknowledged.
Important contributors also include the staff of the health centers of KNC, Kunda Town,Rakvere Meat Factory and Rakvere Town; The Estonian Academy of Sciences; Malle Mandre ofthe Institute of Ecology; Aada Teedumae, Toomas Metslang and Anto Raukas of the EstonianInstitute of Geology; Angelos Pagoulatos of the University of Kentucky; and Pekka Laippala ofTurku University.
The project team obtained important data and comments from KNC; the NatureProtection Office of West-Viru county; the Ministry of Environment in Estonia; and the Ministryof Environment in Finland.

6
I. Executive Summary
Project economic analysis is based on estimating and comparing costs and benefits duringthe economic life of the project. Analysis is usually limited to those costs and benefits internal tothe project. Occasionally, external costs and benefits of public sector projects dealing withnatural resources have been valuated and included in the analysis but this is rarely the case forprivate sector projects.
An increase in environmental awareness in recent years, has led IFC, and otherinstitutions, to ensure that projects it finances are environmentally sound. This means that, whennecessary, borrowers must undertake capital and operating costs to ensure compliance withWorld Bank/IFC’s environmental guidelines. In practice, these “environmental” investmentcosts are included in a project’s economic analysis but corresponding benefits, generally, are not.As a result, the economic analysis is incomplete and its findings can be misleading.
Inclusion of environmental benefits and costs would improve significantly the reliabilityof the economic analysis and its value to private sector managers and public policy makers.More comprehensive environmental cost-benefit analysis would: Improve the estimate of aproject’s development impact; provide information to managers on the benefits associated withspecific environmental investments; and enlarge the information base available to public policymakers by estimating the benefit and identifying the beneficiaries of environmental investments.
This study entails an environmental cost-benefit analysis of a private sector project, usingthe Kunda cement factory in Estonia as a case study. Kunda was chosen because the existingfactory, which had been recently privatized, was a heavy polluter. The Kunda Nordic CementCorp. (KNC) had embarked on a US$31 million renovation, including US$8.7 million ofenvironmental investments to meet World Bank/IFC environmental guidelines. Thus, it waspossible to compare the “before and after” situation in pollution and related impacts. Kunda wasthe only source of pollution in the area so that there was no risk of mixing up pollution sourcesand impacts. Together with the advantages, Kunda also entailed some difficulties for the analysis.Data was generally scarce, particularly on market prices, as the transition from a communist to amarket economy had just gotten underway. It was, therefore, necessary to complement datacollected in Estonia with findings of studies conducted elsewhere.
The study identified all impacts related to Kunda’s air pollution but valuated only thosewhich had economic significance and for which data was available. These impacts included:Soiling and material damage; real estate values; health; forestry and agriculture; tourism; rawmaterials and personnel turnover at the cement company; and global effects of SO2 and NOxemissions. The rate of return for the environmental investments was estimated at about 25percent over fifteen years. Sensitivity analysis showed that even if benefits are drasticallyreduced, the rate of return remains acceptable at over 16 percent.
Most benefits take place in the vicinity of the factory. Significantly, important benefitsalso accrue to residents throughout Estonia and of nearby countries. This clearly demonstratesthat environmental policies should be approached from a broad international perspective.

7
II. Introduction
Major changes have taken place in recent years in the way the environment is regarded bypolicy makers and implementing agencies in governments, multilateral institutions and privatecompanies. Multilateral institutions understand that environmental protection is an integral part ofthe development process and have adopted measures to put this into practice. IFC has takenconcrete steps to ensure that environmental issues are addressed when potential IFC investments areappraised. Specifically, IFC has sought to arrest environmental damage by on-going projects inwhich IFC invests and to minimize any such damage in new projects.
Statement of the Problem
Projects are eligible for IFC financing if they meet four criteria. Appraisal of the projectmust conclude that it: is in the private sector and financially profitable; makes a positivecontribution to the country’s national economy; is technically feasible; and is environmentallysound.
Under current IFC practice, environmental analysis consists of ensuring that the project’sconstruction and operation, including that of existing facilities, do not violate the respectivecountry’s and World Bank/IFC’s environmental policies and guidelines. Otherwise, IFC will notinvest in the project. It is important to highlight that IFC’s environmental analysis, as practicedcurrently, is based on technical considerations. For example, in the case of an air polluting project,the analysis ascertains whether maximum emissions permitted under the guidelines are exceeded,and if they are, what must be done to lower emissions below the maximum limit. Complianceinvariably requires additional investment outlays by the sponsors. The environmental analysis doesnot address the economic aspects of environmental impacts such as their respective values, whetherthey are costs or benefits, and who bears the costs or enjoys the benefits.
Correspondingly, economic analysis of projects does not, as a matter of course, quantifyenvironmental factors. In general terms, economic analysis estimates incremental costs and benefitsdirectly related to the investment during the economic life of the project and calculates theeconomic rate of return (ERR). The analysis includes only costs and benefits internal to the project,adjusted, if necessary, for distortions because of, for example, subsidies, tariffs, or exchange ratediscrepancies. Ordinarily, environmental externalities are not included in the economic analysis.
Omission of substantial environmental impacts from a project’s economic analysis mayresult in a significantly distorted picture of its effect on the national economy. Often, their omissionalso distorts the estimate of a project’s profitability. For example, pollution could affect workers'health and productivity, health related company expenses, or corporate product marketability.
There are good reasons for estimating the costs and benefits of major environmentalimpacts and including them in a project’s economic analysis. Such analysis would result in:
• More accurate estimates of a project’s development impact;

8
• Broader information base for investment decision making;• Development of a management tool for company executives;• Better information for environmental policy makers. There are, as may be expected, valid reasons why this is not being done:
• It requires additional expenses;• Relevant data is scarce;• Findings may support claims for retroactive compensation.
Objectives of the Study
The main objective of the study was to investigate the feasibility of developing a practicalmethod to calculate, in economic terms, the major impacts of environmental investment undertakenby the private sector. The Kunda cement factory in Estonia was selected as a case study. The studyalso aimed to answer the following:
• What are the major environmental impacts of the investment?• Which of these impacts can be quantified? Why are other impacts not quantifiable?• Which are the investment costs and benefits, both internal and external to the project,
associated with the Kunda investment?• What is the ERR of these investments?• Who bears the costs and who are the beneficiaries of the environmental investments and
related impacts?
Methodology
Cost-benefit analysis, including externalities, has been used to evaluate some publicsector investment projects since the 1930s, although the practice became more prevalent in the1960s (Marglin, 1967; McKean, 1967). This has rarely been the case for private sector projects,where cost-benefit analysis has been confined to direct, or internal, costs and benefits. This wasdue, in part, to scarcity of relevant data and to the limited time and other resources available butalso due to the comparatively little emphasis placed on external effects, particularly theenvironment.
External effects of a project are usually defined as income or income-equivalent welfarechanges for individuals or groups not directly affiliated with the project. A project generatingexternal effects neither receives nor makes a full financial payment to these individuals orgroups. In economic analysis, all environmental effects, both costs and benefits, should beidentified and, where possible, quantified. Environmental effects can be quantified by measuringthe change in output that these effects cause in the economy. It is recognized, however, thatsome environmental effects, because of their nature, do not readily lend themselves toquantification.

9
The Kunda cement plant in Kunda, Estonia was selected as the case study. KNC used to befully-owned by the Government. At the time of the study, it had been partially privatized, asubstantial share had been bought by a consortium of private companies, and management had beentaken over by one of the Finnish sponsors. The new owners planned major renovation of thefactory, including pollution control. Part of the financing for the renovation was provided by IFC,the Nordic Environmental Finance Company (NEFCO), FinnFund, and EBRD.
The factory was the only major source of pollution in the area, which facilitated theidentification of impacts. The pollution was of major concern to all those involved in financing andoperating the plant, to the Government and, most of all, to the area residents who had expressedtheir concerns quite clearly and forcefully. The environmental impacts identified in the studywere measured as the differences between the following two scenarios:
Scenario A: The Kunda cement factory continues to operate without making investments forenvironmental improvements.
Scenario B: Environmental investments are implemented as planned and cement productioncontinues accordingly.
Differences in the environmental impacts projected in the "with" and "without” scenariosrepresent incremental costs and benefits quantified and monetized in this study. Costs weredefined as the investment and operating costs of new equipment to reduce pollution to the levelprescribed by World Bank/IFC guidelines. In project economic analysis, inputs and outputsshould be valued at their contribution to the national economy; i.e. the alternative productionforegone or the cost of alternative supplies. Because domestic market prices do not alwaysrepresent these opportunity cost values, alternative methods of valuation have been developed.The most common methods are briefly described in Box 1.
Of these methods, the market-valued direct cost approach was used whenever possible inthis study, as well as damage cost valuation and, to a lesser degree, hedonic pricing. Theresources available did not allow for generation of data that would have required a long time, e.g.data for health and tourism related benefits. In these cases, findings of other relevant studieswere used to complement or compare data collected in the course of this study. Willingness topay (WTP) field work to establish social cost valuations was not undertaken. WTP reliability,questionable in many situations, would have had especially limited value in Estonia, where acentrally planned economic system could have made responses devoid of a market price context.A consequence of this approach is that the benefits are probably underestimated, because non-quantifiable positive impacts have been omitted from the calculations. Tradable goods werepriced at border parity prices but because of data limitations in Estonia, parity prices were, attimes, substituted with those of nearby Finland (Curry and Weiss, 1993; Pagoulatos, 1992).

10
Box 1 Social Cost Valuation Methods
For welfare losses that cannot be directly calculated from market prices, several techniques havebeen developed to approximate social welfare losses from pollution. Commonly used valuationtechniques are briefly presented below.
Damage Cost ValuationReduction in income based on product market prices, increase of medical costs and indirect costsfrom illness. Dose-response functions relate the responses to pollutant concentrations, and theconcentrations are calculated from emission amounts and dispersion studies. Example: SO2 andNOx particle emissions which affect health, crop yield, forest growth, material damage andothers.
Replacement Cost ValuationCosts of emission reduction or costs of shadow projects (shadow projects are alternativemeasures to reduce emissions to the same recipient). Example: National or regional evaluationsof total and marginal costs to meet internationally agreed pollution reduction goals.
Avertive ExpendituresExpenditures for substitutes or complements to compensate for effects of pollution on “victims"of pollution. Example: Noise abatement using insulation, cost to farmers of more land or extrafertilizer to compensate for reduced crop yield.
Travel Cost MethodTravel expenditures to reach a recreational site indicate its value to society.
Hedonic Pricing MethodsPrices of marketed goods, e.g. housing, influenced by the presence of non-marketed goods, e.g.pollution. In such cases, valuation can be based on the effect of the state of the environment onproperty prices.
Experimental MethodsField studies of society's willingness to pay (WTP) for environmental improvement, orwillingness to accept (WTA) compensation for environmental damage. Examples: WTP to avoidchronic or acute illness, WTP to preserve endangered species.
Legal LiabilityDamage penalties paid according to law enforcement can give indications of the value to societyof environmental quality.
Costs and benefits were compared using standard cost-benefit analysis, includingconversion of money flows to net present value (NPV) at a real discount rate of 10 percent. The"profitability" was assessed in terms of the rate of return on the environmental investments (Littleand Mirrlees, 1974; Ray, 1984) by calculating the corresponding ERR. Local prices were converted

11
to US$ at the 1993 exchange rate of 13 Estonian Kroon (EEK) per US$. For the time seriesinvolved in NPV and IRR calculations, all values are expressed in 1993 constant prices.
The analysis followed the phases described below:
1. Identification of all impacts caused by pollution generated by the Kunda cement plant;2. Selection of impacts to be quantified and valuated, on the basis of economic significance and
availability of data;3. Description of non-quantifiable impacts;4. Valuation of selected impacts;5. Evaluation of the profitability of the proposed environmental investment on the basis of
NPVs and ERRs.

12
III. Description of the Region and of the Kunda Cement Plant
Characteristics of the Region
The KNC cement plant is situated in the town of Kunda, West-Viru county, about100 km east of Tallinn, Estonia’s capital. Kunda has a population of about 5,000. The plant waslocated there because of the proximity to raw materials. Limestone and clay deposits areavailable in Kunda and oil shale in Kivioli, about 45 km southeast.
The surrounding area is mostly covered with forest. There are also a number of farms forcrop production and dairying. The town has a small scenic fishing harbor that was recentlyexpanded for bulk shipping cement. At a distance of 3 to 7 km from the factory are beaches andother recreational areas, where about 2,000 persons spend summer vacations. There are alsosome archaeological sites dating to medieval times.
Plant Description and Process
KNC is the main employer in the Kunda area where the factory has been producingcement for several decades. The four kilns operating at present are quite old, having beeninstalled between 1961 and 1972. While Estonia was part of the Soviet Union, most cement wasmarketed within the Union, mainly in the St. Petersburg area. When Estonia becameindependent, former markets in the former Soviet Union were no longer available. The resultingdrop in demand caused production to decline from nearly full capacity of 900,000 tons in 1991 to500,000 tons in 1994. Since privatization, the objective has been to modernize the plant, restoreproduction to 900,000 tons by 1998, and develop new export markets, mainly in northernEurope.
Kunda cement is produced using the standard wet process. Oil shale is used instead ofcoal or fuel oil because it is locally available, its oil content is high and the oil shale ash is usedas raw material in cement production.
Pollution from the Kunda Plant
Prior to the environmental investment program, the Kunda plant generated air and waterpollution from its production processes and from solid waste mismanagement. Most significant ,by far, was air pollution, predominantly in the form of flue gases from the cement kilns. At fullproduction of 900,000 tons of cement, dust emissions amounted to a staggering 129,000 tons peryear. In addition, there were substantial SO2 and NOx emissions, as well as dust emissions fromoil shale preparation and grinding, transport of raw materials, and cement bagging operations.
Water pollution, although minuscule in comparison to the air pollution problem, relatedto inefficient use of water and to possible contamination of water supplies from occasional spills

13
in the fuel and lubricating oil storage areas. Waste from the plant was dumped at a landfill whichdid not meet Estonian and World Bank/IFC guidelines.
Air pollution has earned Kunda the dubious distinction of “The Gray Town of Estonia.”Area residents have been actively protesting the pollution problem. They have taken their case tothe national and local government authorities, to the media, and to KNC. They have organizedpetitions, seminars, demonstrations and have had frequent meetings with KNC. They managedto get the Kunda Town Council to discuss the possibility of closing the plant until pollutioncontrols were in place. The motion was not approved, in view of the plant’s importance to theregional and national economy, but the pollution issue remains very much alive for Kunda’sresidents.
To establish the spatial extent of the problem, a dispersion survey was carried out as partof this study, to find out where the dust settled. The survey estimated particle concentrations anddepositions in an area of 100 km2 around the plant. Dust dispersion measurements were made at356 receptors, placed at distances of 250 m to 1 km between receptor points. The survey results,presented in Table 1, show that particulate emissions from the unrenovated factory caused veryhigh levels of one-day dust concentrations.
Table 1
One-Day Dust Concentration Around Kunda Cement Factory
Distance From Plant
(km)
Dust concentrations
(µg/m3)
1-2 18003-5 500
6-10 300
Note: One-day concentration value is a daily value exceeded less than 2 percent of the time.
The annual concentration maximum was also extremely high at 263 µg/m3, compared to60 µg/m3 allowed in nearby Finland and 80 µg/m3 under World Bank/IFC guidelines. TheFinnish standard was exceeded throughout an area of 28 km2 around the plant.
The dispersion of PM10 (particulate matter below 10 microns in diameter) was alsoestimated. PM10 makes up 25 percent of cement dust emissions and is considered more harmfulto humans than larger particles. The survey showed that PM10 dispersion patterns are similar tothose of total suspended particles in the air (TSP) and that when TSP emissions are reduced,those of PM10 are reduced proportionally.
If the calculated particle concentrations are compared to Finnish and recently establishedEstonian air quality guidelines, one-day values exceeded the limit by 1,200 percent in the vicinityof the plant and by more than 100 percent in the total dispersion area. Maximum annual average

14
concentrations were 3.3 times higher than the World Bank guideline and 4.4 times the Finnishguideline. After the modernization, the highest daily values would be dramatically reduced toabout 10 percent of the air quality guidelines and the highest annual average concentrationswould be about 4 percent of the guideline.

15
IV. Investment Program
New Company Environmental Policy
After privatization, the new management adopted a new environmental policy with thefollowing objectives:
1. To meet Estonian environmental requirements as soon as possible;2. to meet all World Bank/IFC requirements within 3 years; and3. to be the best environmentally managed industrial company in Estonia within 5 years.
To meet these objectives, management embarked on a three-part strategy: First, itassigned responsibility for environmental matters to the general manager; second, it gave toppriority to investing in new equipment and modifying the production process, aiming to meetWorld Bank guidelines by end-1997; third, to give all KNC personnel basic environmentaltraining to increase their awareness and responsibility in environmental matters.
Environmental Investment Program
KNC gave priority to reducing dust emissions by installing new ESP flue gas filters andmodifying the kilns. By end-1996, all operating kilns would have an emission level of 50 mg/m3
according to World Bank/IFC guidelines. Total annual dust emissions, at full production of900,000 tons, would be reduced from almost 130,000 tons to below 10,000 tons.
Oil shale preparation, mainly grinding, would be improved by replacing existingequipment to reduce emissions from 4,000 mg/m3 to about 50 mg/m3.
Mills would be equipped with new ventilation and cooling systems, including new bagfilters. Emissions would be reduced from 4,200 mg/m3 to below 20 mg/m3. The fly ash receivingsilo would be equipped with a fabric cassette filter, bringing emissions down to 20 mg/m3.
Fabric filters would be installed at the cement bulk loading, where at present no de-dusting takes place. The cement packing plant and its silo would be renovated and the existingbag filters would be made operational.
Additional investments would be made to safeguard against water pollution and improvewaste management.
The total investment for the plant’s modernization was estimated at US$30.9 million, ofwhich US$8.7 million would be allocated for environmental improvements.
KNC’s investment program is summarized in Table 2.

16
Table 2
KNC Investment Program, 1993-1996
Environmental Other Total
(Thousands/US$)
Basic engineering 50 140 190Engineering of new cement plant 150 150Storage hall cranes -- 170 170Slurry preparation -- 125 125Oil shale preparation improvements 2135 670 2805Kiln improvements 4810 4035 8845Clinker conveying 310 90 400Grinding improvements 534 1850 2384Bulk loading and storage improvements 300 450 750Electrification 35 130 165Process control and instrumentation 210 835 1045Laboratory equipment -- 525 525Buildings and infrastructure restoration -- 800 800Finish grinding in closed circuit 150 2510 2660Palletizing line for cement bags -- 700 700Cement bag storage -- 350 350Port facilities 8000 8000Contingency 165 661 826
Total 8699 22191 30890Percent of Total Investment 28.2 71.8 100
Source: KNC

17
V. Impacts of the Environmental Investments
Description of Impacts
Actions taken by KNC, their effects on pollution and the corresponding impacts on theenvironment are summarized in Table 3.
Table 3
Environmental Impacts of KNC Actions to Reduce Pollution
KNC Action Effect on Plant Pollution Environmental Impact
Improve kilns; install ESPs;improve oil shale and cementgrinding, bagging andtransport operations
Dramatic reduction in dustemissions
Workers’ and residents’health; tree and plant growth;livestock health andproductivity; soiling ofbuildings, streets andhouseholds; town image; realestate values; tourism; factoryoperating costs
Energy saving in slurrypreparation
Lower SO2 /NOx emissions Health; corrosion; plant andtree growth; soiling
Oil spill prevention orcontainment; sewerrenovation; new waste landfillsite
Less water contaminationunder ground and in Kundariver
Health; fish population;salmon spawning
Some of the environmental impacts are confined locally but others occur over a muchlarger area. For example, the survey of dust dispersion showed that its effects are felt at the localand regional level but SO2 and NOx emissions, which are airborne over very long distances,affect the environment beyond Estonia’s borders. A geographical classification of Kunda’senvironmental impacts is shown in Table 4.

18
Table 4
Geographical Significance of the Environmental Impacts
Type of Pollution Geographical Area AffectedControl and Related Impact Local Regional National International
Dust emission- tree growth x x- crop production x x- tourism x x- health x- soiling x- real estate x- operating costs x- livestock x- fish population x- salmon spawning x x x x- town image x x x
So2 and NOx emission- tree growth x x x x- crop production x x x x- health x x x x
Ground water x x
River pollution x x
Quantifiable and Non-Quantifiable Impacts
Environmental impacts were classified, with respect to economic valuation, intoquantifiable and non-quantifiable. Among the former are: Health; forestry; agriculture; soiling;tourism and recreation; real estate value; SO2 and NOx impacts; and operating costs.
Non-quantifiable impacts, for the purposes of this study, are those for which valuejudgments would be required, e.g. regarding Kunda’s image, or for which data is unavailable ortheir economic significance is minor or are practically the same in both scenarios. Non-quantifiable impacts are briefly described in the following paragraphs.
There are indications that water pollution decreases fish catches and reduces the qualityof fish in the Kunda river. However, there has been no scientific work to verify that pollutionfrom the factory actually impacts on the fish and to what degree. The river is used only byrecreational fishermen, and even if there is an impact from reduced pollution, the incrementalcatch would be very small (Raukas and others, 1993). A more significant impact could occur onthe population of salmon in the Gulf of Finland, given that the Kunda river is one of the fewremaining spawning sites in the area.

19
Changing the image of Kunda from "the gray town of Estonia" into a clean andprosperous place to live is very important. Part of this has been quantified in other impacts suchas real estate values and the cost to KNC of personnel turnover. It is certainly important to thosewho have organized protests against Kunda pollution, as well as to the passive members of thecommunity. No attempt was made in this study to valuate these sentiments.
There have been reports of cement dust affecting the milk production and fertility of dairycows. Reliable studies establishing a cause and effect relationship between Kunda pollution andlivestock health or dairy production have not been carried out. Also, there are complaints thatcement dust has reduced the supply of berries, mushrooms and other horticultural produce in theforests. However, the affected forest area is limited and so is the market value of the goodsinvolved. The study did not attempt to calculate the WTP for these products by affectedindividuals.
In some areas, a negative effect of reduced dust deposition may be the result of decreasedneutralization of acid rain. This effect, however, is not so important in Estonia because of therelatively high buffer capacity of the soil.
20
VI. Economic Quantification of Environmental Impacts
Raw Materials and Operating Benefits and Costs
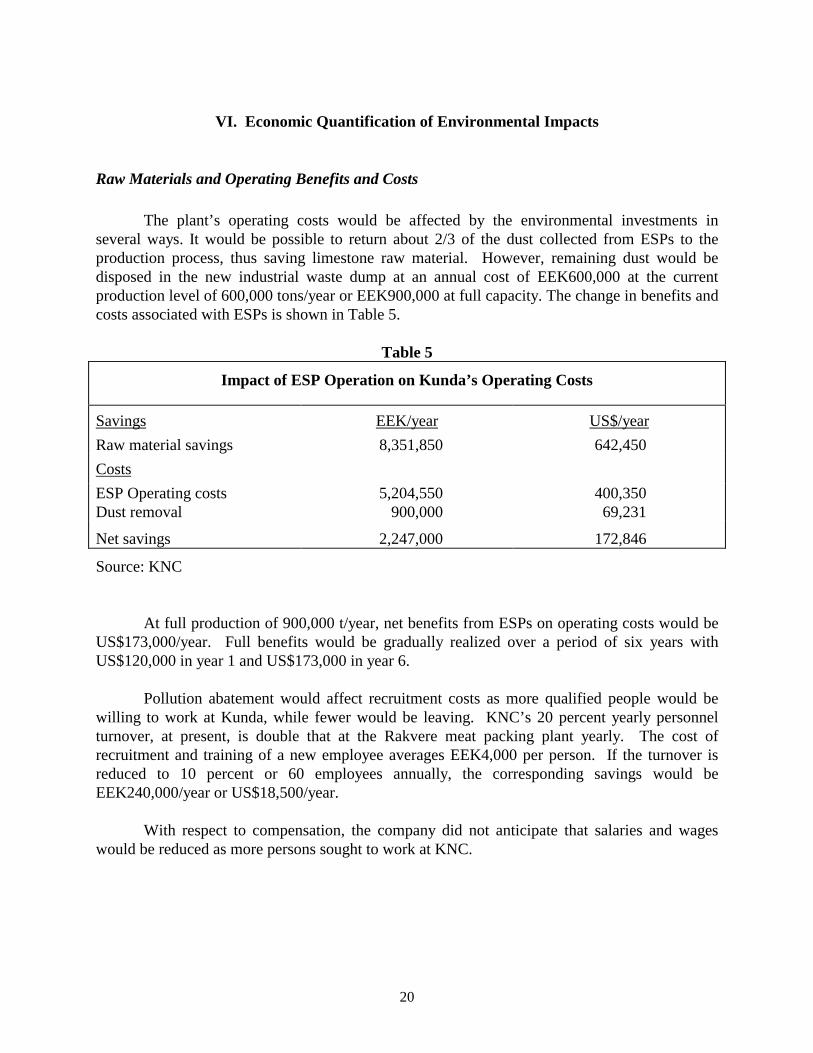
The plant’s operating costs would be affected by the environmental investments inseveral ways. It would be possible to return about 2/3 of the dust collected from ESPs to theproduction process, thus saving limestone raw material. However, remaining dust would bedisposed in the new industrial waste dump at an annual cost of EEK600,000 at the currentproduction level of 600,000 tons/year or EEK900,000 at full capacity. The change in benefits andcosts associated with ESPs is shown in Table 5.
Table 5
Impact of ESP Operation on Kunda’s Operating Costs
Savings EEK/year US$/yearRaw material savings 8,351,850 642,450CostsESP Operating costs 5,204,550 400,350Dust removal 900,000 69,231
Net savings 2,247,000 172,846
Source: KNC
At full production of 900,000 t/year, net benefits from ESPs on operating costs would beUS$173,000/year. Full benefits would be gradually realized over a period of six years withUS$120,000 in year 1 and US$173,000 in year 6.
Pollution abatement would affect recruitment costs as more qualified people would bewilling to work at Kunda, while fewer would be leaving. KNC’s 20 percent yearly personnelturnover, at present, is double that at the Rakvere meat packing plant yearly. The cost ofrecruitment and training of a new employee averages EEK4,000 per person. If the turnover isreduced to 10 percent or 60 employees annually, the corresponding savings would beEEK240,000/year or US$18,500/year.
With respect to compensation, the company did not anticipate that salaries and wageswould be reduced as more persons sought to work at KNC.

21
Soiling and Material Effects
Soiling of the town of Kunda from the thousands of tons of cement dust that have beenfalling on the town impose a dual burden on its residents. First, surfaces become dirty morequickly than they would in the absence of dust, so that streets, sidewalks, and floors have to beswept or dusted more frequently, and clothing must also be washed more frequently. Secondly,the dust, which is alkaline, damages painted surfaces such as walls, doors and automobiles. Nodamage has been reported to stone and brick surfaces.
Most studies of the impact of air pollution on buildings and materials have beenconcerned with acid pollutants like SO2 and NOx, and acid corrosion. In Kunda, the mainpollutant is alkaline cement dust, not known to cause corrosion but, in combination withmoisture, is damaging to painted surfaces. The cost of surface cleaning and painting in Kundawas estimated at about EEK250/m2. There are 160 individual houses in Kunda and the woodenpainted surface of an average house is estimated at 70 m2. (The remaining population live incinder-block apartment buildings). Interviews with Kunda residents revealed that the averageperiod between house painting of 8 years has been shortened by half because of the cement dust.Savings from less frequent painting were estimated at EEK750,000/year or US$577,000/year.Cars also needed more frequent repainting because of the dust. There were about 250 cars inKunda, half of which were not kept in garages. On an annual basis, the incremental cost of carpainting in Kunda because of the cement dust was estimated at EEK330/car for a total of aboutEEK58,000/year or about $4,800/year. These estimates do not include the cost of sweeping dustfrom the streets or buildings nor the cost of washing clothes.
Earlier studies have pointed out that actual expenses for cleaning, repair and maintenance,do not reflect the total value of household cleanliness (Watson and Jaksch, 1982; Freeman, 1982).Findings from these studies indicate that households do not always increase the frequency andcost of cleaning as the level of pollution rises. Nevertheless, total welfare loss is greater, becausehouseholds experience reduced utility from having to live in a dirty environment. Also, if repairsand maintenance are not kept up, the result would be more costly repairs later or reducedproperty values. Comprehensive studies of the cost of soiling in the US have found that thebenefit of reduced soiling from lower TSP corresponded to US$1.0 – US$1.5 per inhabitant for1.0 µg/m3 reduction. Partial findings in Kunda pointed to a slightly greater benefit but the datawas too limited to be sufficiently reliable. Applying the more conservative findings of earlierstudies to the 50 µg/m3 TSP decrease in Kunda results in a total economic benefit from reducedsoiling of: 4,700 inhabitants * 50 µg/m3 * US$1.5 = US$350,000/year. About 20 percentof this amount represented the cost of unskilled labor, a non-tradable, and the remaining 80percent the cost of paint, brushes, brooms and other supplies, all tradable. Unskilled labor inKunda was valued at the local wage level for a total of US$7,000. Costs for tradable items werevalued at import parity prices for a total of US$280,000 (Soil and Water Ltd., 1995). Thus, thetotal economic benefit from reduced soiling at Kunda was estimated at US$287,000 per year.

22
Real Estate
In January 1994 the Government assigned property values for the purpose of determiningtaxes and fees for use of state-owned land. The values were EEK12/m2 (US$0.9/m2) insideKunda town limits and EEK6,200/ha (US$0.05/m2 ) beyond town limits (Teedunae, 1994). Noother data exist and, in the absence of a real estate market in Estonia, it is not known whetherthese assigned prices represent actual values. These prices were about 1/20 to 1/10 of those forsimilar land in Finland.
Earlier studies have used hedonic pricing techniques to assess the impact of pollution onproperty values. They have concluded that, a one percent increase in TSP decreases propertyvalues by 0.05 percent to 0.14 percent (Pearce and Markandya, 1989). Typically, thisrelationship is not linear, especially when pollution levels increase substantially. Based on thisinformation, it could conservatively be assumed that in Kunda, where TSP reduction would beclose to 80 percent, real estate values would increase by at least 5 percent.
The total town area of Kunda is 1,001 ha (Raukas and others, 1993) of which about 66percent is buildings and the remaining vacant lots and fields. In economic valuation, land andunskilled labor, as non-tradable, should be shadow-priced, while construction materials andskilled labor should be valued at the appropriate border price. In the absence of data for Estonia,the average value of US$19.2/m2 for buildings in Finnish towns similar to Kunda was applied asa border parity price (Finnish National Board of Survey, 1994).
Thus the increase in economic value of buildings in Kunda from the reduction inpollution was estimated at 1,001 ha x 0.66 x 0.005 x US$192,000 = US$6.3 million. The valueof undeveloped land is about 10 percent that of buildings and the corresponding economic impactfrom reduced pollution would be 1,001 ha x 0.34 x 0.10 x 0.05 x $US192,000 = US$0.33million, for a total real estate benefit of US$6.6 million. In view of the time it will take forpollution to be reduced and for the realization of a cleaner Kunda to be reflected in real estatevalues, the real estate benefit was spread over five years, starting with the second year of theproject.
Health
During the planning stages of the study, discussions with Estonian government officialsand with Viru County and KNC health personnel indicated that the plant’s pollution causedsignificant health problems, related primarily to respiratory and dermatological illnesses. In viewof the apparent importance of the health issues involved, the Finnish Institute of OccupationalHealth joined the study team to assess the health impact of Kunda’s air pollution. It becameevident very quickly that this would be a complex and time consuming task. Possible impactsrelated to both chronic and acute respiratory problems that could best be studied with a time-series methodology spanning many years. This approach was not possible in this study becauseof time and budget limitations. Furthermore, many of the plant’s long-time workers were ethnic

23
Russians who had left the company, and possibly Estonia, after the country gained itsindependence from the Soviet Union.
Faced with these constraints, the study team decided to tackle the issue as follows: First,regarding chronic health problems, to rely on an on-going study by Orebro Medical CenterHospital of Sweden and the Estonian Institute of Experimental and Clinical Medicine which wasscheduled to be completed prior to this study. Secondly, regarding acute health problems, tocarry out a cross-section investigation comparing Kunda workers and Kunda residents to acontrol group of workers in a meat packing plant in Rakvere, about 30 km from Kunda. Rakverehas no heavy industry and the meat packing plant had been constructed recently according toFinnish environmental and occupational safety standards.
The results of the epidemiological cross-section study did not indicate statisticallysignificant differences in relevant symptoms or diseases between the groups tested (Roto andothers, 1995). This contradicted the perception of the participants in the health study, withKunda workers and town residents reporting significantly more air pollution related healthproblems than the Rakvere workers. Furthermore, three peer reviewers of the healthinvestigation gave differing opinions on the validity of the results but all suggested a time-seriesapproach which would require a number of years to complete. In the meantime, the completionof the Swedish-Estonian study of chronic effects had been delayed. It was, therefore, decided torely on existing studies that had dealt with the health impact of construction materials dust,including cement (Ostro, 1994). Dose-response relationships established on this basis are shownin Table 6.
Table 6
Morbidity Effects from a 10 µg/m3 Change in PM10 Concentration
Morbidity Low Estimate Central Estimate High EstimateRHA/100,000 6.57 12.0 15.6ERV/100,000 128.3 235.4 342.5RAD/person 0.404 0.575 0.903LRI/child 0.008 0.0169 0.0238Asthma attacks/asthmatic 0.163 0.326 2.73Respiratory symptoms/person 0.91 1.83 2.74Chronic Bronchitis/100,000 30.6 61.2 91.8
Notes: PM10 concentration is the annual average concentration in ambient air TSP below 10microns in diameter; RHA is Respiratory Hospital Admissions; ERV is Emergency Room Visits;RAD is Restricted Activity Days; LRI is Lower Respiratory Illness of children.
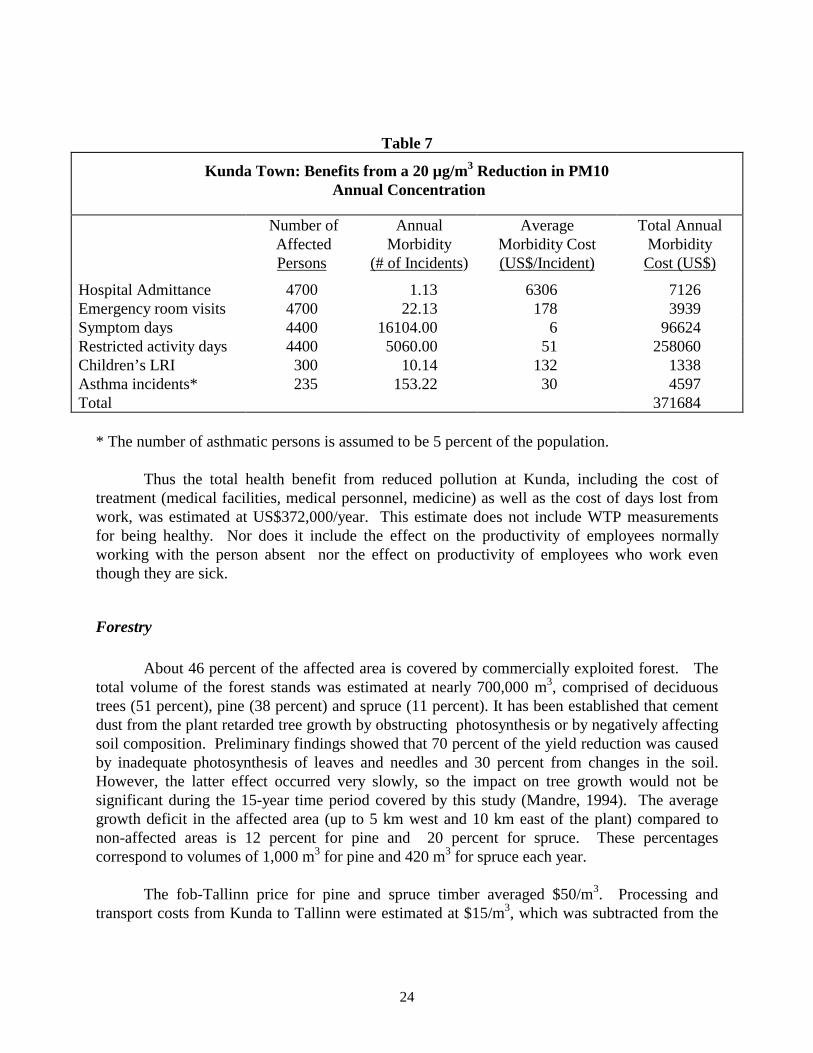
These general morbidity coefficients were monetized applying the findings of recentlycompleted studies (US Department of Energy, 1994) to the average change in PM10 concentrationin Kunda of 20 µg/m3. The change in PM10 had been established by the dust dispersion surveyundertaken in the course of this study. The results are shown in Table 7.
24
Table 7
Kunda Town: Benefits from a 20 µg/m3 Reduction in PM10 Annual Concentration
Number ofAffectedPersons
AnnualMorbidity
(# of Incidents)
AverageMorbidity Cost(US$/Incident)
Total AnnualMorbidityCost (US$)
Hospital Admittance 4700 1.13 6306 7126Emergency room visits 4700 22.13 178 3939Symptom days 4400 16104.00 6 96624Restricted activity days 4400 5060.00 51 258060Children’s LRI 300 10.14 132 1338Asthma incidents* 235 153.22 30 4597Total 371684
* The number of asthmatic persons is assumed to be 5 percent of the population.
Thus the total health benefit from reduced pollution at Kunda, including the cost oftreatment (medical facilities, medical personnel, medicine) as well as the cost of days lost fromwork, was estimated at US$372,000/year. This estimate does not include WTP measurementsfor being healthy. Nor does it include the effect on the productivity of employees normallyworking with the person absent nor the effect on productivity of employees who work eventhough they are sick.
Forestry
About 46 percent of the affected area is covered by commercially exploited forest. Thetotal volume of the forest stands was estimated at nearly 700,000 m3, comprised of deciduoustrees (51 percent), pine (38 percent) and spruce (11 percent). It has been established that cementdust from the plant retarded tree growth by obstructing photosynthesis or by negatively affectingsoil composition. Preliminary findings showed that 70 percent of the yield reduction was causedby inadequate photosynthesis of leaves and needles and 30 percent from changes in the soil.However, the latter effect occurred very slowly, so the impact on tree growth would not besignificant during the 15-year time period covered by this study (Mandre, 1994). The averagegrowth deficit in the affected area (up to 5 km west and 10 km east of the plant) compared tonon-affected areas is 12 percent for pine and 20 percent for spruce. These percentagescorrespond to volumes of 1,000 m3 for pine and 420 m3 for spruce each year.
The fob-Tallinn price for pine and spruce timber averaged $50/m3. Processing andtransport costs from Kunda to Tallinn were estimated at $15/m3, which was subtracted from the
25
fob price, giving an export parity price of $35/m3. Thus, the benefits from increased timberproduction once the pollution decreases were estimated at $34,790 per year.
Agriculture
Cement dust fallout affects about 1,850 ha of agricultural land. Crops mainly consist ofbarley, wheat, oats and potatoes. Earlier research had found that, depending on the species,growth is 23 percent to 33 percent lower in heavily polluted areas within one km from thefactory, compared to a control area. The impact is lower, as dust fallout decreases, averaging ayield reduction of 10 percent over the affected area of 1,850 ha of farmland (Mandre, 1994). Thereduction in rate of growth is strongly dependent upon climatic factors. Dust effects are smallestin cold and rainy seasons and largest when the growing season has been warm and sunny. Cropquality is also affected by dust downfall, based on experiments which show that crops exposed tocement dust have lower contents of beta-carotene and essential amino acids (Mandre, 1994).
The average price of crops in the affected area was estimated at US$780/ha cif-Tallinnequivalent. Handling and transport costs from Kunda were added, making the farm gate value atimport parity prices US$830/ha. With the reduction of dust fallout, yields would increase by 10percent. The impact on quality is not quantified because of lack of data. Because the quantityaffected by the plant’s pollution is small, prices of the various crops will not be affected from theincrease in supply. Thus, the total agricultural benefit from increased crop production in theaffected area after pollution has been reduced, would be 1,850 ha x 0.1x US$830/ha =US$101,000/year.
Tourism and Recreation
The area around Kunda is very scenic, especially along the coast. Yet, recreational andtourism activity is noticeably less than just beyond the dust dispersion area. Even where there isno dust deposition, the visible dust cloud rising from the factory and Kunda’s bad reputation alsoact as deterrents to would-be visitors. It is obvious that should air pollution be substantiallyreduced, tourism activity would rise. The question remains, however, how much tourism andhow much related spending would take place in the absence of pollution. To answer thisquestion would required extensive field research which was not possible within the constraints ofthis study. Consequently, this part of the analysis relies on secondary information about touristactivity and spending in other parts of Estonia and neighboring countries.
Most tourists in Viru County are Estonian nationals. An estimated 2,000 Estonians and300 foreigners spend their summer vacations at the fringe of the dust dispersion area. Practicallyall are Viru County natives who now live in Tallinn or in neighboring countries. It is assumedthat with the reduction of pollution, the number of vacationers in this area would increase by1,000 Estonians and by 150 foreigners, (Case A). If the pollution continues unabated, thenumbers would decrease by 1,000 and 150 persons, respectively, (Case B). Thus, the difference
26
in tourism volume between the two scenarios after 15 years would be 2,000 domestic tourists and300 foreign tourists.
Based on 1992 data, expenditures by foreign tourists amounted to EEK207/day with anaverage stay of 2.5 days. Domestic tourists spent EEK36/day, averaging 14 days per stay(Estonian Statistical Yearbook, 1993). In 1993 prices, total annual tourist expenditures would be:
Domestic tourists 2000 x 14 x 79 = EEK2212000Foreign tourists 300 x 2.5 x 449 = EEK336750Total = EEK2548750 or
US$196,000 per year
Because of the difficulty in calculating border prices for goods and services consumed bytourists, tourist expenditures in Finland were used as a proxy. In 1993 they averaged US$ 96/dayfor foreigners (Finnish Tourist Board, 1994a), and US$ 46/ day for local tourists (Finnish TouristBoard, 1994b; Finnish Tourist Board, 1994c) or 5.5 times higher than in Estonia. It was estimatedthat 50 percent of tourist expenditures related to tradable, e.g. food, drinks, supplies, whichshould be valued at border parity prices and 50 percent to non-tradable, such as labor andutilities.
Accordingly, the annual tourism benefit for tradable would be US$0.5 * 196 * 5.5 =US$539,000 and for non-tradable US$0.5 * US$196,000 = US$98,000, or a total of US$637,000.Since independence, tourism has been increasing rapidly in Estonia. Tallinn is the maindestination but the coast has also been attracting visitors leading to the construction of two newhotels in Viru county. It is difficult to project how tourism will develop over time. Adopting aconservative approach, it was assumed that tourism benefits would increase linearly over 15years, from about US$43,000 in year 1 to US$637,000 in year 15 of the project. Although theseestimates are based on plausible assumptions, they are probably conservative because in theabsence of pollution the average stay would probably be greater. Also, recent tourism activity inthe area, particularly of visitors from Germany and Sweden, suggests that tourism receipts wouldrise faster than assumed in this study.
SO2 and NOx Reduction Impacts
Energy savings achieved through process improvements in the factory have beencalculated by KNC to be 20 percent of existing energy consumption. This would, in turn, resultin lowering SO2 emissions by 1,200 tons/year and NOx emissions by 200 tons/year. Because SO2and NOx are transported over long distances, those originating in Kunda would affect areas farbeyond Estonia’s boundaries. A recent study found that 71 percent of SO2 and 87 percent of NOxemissions originating in Finland were deposited several hundred kilometers from the source ofemission, mostly in other countries (Tuovinen, 1994; Otterstrom and Koski, 1994). Other studieshave reached similar findings (Markandya and Rhodes, 1992; Pearce, Bann, and Georgiou, 1992;Finnish Ministry of the Environment, 1989). The Finnish study is especially relevant to Kundabecause it analyzed emissions originating in an area 50 km to 200 km from Kunda, a short

27
distance in comparison to the transboundary character of SO2/NOx impacts. It concluded that themost significant impacts from SO2 and NOx emissions are:
Morbidity: A dose-response function was established between SO2 concentration in the air andcough-days for children and of chest discomfort for adults. Values based on WTP to avoid thesesymptoms were estimated. NOx also caused morbidity, directly and via ozone formation, but itssignificance was small.Material impact: Dose-response functions were established between the SO2 concentration inair and deterioration of structural materials like zinc-plated steel, painted steel, aluminum,concrete and wood. Damages were valued for structures in Finnish urban areas.Forest growth: Forest damages due to acidification have been estimated in several studies ofcritical acidification loads in Finland. SO2 deposition was found responsible for 60 percent ofthe total acidification, NOx for 30 percent and ammonia for the rest. The potentially importantdamages on forests (mainly due to NOx concentration) have not been reliably valuated.Crop production: The combination of NOx and volatile organic substances in the air produceozone, part of which is from pollution imported from other countries. Results from severalpublished dose-response functions were applied to estimate relevant damage to crops.Water pollution: Water pollution damages were estimated from acidification of ground water,which causes corrosion in water pipes and from the reduction in fish populations.
The findings of the Finnish study regarding SO2/NOx emissions are summarized in Table8.
Table 8
Costs of SO2 and NOX Emissions from Energy Production in Finland
CostsImpact Cost per kg of SO2 emitted
(US$)Cost per kg of Nox emitted
(US$)Morbidity 0.77 -Material Damage 2.43 -Tree Growth 0.21 0.16Crop Production - 0.61Water Pollution 0.03 0.05Total 0.56 0.69
Source: Otterstrom and Koski 1994.
The values shown in Table 8 are lower than those estimated in the other studies but aremore relevant to Kunda because of Southern Finland’s proximity to the plant. These estimateswere, therefore, adopted in this study, giving annual benefits of US $672,000 for a 1,200 tonreduction of SO2 and US$138,000 for a 200 ton reduction in NOx.

28
VII. Cost-Benefit Analysis
Return on Investment
The cost of the environmental investments to reduce air pollution below the maximumallowed under World Bank/IFC guidelines consists of the capital and operating costs of thepollution control equipment and of other improvements in the factory. Benefits consist of lessraw material and personnel recruitment costs, less soiling, higher real estate values, lower healthcosts, increased forestry and agricultural production, higher tourism receipts and lower SO2/NOximpacts (Figure 1).
Figure 1 Present Value of Environmental Impacts
0 1 2 3 4 5 6 7
Forestry andAgriculture
KNC Net OperatingBenefits
Tourism
Soiling/MaterialDamage
Health
Real EstateValues
SO2/NOx Impacts
Impacts
PV in Million US$

29
Quantified incremental costs and benefits related to the environmental investments arepresented in Table 9. The table does not include benefits that were not quantified.
Table 9
Total Discounted Incremental Costs and Benefits
Costs/Benefits Present Value*(US$ million)
Costs Capital 8.00 Operating 3.55 Total Costs 11.55
Benefits Raw Materials 4.86 Personnel Turnover 0.17 Soiling Reduction 2.42 Real Estate Values 5.50 Health Improvement 3.09 Agriculture and Forestry 1.17 Tourism Receipts 2.22 SO2/NOx Reduction 6.78 Total Benefits 26.21
Economic Rate of Return (ERR) 24.7%
* 10 percent rate of interest
The reduction of dust concentration gives benefits that are more than twice the capital andoperating costs. The largest benefit is derived from the reduction of SO2/NOx emissions, theimpact of which extends over an area substantially larger than Estonia. The second largestbenefit relates to increased real estate values in the town of Kunda. However, given the stilluncertain situation with respect to transfer of ownership and the real estate market, the increasedvalues may not fully translate into tangible benefits for their owners. Cost savings in rawmaterials and energy are substantial and more than offset the operating and maintenance costs ofthe pollution control equipment. Health benefits are also substantial, and may be underestimatedbecause intangible factors such as the value of well-being were not included. Tourism receiptsare not as sizable as most other benefits but are also the least reliable, both with respect tomagnitude and as to the year in which they might materialize. There are plans for theconstruction of the Baltic Highway to connect Finland and the Baltic countries to Central Europeand to develop Kunda’s port into a marina for Finnish yachts. Should these plans materializebenefits from tourism would be much larger than estimated in this study.
The economic rate of return has been calculated at 24.7 percent which certainly justifiesthe investment. Estimates of the benefits tended to be on the conservative side and the return oninvestment could well be higher. At the same time, it is recognized that scarcity of data and the

30
absence of market transactions for some factors, necessitated the use of relevant findings fromother studies which may not be fully applicable to Kunda, even though pollution in Kunda wasmany times higher than that in most parts of the world. There is no doubt that the environmentalinvestment has significantly high returns. Even if the three most uncertain benefits are reducedby 50 percent (tourism, health, and real estate) the ERR would still be 19.7 percent, and with theadditional halving of SO2/NOx related benefits the ERR would be over 16 percent, whichdemonstrates that the investment in air pollution control results in significant benefits.
Beneficiaries
An important aspect of the cost-benefit assessment was to identify the groups of personsbenefitting from the environmental investments at Kunda. Beneficiaries include residents ofEstonia and of other countries in the region, as shown in Table 10.
Table 10
Present Value and Beneficiaries of Environmental Investments(US$ million)
Impact PV Beneficiaries
Forestry and agriculture 1.17 Forest owners and farmers within 5 km radius
Raw materials/ Employeeturnover*
1.48 KNC
Increased tourism 2.22 Enterprises and employees in Kunda region
Reduced soiling and materialdamages
2.42 Kunda residents
Reduced health care costs 3.09 KNC workers and Kunda residents
Real estate values 5.50 Real estate owners in Kunda
Less damage from SO2, NOxemissions
6.78 Inhabitants of European countries near Estonia
Of the total benefits of US$22.66 million (discounted to year 1 of the project and havingsubtracted ESP operating costs) about US$16 million accrue to residents of the Kunda region andnearly US$7 million to residents of a wide area encompassing all of Estonia, Latvia andLithuania and parts of Finland, Sweden, Norway, Russia, Belarus and Poland. If non-quantifiedbenefits are considered, e.g. water pollution and salmon spawning, welfare increases in Estoniaand neighboring countries would be even greater. Some of the environmental impacts whichaffect the Kunda area directly, also affect the whole country indirectly. For example, improvedhealth or increased tourism activity in the Kunda region generates national benefits in the form offoreign exchange or in terms of budget allocations for public health. It is significant that aninvestment concentrated in a single factory has substantial environmental and socioeconomicimpacts not only for the local community but also for Estonia and for neighboring countries.

31
VIII. Major Findings
Investments to reduce air pollution at Kunda cement factory would, once fullyimplemented, result in significant net economic benefits. The ERR has been calculated at 24.7percent and sensitivity analysis confirmed that even if benefits are significantly reduced, the ERRis over 16 percent.
The most important environmental benefits identified are: Reduced global effects of SO2and NOx emissions, better health and less health-related costs, reduced soiling and materialdamage, increased tourism income, greater real estate values, and increased forestry andagricultural yields. Additional benefits were identified but were not valuated because of limiteddata.
It is important to highlight that benefits occur over a wide geographical area. Althoughmost would take place in the vicinity of the factory, important benefits also accrue to Balticcountries and to parts of Russia, Belarus, Finland, Sweden, Norway and Poland.
This type of research requires an inter-disciplinary team approach. In this study,environmental impacts ranged across several disciplines including agriculture, forestry, fisheries,livestock, chemistry, real estate, health, engineering, business and economics.
Data limitations, of both technical and economic data, made the study period longer thanhad been anticipated and necessitated the use of findings from other parts of the world, whichmay have resulted in underestimating some impacts and overestimating others. The sensitivityanalysis indicated that, for this study, these over/under-estimates do not materially affect theconclusions of the study.
Findings of this type of study have many applications in the private sector, including:
• Improved project investment analysis;• Clearer demonstration of the development impact of environmental investments;• Help in developing investment plans, by estimating the returns to specific environmental
investments;• Improved corporate image and public relations;• Higher environmental awareness.
Environmental cost-benefit analysis can also help public policy makers with respect to:
• Funding investments;• Providing incentives;• Justifying environmental regulations;• Establishing penalties for non-compliance of regulations.

32
The research initiated in this study should be continued through subsequent case studiesto establish the degree of validity and replicability of the findings in other locations and acrossdifferent economic activities.

33
Bibliography
Curry, Steve, and John Weiss. 1993. Project Analysis in Developing Countries. New York: St.Martin's Press, Inc.
Estonian Statistical Yearbook. 1993. Tallin.
Finnish Ministry of the Environment. 1989. Committee Report 1990:11, Report of the NitrogenOxide Committee. Helsinki.
Finnish National Board of Survey. 1994. Real Estate Price Statistics 1993. Helsinki.
Finnish Tourist Board. 1994a. Foreign Tourism in Finland 1993. Publication No. A:84.Helsinki.
. 1994b. The Traveling of Finns – May to August 1993. Publication No. A:86. Helsinki.
. 1994c. The Traveling of Finns – January to April 1993. Publication No. A:85.Helsinki.
Freeman A. 1982. Air and Water Pollution Control: A Benefit-Cost Assessment. New York:John Wiley & Sons, Inc.
Little, Ian, and James Mirrlees. 1974. Project Appraisal and Planning for DevelopingCountries. New York: Basic Books.
Mandre, Malle. 1994. Estimation of Economical Losses of Forests and Quality of AgriculturalPlants on the Territories Affected by Air Pollution from Cement Plant in Kunda.Unpublished. Institute of Ecology, Estonian Academy of Sciences, Tallinn.
Marglin, Stephen. 1967. Public Investment Criteria. Cambridge, MA: MIT Press.
Markandya A. and B. Rhodes. 1992. “External Cost of Fuel Cycles - An Impact PathwayApproach, Economic Valuation,” Metroeconomica Ltd., EC/US Fuel Cycle Study.
McKean, Roland. 1967. Efficiency in Government through Systems Analysis. New York: JohnWiley & Sons, Inc.
Ostro, Bart. 1994. “Estimating the Health Effects of Air Pollutants: A Method with anApplication to Jakarta,” Policy Research Working Paper 1301. World Bank, PolicyResearch Department, Washington, D.C.
Otterstrom T., and P. Koski. 1994. “Ekono Energy Ltd. & Soil and Water Ltd.: Assessment ofExternal Costs of Energy Production in Finland,” Report prepared for the SIHTI 2 project.
Pagoulatos, Angelos. 1992. Investment Project Evaluation: Financial and Economic Analysis.Lexington, Ky.: TMI.
Pearce D., and A. Markandya. 1989. In OECD (Organisation for Economic Co-operation andDevelopment). “Environmental Policy Benefits: Monetary Valuation.” Paris: OECD.
Pearce D., C. Bann, and S. Georgiou. 1992. “The Social Cost of Fuel Cycles.” Report to theU.K. Department of Trade and Industry by The Centre for Social and Economic Research onthe Global Environment (CSERGE), London.

34
Raukas, Anto, and others. 1993. Environmental Impact Assessment for the Area of Influence ofReconstructed Kunda Cement Factory. Tallinn: Estonian Ministry of Environment.
Ray, Anandarup. 1984. Cost-Benefit Analysis-Issues and Methodologies. Baltimore, MD.:Johns Hopkins University Press.
Roto, Pekka, and others. 1995. Respiratory Symptoms and Pulmonary Function Among KundaCement Workers and Kunda Inhabitants. Unpublished. Regional Institute of OccupationalHealth, Tampere.
Soil and Water Ltd. 1995. “Economic Evaluation of Major Environmental Impacts from thePlanned Investments at Kunda Nordic Cement Plant in Estonia.” Consultant’s Report,Helsinki.
Teedunae, Aada. 1994. Raw Material Fee Study of the Quarrying Operations in Kunda. Instituteof Geology, Estonian Academy of Sciences, Tallinn.
Tuovinen, J-P. 1994. “Sulphur and Nitrogen Oxide Balances for Finland” in T. Otterstrom T.and P. Koski. “Ekono Energy Ltd. & Soil and Water Ltd.: Assessment of External Costs ofEnergy Production in Finland,” Report prepared for the SIHTI 2 project.
U.S. Department of Energy and DG XII of the Commission of the European Community. 1994.“Estimating Externalities of the Coal Fuel Cycle,” Report No. 3 on External costs andbenefits of fuel cycles, Oak Ridge Laboratory and Resources for the Future.
Watson W., and J. Jaksch. 1982. “Air Pollution: Household Soiling and Consumer WelfareLosses,” Journal of Environmental Economics and Management 9:248-262.

35