healthcare best practices & tools - rochester … best practices & tools . ... this...
TRANSCRIPT

Healthcare Best Practices for identifying and measuring food waste
©2016 Rochester Institute of Technology http://bit.ly/NYSP2IFoodStudy Pg. 1 of 18
Healthcare Best Practices & Tools for identifying and measuring food waste
1 Introduction After conducting multiple food waste studies at medium to large NYS food waste generators (hospitals, grocers, universities, and catering event venues), NYSP2I developed a 12-step Food Waste Self-Assessment How-to Guide (How-to Guide). To address the unique needs of hospitals and nursing homes, NYSP2I developed three (3) additional resources; a printable Healthcare Log Sheet to use during the assessment, this Healthcare Best Practices document, and a Microsoft Excel Healthcare Results file.
This Healthcare Best Practices document expands upon the How-to Guide by providing:
• Guidance for successfully using the Healthcare Log Sheet, including examples. • Food waste study best practices for hospitals and nursing homes. • Instruction and examples how the Healthcare Results file may be successfully used.
2 Why conduct a food waste self-assessment? • Knowing the source, loss reason, and amount of food waste helps identify opportunities to reduce
the waste along with labor, purchasing and disposal costs. • Food waste that cannot be reduced could otherwise be diverted from landfill. Surplus
(overproduction) food may be donated, bringing possible tax benefits and increasing community relations. Food scraps may be recycled by composting or anaerobic digestion, turning the waste into useful products such as fertilizer or electricity. Resources and information are available on the Divert page of the NYSP2I Food Systems Sustainability Clearinghouse (http://bit.ly/NYSP2IFood), about how, what, and where to donate surplus food or recycle food scraps.

Healthcare Best Practices for identifying and measuring food waste
©2016 Rochester Institute of Technology http://bit.ly/NYSP2IFoodStudy Pg. 2 of 18
3 Healthcare Log Sheets – Guidance and Examples Studying Healthcare food waste requires different approaches for pre- and post-consumer waste. Pre-consumer waste is both generated and handled by staff (e.g. serving or plating lines, prep kitchen). Post-consumer waste is generated by patients, nursing home residents and cafeteria customers, and is handled by staff in the dining area or tray/dish room. Also, post-consumer waste is often mixed with non-food waste (e.g. packaging, napkins). NYSP2I developed two separate log sheets after pilot studies at six hospitals and skilled nursing facilities. This section details how to successfully use the separate pre-consumer and post-consumer Healthcare Log Sheets in a study. The file with both pre- and post-consumer waste logs is available for download at http://bit.ly/NYSP2IFoodStudy.
3.1 Pre-consumer Waste Log – example The first page in the Healthcare Log Sheet file is the Pre-consumer Waste Log, and is used to record the pre-consumer prep waste, pan scrapes, expired, quality (E.g. burned), and surplus food. In the Figure 1 example the facility serves both patient meals and cafeteria customer meals at breakfast, lunch and dinner. Note that the dinner waste is saved from the night before, and is measured first in the example.
Figure 1: Example Post-consumer Waste Log

Healthcare Best Practices for identifying and measuring food waste
©2016 Rochester Institute of Technology http://bit.ly/NYSP2IFoodStudy Pg. 3 of 18
3.2 Post-consumer Plate Waste Log & Customer / Patient Count – example The most effective way to measure per patient or per customer post-consumer food (plate) waste is to take a representative sample and then scale the results. NYSP2I created the second page in the Healthcare Log Sheet file, the Post-consumer Plate Waste Log & Customer / Patient Count sheet, to record this study data. Use the top section Post-consumer Waste - Representative sample to record plate scrapes and returns. Use the bottom section Total Meals Served – Assessment Day to record the number of meals served to patients, cafeteria customers, coffee bar customers, etc., see Figure 2 and also Section 3.6.
Figure 2: Example Pre-consumer Waste Log & Customer / Patient Count
Top section = study data
Bottom section = customer counts
Healthcare Best Practices for identifying and measuring food waste
©2016 Rochester Institute of Technology http://bit.ly/NYSP2IFoodStudy Pg. 4 of 18
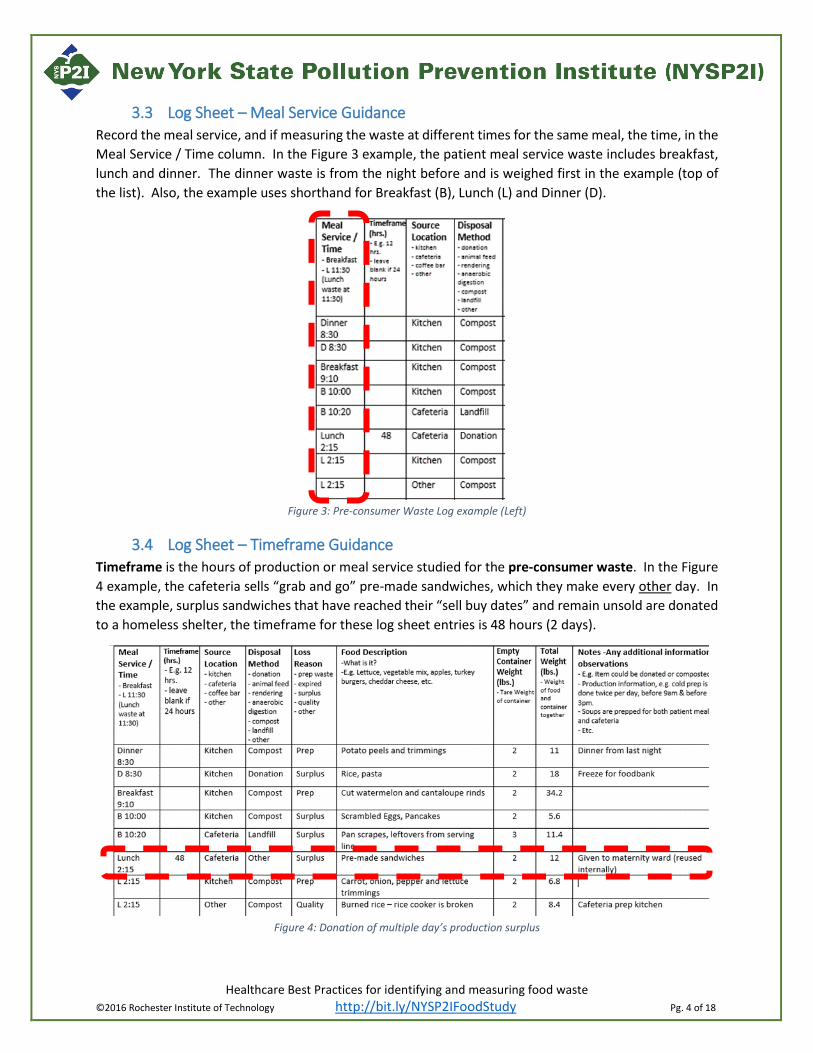
3.3 Log Sheet – Meal Service Guidance Record the meal service, and if measuring the waste at different times for the same meal, the time, in the Meal Service / Time column. In the Figure 3 example, the patient meal service waste includes breakfast, lunch and dinner. The dinner waste is from the night before and is weighed first in the example (top of the list). Also, the example uses shorthand for Breakfast (B), Lunch (L) and Dinner (D).
Figure 3: Pre-consumer Waste Log example (Left)
3.4 Log Sheet – Timeframe Guidance Timeframe is the hours of production or meal service studied for the pre-consumer waste. In the Figure 4 example, the cafeteria sells “grab and go” pre-made sandwiches, which they make every other day. In the example, surplus sandwiches that have reached their “sell buy dates” and remain unsold are donated to a homeless shelter, the timeframe for these log sheet entries is 48 hours (2 days).
Figure 4: Donation of multiple day’s production surplus

Healthcare Best Practices for identifying and measuring food waste
©2016 Rochester Institute of Technology http://bit.ly/NYSP2IFoodStudy Pg. 5 of 18
Note about donations: Weigh and record items for donation where they are stored to maintain food safety and do not de-package them. Clean the scale before weighing donated items.
3.5 Log Sheet – Source Location Guidance The Source Location is the area or station that creates the waste, and is recorded on the log sheet to identify where to focus improvement efforts, see figure 5:
Figure 5: Healthcare Log Sheet
In addition to typical source locations found in healthcare settings, there is the ‘other’ option in the Healthcare Results File (Figure 5). Use the ‘other’ source location to identify:
• A specific cafeteria area such as the Salad Bar or Grill. • A specific kitchen area such as patient coffee (grounds and filter waste) or cold prep. • A secondary cafeteria/dining area. • Catering event (E.g. staff luncheon, holiday party, training class, etc.) prep waste. • Any other source that is not already on the list.
3.6 Log Sheet – Disposal Method Guidance The Disposal Method is how the food waste is disposed of, and is used to identify what is donated, landfilled and recycled (Figure 5). Recycling includes rendering, compost and anaerobic digestion. Note that any food that is reused internally is NOT waste because it isn’t disposed of, a few reuse examples:
• Surplus food provided as staff meals. • Cafeteria pre-made sandwiches past the sell by date are given to the maternity ward at the end of
the cafeteria dinner service.
3.7 Log Sheet – Measuring post-consumer plate waste –representative samples Start with an empty trash bag and count trays or customers as the waste is emptied into it. Then sort, weigh / count and record the food waste, including beverage waste. See the How-to Guide (Section 6a) for more information.
This sheet is used to measure the two largest post-consumer plate waste areas: the cafeteria eat-in area and the patient tray dishwashing area, along with a third area ‘other’ (Figure 6). If there is an area besides the cafeteria or patient tray return that has plate waste, record it in ‘Other’ on the sheet.

Healthcare Best Practices for identifying and measuring food waste
©2016 Rochester Institute of Technology http://bit.ly/NYSP2IFoodStudy Pg. 6 of 18
Figure 6: Example of post-consumer waste log sheet - representative sample
The key metric for post-consumer waste is waste per person. Once the waste per person is known, the total waste for the day, week and year may be calculated for both the average census / number of occupied beds and the staffed beds (capacity). From the Figure 6 example, the calculations are as follows:
• Patient breakfast waste is shown as the first two lines in the example: o Patient + Patient Beverage total food waste = (18 - 2) + (17 - 2) = 16 + 15 = 31 lbs. o Number of trays sampled = 79 patients o Waste per patient = 31 lbs. / 79 = 0.39 lbs. / person o At 208 patients (census for the study date), waste per week = 0.39 x 208 x 7 = 568 lbs. o At 250 beds (Staffed beds), waste per week = 0.39 x 250 x 7 = 683 lbs.
When sorting patient plate waste, another best practice is to set aside and count any unopened single-serve beverages (Figure 7). Record this count and total weight on the Log Sheet using the ‘patient beverages’ source location. This provides valuable feedback on how many unopened beverages are being thrown out, which can be a significant cost, allowing for targeted improvement efforts.
Figure 7: Unopened beverages found in patient waste by the NYSP2I team during a hospital assessment.

Healthcare Best Practices for identifying and measuring food waste
©2016 Rochester Institute of Technology http://bit.ly/NYSP2IFoodStudy Pg. 7 of 18
4 Healthcare Food Waste studies – best practices4.1 Logistics – Assessment length (2a)
Typical assessments will take 3-8 hours to capture 24 hours of waste. Not all of this is active time; staff may work on other activities in between measurements. A best practice is to hold the previous evenings waste, then sort and measure it during the assessment day.
4.2 Logistics – Collection plan (2b) Note all pre-consumer waste locations that will need to be assessed. Assigning responsibility of certain trash bins to workers and using brightly colored tags and signs to alert staff are best practices to have a successful food waste assessment. To collect post-consumer waste (patient, cafeteria) as a sample, staff will have to be present to count trays as they are emptied into the sample collection bag and to then bring the bag to the assessment location determined in (2c).
4.3 Logistics - Locating space for the assessment (2c) The assessment location should be set-up near the compactor. This is convenient as well as reduces the chance that food waste is disposed of before measurement.
4.4 Logistics – Schedule (2d) Coordinate with staff to identify drop-off or pick-up times for the waste by source. There will be pre- and post-consumer food waste for each meal service. Kitchen prep waste and patient plate waste are typically the largest sources of food waste due to large volumes of prepared food and patients not finishing their food. If it is a strain on resources to take samples of plate waste, it is suggested that patient plate waste is prioritized over cafeteria plate waste, which is typically smaller.
4.5 Logistics - Determining number of people (2e) Generally, 2-3 people are required to sort, record, and weigh waste. More details are available in the How-to Guide.

Healthcare Best Practices for identifying and measuring food waste http://bit.ly/NYSP2IFoodStudy
© 2016 Rochester Institute of Technology Pg. 8 of 18
5 Healthcare Results File The Healthcare Results File is available for download at http://bit.ly/NYSP2IFoodStudy. The file is used to calculate food waste averages and to identify trends and focus areas for improvement efforts. To obtain results, enter customer and assessment information and the file will do the rest.
5.1 Instructions tab The Instructions tab provides step-by-step instructions on using the file (Figure 8).
Tabs:
Figure 8: Healthcare Results File Instructions Tab

Healthcare Best Practices for identifying and measuring food waste http://bit.ly/NYSP2IFoodStudy
© 2016 Rochester Institute of Technology Pg. 9 of 18
6 Healthcare Results – Entering the assessment information The Excel Healthcare Results has two tabs for data entry and the remainder to summarize the results. The two tabs to enter information onto are the Customer Info and Log Sheet tabs.
6.1 Customer Info tab Facility and customer volume information is required to calculate the results, and is entered onto the Customer Info tab. Required entries are colored green as seen in Figure 9. The information in the example below is the same as shown in 3.6.
Figure 9: Customer Info Tab

Healthcare Best Practices for identifying and measuring food waste http://bit.ly/NYSP2IFoodStudy
© 2016 Rochester Institute of Technology Pg. 10 of 18
6.2 Log Sheet tab The Log Sheet tab has two sections for the study information (Figure 9). The top section, Section B - PLATE WASTE (post-consumer) SAMPLE DATA, is where the number of post-consumer trays/patients/customers measured is entered. Section B is only used to scale the results. Section A – LOG SHEET INFORMATION, is for all the pre- and post-consumer measurements.
Figure 10: Results File - Log Sheet Tab to enter data
Note that the Meal Service, Source Location, Disposal Method and Loss Reason columns have drop-downs boxes, an example drop-down on the Log Sheet tab (Figure 11):
Figure 11: Example drop-down
Top section = customer counts for
Post-consumer
Bottom section =
study data

Healthcare Best Practices for identifying and measuring food waste http://bit.ly/NYSP2IFoodStudy
© 2016 Rochester Institute of Technology Pg. 11 of 18
Post-consumer waste - number of trays measured & unopened beverages counted In Section B (top), enter the number of trays / customers measured for each area studied (Patient, Cafeteria, Other) by meal. If a meal wasn’t studied, pick one of the other meals from the drop-down menu in the “Same per Person Waste As” column so that the result can be scaled and calculated for a full day. In the Figure 12 example, Cafeteria breakfast waste was not studied, instead, lunch waste per person was used to calculate the results. In Section A enter the number of patient beverages found if applicable.
Figure 12a: Printable Log Sheet data
Figure 12b: Results File

Healthcare Best Practices for identifying and measuring food waste http://bit.ly/NYSP2IFoodStudy
© 2016 Rochester Institute of Technology Pg. 12 of 18
7 Healthcare Results - Viewing results After you enter the assessment data in the Customer Info and Log Sheet tabs, the Overview tab provides the bulk of the results.
7.1 Overview Tab The first section shows the scaled daily, weekly, monthly and yearly food waste generation amounts, (Figure 13).
Figure 12: Results from Overview Tab
An example of how the total daily amount of food is scaled in Figure 13 (donated food amount):
• In the kitchen, 16 lbs. of surplus pasta and rice are frozen and donated to a food bank on the day of the study (Figure 10) – 18 lbs. total weight – 2 lbs. container weight.
• The study day had 1,508 meals served, the average day has 1,449 meals served (Figure 9). • This information is used to scale the results using this equation:
o Weight from study x ( average meals per day / actual meals on study day ) • The average donated food per day = 16 x ( 1,449 / 1,508 ) = 15 lbs. • How this works is that the waste per person is the same for both the study day and the average day:
o Actual weight / actual meals on study day = 16 / 1,508 = 0.011 lbs. / person o Average food weight / average number of meals = 15.4 / 1,449 = 0.011 lbs. / person
• The only thing that changes from the observed (16 lbs.) to average (15.4 lbs.) is the patient / cafeteria customer volume.
Along with the total waste amounts, the waste by source location, meal service and loss reason are calculated and summarized as shown in Figure 14.

Healthcare Best Practices for identifying and measuring food waste http://bit.ly/NYSP2IFoodStudy
© 2016 Rochester Institute of Technology Pg. 13 of 18
Figure 13: Waste by source location, meal and loss reason
On the Overview tab, there is a section detailing Patient beverage information (Figure 15), such as how many beverages are disposed of yearly and the corresponding weight.
Figure 14: Beverage Information from Overview Tab
At the end of the Overview tab is a comparison of the facilities average food waste to the research-based estimated food waste for healthcare facilities of a similar size. The estimate (Figure 16) compares the number of beds at the facility and information from the NYS Food System Sustainability Clearinghouse (http://www.rit.edu/affiliate/nysp2i/food/tools/food-waste-estimator) to make the comparison.

Healthcare Best Practices for identifying and measuring food waste http://bit.ly/NYSP2IFoodStudy
© 2016 Rochester Institute of Technology Pg. 14 of 18
Figure 15: Actual Waste vs. Research-based Estimate of Food Waste
The Source and Loss Reason tabs go into the specific details of what items came from which source and why they were being disposed of. These tabs are useful to help you identify specific food waste reduction opportunities after reviewing the results for the Overview tab.
7.2 Source Tab On the Source tab (Figure 17), view all the waste items that were disposed of from each source location.
Figure 16: Source Tab

Healthcare Best Practices for identifying and measuring food waste http://bit.ly/NYSP2IFoodStudy
© 2016 Rochester Institute of Technology Pg. 15 of 18
7.3 Loss Reason Tab The Loss Reason tab (Figure 18), summarizes why there is food waste. The reasons include plate waste, prep waste, expired food, surplus food, quality issues and ‘other’.
Figure 17: Loss Reason Tab

Healthcare Best Practices for identifying and measuring food waste http://bit.ly/NYSP2IFoodStudy
© 2016 Rochester Institute of Technology Pg. 16 of 18
7.4 Surplus tab The Surplus (Figure 19) tab provides detailed information on current amounts of surplus food, highlighting opportunities to reduce prep / kitchen labor, energy and purchasing costs. Educational information / web links about donating surplus that cannot be reduced are also included.
Figure 18: Surplus tab

Healthcare Best Practices for identifying and measuring food waste http://bit.ly/NYSP2IFoodStudy
© 2016 Rochester Institute of Technology Pg. 17 of 18
7.5 Recycling tab The Recycling (Figure 20) tabs provides information on how much could be recycled (food scraps) compared to the current state. Educational information / web links about recycling food are also included.
Figure 19: Recycling tab

Healthcare Best Practices for identifying and measuring food waste http://bit.ly/NYSP2IFoodStudy
© 2016 Rochester Institute of Technology Pg. 18 of 18
8 Conclusion NYSP2I offers several other programs with available NYS funding to assist with a more in-depth look at potential food waste reduction and landfill diversion solutions. NYSP2I is available to review the assessment results and identify potential areas in which to provide assistance.
Prepared by:
New York State Pollution Prevention Institute (NYSP2I) Rochester Institute of Technology 111 Lomb Memorial Drive Rochester, New York 14623-5608 Phone: (585) 475-4146 Fax: (585) 475-5250 Web: http://www.nysp2i.rit.edu E-mail: [email protected]
9 Funding and Acknowledgement Funding for this document is provided by the Environmental Protection Fund as administered by the New York State Department of Environmental Conservation. Any opinions, findings, conclusions or recommendations expressed are those of Rochester Institute of Technology and its New York State Pollution Prevention Institute and do not necessarily reflect the views of the Department of Environmental Conservation.