s. k. mathanker, j. d. maughan, a. c. hansen, t. e. grift...
TRANSCRIPT

Transactions of the ASABE
Vol. 57(2): 355-362 © 2014 American Society of Agricultural and Biological Engineers ISSN 2151-0032 DOI 10.13031/trans.57.10167 355
SENSING MISCANTHUS SWATH VOLUME FOR MAXIMIZING BALER THROUGHPUT RATE
S. K. Mathanker, J. D. Maughan, A. C. Hansen, T. E. Grift, K. C. Ting
ABSTRACT. The cost of harvesting is one of the constraints in improving biofuel economics. Adjusting the ground speed of harvesting machines to maximize their throughput rate in relation to yield level is one of the ways to reduce harvesting cost. To control the ground speed of a baler, a real-time sensor that can predict the swathed-biomass yield in front of the baler would be an invaluable tool. It was hypothesized that the swathed-biomass volume is a reliable predictor of the swathed-biomass yield. A light detection and ranging (LIDAR) based sensing system was developed to sense swathed-biomass volume and was field tested. To correlate the sensed swathed-biomass volume with the Miscanthus yield, a new bale-specific method was developed. A linear correlation (R2 = 0.76) was found between Miscanthus yield and sensed swathed-biomass volume at the time of mowing-conditioning. Yield maps were generated using the developed correlation model. The model was also used to predict the harvested plot biomass. The average percent error in predicting the har-vested plot biomass was 12.4% for training plots and 10.1% for validation plots. The analysis revealed that a proper con-trol strategy to maximize the baler throughput rate would be to either operate the large square baler at the maximum fea-sible ground speed (6 km h-1) or at the maximum achievable throughput rate (35 Mg h-1). For the specific case analyzed, the proposed control strategy would result in the following advantages: 38.0% higher field capacity, 35.6% higher throughput rate, and 30.4% lower baling cost. Further studies and field evaluation of the proposed control strategy are needed. Studies are also needed to extend the swathed-biomass volume sensing concept to corn stover, other energy grasses, and forage crops.
Keywords. Automation, Baling, Bioenergy, Biomass, Control system, Cost, Harvesting, Yield map, Yield sensor.
ellulosic ethanol and other biomass-based fuels are being considered as an alternative to fossil fuels. Many bioenergy crops are being investi-gated to determine their suitability on a sustaina-
ble basis. Studies indicate that Miscanthus is emerging as a candidate crop because of its high productivity and low input requirements (Heaton et al., 2008). However, high biomass harvesting cost is one of the constraints in making biofuels economically viable. Further, biomass harvesting cost was found to be one of the most sensitive factors in the biomass delivery cost (Khanna et al., 2008). In-field yield variability creates challenges in configuring machine set-tings that are optimum for the whole field plot. These chal-lenges result in a fluctuating machine throughput rate and biomass harvesting cost (Mathanker et al., 2014). Further, these challenges ultimately result in higher biomass cost and lower throughput rate on a whole-plot basis.
There are studies examining the impact of varying oper-
ating parameters on machine performance. Mathanker et al. (2014) reported that a 41.3% higher throughput rate could be achieved by adjusting the ground speed depending upon the sensed Miscanthus yield level in front of a mower-conditioner. Shinners et al. (2009) reported that the throughput rate for corn grain and stover increased from 30.7 to 49.2 Mg h-1 when the ground speed of the corn ear snapper head was varied from 4.5 to 7.2 km h-1. Isaac et al. (2006) optimized the ground speed of a combine harvester to maximize net income. McRandal and McNulty (1978) reported that the ground speed was proportional to the power requirement for a two-drum rotary grass-mower. These studies show that adjusting ground speed improves throughput rate and thereby harvesting economics. Howev-er, there are no studies investigating a biomass yield sensor mounted in front of a baler to control its ground speed.
Various biomass yield sensing approaches have been in-vestigated to predict yield depending on the machine used and crop harvested. To predict timothy grass yield, five sensors were mounted on a forage harvester (Savoie et al., 2002). To predict alfalfa yield, a torque sensor was used to measure the power consumed by the mower-conditioner rolls (Kumhála et al., 2007). To predict sugarcane yield on a billet-type sugarcane harvester, a weighing plate was used, and the prediction accuracy was 89% (Mailander et al., 2010). To predict sugarcane yield, an optical yield sen-sor was developed by Price et al. (2011), and the reported prediction accuracy was 92.5%. To predict Miscanthus yield in front of a disk mower-conditioner, Mathanker et al.
Submitted for review in March 2013 as manuscript number PM 10167;
approved for publication by the Power & Machinery Division of ASABEin March 2014.
The authors are Sunil K. Mathanker, ASABE Member, Post-Doctoral Research Associate, Justin D. Maughan, ASABE Member,Graduate Student, Alan C. Hansen, ASABE Member, Professor, Tony E. Grift, ASABE Member, Associate Professor, and K. C. Ting, ASABE Fellow, Professor and Head, Department of Agricultural andBiological Engineering, University of Illinois at Urbana-Champaign, Urbana, Illinois. Corresponding author: Alan Hansen, 360 AESB, 1304W. Pennsylvania Ave., Urbana, IL 61801; phone: 217-333-2969; e-mail:[email protected].
C
356 TRANSACTIONS OF THE ASABE
(2014) developed a sensing system that measured Miscan-thus stem bending force, and the prediction accuracy was 90.0%.
Ranging sensors have been widely used to estimate crop parameters. To improve agricultural machinery perfor-mance, Dworak et al. (2011) reviewed three types of rang-ing sensors: light detection and ranging (LIDAR), radar, and ultrasonic. Based on their review, the LIDAR sensors were found most suitable for vehicle‐based measurement of crop stand and orchard parameters (Dworak et al., 2011). An ultrasonic sensor that measured grass height predicted the biomass yield with an accuracy of 78.6% (Fricke et al., 2011). Hosoi et al. (2011) used LIDAR to map the three-dimensional structure of tomato plants. Zhang and Grift (2012) used LIDAR to measure Miscanthus stem height. Lenaerts et al. (2012) used LIDAR to monitor output straw quality from a combine harvester with the aim of facilitat-ing the subsequent baling operation.
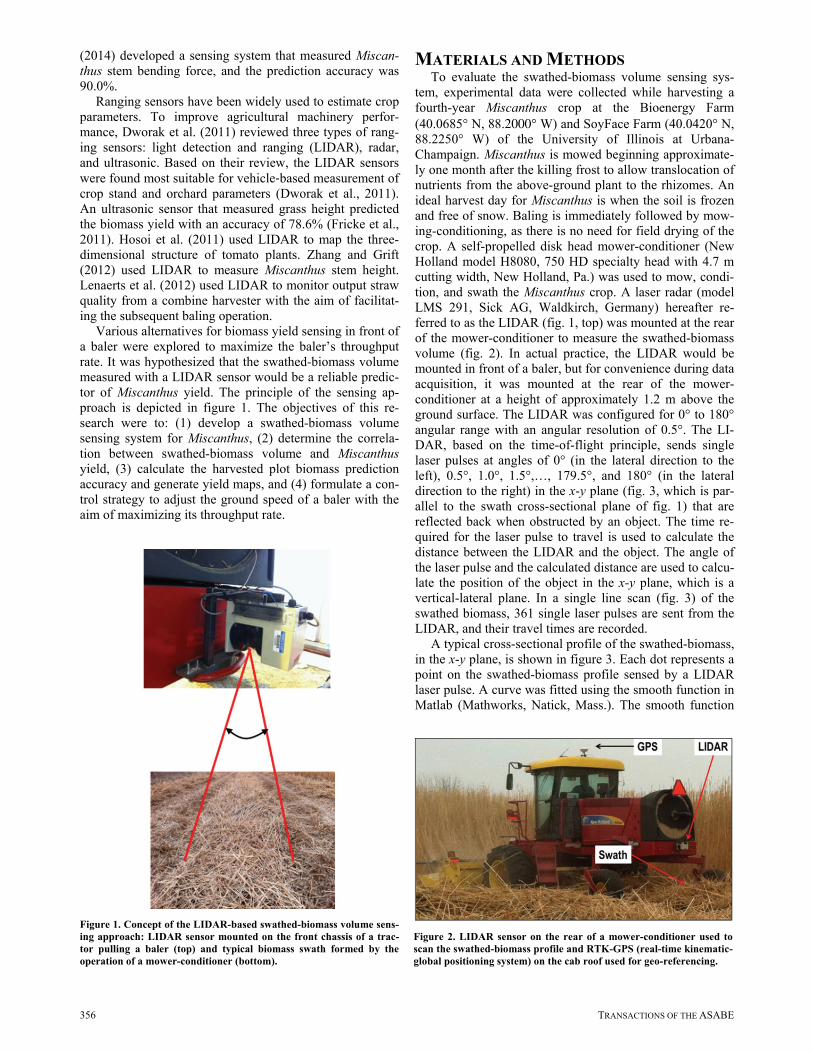
Various alternatives for biomass yield sensing in front of a baler were explored to maximize the baler’s throughput rate. It was hypothesized that the swathed-biomass volume measured with a LIDAR sensor would be a reliable predic-tor of Miscanthus yield. The principle of the sensing ap-proach is depicted in figure 1. The objectives of this re-search were to: (1) develop a swathed-biomass volume sensing system for Miscanthus, (2) determine the correla-tion between swathed-biomass volume and Miscanthus yield, (3) calculate the harvested plot biomass prediction accuracy and generate yield maps, and (4) formulate a con-trol strategy to adjust the ground speed of a baler with the aim of maximizing its throughput rate.
MATERIALS AND METHODS To evaluate the swathed-biomass volume sensing sys-
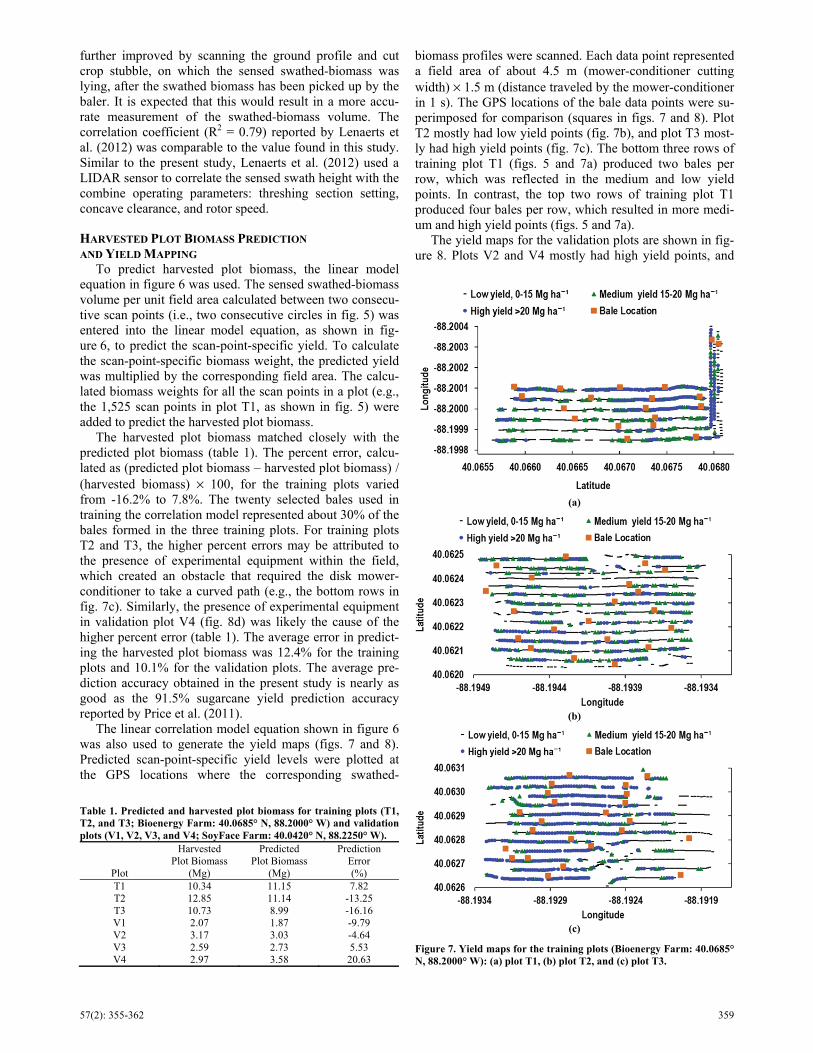
tem, experimental data were collected while harvesting a fourth-year Miscanthus crop at the Bioenergy Farm (40.0685° N, 88.2000° W) and SoyFace Farm (40.0420° N, 88.2250° W) of the University of Illinois at Urbana-Champaign. Miscanthus is mowed beginning approximate-ly one month after the killing frost to allow translocation of nutrients from the above-ground plant to the rhizomes. An ideal harvest day for Miscanthus is when the soil is frozen and free of snow. Baling is immediately followed by mow-ing-conditioning, as there is no need for field drying of the crop. A self-propelled disk head mower-conditioner (New Holland model H8080, 750 HD specialty head with 4.7 m cutting width, New Holland, Pa.) was used to mow, condi-tion, and swath the Miscanthus crop. A laser radar (model LMS 291, Sick AG, Waldkirch, Germany) hereafter re-ferred to as the LIDAR (fig. 1, top) was mounted at the rear of the mower-conditioner to measure the swathed-biomass volume (fig. 2). In actual practice, the LIDAR would be mounted in front of a baler, but for convenience during data acquisition, it was mounted at the rear of the mower-conditioner at a height of approximately 1.2 m above the ground surface. The LIDAR was configured for 0° to 180° angular range with an angular resolution of 0.5°. The LI-DAR, based on the time-of-flight principle, sends single laser pulses at angles of 0° (in the lateral direction to the left), 0.5°, 1.0°, 1.5°,…, 179.5°, and 180° (in the lateral direction to the right) in the x-y plane (fig. 3, which is par-allel to the swath cross-sectional plane of fig. 1) that are reflected back when obstructed by an object. The time re-quired for the laser pulse to travel is used to calculate the distance between the LIDAR and the object. The angle of the laser pulse and the calculated distance are used to calcu-late the position of the object in the x-y plane, which is a vertical-lateral plane. In a single line scan (fig. 3) of the swathed biomass, 361 single laser pulses are sent from the LIDAR, and their travel times are recorded.
A typical cross-sectional profile of the swathed-biomass, in the x-y plane, is shown in figure 3. Each dot represents a point on the swathed-biomass profile sensed by a LIDAR laser pulse. A curve was fitted using the smooth function in Matlab (Mathworks, Natick, Mass.). The smooth function
Figure 1. Concept of the LIDAR-based swathed-biomass volume sens-ing approach: LIDAR sensor mounted on the front chassis of a trac-tor pulling a baler (top) and typical biomass swath formed by theoperation of a mower-conditioner (bottom).
Figure 2. LIDAR sensor on the rear of a mower-conditioner used to scan the swathed-biomass profile and RTK-GPS (real-time kinematic-global positioning system) on the cab roof used for geo-referencing.

57(2): 355-362 357
outputs the smoothed y-coordinate values (solid line in fig. 3), which were used in calculating the swathed-biomass profile area. The average stubble height was the mean of the smoothed y-coordinate values for the x-coordinate range of -1.2 to -2 m and +1.2 to +2 m (fig. 3). It was measured to account for varying machine height due to ground undulations and cut crop stubble. The swath height at each data point (dots in fig. 3) was determined by sub-tracting the average stubble height from the smoothed y-coordinate value at that data point. To calculate the cross-sectional area between two consecutive data points, their swath heights and the distance between them (in the x-direction) were input to a trapezoidal formula. The cross-sectional areas at all consecutive data points in the -1.2 to +1.2 m range of x-coordinate values, which approximately represents a typical swath width, were added together to calculate the cross-sectional area of the swathed-biomass profile in the x-y plane.
The swathed-biomass profile was scanned with the LI-DAR at 0.78 s intervals using a program written in Matlab while mowing Miscanthus. An RTK-GPS (real-time kine-matic global positioning system) unit was used to record the latitude and longitude of the disk mower-conditioner at 1 s intervals using a program written in LabVIEW (Nation-al Instruments, Austin, Tex.). The LIDAR scan locations were matched to the closest GPS locations of the mower-conditioner because of the time difference in their record-ing. After recording the swathed-biomass profiles, a large
square baler (New Holland model BB9080, New Holland, Pa.) baled the swathed-biomass. An RTK-GPS unit was used to record the latitude and longitude of the large square baler at 1 s intervals using a program written in LabVIEW. A 149 kW tractor (model 7930, John Deere, Moline, Ill.), capable of generating 134 kW PTO power, pulled the baler. The tractor engine torque and speed were also recorded, but detailed results will be published elsewhere. An on-the-go bale weighing system was fitted on the baler. The GPS co-ordinates of the locations where bales were tied and re-leased were recorded. Both of these features were part of a commercial yield monitor (model 479, Harvest Tec, Hud-son Wisc.) fitted to the square baler (fig. 4). The weights and locations of the bales were used to determine bale-specific Miscanthus yield.
To correlate the sensed swathed-biomass volume with the Miscanthus yield, a new bale-specific system was de-veloped (Mathanker et al., 2014). It consisted of determin-ing Miscanthus yield and swathed-biomass volume from the field area in which a bale was formed. To calculate the bale-specific Miscanthus yield, the GPS locations of the bales and their weights were used. The squares and stars in figure 5 show the GPS locations where the formation of a bale was completed in training plot T1. The unique identi-fication numbers assigned to the bales by the yield monitor are also shown in figure 5. For the correlation study, the bale with the higher identification number within a straight row was selected, but only if more than one bale was formed in that row. For example, bale number 435 (fig. 5)
Figure 5. GPS locations of recorded data for training plot T1: circles indicate LIDAR scan points where the swathed-biomass profile was scanned, red squares indicate bales selected in the correlation study, and stars indicate bales not selected in the correlation study. The numbers are unique bale identification numbers.
Figure 3. Typical swathed-biomass profile sensed with the LIDAR on the rear of the mower-conditioner while mowing Miscanthus.
Figure 4. Large square baler (New Holland model BB9080) used in experimental data collection.

358 TRANSACTIONS OF THE ASABE
was selected from the bottom row. The distance between bales 434 and 435 was calculated using their GPS loca-tions. To calculate the field area from which bale 435 was formed, the distance between bales 434 and 435 was multi-plied by the effective cutting width of the disk mower-conditioner. To calculate the bale-specific Miscanthus yield of the plot section from which bale 435 was formed, the weight of bale 435 was divided by the field area from which bale 435 was formed. Care was taken to avoid se-lecting a bale if the baling operation in that field section was affected by operational difficulties such as inconsistent biomass flow, which typically originated from inconsistent conditioning of the sturdy Miscanthus stems, as they re-quire high force for mechanical failure (Johnson et al., 2012; Liu et al., 2012).
To calculate the bale-specific swathed-biomass volume, the swath profile cross-sectional areas and the center-to-center spacing of the swath profiles were used. The swathed-biomass volume between two consecutive LIDAR scans (circles in fig. 5) was calculated by inputting their profile cross-sectional areas (similar to fig. 3) and the lon-gitudinal distance between the scans, which is the distance in the direction perpendicular to the x-y plane of figure 3, to the trapezoidal formula. To calculate the swathed-biomass volume in the formation of a bale, the swath-biomass vol-umes at all consecutive LIDAR scan points were added. For example, the swathed-biomass volumes at the 54 con-secutive scan points (circles in fig. 5) between bales 434 and 435 were added to calculate the sensed swathed-biomass volume pertaining to bale 435. The total swathed-biomass volume was then divided by the field area from which bale 435 was formed to calculate the bale-specific swathed-biomass volume. A total of 20 such bales from the training plots (T1, T2, and T3) were selected, and their cor-responding bale-specific sensed swathed-biomass volume and bale-specific Miscanthus yield were determined.
To generate yield maps and predict harvested biomass, a correlation model between the bale-specific sensed swathed-biomass volume and the bale-specific Miscanthus yield was trained using all 20 selected bale data points. The scan-point-specific swathed-biomass volume per unit field area sensed at a specific scan point (circles in fig. 5) was entered into a trained correlation model equation to predict the scan-point-specific yield. To generate a yield map, the predicted yield levels were divided into three categories: low yield (<15 Mg h-1), medium yield (15 to 20 Mg h-1), and high yield (>20 Mg h-1). The yield level categorization was assumed for better presentation of the results in this study; it is not related to agronomic performance. The pre-dicted scan-point-specific yield was multiplied by the cor-responding field area to calculate the scan-point-specific biomass weight. All scan-point-specific biomass weights in a plot were added to predict the harvested plot biomass.
Using recorded GPS data, the ground speed of the square baler during formation of a bale was calculated. The bale-specific field capacity (ha h-1) of the baler was calcu-lated by assuming the effective width of cut as 4.5 m and the field efficiency as 80% (ASABE Standards, 2011). The bale-specific throughput rate (Mg h-1) was calculated by multiplying the bale-specific field capacity and the bale-
specific Miscanthus yield (Mg ha-1). Similarly, the bale-specific baling cost ($ Mg-1) was calculated by dividing the cost of use per hour ($ h-1) by the bale-specific throughput rate. The cost of use per hour for the baler was calculated based on ASABE Standards EP496.3 and D497.7 (ASABE Standards, 2006, 2011) with the following assumptions: the baler list price was $110,000, annual use was 300 h, and repair and maintenance costs over the life-span of the baler were 75% of the list price. Similarly, the cost of use for the tractor was calculated with following assumptions: the list price was $160,000, annual use was 1600 h, and repair and maintenance costs over the life-span of the tractor were 80% of the list price. The cost of use per hour for the baling operation was $159.
RESULTS AND DISCUSSION The developed swathed-biomass volume sensing system
was field tested while harvesting Miscanthus. Bale-specific yield and corresponding sensed swathed-biomass volume were correlated. The developed correlation model was used in predicting harvested plot biomass and generating yield maps. It was also used for quantifying the impact of the sensing system from an economic perspective.
SENSED SWATHED-BIOMASS VOLUME AND MISCANTHUS YIELD CORRELATION
Twenty bales selected from the three training plots were used to determine the correlation between swathed-biomass volume and Miscanthus yield. Bale-specific sensed swathed-biomass volume, bale formation area, and bale-specific yield were determined for each of the selected bales. A linear relationship (R2 = 0.76) was found between the sensed swathed-biomass volume per unit field area and the harvested Miscanthus yield after mowing-conditioning (fig. 6). The density of the swathed biomass varied from 16.5 to 27.8 kg m-3 as the yield and swath volume in-creased. The variable crop flow through the conditioning rolls, due to yield variability, might have contributed to differences in conditioning of the crop, and it led to differ-ences in swathed-biomass density. The correlation coeffi-cient could be further improved if an accurate biomass weighing system could be employed to weigh the biomass from the field area between two consecutive scan points (circles in fig. 5). The correlation coefficient could also be
Figure 6. Correlation between sensed swathed-biomass volume and harvested Miscanthus yield.
57(2): 355-362 359
further improved by scanning the ground profile and cut crop stubble, on which the sensed swathed-biomass was lying, after the swathed biomass has been picked up by the baler. It is expected that this would result in a more accu-rate measurement of the swathed-biomass volume. The correlation coefficient (R2 = 0.79) reported by Lenaerts et al. (2012) was comparable to the value found in this study. Similar to the present study, Lenaerts et al. (2012) used a LIDAR sensor to correlate the sensed swath height with the combine operating parameters: threshing section setting, concave clearance, and rotor speed.
HARVESTED PLOT BIOMASS PREDICTION AND YIELD MAPPING
To predict harvested plot biomass, the linear model equation in figure 6 was used. The sensed swathed-biomass volume per unit field area calculated between two consecu-tive scan points (i.e., two consecutive circles in fig. 5) was entered into the linear model equation, as shown in fig-ure 6, to predict the scan-point-specific yield. To calculate the scan-point-specific biomass weight, the predicted yield was multiplied by the corresponding field area. The calcu-lated biomass weights for all the scan points in a plot (e.g., the 1,525 scan points in plot T1, as shown in fig. 5) were added to predict the harvested plot biomass.
The harvested plot biomass matched closely with the predicted plot biomass (table 1). The percent error, calcu-lated as (predicted plot biomass – harvested plot biomass) / (harvested biomass) × 100, for the training plots varied from -16.2% to 7.8%. The twenty selected bales used in training the correlation model represented about 30% of the bales formed in the three training plots. For training plots T2 and T3, the higher percent errors may be attributed to the presence of experimental equipment within the field, which created an obstacle that required the disk mower-conditioner to take a curved path (e.g., the bottom rows in fig. 7c). Similarly, the presence of experimental equipment in validation plot V4 (fig. 8d) was likely the cause of the higher percent error (table 1). The average error in predict-ing the harvested plot biomass was 12.4% for the training plots and 10.1% for the validation plots. The average pre-diction accuracy obtained in the present study is nearly as good as the 91.5% sugarcane yield prediction accuracy reported by Price et al. (2011).
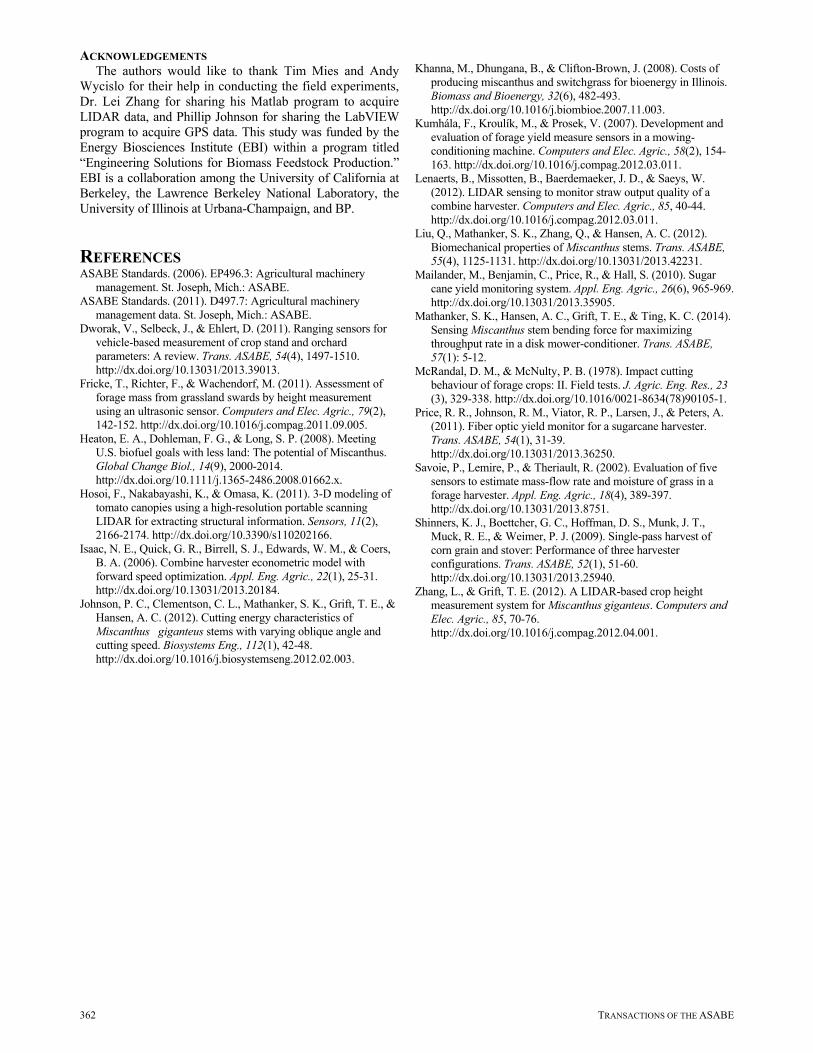
The linear correlation model equation shown in figure 6 was also used to generate the yield maps (figs. 7 and 8). Predicted scan-point-specific yield levels were plotted at the GPS locations where the corresponding swathed-
biomass profiles were scanned. Each data point represented a field area of about 4.5 m (mower-conditioner cutting width) × 1.5 m (distance traveled by the mower-conditioner in 1 s). The GPS locations of the bale data points were su-perimposed for comparison (squares in figs. 7 and 8). Plot T2 mostly had low yield points (fig. 7b), and plot T3 most-ly had high yield points (fig. 7c). The bottom three rows of training plot T1 (figs. 5 and 7a) produced two bales per row, which was reflected in the medium and low yield points. In contrast, the top two rows of training plot T1 produced four bales per row, which resulted in more medi-um and high yield points (figs. 5 and 7a).
The yield maps for the validation plots are shown in fig-ure 8. Plots V2 and V4 mostly had high yield points, and
Table 1. Predicted and harvested plot biomass for training plots (T1,T2, and T3; Bioenergy Farm: 40.0685° N, 88.2000° W) and validationplots (V1, V2, V3, and V4; SoyFace Farm: 40.0420° N, 88.2250° W).
Plot
Harvested Plot Biomass
(Mg)
Predicted Plot Biomass
(Mg)
Prediction Error (%)
T1 10.34 11.15 7.82 T2 12.85 11.14 -13.25 T3 10.73 8.99 -16.16 V1 2.07 1.87 -9.79 V2 3.17 3.03 -4.64 V3 2.59 2.73 5.53 V4 2.97 3.58 20.63
(a)
(b)
(c)
Figure 7. Yield maps for the training plots (Bioenergy Farm: 40.0685° N, 88.2000° W): (a) plot T1, (b) plot T2, and (c) plot T3.

360 TRANSACTIONS OF THE ASABE
plot V3 mostly had low yield points. The left one-third sec-tion of validation plot V1 had low-quality Miscanthus crop, which was reflected in there being no yield points (fig. 8a). The validation plots (SoyFace Farm: 40.0420° N, 88.2250° W) were located about 3 km away from the training plots (Bioenergy Farm: 40.0685° N, 88.2000° W), which indi-cates the robustness of the developed sensing system. The generated yield maps (figs. 7 and 8) are fairly accurate and could be used to plan precision agriculture operations for Miscanthus. The validation plot yield maps (fig. 8) are comparable to yield maps generated using a biomass yield sensing system that measured the Miscanthus stem bending force during harvest (Mathanker et al., 2014).
SWATHED-BIOMASS SENSING FOR MAXIMIZING THROUGHPUT RATE
The primary objective behind the swathed-biomass sens-ing system was to predict the biomass yield in front of a baler and to use this knowledge to control the ground speed of the baler. The previous sections demonstrated the ap-plicability of the swathed-biomass volume sensing system. This section quantifies the impact of applying the devel-oped sensing system to a 2 ha Miscanthus area baled in Illinois.
The machine operator adjusted the ground speed, to some extent, depending on the Miscanthus yield level (sol-id line in fig. 9). This resulted in a lower baler throughput rate for low-yielding areas (fig. 10). The average measured engine torque was about 80% to 85% at 35 Mg h-1 through-put rate and 2 km h-1 ground speed. The interaction be-tween ground speed, yield level, throughput rate, and oper-
Figure 9. Observed (solid circles and solid linear regression line) and proposed ground speed (linear dashed lines) of the large square baler as affected by bale-specific Miscanthus yield.
Figure 10. Observed (solid squares and solid linear regression line) and projected throughput rate (linear dashed lines) of the large square baler as affected by bale-specific Miscanthus yield.
(a) (b)
(c) (d)
Figure 8. Yield maps for the validation plots (SoyFace Farm: 40.0420° N, 88.2250° W): (a) plot V1, (b) plot V2, (c) plot V3, and (d) plot V4.

57(2): 355-362 361
ator behavior is a human performance topic that is not completely understood. However, this interaction resulted in a varying throughput rate from 15 to 35 Mg h-1 (solid line in fig. 10) and in varying baling costs from $3.3 to $9.5 Mg-1 (solid line in fig. 11). This baling cost variability is in agreement with the mowing-conditioning cost varia-bility found by Mathanker et al. (2014). This finding also strengthens the argument that biomass harvesting cost is one of the most sensitive factors in delivered biomass cost (Khanna et al., 2008).
This throughput rate and baling cost sensitivity can be alleviated by the developed biomass yield sensing system. It could be used to increase the ground speed of a baler in low-yielding areas such that the baler attains the maximum achievable throughput rate. However, it may not be feasible to operate a baler at the maximum feasible ground speed in high-yielding areas because of engine power limitations and an increased probability of clogging. Similarly, the ground speed of a baler would be limited by its maximum achievable throughput rate. One suggested guideline to avoid mismatch of rated engine power and required baling power would to select a baler that can operate in the aver-age crop yielding plots at the maximum feasible ground speed while delivering the maximum achievable throughput rate. For a properly matched baler and tractor combination, the maximum feasible ground speed and the maximum achievable throughput rate would be the two main limiting conditions for a proposed control strategy to maximize bal-er throughput rate.
Considering these two limitations, a logical control strategy would be to either operate the baler at the maxi-mum feasible ground speed or at the maximum achievable throughput rate. The maximum feasible ground speed, for this analysis, was assumed to be 6 km h-1 (ASABE Stand-ards, 2011), and the maximum throughput rate was as-sumed to be 35 Mg h-1, as observed in this study (fig. 10). Based on this control strategy, the baler would be operated at 6 km h-1 ground speed unless the throughput rate exceed-ed 35 Mg h-1. If the throughput rate exceeded 35 Mg h-1, then the ground speed would be reduced to maintain a con-stant throughput rate of 35 Mg h-1. The resulting proposed ground speed, by implementing the proposed control strat-egy, is shown by the dashed lines in figure 9, and the corre-sponding projected throughput rate is shown by the dashed
lines in figure 10. The projected throughput rate was less than 35 Mg h-1 for Miscanthus yields up to 16.9 Mg ha-1, but it was higher than the observed operator-controlled throughput rate. The projected baling cost was lower than the observed baling cost, and the reductions in cost savings were higher at lower yield levels (fig. 11). The cost of the sensing system was not taken into consideration for cost calculations in the present study. Overall, for the specific case analyzed, adopting the proposed control strategy would result in the following advantages: 38.0% higher field capacity (fig. 9), 35.6% higher throughput rate (fig. 10), and 30.4% lower baling cost (fig. 11). The im-proved baler throughput rate and reduced Miscanthus bal-ing cost would be critical to improve the economic viability of cellulosic ethanol and other biomass-based biofuels. The developed sensing system can be extended to corn stover, other energy grasses, and forage crops.
The swath-volume sensing system may need to be cali-brated for a specific crop and conditioner type. Further cal-ibration may be needed if the swathed crop is picked up while it is wet compared to when it is field dried. The vari-able ground speed resulting from a yield-sensor controlled machine should be taken into consideration when matching a baler with a tractor. Since there is a large difference in the PTO power required to bale a Mg of Miscanthus compared to traditional hay crops, it may be worthwhile to collect and compile ample field machinery performance data for inclu-sion into standards such as ASABE Standard D497.7 (ASABE Standards, 2011).
CONCLUSIONS A LIDAR-based swathed-biomass volume sensing sys-
tem was capable of predicting Miscanthus yield and has the potential to maximize the throughput rate of a baler. The sensed swathed-biomass volume showed a linear relation-ship (R2 = 0.76) with the Miscanthus yield. The correlation could be improved with a more precise biomass weighing system and by scanning the ground profile after the swathed biomass has been picked up by the baler. For pre-dicting harvested plot biomass, the average percent error was 12.4% for the training plots and 10.1% for the valida-tion plots. The analysis showed that a logical control strate-gy to maximize throughput rate would be to either operate the large square baler at the maximum feasible ground speed (6 km h-1) or at the maximum achievable throughput rate (35 Mg h-1). For the specific case analyzed, the pro-posed control strategy would result in the following ad-vantages: 38.0% higher field capacity (ha h-1), 35.6% high-er throughput rate (Mg h-1), and 30.4% lower baling cost ($ Mg-1). The integration of the developed swathed-biomass volume sensing system into existing balers could maximize their throughput rate. Further studies on field implementation of the proposed control strategy are need-ed. Further studies are also needed to extend the developed sensing concept to other harvesting machines that pick up swathed biomass.
Figure 11. Observed (crosses and solid linear regression line) andprojected baling cost (linear dashed lines) for the large square baleras affected by bale-specific Miscanthus yield.
362 TRANSACTIONS OF THE ASABE
ACKNOWLEDGEMENTS The authors would like to thank Tim Mies and Andy
Wycislo for their help in conducting the field experiments, Dr. Lei Zhang for sharing his Matlab program to acquire LIDAR data, and Phillip Johnson for sharing the LabVIEW program to acquire GPS data. This study was funded by the Energy Biosciences Institute (EBI) within a program titled “Engineering Solutions for Biomass Feedstock Production.” EBI is a collaboration among the University of California at Berkeley, the Lawrence Berkeley National Laboratory, the University of Illinois at Urbana-Champaign, and BP.
REFERENCES ASABE Standards. (2006). EP496.3: Agricultural machinery
management. St. Joseph, Mich.: ASABE. ASABE Standards. (2011). D497.7: Agricultural machinery
management data. St. Joseph, Mich.: ASABE. Dworak, V., Selbeck, J., & Ehlert, D. (2011). Ranging sensors for
vehicle-based measurement of crop stand and orchard parameters: A review. Trans. ASABE, 54(4), 1497-1510. http://dx.doi.org/10.13031/2013.39013.
Fricke, T., Richter, F., & Wachendorf, M. (2011). Assessment of forage mass from grassland swards by height measurement using an ultrasonic sensor. Computers and Elec. Agric., 79(2), 142-152. http://dx.doi.org/10.1016/j.compag.2011.09.005.
Heaton, E. A., Dohleman, F. G., & Long, S. P. (2008). Meeting U.S. biofuel goals with less land: The potential of Miscanthus. Global Change Biol., 14(9), 2000-2014. http://dx.doi.org/10.1111/j.1365-2486.2008.01662.x.
Hosoi, F., Nakabayashi, K., & Omasa, K. (2011). 3-D modeling of tomato canopies using a high-resolution portable scanning LIDAR for extracting structural information. Sensors, 11(2), 2166-2174. http://dx.doi.org/10.3390/s110202166.
Isaac, N. E., Quick, G. R., Birrell, S. J., Edwards, W. M., & Coers, B. A. (2006). Combine harvester econometric model with forward speed optimization. Appl. Eng. Agric., 22(1), 25-31. http://dx.doi.org/10.13031/2013.20184.
Johnson, P. C., Clementson, C. L., Mathanker, S. K., Grift, T. E., & Hansen, A. C. (2012). Cutting energy characteristics of Miscanthus giganteus stems with varying oblique angle and
cutting speed. Biosystems Eng., 112(1), 42-48. http://dx.doi.org/10.1016/j.biosystemseng.2012.02.003.
Khanna, M., Dhungana, B., & Clifton-Brown, J. (2008). Costs of
producing miscanthus and switchgrass for bioenergy in Illinois. Biomass and Bioenergy, 32(6), 482-493. http://dx.doi.org/10.1016/j.biombioe.2007.11.003.
Kumhála, F., Kroulík, M., & Prosek, V. (2007). Development and evaluation of forage yield measure sensors in a mowing-conditioning machine. Computers and Elec. Agric., 58(2), 154-163. http://dx.doi.org/10.1016/j.compag.2012.03.011.
Lenaerts, B., Missotten, B., Baerdemaeker, J. D., & Saeys, W. (2012). LIDAR sensing to monitor straw output quality of a combine harvester. Computers and Elec. Agric., 85, 40-44. http://dx.doi.org/10.1016/j.compag.2012.03.011.
Liu, Q., Mathanker, S. K., Zhang, Q., & Hansen, A. C. (2012). Biomechanical properties of Miscanthus stems. Trans. ASABE, 55(4), 1125-1131. http://dx.doi.org/10.13031/2013.42231.
Mailander, M., Benjamin, C., Price, R., & Hall, S. (2010). Sugar cane yield monitoring system. Appl. Eng. Agric., 26(6), 965-969. http://dx.doi.org/10.13031/2013.35905.
Mathanker, S. K., Hansen, A. C., Grift, T. E., & Ting, K. C. (2014). Sensing Miscanthus stem bending force for maximizing throughput rate in a disk mower-conditioner. Trans. ASABE, 57(1): 5-12.
McRandal, D. M., & McNulty, P. B. (1978). Impact cutting behaviour of forage crops: II. Field tests. J. Agric. Eng. Res., 23 (3), 329-338. http://dx.doi.org/10.1016/0021-8634(78)90105-1.
Price, R. R., Johnson, R. M., Viator, R. P., Larsen, J., & Peters, A. (2011). Fiber optic yield monitor for a sugarcane harvester. Trans. ASABE, 54(1), 31-39. http://dx.doi.org/10.13031/2013.36250.
Savoie, P., Lemire, P., & Theriault, R. (2002). Evaluation of five sensors to estimate mass-flow rate and moisture of grass in a forage harvester. Appl. Eng. Agric., 18(4), 389-397. http://dx.doi.org/10.13031/2013.8751.
Shinners, K. J., Boettcher, G. C., Hoffman, D. S., Munk, J. T., Muck, R. E., & Weimer, P. J. (2009). Single-pass harvest of corn grain and stover: Performance of three harvester configurations. Trans. ASABE, 52(1), 51-60. http://dx.doi.org/10.13031/2013.25940.
Zhang, L., & Grift, T. E. (2012). A LIDAR-based crop height measurement system for Miscanthus giganteus. Computers and Elec. Agric., 85, 70-76. http://dx.doi.org/10.1016/j.compag.2012.04.001.