us army corps of engineers - home page | california … army corps of engineers los angeles district...
TRANSCRIPT

US Army Corps of Engineers Los Angeles District
LOS ANGELES COUNTY REGIONAL DREDGED MATERIAL
MANAGEMENT PLAN PILOT STUDIES
LOS ANGELES COUNTY, CALIFORNIA
APPENDIX B1 - CEMENT-BASED STABILIZATION OF DREDGED MATERIAL BENCH SCALE STUDY
U.S. Army Corps of Engineers Los Angeles District
911 Wilshire Boulevard Los Angeles, California 90017
November 2002

ii
EXECUTIVE SUMMARY In early 2001, the Los Angeles District of the U.S. Army Corps of Engineers (COE) initiated a series of pilot studies to evaluate the feasibility for treating and/or disposing of contaminated sediments located within the Los Angeles County Region. The four alternatives evaluated were identified in the Los Angeles County Regional Dredged Material Management Plan (DMMP), and included:
• Aquatic Capping – dredging and placing contaminated sediments into an inner harbor borrow pit and capping with clean sediments.
• Cement Stabilization – dredging and transferring contaminated sediments to an upland treatment area where dredged sediments are mixed with a cement-based product to create structurally stable soil material.
• Sediment Washing – dredging and transferring contaminated sediments to an upland staging area where the dredged sediments are washed to remove chloride, allowing disposal at an upland landfill.
• Sediment Blending – dredging and transferring contaminated sediments to an upland staging area and blending the sediments with various additives to create structurally stable material.
The four pilot studies were performed in late 2001 through early 2002, and post-construction monitoring for the Aquatic Capping alternative was completed in the spring of 2002. This appendix details the results and project evaluation of the Cement-Based Stabilization (CBS) Bench-Scale Study (Bench Study).
Cement-Based Stabilization
Disposal of contaminated dredged material from harbors and river estuaries can pose difficult problems. Unconfined ocean disposal of contaminated materials is regulated by strict environmental standards. In addition, the material is frequently unsuitable for engineered structural fill and has the potential to impact the environment through groundwater and soil contamination and through biological uptake by plants and animals.
The COE developed and implemented the Cement-Based Stabilization Bench Scale Test (CSBST) program to evaluate stabilization treatment alternatives for contaminated dredge sediments within the Los Angeles County region. The purpose of the CSBST was to determine the effectiveness of cement and cement-based binders on controlling loss of contaminants and to supply materials with minimal mechanical properties for use as engineered fill.
Cement-based stabilization (CBS) technology has been successfully applied for the beneficial re-use of contaminated dredged sediments on the East Coast of the U.S. The primary objective of this study was to evaluate the effectiveness of cement-based stabilization technology for contaminated dredged materials in the Los Angeles County region in a laboratory setting. The focus of the study was to identify a range of effective stabilization reagent mixtures that could be used to allow for beneficial use of these materials in regional upland applications. This study

iii
was prepared under the authorities of the 1852 Rivers and Harbors Act modified by the 1968 Rivers and Harbors Act and Section 103 of the Marine Protection, Research and Sanctuaries Act of 1972.
Effectiveness of CBS technology was assessed for four different sites representing a broad range of regional dredged sediments, including:
• Marina del Rey
• Los Angeles River Estuary
• Port of Long Beach – Channel 2
• Port of Los Angeles – Consolidated Slip
Specific site locations are illustrated in Figure E-1.
The bench test program evaluated combinations of three stabilization binders including Portland cement, coal fly ash and fluidized bed ash. The dredge sediment samples were stabilized with varying amounts of these reagents. For each of the three reagents, three mixtures of varying reagent amounts were prepared. Selection of the mixture amounts was based on the following considerations: The upper limit should significantly prevent loss of contaminants and improve strength. The lower limit should show some improvement in contaminant binding and strength. The median should be the approximate mid-point between upper and lower. Each of three reagents tested at three percentages (upper, lower, mid) resulted in nine binder combinations for each site.
All stabilization mixtures were initially evaluated for set-time using a modified Vicat measurement apparatus. The stabilized mixtures were then subjected to a detailed suite of geotechnical testing and chemical analysis. The geotechnical testing methods used to evaluate samples from the testing program relied on ASTM procedures that were developed to evaluate typical soil-cement mixtures. The laboratory sediment stabilization test program was designed to simulate, as closely as possible, large-scale field operations. Consequently, the geotechnical tests performed on test program samples were modified due to WBR laboratory stabilization mixing and curing times and the need to optimize sample moisture contents for geotechnical tests. The modified ASTM tests provide useful information about sample characteristics, but should not be directly related to strict ASTM testing criteria for soil cement mixtures. Results of the physical and chemical testing program are summarizes as follows:
Physical Test Results
The engineering qualities of a soil are determined by a range of physical parameters, including strength, compressibility, and permeability. Of the four source sites, raw dredged materials from Marina del Rey and the Los Angeles River Estuary already possess generally good engineering properties based on their high sand content, and would be generally suitable for beneficial re-use as fill material. However, the CBS process significantly improved the mechanical properties, and significantly increased the ability to manage the material in a timely manner through

iv
hydration of excess porewater. This benefit will be a function of the amount of excess water in the dredged material as well as the material’s drainage characteristics.
The Port of Long Beach material possessed greater silt and clay content, and clearly benefited from the CBS process. The material became manageable in a matter of hours, whereas the untreated material would require extensive drying time. Unexpectedly, the CBS process either did not impact or increased compressibility, depending on the specific reagent mix. Increased compressibility may have resulted in the higher cement mixes resulting from a more readily formed a soil-cement matrix that were collapsed during compression testing. None of the other mixes resulted in any appreciable reduction in compressibility relative to the raw material. However, the process greatly increased the permeability of the material improving drainage characteristics.
The Port of Los Angeles material also demonstrated poor inherent engineering properties, and benefited from the CBS process. Similar to the Port of Long Beach material, the CBS treatment rendered manageable material in a matter of hours, except for the low reagent binder mixes. Both compressive and shear strength were improved. The process greatly reduced the compressibility of the untreated material. Permeability was moderately increased.
In summary, the CBS process resulted in substantial improvement of the POLB and POLA material for general upland use. However, high fine content and low density may limit their broad application, particularly the POLA material. Final assessment of suitability would be based on the specific application and associated material performance requirements.
Chemical Test Results
The focus of the chemical testing program was to investigate the reduction in contaminant availability associated with the CBS process. Following the stabilization procedures, raw and stabilized samples were tested for analytes, the WET and SPLP leaching procedures, and porewater salinity. Analyte concentrations were compared with Effects Range – Median (ER-M) values. The Total Threshold Limit Concentrations (TTLC) were compared to the values reported for the raw sediment (solids), and Soluble Threshold Limit Concentrations (STLC) were compared to the values reported for the extracts (liquids). Values above these threshold limits are believed to be harmful and defined as hazardous waste by Title 22 criteria.
All raw sediment samples exceeded Effects Range – Median (ER-M) values in at least one category, indicating elevated contaminant levels. POLA Consolidated Slip exceeded the most ER-M values at 23. However, none of the raw sediment samples exceeded TTLC values. Similarly none of the extracts exceeded STLC values, either before or after stabilization. The results indicate that none of the samples (raw or treated) would be considered hazardous waste under California Title 22 criteria, implying acceptability for upland application.
Full Scale Cost Projection
A subsequent pilot-scale study of cement-based stabilization technology under preparation for the Los Angeles District (draft to be published June 2002) projects costs on the order of $45 per cubic yard for dredging through treatment. The cost was based on a reagent mix of 5 percent

v
cement. Of that amount, only about $7 was associated with reagent purchase. Thus, the overall treatment costs is not highly sensitive to type nor volume of reagent.

vi
PACIFIC OCEAN
DREDGE MATERIAL SOURCE
FigureE-1
CEMENT-BASED STABILIZATION OF LOCATION MAP
LEGEND:
LONG BEACHBREAKWATERBREAKWATER
MIDDLE
SAN PEDRO
BREAKWATER
LOS ANGELES RIVER
DREDGED MATERIAL
DISTANCE IN FEET
4000 0 4000 8000
LA RIVER ESTUARY
POLA-CONSOLIDATED SLIP
POLB-CHANNEL 2
MARINA DEL REY
C A L I F O R N I A
MARINA DEL REY
PORTS OF LONG BEACHAND LOS ANGELES

vii
CONTENTS EXECUTIVE SUMMARY .................................................................................................................................... ii
1.0 INTRODUCTION ....................................................................................................................................... 1-1
1.1 BACKGROUND ..................................................................................................................................... 1-1
1.2 STUDY PURPOSE.................................................................................................................................. 1-2
1.3 CEMENT-BASED STABILIZATION PROCESS ................................................................................. 1-2
1.4 CEMENT-STABILIZATION OF MARINE SEDIMENTS ................................................................... 1-3
2.0 BENCH SCALE STUDY SCOPE............................................................................................................... 2-1
2.1 FIELD SAMPLING PLAN ..................................................................................................................... 2-1
2.2 SEDIMENT AND WATER SAMPLE COLLECTION.......................................................................... 2-1
2.3 CEMENT-BASED STABILIZATION TESTING PLAN ...................................................................... 2-3
2.4 CEMENT-BASED STABILIZATION BENCH SCALE TESTING...................................................... 2-4
2.4.1 SAMPLE PREPARATION ............................................................................................................. 2-4
2.4.2 PRE-STABILIZATION SUB-SAMPLING .................................................................................... 2-4
2.4.3 MIXTURE PROPORTIONS........................................................................................................... 2-4
2.4.4 POST-STABILIZATION SUB-SAMPLING.................................................................................. 2-5
2.4.5 LABORATORY PHYSICAL TESTING........................................................................................ 2-6
2.4.6 LABORATORY CHEMICAL TESTING....................................................................................... 2-6
3.0 SAMPLE ACQUISITION........................................................................................................................... 3-1
3.1 SAMPLING TECHNIQUES................................................................................................................... 3-1
3.1.1 BOXCORE SAMPLE COLLECTION............................................................................................ 3-1
3.1.2 VIBRACORE AND HAMMER CORE SAMPLE COLLECTION ............................................... 3-2
3.2 SAMPLING LOCATIONS ..................................................................................................................... 3-3
3.3 SAMPLE BLENDING ............................................................................................................................ 3-4
3.4 SAMPLE PRESERVATION AND CHAIN-OF-CUSTODY................................................................. 3-4
3.5 SAMPLING PHOTOS............................................................................................................................. 3-4
4.0 CEMENT-BASED STABILIZATION BENCH SCALE TESTING.......................................................... 4-1
4.1 LABORATORY EQUIPMENT .............................................................................................................. 4-1
4.2 PRELIMINARY EVALUATION ........................................................................................................... 4-2
4.2.1 SAMPLE RECEIPT......................................................................................................................... 4-2
4.2.2 SCOPING TESTS............................................................................................................................ 4-3
4.2.3 SEAWATER ACQUISITION......................................................................................................... 4-4
4.2.4 SEAWATER ADDITION ............................................................................................................... 4-5

viii
4.3 CEMENT STABILIZATION REAGENTS............................................................................................ 4-6
4.4 BENCH TEST PROCEDURES .............................................................................................................. 4-6
4.4.1 STABILIZATION MIXING PROCEDURE................................................................................... 4-7
4.4.2 OBSERVATIONS DURING SAMPLE PREPARATION ............................................................. 4-7
4.5 DISCUSSION REGARDING TIMING OF PHYSICAL TESTING...................................................... 4-9
5.0 PHYSICAL TEST PROGRAM AND RESULTS....................................................................................... 5-1
5.1 PHYSICAL TEST PROGRAM............................................................................................................... 5-1
5.2 PHYSICAL TEST RESULTS ................................................................................................................. 5-2
5.2.1 MARINA DEL REY........................................................................................................................ 5-2
5.2.2 LOS ANGELES RIVER ESTUARY .............................................................................................. 5-5
5.2.3 PORT OF LONG BEACH............................................................................................................... 5-7
5.2.4 PORT OF LOS ANGELES ............................................................................................................. 5-9
5.3 DISCUSSION OF PHYSICAL TESTING RESULTS ......................................................................... 5-10
6.0 CHEMICAL TEST PROGRAM AND RESULTS ..................................................................................... 6-1
6.1 CHEMICAL TESTING PROGRAM ...................................................................................................... 6-1
6.2 CHEMICAL TEST PROCEDURES ....................................................................................................... 6-2
6.3 QUALITY CONTROL SUMMARY ...................................................................................................... 6-3
6.4 CHEMICAL TEST RESULTS................................................................................................................ 6-4
6.5 SUMMARY OF CHEMICAL TESTING RESULTS........................................................................... 6-17
7.0 CONCLUSIONS AND RECOMMENDATIONS ...................................................................................... 7-1
7.1 CONCLUSIONS...................................................................................................................................... 7-1
7.2 RECOMMENDATIONS......................................................................................................................... 7-2
8.0 REFERENCES ............................................................................................................................................ 8-1
TABLES
TABLE 2-1 MINIMUM SAMPLE VOLUMES
TABLE 2-2 PRE-STABILIZATION SUB-SAMPLING REQUIREMENTS
TABLE 2-3 POST-STABILIZATION SUB-SAMPLING REQUIREMENTS
TABLE 2-4 TEST METHODS FOR PHYSICAL TESTING
TABLE 2-5 CHEMICAL TESTING - ANALYTICAL METHODS FOR SEDIMENT AND WATER SAMPLES
TABLE 2-6 CHEMICAL TESTING - TARGET ANALYTES AND REPORTING LIMITS
TABLE 3-1 SAMPLING STATION LOCATIONS

ix
TABLE 4-1 REAGENT SOURCE AND COST
TABLE 4-2 BENCH SCALE TEST SERIES BY LOCATION
TABLE 4-3 BENCH SCALE TEST TIMING
TABLE 6-1 CHEMICAL AND PHYSICAL ANALYSES
TABLE 6-2 RAW SEDIMENT CHEMISTRY RESULTS REPORTED AS DRY WEIGHT FOR SOURCE MATERIALS WITH AVAILABLE EFFECTS-RANGE MEDIAN (ER-M) VALUES (LONG ET AL. 1995) PROVIDED FOR COMPARISON.
TABLE 6-3 SPLP AND WET CHEMISTRY RESULTS FOR THE LARE RAW SOURCE MATERIAL AND ASSOCIATED BLENDS WITH AVAILABLE TTLC AND STLC VALUES FOR COMPARISON.
TABLE 6-4 SPLP AND WET CHEMISTRY RESULTS FOR THE MARINA DEL REY RAW SOURCE MATERIAL AND ASSOCIATED BLENDS WITH AVAILABLE TTLC AND STLC VALUES FOR COMPARISON.
TABLE 6-5 SPLP AND WET CHEMISTRY RESULTS FOR THE POLB CHANNEL 2 RAW SOURCE MATERIAL AND ASSOCIATED BLENDS WITH AVAILABLE TTLC AND STLC VALUES FOR COMPARISON.
TABLE 6-6 SPLP AND WET CHEMISTRY RESULTS FOR THE POLA CONSOLIDATED SLIP RAW SOURCE MATERIAL AND ASSOCIATED BLENDS WITH AVAILABLE TTLC AND STLC VALUES FOR COMPARISON.
FIGURES
FIGURE E-1 LOCATION MAP
FIGURE 2-1 LOCATION MAP
FIGURE 5-1 MARINA DEL REY PHYSICAL TEST RESULT
FIGURE 5-2 LOS ANGELES RIVER ESTUARY PHYSICAL TEST RESULT
FIGURE 5-3 PORT OF LONG BEACH PHYSICAL TEST RESULT
FIGURE 5-4 PORT OF LOS ANGELES PHYSICAL TEST RESULT
ATTACHMENTS
ATTACHMENT A FIELD SAMPLING PLAN
ATTACHMENT B STABILIZATION MIXING PROCEDURE
ATTACHMENT C PHYSICAL TEST RESULTS
ATTACHMENT D CHEMICAL TEST RESULTS

1-1
1.0 INTRODUCTION In early 2001, the Los Angeles District of the U.S. Army Corps of Engineers (COE) initiated a series of pilot studies to evaluate the feasibility for treating and/or disposing of contaminated sediments located within the Los Angeles County Region. The four alternatives evaluated were identified in the Los Angeles County Regional Dredged Material Management Plan (DMMP), and included:
• Aquatic Capping – dredging and placing contaminated sediments into an inner harbor borrow pit and capping with clean sediments.
• Cement Stabilization – dredging and transferring contaminated sediments to an upland treatment area where dredged sediments are mixed with a cement-based product to create structurally stable soil material.
• Sediment Washing – dredging and transferring contaminated sediments to an upland staging area where the dredged sediments are washed to remove chloride, allowing disposal at an upland landfill.
• Sediment Blending – dredging and transferring contaminated sediments to an upland staging area and blending the sediments with various additives to create structurally stable material.
The four pilot studies were performed in late 2001 through early 2002, and post-construction monitoring for the Aquatic Capping alternative was completed in the spring of 2002. This appendix details the results and project evaluation of the Cement-Based Stabilization (CBS) Bench-Scale Study (Bench Study).
1.1 BACKGROUND
Los Angeles County's coastline includes two of the nation's largest commercial ports and several major marina complexes and small-vessel harbors. Maintenance of authorized depths in existing channels and berthing areas and expansion and modernization of ports, harbors, and marinas, requires periodic dredging in virtually all of these facilities. Some of the sediments dredged from these harbors contain elevated levels of heavy metals, pesticides, and other contaminants. In most cases, the concentrations of these contaminants do not approach hazardous levels. However, the sediments contain enough contaminants that they are not suitable for unconfined ocean disposal. Additionally, California’s Bay Protection and Toxic Cleanup Program identified bays and estuaries containing areas with contaminated sediments. Remediation of these sites may require dredging and disposal of this material. Disposal of any contaminated dredged materials requires special management, such as placement in a confined aquatic disposal site,

1-2
capping, or disposal in an upland site. Some ports and harbors have considered other management techniques, such as treatment and beneficial re-use.
Recently, the ports and harbors have delayed or canceled several dredging projects because of contaminated sediment issues. The regulatory agencies evaluated disposal options for these projects on a case-by-case basis without the benefit of a regional perspective on management alternatives, cumulative impacts, and long-term solutions to prevent re-contamination of sediment. This approach has lead to public concern over the ecological and human health implications of contaminated dredged material disposal. To resolve these issues, the regulatory and resource agencies, ports and harbors, environmental groups, and other interested parties agreed to establish a task force. The Los Angeles Contaminated Sediments Task Force (CSTF) was formed in 1998 and chartered with developing a long-term management strategy for contaminated sediments. This strategy will be presented in the CSTF’s Strategy Report. The COE, State and Federal resource and regulatory agencies, and local environmental groups are active participants in the CSTF.
Even though the COE is an active participant in the CSTF, the COE is independently developing a long-term management strategy (i.e., DMMP) for both clean and contaminated sediments. The project study area for the DMMP is located along the coastal waters of Los Angeles and includes Marina del Rey, the Port of Long Beach, the Port of Los Angeles, and the Los Angeles River Estuary. The non-Federal sponsors for the feasibility phase of the DMMP study are the County of Los Angeles, City of Long Beach, Port of Long Beach and Port of Los Angeles. While many of the objectives under the COE DMMP Feasibility Study and the CSTF Strategy Report overlap, there may be key differences in approach or conclusions reached under each program. The intent of both the COE and CSTF is to coordinate the two study efforts as much as possible to minimize duplication of effort, and to develop a unified approach for the long-term management of contaminated dredged sediment.
1.2 STUDY PURPOSE
The COE developed and implemented the Cement-Based Stabilization Bench Scale Test (CSBST) program to evaluate stabilization treatment alternatives for contaminated dredge sediments from the Los Angeles County region. The purpose of the CSBST was to determine the effectiveness of cement and cement-based binders on controlling loss of contaminants and to supply materials with minimal mechanical properties for use as engineered fill.
1.3 CEMENT-BASED STABILIZATION PROCESS
Cement-based stabilization (CBS) has been used to treat waste materials since the early 1950’s. Some of the first uses of cement for waste stabilization included the treatment of radioactive wastes from various uranium sources, weapons and fuels programs. CBS use has been increased to treat a wide range of industrial waste materials, including oil-based and chemical wastes. The use of cementitious materials to accomplish solidification and stabilization is well established. Solidification and stabilization may be accomplished by the same treatment method, but the terms refer to different mechanisms.

1-3
Solidification refers to the addition of reagents to change the physical characteristics of waste materials in a manner that increases the strength and decreases the material compressibility. This is especially important for water saturated fine-grained clayey materials or materials with high organic contents that might be considered for construction fill use. Such materials generally exhibit long drying times and poor structural characteristics for use as engineered fill.
Stabilization refers to changes in the chemical structure of the waste material that renders the hazardous constituents less soluble and less toxic. This is especially important when there is the potential for biological uptake.
Relies upon pozzolanic and cement setting reactions to form stable new chemical compounds. Portland cement and fly ash react with water to form various calcium silicates and calcium aluminate compounds that produce materials, which encapsulate and incorporate heavy metals (arsenic, chrome, lead, etc.) into a new compound matrix that is insoluble under most conditions. The overall goal of CBS in the treatment of contaminated dredge materials is to:
1. Eliminate all free liquids
2. Reduce the mobility, toxicity and leachability of hazardous components
3. Improve the physical properties of the stabilized material
Produce a material that can be used as structural fill or that can be disposed of without concern for future environmental impact
1.4 CEMENT-STABILIZATION OF MARINE SEDIMENTS
Marine sediments in U.S. port and harbor areas are often contaminated due to long term industrial activity. This activity includes ship loading, fueling, maintenance and associated spills, industrial operations such as refineries, chemical plants and runoff from other industrial, municipal and agricultural areas. Environmental regulations of the past 20 years have greatly reduced the amount of environmental contamination from industrial materials. However, as marine sediments are dredged to maintain and expand port facilities, sediments that were contaminated from previous activities must be dealt with in an environmentally sound manner.
While clean dredged material can be disposed in open water environments under both the Section 103 of the Marine Protection, Research, and Sanctuaries Act (MPRSA) and Section 404 of the Clean Water Act (CWA), management of contaminated dredged material has become increasingly complex. Land based disposal sites are fewer in number, transportation and handling costs continue to escalate and environmental regulations have become more restrictive. Consequently, opportunities for the potential treatment and/or beneficial re-use of contaminated dredged materials are being sought as a potential solution to this dilemma.
One alternative is to simply dispose of contaminated materials in secure, lined landfills. While this option is effective, it is extremely costly and is difficult to achieve for the large volumes of materials produced in port dredging operations. An example of this was a 1996 Port of New York & New Jersey project that aimed for disposal of contaminated marine sediments in landfills. Since the local landfill facilities would not accept the material, a decision was made to

1-4
transport the material by barge and rail to a remote disposal facility. Cost for this activity was about $235 per cubic meter for 91,000 cubic meters of contaminated dredge material; clearly an option that is not economically viable for the long term.
Another alternative allowing beneficial re-use of the material is to solidify and stabilize the contaminated marine sediments to produce a material that can be utilized as fill in port and local area construction projects. The key criteria are that the material must exhibit good structural properties and not contaminate the environment.
Subsequent to the 1996 disposal project, the Port of New York & New Jersey considered a range of beneficial reuse options, and ultimately modified its approach to require that contaminated marine sediments be stabilized and utilized for upland fill material. This approach has resulted in the successful stabilization treatment and construction utilization of over 4 million cubic meters of contaminated dredged materials (Loest, 1998).
Treatment has been accomplished with a variety of stabilization equipment, including onshore pug mill mixers and in-barge mixers. A typical project included the following activities:
• Dredging - dredging operations were conducted in a manner that minimized mobilization and spreading of fine sediments and silt.
• De-watering - removal of excess water.
• Debris removal - this activity is necessary to remove cables, pilings etc. and can be accomplished with screens at the dredge site or onshore. Another alternative is the use of excavator units to remove debris from loaded barges or land based processing tanks or cells prior to treatment.
• Solidification and/or stabilization - this activity can be carried out onshore or in the barge. For onshore operations, marine sediments are offloaded to a holding area and then conveyed to a pug mill to be mixed with cement based reagents. For in-barge treatment, the cement-based reagents are added to the sediments and mixed with a separate hydraulic mixer.
• Offloading - the reagent mix is important in order to minimize the set time so the stabilized sediments can be offloaded as quickly as possible. Typically, the sediments are offloaded or handled as soon as there is no free water and the sediments are in a wet soil consistency.
• Placement - even though cement based reagents absorb and eliminate free water, the resulting stabilized material still has a high moisture content and must be dried before use. This is typically accomplished by laying down 0.3 meter lifts of the stabilized material in the use area. The material is aerated with discs or other implements and allowed to dry to optimum moisture content. Following drying, the material is compacted, typically with vibratory rollers or any standard soil compaction equipment. The result is a firm construction base and beneficial reuse of contaminated marine sediments.

1-5
All of the methods described rely on cement and/or cement/ash combinations to achieve solidification and stabilization. Stabilized marine sediments were used as structural fill for the New Jersey Metro Mall in Elizabeth, New Jersey and are currently being used in the development of a golf course, resort and condominium project. Over 2 million cubic meters of solidified and stabilized marine sediments were also used to fill and provide a low-permeability cap for a brown-field development site in New Jersey. These projects typically utilized Portland Type II cements at about 8 percent mixture by weight, and in some cases also incorporated limekiln dust and coal fly ash.
The key aspect of these projects was to treat the contaminated marine sediments in a manner that produced a stable, structural fill material that could be quickly utilized. Typical dredge sediments can take months or years to dry to a level that allows for use and, after drying, still provide the potential for environmental contamination. The use of cement based materials for solidification and stabilization allows the dredge sediments to be used as fill within a matter of days.

2-1
2.0 BENCH SCALE STUDY SCOPE The following summarizes the scope of the Cement-Based Stabilization Bench Study:
2.1 FIELD SAMPLING PLAN
A field-sampling plan was prepared at the outset of the study detailing the collection, handling and management of sediments from the four regional source sites that were to be tested. The sampling plan included the following items:
• Overview of the sampling program
• Proposed sampling locations
• Volumes and types of samples to be collected at each location
• Description of positioning and sampling methods
• Handling and shipping procedures
• Project management, team responsibility, and contact information.
The plan was prepared in accordance with the current state of the practice for sampling and testing of marine sediments and applicable sections of the Green Book, RIA, and Gold Book (USEPA/USACE, 1991; USACE/USEPA, 1993; AND USEPA/USACE, 1998, respectively). The field-sampling plan is included as Attachment A to this report.
2.2 SEDIMENT AND WATER SAMPLE COLLECTION
Sediment and water samples were collected from the four source sites including:
• Marina del Rey – Mouth of Ballona Creek
• Los Angeles River Estuary
• Port of Long Beach – Channel 2
• Port of Los Angeles – Consolidated Slip

2-2
Specific sample locations were selected based on coordination with the Corps of Engineers, port personnel and regulatory agencies. Figure 2-1 shows the location of the four sample sites. Minimum sediment and water sample volumes are summarized in Table 2-1.

2-2
PACIFIC OCEAN
DREDGE MATERIAL SOURCE
Figure2-1
CEMENT-BASED STABILIZATION OFLOCATION MAP
LEGEND:
LONG BEACHBREAKWATERBREAKWATER
MIDDLE
SAN PEDRO
BREAKWATER
LOS ANGELES RIVER
DREDGED MATERIAL
DISTANCE IN FEET
4000 0 4000 8000
LA RIVER ESTUARY
POLA-CONSOLIDATED SLIP
POLB-CHANNEL 2
MARINA DEL REY
C A L I F O R N I A
MARINA DEL REY
PORTS OF LONG BEACHAND LOS ANGELES

2-3
Table 2-1 Minimum Sample Volumes
Physical Testing Chemical Testing Sample Location Sediment (liters) Sediment (liters) Water (liters)
All Sites 170 3.5 3.5
Sediment samples for chemical testing were placed in appropriate containers and stored in accordance with Plumb (1981). Any sample showing external contamination due to handling or incorrect sampling procedures required re-sampling. A detailed inventory of each sample was maintained and is presented in this report. Formal chain-of-custody procedures were followed and documented. In addition, a detailed soils log was maintained for each sampling site.
2.3 CEMENT-BASED STABILIZATION TESTING PLAN
A testing plan for the cement-based stabilization bench scale testing (CSBST) was prepared detailing the following:
• Sample handling and storage upon arrival from the field.
• Procedures and equipment for re-agitation, mixing, and self-weight consolidation of each sample.
• Procedures and equipment for removing free water from the surface of the consolidated sample.
• Procedures and equipment for the collection of representative sub-samples for physical and chemical testing and bench scale stabilization testing.
• Certification of binder materials to be used in the investigations.
• Procedures and equipment for adding binder agents.
• Method for determining time of setting.
• Method and duration of curing.
• Procedures and equipment for collection of samples for physical and chemical testing from each post-stabilization sample.
• General description of physical and chemical tests to be performed on samples collected before and after stabilization.
• Recommended percentages of different binder agents to be added. If percentages were found to vary with moisture content, grain size, or other factors, then the relationship for determining the quantity of binder to be added was presented.
2-4
2.4 CEMENT-BASED STABILIZATION BENCH SCALE TESTING
2.4.1 Sample Preparation
Prior to testing, sufficient seawater was specified to be added to the samples such that the samples were completely in suspension in order to reasonably replicate material characteristics during dredging operations. At least twice the sample volume of site seawater was mixed with the soil samples. Upon mixing, the sample was allowed to consolidate under its own weight for two hours without disturbance. Upon completion of the self-weight consolidation period, excess surface water was immediately removed by suction or other acceptable means.
2.4.2 Pre-Stabilization Sub-Sampling
Upon removal of excess surface water, sub-samples were immediately collected for the tests listed Table 2-2.
Table 2-2 Pre-Stabilization Sub-Sampling Requirements
Physical Testing Chemical Testing • Grain Size • Atterberg Limits • Specific Gravity • Compaction • Consolidation • Permeability • Unconfined Compressive Strength • Direct Shear
• Bulk Chemistry • Conventionals • Waste Extraction Test (WET) • Synthetic Precipitation Leaching
Procedure (SPLP) • Pore Water Salinity
2.4.3 Mixture Proportions
The effects of three different binder additives were evaluated at three different mixture percentages for a total of nine post-stabilization samples at each source site. The percentage of binder represents the ratio of binder material to dry weight soil (sampled and prepared native material). The three different binder additives evaluated for this study were:
• Portland cement (ASTM C 150, Type II)
• Coal fly ash (ASTM C 618, Class F)
• High lime fluidized bed ash (acceptance based on submittal of a minimum nine kilogram record sample for additional testing by the Government)
For each of the three binder additive materials, the quantity amount of binder to be added to the sampled and prepared native material was determined based on the following criteria:
• An upper boundary, lower boundary, and a median percentage of additive were determined based on site specific sediment characteristics, data gathered from the pre-stabilization lab test results, and previous experience of corresponding end effects for the type of the native material being tested.

2-5
• The upper limit was specified to correspond to a percentage of binder which, when added to the prepared native material and cured, clearly and significantly prevents the loss of contaminants as well as improves the strength properties of the native material. The upper limit of binder was designated to be a percentage of material, which is reasonable in comparison with the state of the practice of soil-cement stabilization technology.
• Similarly, the lower limit was to correspond to an amount of binder additive which corresponds to the minimum percentage of binder which when added to the prepared native material and cured will show some improvement in strength characteristics and indicate some improvements and capability of binding contaminants.
• The median percentage was chosen as the concentration at the mid-point of the upper and lower limits.
An additional sample of POLB sediments was collected, processed, and manipulated in the same way with the exception that no binder was added. This sample served as a control to estimate contaminant loss or addition during the CSBST process.
The methods of introducing and mixing of binder as well as curing methods and procedures were specified to be representative of anticipated construction procedures.
2.4.4 Post-Stabilization Sub-Sampling
• For all site sediments at seven (7) days, a sample was obtained and tested for unconfined compressive strength and vane shear strength from each of the different site's nine (9) different binder combinations.
• For all site sediments at twenty-eight (28) days, a sample was tested for unconfined compressive strength and vane shear strength from each of the different site's nine (9) different binder combinations.
• For Los Angeles River Estuary (LARE) sediments only at twenty-eight (28) days, a sample was obtained and tested for all of the physical and chemical tests listed in Table 2-3 from each of the nine (9) different binder combinations.
• For all site sediments, except LARE, at twenty-eight (28) days, a sample was obtained and tested from the middle binder concentration for each of the binder combinations for all of the physical and chemical tests listed in Table 2-3. Three (3) additional samples were chosen and approved by the Contracting Officer, and tested for all of the physical and chemical tests listed in Table 2-3.

2-6
Table 2-3 Post-Stabilization Sub-Sampling Requirements
Physical Testing Chemical Testing • Grain Size • Atterberg Limits • Compaction • Consolidation • Permeability • Vane Shear • Unconfined Compressive Strength • Direct Shear
• WET • SPLP • Pore Water Salinity
2.4.5 Laboratory Physical Testing
Physical testing was performed by Smith-Emery Geoservices in accordance with Table 2-4.
Table 2-4 Test Methods for Physical Testing
Test Test Method Moisture Content ASTM D 2216 Grain Size ASTM D 422 Atterberg Limits ASTM D 4318 Specific Gravity ASTM D 854 Compaction ASTM D 1557 Permeability ASTM D 5856 or ASTM D 2434 Vane Shear ASTM D 2573 or ASTM D 4648 Unconfined Compressive Strength ASTM D 1633, Method A Consolidation ASTM D 2435 Shear Strength ASTM D 3080
2.4.6 Laboratory Chemical Testing
Chemical testing was performed by ToxScan, Inc. in accordance with the test methods shown in Table 2-5 and the minimum laboratory reporting limits shown in Table 2-6. All testing was conducted using EPA approved methodologies suitable for marine sediments and which yield the required detection limits with good precision and accuracy.

2-7
Table 2-5 Chemical Testing - Analytical Methods for Sediment and Water Samples.(1)
Analyte Sediments Water and Elutriates
Arsenic EPA 7061 EPA 206.3 Cadmium EPA 6020 or 7131 EPA 200.8 or 213.2 Chromium EPA 6020 or 7191 EPA 200.8 or 218.2 Copper EPA 6020 or 7211 EPA 200.8 or 220.2 Lead EPA 6020 or 7421 EPA 200.8 or 239.2 Mercury EPA 7471 EPA 245.1 Nickel EPA 6020 or 7520 EPA 200.8 or 249.2 Selenium EPA 7741 EPA 270.3 Silver EPA 6020 or 7761 EPA 200.8 or 272.2 Zinc EPA 6020 or 7950 EPA 200.8 or 289.2 Organotins (Butyltins) Uhler and Durell, 1989 Uhler and Durell, 1989 Sulfides EPA 9030 EPA 376.1 Petroleum Hydrocarbons EPA 1664 EPA 1664 Pesticides EPA 8081 GC-ECD EPA 8081 GC-ECD PCBs EPA 8082 GC-ECD EPA 8081 GC-ECD PAHs EPA 8270C GC-MS EPA 415.1 Total Organic Carbon Gaudette, et al., 1974 Grain Size Plumb 1981 Percent Moisture EPA 160.3 Pore Water Salinity Waste Extraction Test (WET) CCR, Title 22 Synthetic Precipitation Leaching Procedure (SPLP)
EPA Method 1312
NOTES (1) Table based on Table 5, "Analytical Methods for Sediment, Water, and Tissue Samples," p. 20,
Sampling and Analysis Plan, Chemical Evaluation of Sediments Proposed for Dredging in Los Angeles River Estuary, Port of Los Angeles, California, prepared by Kinnetic Laboratories/Toxscan, Inc., for the US Army Corps of Engineers, Los Angeles District, DRAFT dated 31 Jan 01.
(2) Allen D. Uhler and Gregory S. Durell, Measurement of Butyltin Species in Sediments by n-Pentyl Derivatization with Gas Chromatography/Flame Photometric Detection (GC/FPD) and Optional Confirmation by Gas Chromatography/Mass Spectometry (GC/MS), February, 1989.
(3) Henri, E. Gaudette, Wilson R. Flight, Lois Toner, and David W. Folger, "Determination of Organic Carbon in Recent Sediments" in Journal of Sedimentary Petrology, Vol. 44, No. 1, pp. 249-253, 1974.
(4) Russell H. Plumb, Jr., Procedures for Handling and Chemical Analysis of Sediment and Water Samples, Environmental Laboratory, US Army Engineer Waterways Experiment Station, 1981.
(5) Francis A. DiGiano, Cass T. Miller, Jeyong Yoon, Dredging Elutriate Test (DRET) Development, US Army Corps of Engineers, Waterways Experiment Station, Contract Report D-95-1, August 1995.
(6) James M. Brannon, Tommy E. Meyers and Barbara A. Tardy, Leachate Testing and Evaluation for Freshwater Sediments, US Army Corps of Engineers, Waterways Experiment Station, Miscellaneous Paper D-94-1, April 1994.
(7) Title 22, California Code of Regulations, Appendix II, Chapter 11, Division 4.5, paragraph 66700.

2-8
Table 2-6 Chemical Testing - Target Analytes and Reporting Limits(1)
Reporting Limits
Analyte Sediment
(mg/kg or ppm, dry weight) Water
(µg/L or ppb) Conventionals
TOC 0.1% 1.0 Percent Solids 0.1% -- pH 0.1 pH units 0.1 pH units Total Sulfides 0.1 0.1 Grain Size 0.1% -- Total Recoverable Petroleum
Hydrocarbons 100 5.0
Pore Water Salinity 0.1ppt? -- Metals
Arsenic 0.1 1.0 Cadmium 0.1 0.3 Chromium 0.1 0.5 Copper 0.1 0.5 Lead 0.1 0.5 Mercury 0.02 0.2 Nickel 0.1 1.0 Silver 0.1 0.2 Zinc 1.0 5.0
Semivolatiles 2-Methylnaphthalene 20 10 Acenaphthene 20 10 Acenaphthylene 20 10 Anthracene 20 10 Benzo(a)anthracene 20 10 Benzo(a)pyrene 20 10 Benzo(b)fluoranthene 20 10 Benzo(g,h,i)perylene 20 10 Benzo(k)fluoranthene 20 10 Chrysene 20 10 Dibenzo(a,h)anthracene 20 10 Fluorene 20 10 Fluoranthene 20 10 Indeno(1,2,3-c,d)pyrene 20 10 Naphthalene 20 10 Perylene 20 10 Phenanthrene 20 10 Pyrene 20 10
Pesticides 2,4-DDD 0.002 0.05 2,4-DDE 0.002 0.05 2,4-DDT 0.002 0.05 Aldrin 0.002 0.05 Chlordane and derivatives 0.002 0.05 Dieldrin 0.002 0.05 Endosulfan I 0.002 0.05 Endosulfan II 0.002 0.05 Endosulfan Sulfate 0.002 0.05

2-9
Reporting Limits
Analyte Sediment
(mg/kg or ppm, dry weight) Water
(µg/L or ppb) Endrin 0.002 0.05 Heptachlor 0.002 0.05 Heptachlor epoxide 0.002 0.05 Hexachlorocyclohexane isomers 0.002 0.05 Lindane 0.002 0.05 Technical Chlordane 20 1.0 Toxaphene 20 1.0
PCBs Arochlor 1016 20 1.0 Arochlor 1221 20 1.0 Arochlor 1232 20 1.0 Arochlor 1242 20 1.0 Arochlor 1248 20 1.0 Arochlor 1254 20 1.0 Arochlor 1260 20 1.0 Total PCBs 20 1.0
Organotins Monobutyltin 0.001 0.002 Dibutyltin 0.001 0.002 Tributyltin 0.001 0.002 Tetrabutyltin 0.001 0.002
NOTES (1) Table based on Table 6, "Target Analytes and Reporting Limits," pp. 21-22,
Sampling and Analysis Plan, Chemical Evaluation of Sediments Proposed for Dredging in Los Angeles River Estuary, Port of Los Angeles, California, prepared by Kinnetic Laboratories/Toxscan, Inc., for the US Army Corps of Engineers, Los Angeles District, DRAFT dated 31 Jan 01.

3-1
3.0 SAMPLE ACQUISITION 3.1 SAMPLING TECHNIQUES
Several different sampling techniques were utilized in the collection of material for the CSBST study. Material from Marina del Rey (MdR), Consolidated Slip in the Port of Los Angeles (POLA), and Channel 2 in the Port of Long Beach (POLB) were collected using a boxcore device. Material from the Los Angeles River Estuary (LARE) was collected using a vibracore and hammer core.
3.1.1 Boxcore Sample Collection
Sampling was performed by MEC personnel from the research vessel JB on July 16 and 17, 2001. Sites were located using differential Global Positioning System (dGPS). Samples were collected using a boxcore as shown in Photo 3-1 with a 0.25 m2 sample surface area. The boxcore and all sampling utensils were decontaminated between stations by washing with alconox and rinsing with seawater.
Photo 3-1

3-2
Once a sample was on deck, it was assessed for acceptability. Only samples with an intact surface area were accepted. Accepted samples were transferred from the boxcore to a plastic tub and a digital photograph of each accepted grab sample was taken. Physical characteristics of each sample such as color, consistency, and odor were recorded on a field-sampling log. The samples were then transferred to clean, polyethylene bags placed inside pre-cleaned 19-liter (5-gallon) HDPE sealable buckets. Multiple drops were required to collect the 170 liters (45 gallons) required for subsequent testing and analyses. Full buckets were kept cold on the boat in coolers using ice, then transferred to a refrigerated truck maintained at 4° C at the end of each sampling day.
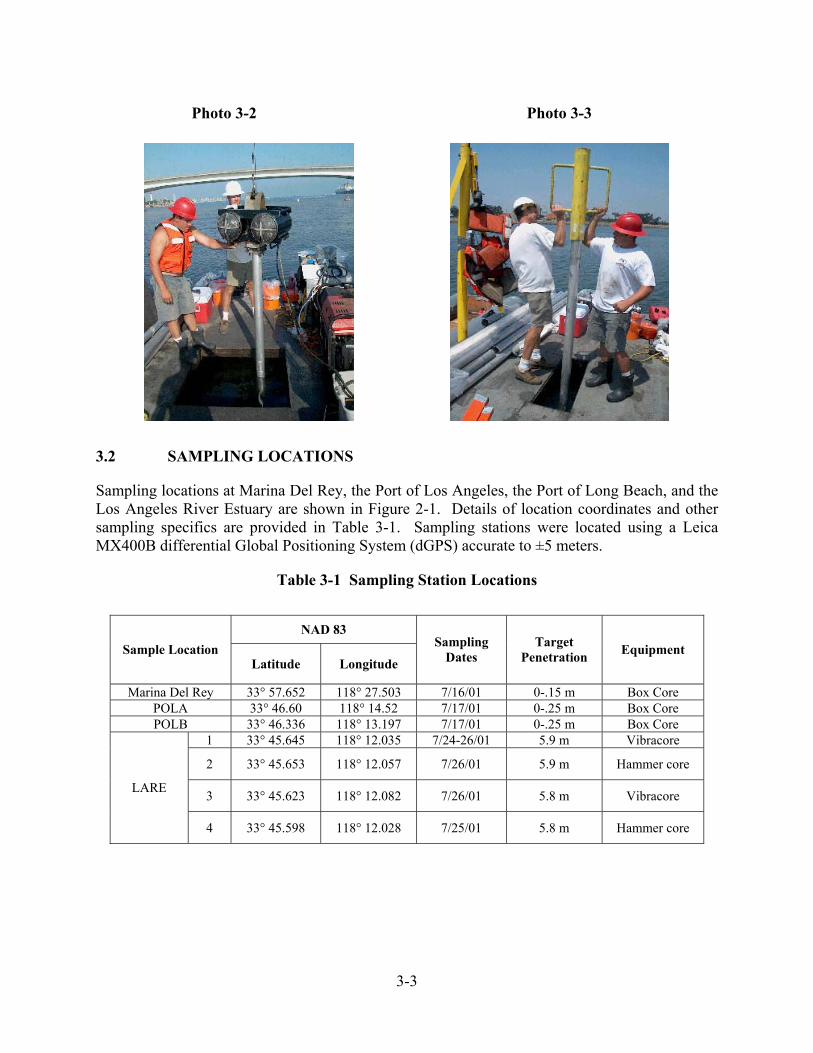
3.1.2 Vibracore and Hammer Core Sample Collection
Cores were collected using a Rossfelder P-5 electric vibracore (Photo 3-2) deployed from a sampling barge. The vibracore was equipped with a pre-cleaned 0.10 meter (four-inch) diameter aluminum barrel and stainless steel cutter head. The barrel and all sampling utensils were decontaminated between stations by washing with alconox and rinsing with seawater. The standard system is capable of collecting cores up to 6 meters (20 feet) long and can be equipped to handle greater depths up to an additional 3 meters (10 feet). Sediment cores were collected to project depth (9.1 meters), plus the 0.6 meter (2 feet) of over-dredging allowance, unless refusal was encountered. Refusal is defined as less than 0.05 meters (2 inches) of penetration per minute.
Due to the composition of the sediment, two of the stations at the LARE site (Station 2 and 4) could not be penetrated to project depth with the vibracore. At these stations a hammer core was used. The hammer core employs the use of a 27-kilogram (60-pound) slide hammer, which is placed over the end of a barrel and is manually driven into the sediment (Photo 3-3). This method permits for greater penetration at stations where consolidated sediments are encountered.
Each core was retrieved to the vessel platform where the sediment sample was extruded from the core barrel onto polyethylene lined collection trays. Each core was then examined by a technician and the core description and other pertinent data and observations were logged. Representative photographs of each station were taken. The cores were then transferred to clean, polyethylene bags placed inside pre-cleaned 19-liter (5-gallon) HDPE sealable buckets. A sufficient number of cores were collected to provide the required volume of material per station for subsequent testing and analyses. Buckets of sediment were kept cold on the boat in coolers using ice, and were transferred to a refrigerated truck maintained at 4° C at the end of each sampling day.
3-3
Photo 3-2 Photo 3-3
3.2 SAMPLING LOCATIONS
Sampling locations at Marina Del Rey, the Port of Los Angeles, the Port of Long Beach, and the Los Angeles River Estuary are shown in Figure 2-1. Details of location coordinates and other sampling specifics are provided in Table 3-1. Sampling stations were located using a Leica MX400B differential Global Positioning System (dGPS) accurate to ±5 meters.
Table 3-1 Sampling Station Locations
NAD 83 Sample Location
Latitude Longitude
Sampling Dates
Target Penetration Equipment
Marina Del Rey 33° 57.652 118° 27.503 7/16/01 0-.15 m Box Core POLA 33° 46.60 118° 14.52 7/17/01 0-.25 m Box Core POLB 33° 46.336 118° 13.197 7/17/01 0-.25 m Box Core
1 33° 45.645 118° 12.035 7/24-26/01 5.9 m Vibracore
2 33° 45.653 118° 12.057 7/26/01 5.9 m Hammer core
3 33° 45.623 118° 12.082 7/26/01 5.8 m Vibracore LARE
4 33° 45.598 118° 12.028 7/25/01 5.8 m Hammer core

3-4
3.3 SAMPLE BLENDING
Samples were processed at MEC’s Carlsbad laboratory. Sediment from each site was homogenized to a consistent color and texture utilizing a pre-cleaned 260 liter (9.0 cubic foot) electric mixer. Homogenized samples were returned to clean, double lined polyethylene bags inside of 19 liter (5 gallon) buckets, and stored in a refrigerated truck at 4° C until shipment.
3.4 SAMPLE PRESERVATION AND CHAIN-OF-CUSTODY
Upon collection, sediment samples were transferred from the sampling device to polyethylene bags inside pre-cleaned 19 liter (5-gallon) HDPE sealable buckets. All samples were double bagged for safety and sealed with cable ties. The bags were labeled with all pertinent information (sample location, date, time, grab or attempt number, and technician’s initials), and a sample collection log was completed for each. Samples were kept cold in the field in coolers using wet ice, and were transferred to a refrigerated truck maintained at 4° C at the end of each sampling day. This truck was also used to transport and store the samples during their processing at MEC. Proper Chain of Custody (COC) procedures was followed from the field to the MEC laboratory. After the samples were processed at the MEC laboratory, sub samples of each site were shipped to ToxScan, Inc. for chemical analyses. These samples were placed in pre-cleaned glass jars with Teflon lined lids. These jars were then sent overnight via FedEx inside of coolers packed with blue ice. COC forms were included with each shipment. The remaining material in the buckets was delivered by refrigerated truck to Waste by Rail by an MEC courier, along with proper COC forms.
3.5 SAMPLING PHOTOS
The following are selected photographs of representative samples at each sampling station.
4-1
4.0 CEMENT-BASED STABILIZATION BENCH SCALE TESTING
Cement-based stabilization bench testing was performed at the Waste By Rail, Inc. (WBR) laboratory facility located adjacent to WBR offices in Newport Beach, California. Project samples were received at the laboratory from MEC on July 30, 2001. The samples were stabilized according to the Scope of Work (SOW) and all samples of stabilized dredge material were forwarded to the appropriate laboratory for chemical or physical testing.
4.1 LABORATORY EQUIPMENT
The WBR laboratory is equipped to perform small-scale tests of dredge sediments and other materials. The following summarizes the equipment utilized for the bench test program:
• Platform scale - WBR maintains a certified Ohaus electronic platform scale with a capacity of 50 kg (110 lbs.). The scale was checked and certified by California Scale Company on August 10, 2001 and was primarily used to weigh samples before mixing.
• Pulp balance - An Ohaus triple beam pulp balance with a capacity of 20 kg (44 lb) was used to weigh reagents.
• Bench top mixer - A Kitchen Aide mixer with a 1.9 liter (0.5 gallon) capacity was used for mixing small amounts of samples and reagents to evaluate various properties.
• Testing mixer - Imer Mix 60 low speed mortar mixer (approximately 70 rpm) with a removable mixing tub was used to mix samples and reagents. Each bucket portion of sample weighed between 17 kg and 33 kg (37.5 lbs. to 72.5 lbs.). The mixer capacity was about 57 liters (15 gallons). A low speed mortar mixer is more appropriate than a high-speed mixer in that it more closely resembles operating speeds of large field mixers.
• Refrigerator - A refrigerator was maintained in the laboratory to provide for temporary storage of samples prior to shipment.
• Modified Vicat equipment - An ELE-Soil Test Vicat unit was used to evaluate stabilized mixture set-time. The Vicat unit applies a standard weight of 300 grams in the form of a 10 mm diameter solid steel tube plunger to the surface of the stabilized sample (a smaller diameter needle can also be used for ASTM cement testing). Readings of the depth of the plunger penetration are taken with time. Depending upon the degree of penetration of the Vicat plunger, the firmness or “set” of the mixture can be estimated. This “modified” Vicat test allows for evaluation of a “soft set” time with respect to identifying material handling

4-2
• Characteristics for Loading and Hauling - The conventional ASTM C187/C191 Vicat tests use much smaller needles, with greater penetration potential, and are designed to evaluate cement mixtures for a relatively “hard set” on a cement surface such as a cement used in a roadway
Although set-time measurement was not included in the Scope of Work, the WBR group felt it was important to track this parameter and modified Vicat measurements were taken for all of the stabilization sample groups. Mixture set-time is important because quicker setting mixes can greatly reduce field equipment requirements and speed production. This is an important aspect in evaluating overall operating costs with different reagent mixtures. Photo 4-1 shows the modified Vicat test apparatus. More detailed discussion of the modified Vicat testing is provided in Attachment B.
Photo 4-1
4.2 PRELIMINARY EVALUATION
Prior to beginning the bench testing program, WBR undertook a preliminary evaluation of the four samples to determine water content and optimum mixture combinations. This preliminary evaluation focused on small-scale tests and visual observation of sample behavior. The optimum testing conditions were chosen based upon WBR’s experience in working with contaminated dredged sediments using cement based stabilizing reagents.
4.2.1 Sample Receipt
MEC delivered project samples on July 30, 2001 (Photo 4-2). MEC also forwarded raw samples from each of the four sample areas directly to ToxScan for chemical analysis. Chain of custody

4-3
protocol was observed for all samples received and sent by WBR. All samples were stored in the WBR laboratory prior to shipment.
Photo 4-2
Samples from each of the four areas were inspected and the following general characteristics were noted:
• MdR - very coarse, sandy material with little or no cohesion. Strong sulfide odor and shells and debris evident.
• LARE - also very sandy material; not as coarse as MdR. Strong sulfide odor.
• POLB - heavy cohesive material. Very strong sulfide odor and numerous shells.
• POLA - oily material with cohesive and crude oil consistency. Strongest sulfide odor of all samples, with very strong organic vapor odors.
4.2.2 Scoping Tests
Samples from each project area were evaluated to determine the optimum stabilization treatment approach. A key aspect of cement-based stabilization is that adequate water must be present to allow for thorough mixing. The bench test aim was to simulate stabilization treatment of sediments from a dredging operation. The samples obtained by MEC for the program were optimum for sampling purposes, but had a somewhat lower water content than would generally be expected from ongoing dredging operations.

4-4
Preliminary discussions regarding testing plans had assumed that excess water would have to be removed from the samples prior to mixing in order to achieve the appropriate water content for an efficient stabilization mixture. However, observation of the samples in preliminary testing indicated that water would have to be added to POLB and POLA samples in order to begin approximating “as dredged” moisture conditions. Preliminary evaluation of small quantity (approximately 1 liter samples) indicated that the various reagents would solidify the samples in a reasonable amount of time at concentrations previously estimated.
4.2.3 Seawater Acquisition
In order to provide material with characteristics that would approximate dredging conditions, WBR obtained a quantity of seawater that would be used throughout the testing program. On August 1, 2001, WBR loaded a 1,900 liter (500 gallon) plastic water tank at the LARE boat ramp in Long Beach (see Photo 4-3). The tank was triple rinsed with seawater and then filled using a new hose and pump. The seawater tank was towed to WBR’s laboratory and the seawater was temporarily stored in the tank until new 208 liter (55 gallon) drums were delivered. Following delivery of the drums, the seawater was transferred to the drums and the seawater was used throughout the test program for water addition to the samples and for rinsing mixing equipment. The seawater was recorded in the laboratory notebook as “WBR 001” and a sample was retained in a glass jar in the laboratory refrigerator.
Photo 4-3

4-5
4.2.4 Seawater Addition
Typical dredging operations for contaminated material utilize clamshell dredge buckets. Depending upon the thickness of the sediment "face" being dredged and dredge bucket manipulation, the water content of the dredged material can vary significantly. In general, water content will be reduced with increasing face thickness. This is due to the ability of the dredge operator to obtain a dredge bucket full of sediment (with a thick face) vs. a bucket with a high water content (thin face mixture of sediment and water).
The bench test sediments were obtained with care and most likely minimized water content compared with production scale dredging. In order to more closely simulate production samples, seawater was added to the POLB and POLA samples. Samples from the four test areas were evaluated in bench scale "scoping" tests to determine mixing characteristics and the optimum water content to allow thorough sample and reagent blending.
Original bench testing plans called for simulating “as dredged” samples, i.e., conditions by mixing each sample with seawater, allowing the sample to settle and then decanting the seawater to a fixed level. In order to evaluate this procedure, WBR began testing samples from the four areas with seawater addition. Five gallons (approximately 19 liters) of seawater was mixed with each five gallon sample using the Imer Mix 60 mixer. The samples were allowed to settle out after mixing for one to five hours, the supernatant water was siphoned and the samples evaluated.
This procedure was disappointing in that the samples did not settle quickly and showed great variability. Also, the siphoning procedure inevitably removed significant amounts of sample fines, raising a concern that the samples might become biased due to removal of contaminates. After consulting with COE representatives and Moffatt & Nichol Engineers representatives, the seawater addition procedure was abandoned and the samples were evaluated in the bench top mixer to determine optimum water content for each sample.
Preliminary scoping tests were performed on all samples using the bench top mixer and 1 liter samples with 8% cement as the reagent. The preliminary scoping tests indicated that LARE and MdR samples could be adequately mixed as received from MEC. However, the POLB and POLA samples were simply too thick to mix on an as-received basis. After trial seawater additions, the optimum was chosen as:
• LARE and MdR - no seawater added. Reagents to be added as-received.
• POLB - very thick viscous sample requiring 12% by weight of seawater to approximate an ‘as-dredged’ condition. All POLB samples to include 12% seawater addition as part of the testing protocol.
• POLA - thick, oily sample requiring 5% by weight of seawater to approximate an ‘as-dredged’ condition. All POLA samples to include 5% seawater addition as part of the testing protocol.

4-6
4.3 CEMENT STABILIZATION REAGENTS
Three reagents were used to evaluate stabilization of the four dredged sediment samples:
• Cement - The cement used for stabilization tests was ASTM C150, Type II cement from Calaveras Cement Company, located in California. This was “fresh” un-carbonated cement from a bulk silo (ISG Resources).
• Fly Ash - Fly ash used was ASTM C 618, Class F fly ash. The fly ash source for this test series was Navajo Generating Station (NGS) in Page, Arizona (obtained through ISG Resources). NGS ash is routinely imported into Southern California and is readily available in commercial quantities.
• Fluidized Bed Coal and Wood Ash - Fluidized bed ash used for the test series was a highly reactive high lime content ash from the Coal Mac Power Plant in Southern California. It is readily available in commercial quantities.
Reagent samples were received and stored at the WBR laboratory in late July. Portland cement and fly ash reagents were received in plastic lined paper bags. The fluidized bed ash was received in 19 liter (5 gallon) plastic buckets. About 4.5 kgs of each reagent was placed in a labeled plastic container with a tight fitting plastic lid. Reagents from these containers were weighed out and used for the stabilization mixing tests. The following table summarizes reagent costs:
Table 4-1 Reagent Source and Cost
Reagent Source Cost per Ton Range For Southern CA
Portland cement Calaveras $67 to $82 Fly ash Navajo GS $32 to $36 Fluidized bed ash Coal Mac GS $17 to $20
4.4 BENCH TEST PROCEDURES
All bench test stabilization procedures were performed in the WBR laboratory. Table 4-2 summarizes specific test mixtures by location.

4-7
4.4.1 Stabilization Mixing Procedure
Samples for each of the four project areas were placed in 57-liter (15-gallon) HDPE (polyethylene) plastic mixing tubs designed especially for the low speed mixer (see Photo 4-4). In order to avoid sample cross contamination, four mixing tubs were used, i.e., one tub for each of the four sample areas. The procedure for each sample is described in Attachment B.
Photo 4-4
4.4.2 Observations During Sample Preparation
Samples from the four project areas showed considerable physical variability. All samples were successfully mixed at the specified reagent addition levels but reacted differently to mixing procedures and reagent addition. The following notes summarize some of the more noteworthy aspects:

4-8
• LARE - This material had a high content of coarse sand. It exhibited a strong sulfide odor upon opening the sample buckets. The high coarse sand content abraded the HDPE mixing tub, but the samples mixed easily and set quickly with 8% cement, showing a firm consistency about 3.5 hours after mixing.
• MdR - The MdR samples also had a high sand content that was even coarser than LARE. Sulfide odor was strong. There was also a large amount of debris present in the MdR samples, ranging from wood and plastic scraps to wire and metal pieces. Large portions of debris were removed as appropriate and the sample weight adjusted accordingly. The MdR samples also abraded the HDPE mixing tubs during stabilization mixing. The heavy coarse sand content of the MdR samples made mixing difficult. After pre-mixing, it was sometimes necessary to use a small shovel to make sure that unmixed material did not remain on the bottom of the mixing tub. The addition of reagents (especially fly ash and fluidized bed ash) greatly aided the suspension of the coarse sand and improved mixing characteristics. MdR samples also set very quickly with 8% cement, showing a firm consistency about 3 hours after mixing.
• POLB - This material had a high clay and/or silty-clay content and a strong sulfide odor. There was a significant amount of shells in the sample, but it was not practical to remove the shell debris. The POLB samples as received were very difficult to mix due to the minimal water and high clay content. Following initial scoping tests, 12% by weight of seawater was added to each POLB sample during the pre-mixing stage. This greatly improved the mixing characteristics and produced a material that more closely resembles “as-dredged” sediments. POLB samples were also quick setting with 8% cement, showing firmness after about 2 hours.
• POLA - The POLA material also had a high clay content and a very strong sulfide odor coupled with a very strong organic odor. The POLA material was also very oily, with the appearance of a high content of crude oil sludge. Following the scoping tests, 5% by weight of seawater was added to each of the POLA samples during the pre-mixing stage. POLA material set quickly with 8% cement, with a firm set in about 3 hours. However, lower levels of cement greatly extended the set times.
Discussion of the relevance of the modified Vicat tests is included in the following section, along with discussion of other physical test parameters.
Following completion of stabilization mixing and modified Vicat testing, the remainder of the sample was placed in the original 19-liter (5-gallon) plastic sample bucket (Photo 4-5), labeled and recorded on a chain of custody form. The stabilized sample was then sent to Smith-Emery GeoServices for geotechnical testing. As part of the testing procedure, Smith-Emery prepared samples of stabilized material that were sent to ToxScan Laboratories for chemical analysis.

4-9
Photo 4-5
4.5 DISCUSSION REGARDING TIMING OF PHYSICAL TESTING
At the outset of the study, the following general protocol was agreed upon:
• One of the key purposes of the bench test series was to test materials under conditions and timelines that were consistent with full-scale operational procedures. Projected full scale operations timelines were:
• Materials would be mixed in a holding area and allowed to cure.
• Approximately 12 to 24 hours following mixing, the stabilized material would be excavated and stockpiled.
• In the following 2 to 10 days, the stockpile material would be placed in the laydown working area and dried to optimum moisture for compaction.
• Bench samples were to be mixed with cement and other binders in the WBR laboratory. Following mixing, the samples were placed in plastic buckets, labeled and held for Smith-Emery (SE) pick-up per chain of custody records.
4-10
• SE technicians generally obtained the mixed samples about 12 to 24 hours following mixing in the WBR laboratory. However, some samples were picked up by SE two to three days following mixing.
• Prior to geotechnical testing, SE dried the mixed samples to optimum moisture content. This procedure added days to the testing protocol and simulated the overall testing intent of following actual full-scale operational procedures.
The intent of the bench test program in simulating field operations meant that standard ASTM procedures for testing soil-cement would be modified per bench program test timelines. For example, rather than immediately placing mixed samples in a mould for compaction testing per ASTM procedures, the material was allowed to cure, was dried to optimum moisture and then reformed into an optimum test sample. Table 4-3 summarizes sample mix times and SE testing times.
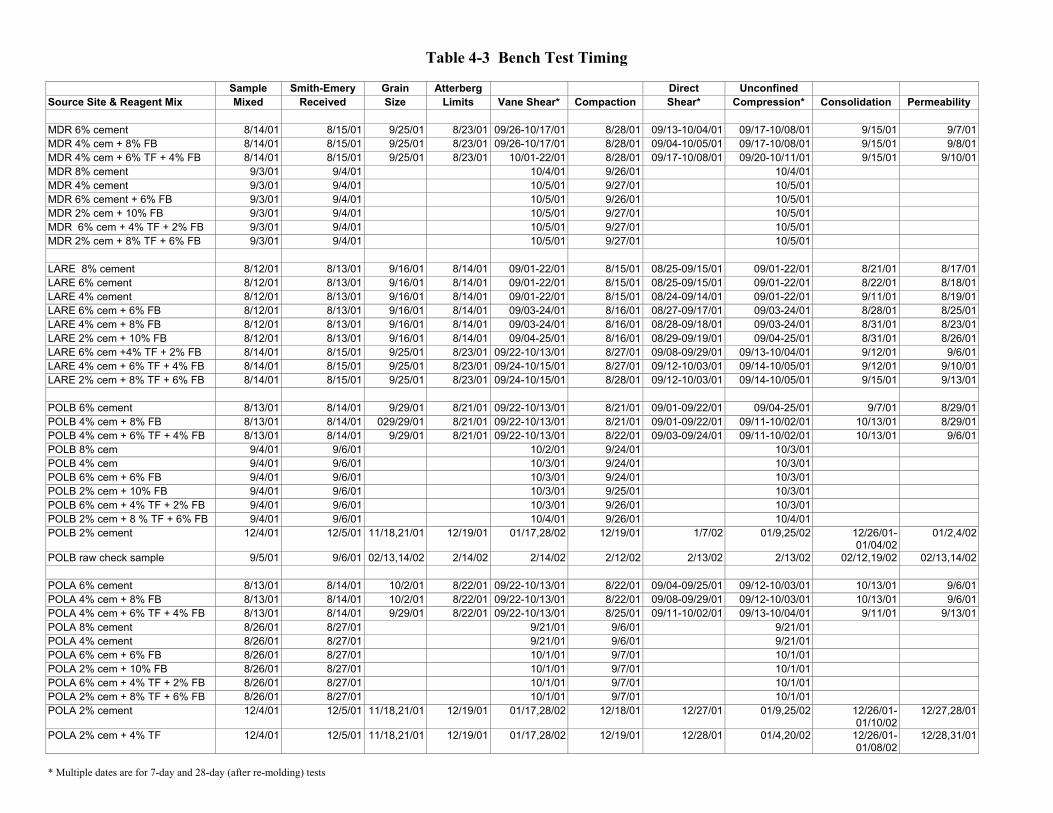
Table 4-3 Bench Test Timing
Sample Smith-Emery Grain Atterberg Direct Unconfined Source Site & Reagent Mix Mixed Received Size Limits Vane Shear* Compaction Shear* Compression* Consolidation Permeability
MDR 6% cement 8/14/01 8/15/01 9/25/01 8/23/01 09/26-10/17/01 8/28/01 09/13-10/04/01 09/17-10/08/01 9/15/01 9/7/01MDR 4% cem + 8% FB 8/14/01 8/15/01 9/25/01 8/23/01 09/26-10/17/01 8/28/01 09/04-10/05/01 09/17-10/08/01 9/15/01 9/8/01MDR 4% cem + 6% TF + 4% FB 8/14/01 8/15/01 9/25/01 8/23/01 10/01-22/01 8/28/01 09/17-10/08/01 09/20-10/11/01 9/15/01 9/10/01MDR 8% cement 9/3/01 9/4/01 10/4/01 9/26/01 10/4/01MDR 4% cement 9/3/01 9/4/01 10/5/01 9/27/01 10/5/01MDR 6% cement + 6% FB 9/3/01 9/4/01 10/5/01 9/26/01 10/5/01MDR 2% cem + 10% FB 9/3/01 9/4/01 10/5/01 9/27/01 10/5/01MDR 6% cem + 4% TF + 2% FB 9/3/01 9/4/01 10/5/01 9/27/01 10/5/01MDR 2% cem + 8% TF + 6% FB 9/3/01 9/4/01 10/5/01 9/27/01 10/5/01
LARE 8% cement 8/12/01 8/13/01 9/16/01 8/14/01 09/01-22/01 8/15/01 08/25-09/15/01 09/01-22/01 8/21/01 8/17/01LARE 6% cement 8/12/01 8/13/01 9/16/01 8/14/01 09/01-22/01 8/15/01 08/25-09/15/01 09/01-22/01 8/22/01 8/18/01LARE 4% cement 8/12/01 8/13/01 9/16/01 8/14/01 09/01-22/01 8/15/01 08/24-09/14/01 09/01-22/01 9/11/01 8/19/01LARE 6% cem + 6% FB 8/12/01 8/13/01 9/16/01 8/14/01 09/03-24/01 8/16/01 08/27-09/17/01 09/03-24/01 8/28/01 8/25/01LARE 4% cem + 8% FB 8/12/01 8/13/01 9/16/01 8/14/01 09/03-24/01 8/16/01 08/28-09/18/01 09/03-24/01 8/31/01 8/23/01LARE 2% cem + 10% FB 8/12/01 8/13/01 9/16/01 8/14/01 09/04-25/01 8/16/01 08/29-09/19/01 09/04-25/01 8/31/01 8/26/01LARE 6% cem +4% TF + 2% FB 8/14/01 8/15/01 9/25/01 8/23/01 09/22-10/13/01 8/27/01 09/08-09/29/01 09/13-10/04/01 9/12/01 9/6/01LARE 4% cem + 6% TF + 4% FB 8/14/01 8/15/01 9/25/01 8/23/01 09/24-10/15/01 8/27/01 09/12-10/03/01 09/14-10/05/01 9/12/01 9/10/01LARE 2% cem + 8% TF + 6% FB 8/14/01 8/15/01 9/25/01 8/23/01 09/24-10/15/01 8/28/01 09/12-10/03/01 09/14-10/05/01 9/15/01 9/13/01
POLB 6% cement 8/13/01 8/14/01 9/29/01 8/21/01 09/22-10/13/01 8/21/01 09/01-09/22/01 09/04-25/01 9/7/01 8/29/01POLB 4% cem + 8% FB 8/13/01 8/14/01 029/29/01 8/21/01 09/22-10/13/01 8/21/01 09/01-09/22/01 09/11-10/02/01 10/13/01 8/29/01POLB 4% cem + 6% TF + 4% FB 8/13/01 8/14/01 9/29/01 8/21/01 09/22-10/13/01 8/22/01 09/03-09/24/01 09/11-10/02/01 10/13/01 9/6/01POLB 8% cem 9/4/01 9/6/01 10/2/01 9/24/01 10/3/01POLB 4% cem 9/4/01 9/6/01 10/3/01 9/24/01 10/3/01POLB 6% cem + 6% FB 9/4/01 9/6/01 10/3/01 9/24/01 10/3/01POLB 2% cem + 10% FB 9/4/01 9/6/01 10/3/01 9/25/01 10/3/01POLB 6% cem + 4% TF + 2% FB 9/4/01 9/6/01 10/3/01 9/26/01 10/3/01POLB 2% cem + 8 % TF + 6% FB 9/4/01 9/6/01 10/4/01 9/26/01 10/4/01POLB 2% cement 12/4/01 12/5/01 11/18,21/01 12/19/01 01/17,28/02 12/19/01 1/7/02 01/9,25/02 12/26/01-
01/04/0201/2,4/02
POLB raw check sample 9/5/01 9/6/01 02/13,14/02 2/14/02 2/14/02 2/12/02 2/13/02 2/13/02 02/12,19/02 02/13,14/02
POLA 6% cement 8/13/01 8/14/01 10/2/01 8/22/01 09/22-10/13/01 8/22/01 09/04-09/25/01 09/12-10/03/01 10/13/01 9/6/01POLA 4% cem + 8% FB 8/13/01 8/14/01 10/2/01 8/22/01 09/22-10/13/01 8/22/01 09/08-09/29/01 09/12-10/03/01 10/13/01 9/6/01POLA 4% cem + 6% TF + 4% FB 8/13/01 8/14/01 9/29/01 8/22/01 09/22-10/13/01 8/25/01 09/11-10/02/01 09/13-10/04/01 9/11/01 9/13/01POLA 8% cement 8/26/01 8/27/01 9/21/01 9/6/01 9/21/01POLA 4% cement 8/26/01 8/27/01 9/21/01 9/6/01 9/21/01POLA 6% cem + 6% FB 8/26/01 8/27/01 10/1/01 9/7/01 10/1/01POLA 2% cem + 10% FB 8/26/01 8/27/01 10/1/01 9/7/01 10/1/01POLA 6% cem + 4% TF + 2% FB 8/26/01 8/27/01 10/1/01 9/7/01 10/1/01POLA 2% cem + 8% TF + 6% FB 8/26/01 8/27/01 10/1/01 9/7/01 10/1/01POLA 2% cement 12/4/01 12/5/01 11/18,21/01 12/19/01 01/17,28/02 12/18/01 12/27/01 01/9,25/02 12/26/01-
01/10/0212/27,28/01
POLA 2% cem + 4% TF 12/4/01 12/5/01 11/18,21/01 12/19/01 01/17,28/02 12/19/01 12/28/01 01/4,20/02 12/26/01-01/08/02
12/28,31/01
* Multiple dates are for 7-day and 28-day (after re-molding) tests

5-1
5.0 PHYSICAL TEST PROGRAM AND RESULTS The purpose of the physical test program was to assess the improvement of the engineering characteristics of the source site sediments as a result of the CBS process. This section describes the physical testing program and summarizes the results.
5.1 PHYSICAL TEST PROGRAM
Smith-Emery GeoServices performed the physical testing in accordance with the contract scope summarized in Section 2.4.5 of this report. The engineering qualities of a soil are determined by a range of physical parameters. The following provides a general description of each of the physical tests performed including their relevance. The ASTM testing method used is also referenced.
• Grain Size – Grain size distribution is a key parameter in characterizing a soil type, and plays an important role in determining both physical and chemical (i.e., contaminant binding) characteristics (ASTM D 422). The relative distribution of sands, silts and clays are reported for each raw site material. The Unified Soil Classification System (USCS) was also used to classify the materials.
• Atterberg Limits – Test determines the liquid limit (LL), plastic limit (PL), and the plasticity index (PI) of soils. The test is commonly used as an integral part of several engineering classification systems to characterize the fine-grained fractions of soils. The LL, PL and PI are also used extensively with other soil properties to correlate with engineering behavior such as compressibility, permeability, compactibility, shrink-swell and shear strength (ASTM D 4318).
• Vane Shear – This is a test to measure shear strength in cohesive soil. Vane is turned and torque required to initiate failure is measured, as well as post-failure shear strength (ASTM D 2573).
• Compaction – This test is used to determine the relationship between water content and dry unit weight of soils. Soil placed as engineering fill (embankments, foundation pads, road base) is compacted to a dense state to obtain satisfactory engineering properties such as shear strength, compressibility, or permeability. Laboratory compaction tests provide the basis for determining the percent compaction and water content needed to achieve the required engineering properties, and for controlling construction to assure that the required compaction and water contents are achieved. Results are provided in terms of maximum dry density and optimum moisture content (ASTM D 1557).
.

5-2
• Direct Shear – Measures consolidated drained shear strength in direct shear. Key test results include the cohesion, or strength intercept of the material, and the friction angle (ASTM D 3080). These values were used to calculate the remolded shear strength of the various mixes for strength comparison purposes.
• Unconfined Compressive Strength – Determines compressive strength of soil-cement using molded cylinders as test specimens (ASTM D 1633 Method A). It should be noted that test accuracy is within approximately 700 psf.
• Consolidation – Test to determine rate and magnitude of consolidation of a soil. Compressibility of soils as determined from this test is used to estimate rate and total amount of differential and total settlement of a structure or landfill (ASTM 2435). Test results were used in this study to calculate the compression index of the material, providing a relative measure of its compressibility.
• Permeability - This test measures ease at which water passes through soil. Results are applied in drainage, seepage and consolidation analyses (ASTM D 2434).
5.2 PHYSICAL TEST RESULTS
Results of the physical testing program for each source site are summarized in the following sections. Due to the inherent variations in the composition of the various source site soils, each is considered separately. Plots of result summaries (Figures 5-1 through 5-4) are included at the end of this chapter. Detailed test results are included in Attachment C.
5.2.1 Marina del Rey
Key CSBST physical test results for Marina del Rey are illustrated in Figure 5-1. The following summarizes the key test results:
General Discussion
Granular soils such as sand are generally suitable for upland engineering applications due to good strength, limited compressibility and ease of drainage. Grain size analysis results indicate the raw MdR material was described as a dark gray silty sand, with a sand content of 93.4 percent. The material was classified under the Unified Soil Classification System (USCS) as SP-SM. Thus from a physical standpoint, the raw MdR material already possesses good engineering qualities. Of interest here, then, is the relative improvement of those qualities associated with the CBS process. Although not specifically required for these materials, containment of contaminants was also an objective of this study. The results are discussed in Section 6.0.

5-3
Set Time
Raw dredged material can be difficult to handle due to high moisture content. After placement in a construction compaction area, the raw material can exhibit substantial drying time before reaching optimum moisture content for compaction. The CBS process clearly improved the manageability of the material through reduced set times based on the modified Vicat testing. In effect, the CBS process reduces the water content through the hydration process, thereby reducing the need to drain the material by other means such as air drying and sluicing. When the material is defined as “set” in the modified Vicat testing, it has achieved consistency that can be handled by typical earth moving equipment without the presence of free liquids. Figure 5-1 shows the higher cement concentrations resulted in shorter set times. The other reagents tended to extend set times, but only to a limited extent.
A suggested general and desirable field operating goal is that the stabilized mixtures should be “set” for handling purposes within 12 to 16 hours after mixing. A short set time allows the material to be loaded, transported and placed in the desired fill area with optimum land based and marine equipment usage. Materials with shorter set times also generally exhibit shorter drying times in the field as the stabilized materials are dried to optimum moisture for compaction. In using the modified Vicat procedure as described, a 10mm plunger rod penetration of about 1 to 4 mm is taken as “set” for field equipment handling purposes. At this level of penetration, WBR field experience has shown that the stabilized material does not have free liquids and has a high angle of repose, rendering the material suitable for excavation, loading and hauling purposes. At “zero” plunger rod penetration, the material is competent and easily handled for excavation and hauling purposes.
Atterberg Limits
This test is a classification test similar to the Grain Size Analysis. It is used to determine whether fine-grained materials are plastic, having clay-like properties, or non-plastic, having properties more similar to sands, i.e., fine-grained, non-plastic materials such as silts. Test results found all MdR site samples to be non-plastic.
Vane Shear
The vane shear strength was greatly improved. However, it is important to note that this test is used primarily for soft, saturated cohesive soils, and the samples are not allowed to drain water prior to testing. Thus the limited raw material shear strength is likely due to the relatively high moisture content, which at 24.3 percent upon receipt at the lab was well above the optimum moisture content range of 12.5 percent (see Compaction Test results below). In field applications, this granular material would have generally good draining characteristics (see Permeability Test results) and a drained strength measure would be more appropriate for engineering applications.
The mix with fluidized bed ash (4% cement + 6% Type F ash + 4% fluidized bed ash) resulted in the greatest shear strength. Strengths were improved between the 7-day and 28-day tests, though not as dramatic as for the unconfined compression test.
5-4
Compaction Test
Key results of compaction testing include the maximum dry density and the optimum moisture content. Soil density contributes to strength. Maximum dry density of 110 pcf is desired for select fill (Holtz & Kovacs, 1981). The results show minimum effect of the CBS process on maximum dry density, though the higher cement content mix resulted in the least maximum dry density. Note that the raw and mixed materials fall just short of the 110 pcf desired for select fill.
Optimum moisture content is important since it represents the amount of water to be added to achieve the maximum dry density, for a given amount of compactive effort. Optimum moisture content in granular soils is not as critical as for cohesive soils, with variations of up to 2 percent resulting in no significant variation in material properties.
Direct Shear Test
Using the results of the direct shear tests, the remolded shear strength at a depth of 5 feet and 10 feet was calculated and plotted. Ten feet was considered a representative value in the case where many yards of fill may be required to bring a site to grade; five feet was considered as more representative of a shallow footing. For both cases, there was a significant increase in the remolded shear strength relative to the raw material.
Unconfined Compressive Strength
As shown in Figure 5-1, the raw material had no unconfined compressive strength. When mixed with CBS reagents, significant unconfined compressive strength was achieved. For engineering applications, enhanced unconfined compressive strength results in less confinement of the soil required to resist shear failure.
A typical allowable bearing pressure per the Uniform Building Code (1997) is 1,500 pounds per square foot (psf). Each of the mixes tested for 28-day strength achieved this strength level, indicating acceptability, for example, for a foundation footing without soil confinement.
The higher cement content was found to provide the greatest 28-day compressive strength. There was also a definite increase in unconfined compressive strength between the 7-day and 28-day tests, with the greatest relative increase associated with the highest cement content. This was likely due to the greater cure time required for the greater amount of cement in the reagent mix.
Consolidation Test
A convenient parameter for expressing the relative compressibility of soils is the compression index, which can be determined from stress-strain relationships measured in the consolidation test. Smaller values represent less compressible material. Sowers (1979) suggest soils with compression indices ranging from 0 to 0.19 as having slight or low compressibility. Compression indices along the virgin compression curve were calculated and are illustrated in Figure 5-1. As shown in the figure, both the raw and all the mixed materials are well within the
5-5
range of low compressibility. The CBS process did, however, provide some further reduction in compressibility of the raw material.
Permeability Test
Permeability of the material was reduced as a result of the CBS process, except for the mix with the cement/fly ash/fluidized bed ash. Reduction in the permeability could have resulted from increased binding of the material, changing its consistency. However, all the measured permeability coefficients are considered representative of permeable, well-draining material.
5.2.2 Los Angeles River Estuary
Key CSBST physical test results for the Los Angeles River Estuary are plotted in Figure 5-2. Key results are discussed in the following paragraphs. The LARE site material was subjected to a more complete suite of physical testing based on its characterization of typical material requiring ongoing maintenance dredging in the LA County region.
General Discussion
As discussed for the Marina del Rey site soils, sandy soils are generally suitable for upland engineering applications due to good strength, limited compressibility and ease of drainage. Grain size analysis results indicate the raw LARE material was described as dark gray silty sand with a sand content of 89.0 percent and a USCS classification of SP-SM. Thus from a physical standpoint, the raw LARE material already possesses good engineering qualities. Of interest here, then, is the relative improvement of those qualities associated with the CBS process.
Set Time
The CBS process clearly improved the manageability of the material through reduced set times based on the modified Vicat testing. Again as discussed for the MdR material, the CBS process reduces the water content through the hydration process, thereby reducing the need to drain the material by other means such as air drying and sluicing. When the material is defined as “set” in the modified Vicat testing, it has achieved consistency that can be handled by typical earth moving equipment.
Test results indicate that in general, the higher the cement content, the shorter the set time. For the 4% and 6% cement mixture combinations, the cement mix alone set quicker than with the other added reagents. This further confirms the observation that the pozzolanic reagents tend to retard set times.
Atterberg Limits
This test is a classification test similar to the Grain Size Analysis. It is used to determine whether fine-grained materials are plastic, having clay-like properties, or non-plastic, having properties more similar to sands, i.e., fine-grained, non-plastic materials such as silts. Test results found all LARE site samples to be non-plastic.

5-6
Vane Shear
The vane shear strength was greatly improved. However, as was noted for the MdR results, this test is used primarily for soft, saturated cohesive soils, and the samples are not allowed to drain water prior to testing. For the LARE material, the moisture content upon receipt at the lab was 26.6 percent; again well above the optimum moisture content range of 14.9 percent. In field applications, this granular material would have generally good draining characteristics (see Permeability Test results) and a drained strength measure would be more appropriate for engineering applications.
The only mix that did not exceed the maximum of 5,000 psf after 28 days was the 2 percent cement combination mix.
Compaction Test
The results in Figure 5-2 show minimum effect of the CBS process on maximum dry density. Again, as for the MdR material, the higher cement content mix resulted in the least maximum dry density. Note that the raw and mixed materials fall just short of the 110 pcf desired for select fill. Optimum moisture content test results show, as for the MdR material, the CBS process had little impact on compactive properties of the LARE material.
Direct Shear Test
Using the results of the direct shear tests, the remolded shear strength at a depth of 5 feet and 10 feet was calculated and plotted. The CBS process results in a clear improvement in shear strength, again most pronounced at higher cement concentrations. The Type F coal ash additive provided the least relative improvement.
Unconfined Compressive Strength
As shown in Figure 5-2, the raw material had no unconfined compressive strength. When mixed with CBS reagents, significant unconfined compressive strength was achieved. For engineering applications, enhanced unconfined compressive strength results in less confinement of the soil required to resist shear failure.
Each of the mixes tested for 28-day strength exceeded the typical allowable bearing pressure of 1,500 psf for a foundation footing without soil confinement, except for the 2% cement combination mix. As for the Marina del Rey material, the highest cement content was found to provide the greatest 28-day compressive strength, although it is surprising that the 6 percent cement mix exhibited less strength than the 4 percent cement mix. Regardless, the LARE material mixes exhibited much greater strengths relative to the MdR material.
Again, there was a definite increase in unconfined compressive strength between the 7-day and 28-day tests, though with less relative effect than the MdR material.

5-7
Consolidation Test
Compression indices along the virgin compression curves were calculated and are illustrated in Figure 5-2. As shown in the figure, both the raw and all the mixed materials are well within the range of low compressibility (less than 0.19). The CBS process had minimal impact on LARE material compressibility, except the 2% cement + 10% fluidized bed ash mix, where the compression index more than doubled. This result may be an outlier, and has no significant bearing on the results. It was initially thought that this material may have been mixed at a later date. However, review of the test timing summarized in Table 4-3 indicates that the consolidation test for this reagent mix was performed within the range of test times for the other reagent mixes.
Permeability Test
There was no clear trend indicating the impact on material permeability as a result of the CBS process. All the measured permeability coefficients are considered representative of permeable, well-draining material.
5.2.3 Port of Long Beach
Figure 5-3 summarizes the key CSBST physical test results for the Port of Long Beach. An additional control sample was tested for the POLB material only. The control sample, also referred to as a raw mixed sample, consisted of raw POLB material that was subjected to the same agitation, handling and storage as for the stabilized samples, in order to assess any impact on material characteristics associated with the physical mixing processes, but without addition of stabilizing reagents. Key test results are discussed in the following:
General Discussion
Granular soils such as sand are generally suitable for upland engineering applications due to good strength, limited compressibility and ease of drainage. Finer, cohesive soils are less desirable, and in some cases require some form of physical stabilization. The raw POLB was described in the grain size analysis as dark gray clayey silt, including a 38 percent clay content. The material was classified under the USCS as ML. It is generally these finer materials that can most benefit from the physical stabilization associated with the CBS process.
Set Time
The CBS process clearly improved the manageability of the POLB material through reduced set times based on the modified Vicat testing. The raw material did not set, whereas the set time for processed material ranged from three hours (8 percent cement) to 15 hours (2% cement + 8% Type F +6% fluidized bed ash). Test results indicate that in general, the higher the cement content, the shorter the set time. In all cases, mixes with only cement alone set quicker than with the other added reagents.

5-8
Atterberg Limits
This test is typically applied for fine-grained, cohesive soils such as the POLB material. The results indicate minimal impact of the CBS process on material plasticity, except for the 2 percent cement only mix, which significantly increased the plastic range of the material.
Vane Shear
Vane shear strength measurements exceeded 5,000 psf for the raw material and all of the 28-day mixtures.
Compaction Test
Key results of compaction testing include the maximum dry density and the optimum moisture content. As stated previously, soil density contributes to strength, with a maximum dry density of 110 pcf specified in this report as desired for select fill. The results show a fairly significant reduction in maximum dry density when subjected to the CBS processes. The raw and raw mixed (control) samples exhibited densities of approximately 110 pcf, whereas the treated material maximum densities were reduced to around 90 pcf. The results also show a relatively high optimum moisture content required to achieve maximum density for the treated materials, i.e., increasing from around 15 percent for raw materials to between 25 and 30 percent for the treated materials.
Direct Shear Test
Using the results of the direct shear tests, the remolded shear strength at a depth of 5 feet and 10 feet was calculated. The results show some significant increase for the 6 percent cement and 2 percent cement (at 10 feet only) mixes.
Unconfined Compressive Strength
Figure 5-3 shows mixed results for the unconfined compressive strength tests. The 6 percent cement mix showed the greatest 28-day strength improvement. All tests demonstrated strengths well above the minimum 1,500 psf for footing bearing pressure per the Uniform Building Code (1997). There was also a general increase in unconfined compressive strength between the 7-day and 28-day tests.
Consolidation Test
Compression indices along the virgin compression curve were calculated and are illustrated in Figure 5-3. As shown in the figure, the 2 percent and 6 percent cement mixes actually increased the compressibility of the material from moderate compressibility range (C.I. = 0.20 to 0.39) into the highly compressible range (C.I. > 0.40) (Sowers, 1979). Given the time delay between stabilization mixing in the WBR laboratory and modified ASTM testing at Smith-Emery, it may be that the higher cement mixes more readily formed a soil-cement matrix that were collapsed during compression testing. None of the other mixes resulted in any appreciable reduction in compressibility relative to the raw material.

5-9
Permeability Test
Permeability of the material was significantly increased as a result of the CBS process, with increases relative to the raw material of two orders of magnitude. This is most likely due to creating more of a granular material. The net result is a significant improvement in the drainage characteristics of the material, raising it from a permeability classified as very low to medium to low (Sowers, 1979).
5.2.4 Port of Los Angeles
Key CSBST physical test results for the Port of Los Angeles are plotted in Figure 5-4. Key results are discussed in the following:
General Discussion
The Port of Los Angeles site material from the Consolidated Slip area represents the lowest engineering quality raw material of all the four source sites. The raw composition consists of 41 percent clay, 49 percent silt and only 10 percent sand per the grain size analysis. Such materials generally have poor drainage and high plasticity, shrinkage and swell potential. These characteristics are further demonstrated by the USCS classification of MH for this material. It is these characteristics and the potential to improve these characteristics that is the primary focus of the physical test program.
Set Time
The CBS process clearly improved the manageability of the material, except for the low cement mixes. The 8% cement and 6% cement + 6% fluidized bed ash resulted in set times within six hours. Conversely, the 4% cement alone and both 2% cement mixtures did not set up.
Atterberg Limits
Test results for the plasticity index indicate minimal impact of the CBS process on material plasticity, except for the 6 percent cement only mix, which significantly increased the plasticity index of the material.
Vane Shear
Vane shear strength measurements demonstrated significant shear strength improvement relative to the raw material. Whereas the raw material strength was measured at approximately 800 psf, and all of the 28-day mixtures exceeded 5,000 psf.
Compaction Test
Key results of compaction testing include the maximum dry density and the optimum moisture content. The results show a moderate reduction in maximum dry density when subjected to the CBS processes. The raw sample exhibited a maximum dry density of approximately 90 pcf, whereas the treated material maximum densities were reduced to 80 to 83 pcf. The results also show a relatively high optimum moisture content required to achieve maximum density for the
5-10
treated materials, i.e., increasing from around 20 percent for raw materials to between 28 and 30 percent for the treated materials.
Direct Shear Test
Using the results of the direct shear tests, the remolded shear strength at a depth of 5 feet and 10 feet was calculated. The results indicate limited impact on shear strength.
Unconfined Compressive Strength
Figure 5-4 shows a general correlation between cement content and 28-day unconfined compressive strength, with the 6 percent cement mix showing the greatest strength improvement. All tests demonstrated strengths well above the minimum 1,500 psf for footing bearing pressure per the Uniform Building Code (1997). Comparing the 7-day and 28-day strength tests indicates consistent, though generally limited improvement in strength.
Consolidation Test
Compression indices along the virgin compression curve were calculated and are illustrated in Figure 5-4. The results show significant improvement in the compressibility characteristics of the material as a result of the CBS process. The raw material compression index falls into the highly compressible range (> 0.50), whereas all but the 2 percent cement mixes were shifted into the low compressibility range (< 0.19).
Permeability Test
Permeability of the material was moderately increased as a result of the CBS process, though the 4 percent cement + 8 percent fluidized bed ash exhibited on order of magnitude increase.
5.3 DISCUSSION OF PHYSICAL TESTING RESULTS
In summary, the CBS process provides for rapid enhancement of dredged material manageability, to the extent that the material can “set up” to a consistency conducive to effective loading and transportation operations. The higher the cement content typically resulted in the shortest set time, and the addition of either of the other reagents tended to extend set times. This was a consistent finding for each of the four source site materials.
As for improvement of engineering properties, the Marina del Rey and Los Angeles River Estuary materials were found to comprise mostly sandy material, with inherent good quality and suitability for beneficial re-use without additional solidification.
The engineering quality of the Port of Long Beach material benefited as a result of the CBS process, mostly through increased remolded shear strength and increased permeability resulting in improved drainage characteristics. The CBS process did not reduce compressibility of the material, which is characterized as moderately compressible, and in some cases increased it. The CBS mixes demonstrating the best combination of engineering qualities were the 4% cement + 8% fluidized bed ash, and the 4% cement + 8% Type F ash + 4% fluidized bed ash combinations.
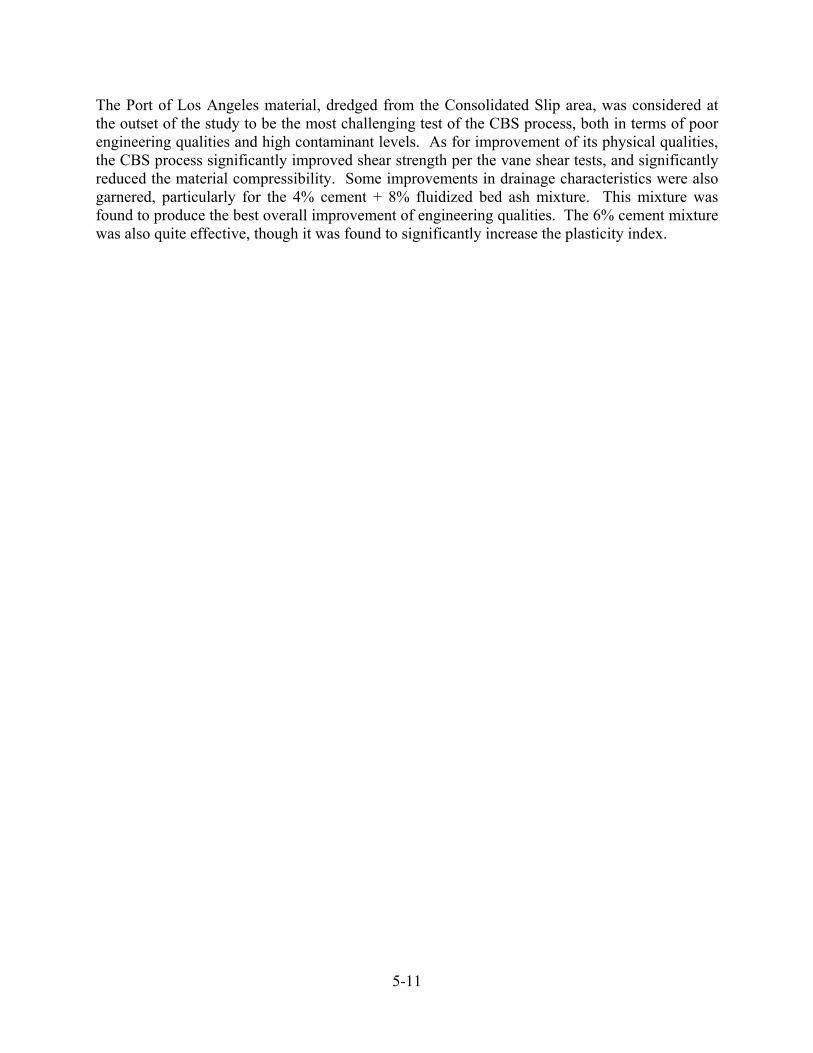
5-11
The Port of Los Angeles material, dredged from the Consolidated Slip area, was considered at the outset of the study to be the most challenging test of the CBS process, both in terms of poor engineering qualities and high contaminant levels. As for improvement of its physical qualities, the CBS process significantly improved shear strength per the vane shear tests, and significantly reduced the material compressibility. Some improvements in drainage characteristics were also garnered, particularly for the 4% cement + 8% fluidized bed ash mixture. This mixture was found to produce the best overall improvement of engineering qualities. The 6% cement mixture was also quite effective, though it was found to significantly increase the plasticity index.

5-12
0 5 10 15 20 25 30
Raw
8% cement
6% cement
4% cement
6%cem+6%FB
4%cem+8%FB
2%cem+10%FB
6%cem+4%TF+2%FB
4%cem+6%TF+4%FB
2%cem+8%TF+6%FB
SET TIME (HRS)
30 HR. = DID NOT SET
RAW COMPOSITION
6.6%
93.4%
Sand
Silt/Clay
0 5 10 15 20 25 30 35 40
Raw
PLASTICITY INDEX (ATTERBERG)
NON PLASTIC
Figure 5-1. Marina del Rey Physical Test Results
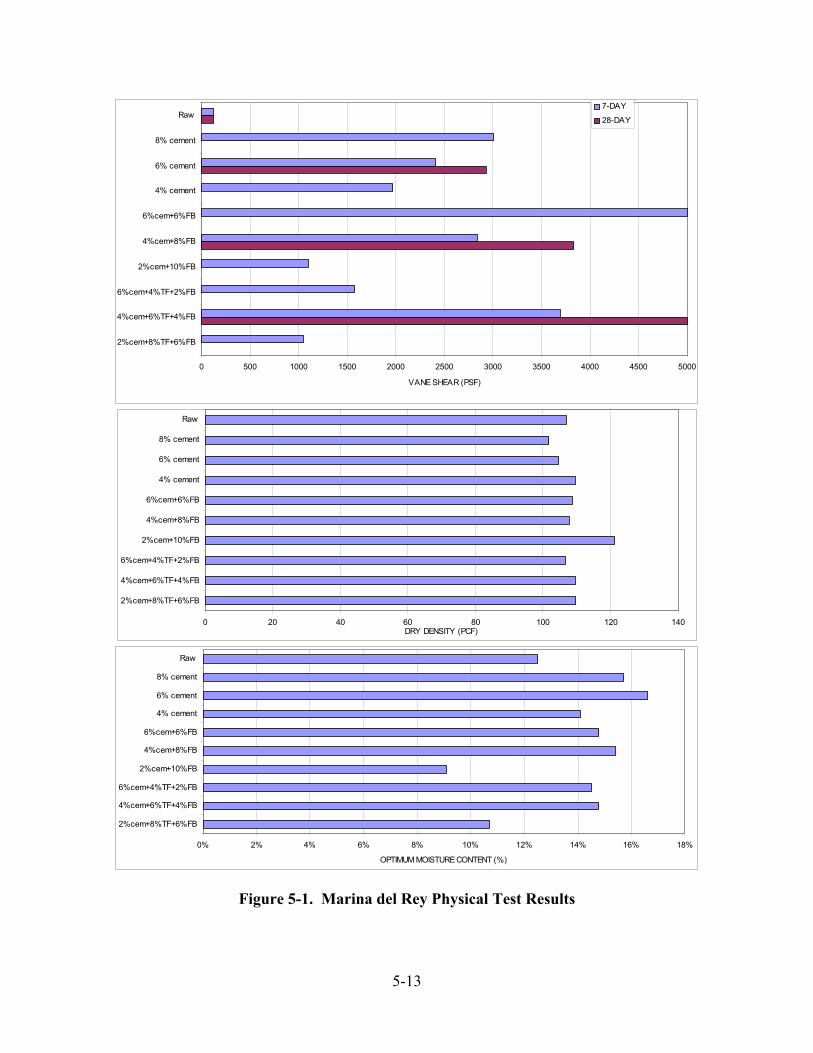
5-13
0 500 1000 1500 2000 2500 3000 3500 4000 4500 5000
Raw
8% cement
6% cement
4% cement
6%cem+6%FB
4%cem+8%FB
2%cem+10%FB
6%cem+4%TF+2%FB
4%cem+6%TF+4%FB
2%cem+8%TF+6%FB
VANE SHEAR (PSF)
7-DAY
28-DAY
0 20 40 60 80 100 120 140
Raw
8% cement
6% cement
4% cement
6%cem+6%FB
4%cem+8%FB
2%cem+10%FB
6%cem+4%TF+2%FB
4%cem+6%TF+4%FB
2%cem+8%TF+6%FB
DRY DENSITY (PCF)
0% 2% 4% 6% 8% 10% 12% 14% 16% 18%
Raw
8% cement
6% cement
4% cement
6%cem+6%FB
4%cem+8%FB
2%cem+10%FB
6%cem+4%TF+2%FB
4%cem+6%TF+4%FB
2%cem+8%TF+6%FB
OPTIMUM MOISTURE CONTENT (%)
Figure 5-1. Marina del Rey Physical Test Results

5-14
0 500 1000 1500 2000 2500 3000 3500 4000
Raw
8% cement
6% cement
4% cement
6%cem+6%FB
4%cem+8%FB
2%cem+10%FB
6%cem+4%TF+2%FB
4%cem+6%TF+4%FB
2%cem+8%TF+6%FB
UCS (PSF)
7-DAY
28-DAY
0 0.01 0.02 0.03 0.04 0.05 0.06 0.07
Raw
8% cement
6% cement
4% cement
6%cem+6%FB
4%cem+8%FB
2%cem+10%FB
6%cem+4%TF+2%FB
4%cem+6%TF+4%FB
2%cem+8%TF+6%FB
COMPRESSION INDEX
0 200 400 600 800 1000 1200 1400
Raw
8% cement
6% cement
4% cement
6%cem+6%FB
4%cem+8%FB
2%cem+10%FB
6%cem+4%TF+2%FB
4%cem+6%TF+4%FB
2%cem+8%TF+6%FB
SHEAR STRENGTH (PSF)
5 FEET
10 FEET
Figure 5-1. Marina del Rey Physical Test Results

5-15
0.0E+00 5.0E-04 1.0E-03 1.5E-03 2.0E-03 2.5E-03 3.0E-03 3.5E-03 4.0E-03
Raw
8% cement
6% cement
4% cement
6%cem+6%FB
4%cem+8%FB
2%cem+10%FB
6%cem+4%TF+2%FB
4%cem+6%TF+4%FB
2%cem+8%TF+6%FB
PERMEABILITY (CM/SEC).
Figure 5-1. Marina del Rey Physical Test Results
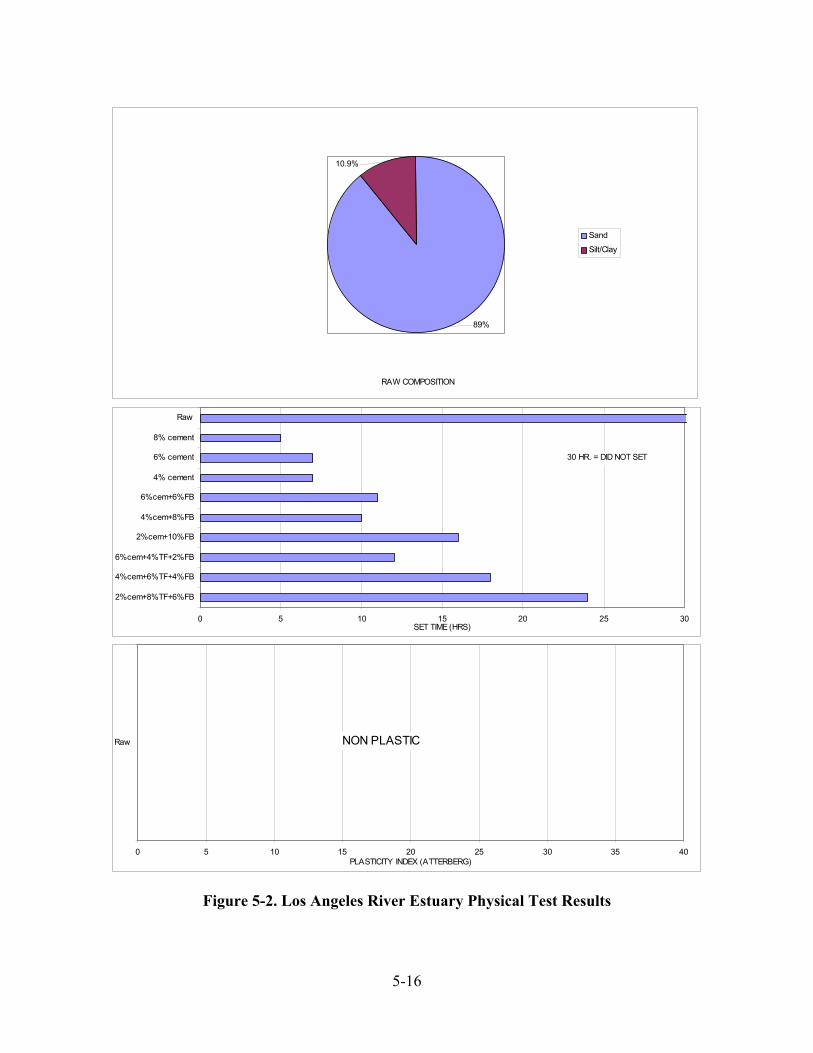
5-16
0 5 10 15 20 25 30
Raw
8% cement
6% cement
4% cement
6%cem+6%FB
4%cem+8%FB
2%cem+10%FB
6%cem+4%TF+2%FB
4%cem+6%TF+4%FB
2%cem+8%TF+6%FB
SET TIME (HRS)
30 HR. = DID NOT SET
RAW COMPOSITION
10.9%
89%
Sand
Silt/Clay
0 5 10 15 20 25 30 35 40
Raw
PLASTICITY INDEX (ATTERBERG)
NON PLASTIC
Figure 5-2. Los Angeles River Estuary Physical Test Results

5-17
0 500 1000 1500 2000 2500 3000 3500 4000 4500 5000
Raw
8% cement
6% cement
4% cement
6%cem+6%FB
4%cem+8%FB
2%cem+10%FB
6%cem+4%TF+2%FB
4%cem+6%TF+4%FB
2%cem+8%TF+6%FB
VANE SHEAR (PSF)
7-DAY
28-DAY
0 20 40 60 80 100 120 140
Raw
8% cement
6% cement
4% cement
6%cem+6%FB
4%cem+8%FB
2%cem+10%FB
6%cem+4%TF+2%FB
4%cem+6%TF+4%FB
2%cem+8%TF+6%FB
DRY DENSITY (PCF)
0% 5% 10% 15% 20% 25%
Raw
8% cement
6% cement
4% cement
6%cem+6%FB
4%cem+8%FB
2%cem+10%FB
6%cem+4%TF+2%FB
4%cem+6%TF+4%FB
2%cem+8%TF+6%FB
OPTIMUM MOISTURE CONTENT (%)
Figure 5-2. Los Angeles River Estuary Physical Test Results

5-18
0 2000 4000 6000 8000 10000 12000 14000 16000
Raw
8% cement
6% cement
4% cement
6%cem+6%FB
4%cem+8%FB
2%cem+10%FB
6%cem+4%TF+2%FB
4%cem+6%TF+4%FB
2%cem+8%TF+6%FB
UCS (PSF)
7-DAY
28-DAY
0 0.02 0.04 0.06 0.08 0.1 0.12 0.14
Raw
8% cement
6% cement
4% cement
6%cem+6%FB
4%cem+8%FB
2%cem+10%FB
6%cem+4%TF+2%FB
4%cem+6%TF+4%FB
2%cem+8%TF+6%FB
COMPRESSION INDEX
0 500 1000 1500 2000 2500 3000
Raw
8% cement
6% cement
4% cement
6%cem+6%FB
4%cem+8%FB
2%cem+10%FB
6%cem+4%TF+2%FB
4%cem+6%TF+4%FB
2%cem+8%TF+6%FB
SHEAR STRENGTH (PSF)
5 FEET
10 FEET
Figure 5-2. Los Angeles River Estuary Physical Test Results

5-19
0.0E+00 5.0E-04 1.0E-03 1.5E-03 2.0E-03 2.5E-03 3.0E-03
Raw
8% cement
6% cement
4% cement
6%cem+6%FB
4%cem+8%FB
2%cem+10%FB
6%cem+4%TF+2%FB
4%cem+6%TF+4%FB
2%cem+8%TF+6%FB
PERMEABILITY (CM/SEC).
Figure 5-2. Los Angeles River Estuary Physical Test Results

5-20
0 5 10 15 20 25 30
Raw
8% cement
6% cement
4% cement
6%cem+6%FB
4%cem+8%FB
2%cem+10%FB
6%cem+4%TF+2%FB
4%cem+6%TF+4%FB
2%cem+8%TF+6%FB
SET TIME (HRS)
30 HR. = DID NOT SET
RAW COMPOSITION
46.5%
16%37.9%
Sand
Silt
Clay
0 5 10 15 20 25 30 35 40
Raw
Raw (control sample)
6% cement
4%cem+8%FB
4%cem+6%TF+4%FB
2%cem
PLASTICITY INDEX (ATTERBERG)
Figure 5-3. Port of Long Beach Physical Test Results

5-21
0 500 1000 1500 2000 2500 3000 3500 4000 4500 5000
Raw
Raw (control sample)
8% cement
6% cement
4% cement
6%cem+6%FB
4%cem+8%FB
2%cem+10%FB
6%cem+4%TF+2%FB
4%cem+6%TF+4%FB
2%cem+8%TF+6%FB
2%cem
VANE SHEAR (PSF)
7-DAY
28-DAY
0 20 40 60 80 100 120
Raw
Raw (control sample)
8% cement
6% cement
4% cement
6%cem+6%FB
4%cem+8%FB
2%cem+10%FB
6%cem+4%TF+2%FB
4%cem+6%TF+4%FB
2%cem+8%TF+6%FB
DRY DENSITY (PCF)
0% 5% 10% 15% 20% 25% 30% 35% 40%
Raw
Raw (control sample)
8% cement
6% cement
4% cement
6%cem+6%FB
4%cem+8%FB
2%cem+10%FB
6%cem+4%TF+2%FB
4%cem+6%TF+4%FB
2%cem+8%TF+6%FB
OPTIMUM MOISTURE CONTENT (%)
Figure 5-3. Port of Long Beach Physical Test Results

5-22
0 2000 4000 6000 8000 10000 12000
Raw
Raw (control sample)
8% cement
6% cement
4% cement
6%cem+6%FB
4%cem+8%FB
2%cem+10%FB
6%cem+4%TF+2%FB
4%cem+6%TF+4%FB
2%cem+8%TF+6%FB
2%cem
UCS (PSF)
7-DAY
28-DAY
0 0.05 0.1 0.15 0.2 0.25 0.3 0.35 0.4 0.45 0.5
Raw
8% cement
6% cement
4% cement
6%cem+6%FB
4%cem+8%FB
2%cem+10%FB
6%cem+4%TF+2%FB
4%cem+6%TF+4%FB
2%cem+8%TF+6%FB
2%cem
COMPRESSION INDEX
0 200 400 600 800 1000 1200 1400
Raw
8% cement
6% cement
4% cement
6%cem+6%FB
4%cem+8%FB
2%cem+10%FB
6%cem+4%TF+2%FB
4%cem+6%TF+4%FB
2%cem+8%TF+6%FB
2%cem
SHEAR STRENGTH (PSF)
5 FEET
10 FEET
Figure 5-3. Port of Long Beach Physical Test Results

5-23
0.0E+00 1.0E-04 2.0E-04 3.0E-04 4.0E-04 5.0E-04 6.0E-04 7.0E-04 8.0E-04
Raw
Raw (control sample)
8% cement
6% cement
4% cement
6%cem+6%FB
4%cem+8%FB
2%cem+10%FB
6%cem+4%TF+2%FB
4%cem+6%TF+4%FB
2%cem+8%TF+6%FB
2%cem
PERMEABILITY (CM/SEC).
Figure 5-3. Port of Long Beach Physical Test Results
5-24
0 5 10 15 20 25 30
Raw
8% cement
6% cement
4% cement
6%cem+6%FB
4%cem+8%FB
2%cem+10%FB
6%cem+4%TF+2%FB
4%cem+6%TF+4%FB
2%cem+8%TF+6%FB
SET TIME (HRS)
30 HR. = DID NOT SET
RAW COMPOSITION
41.5% 10%
48.6%
Sand
Silt
Clay
0 5 10 15 20 25 30 35 40
Raw
6% cement
4%cem+8%FB
4%cem+6%TF+4%FB
2%cem
2%cem+4%TF
PLASTICITY INDEX (ATTERBERG)
Figure 5-4. Port of Los Angeles Physical Test Results

5-25
0 500 1000 1500 2000 2500 3000 3500 4000 4500 5000
Raw
8% cement
6% cement
4% cement
6%cem+6%FB
4%cem+8%FB
2%cem+10%FB
6%cem+4%TF+2%FB
4%cem+6%TF+4%FB
2%cem+8%TF+6%FB
2%cem
2%cem+4%TF
VANE SHEAR (PSF)
7-DAY
28-DAY
0 10 20 30 40 50 60 70 80 90 100
Raw
8% cement
6% cement
4% cement
6%cem+6%FB
4%cem+8%FB
2%cem+10%FB
6%cem+4%TF+2%FB
4%cem+6%TF+4%FB
2%cem+8%TF+6%FB
DRY DENSITY (PCF)
0% 5% 10% 15% 20% 25% 30% 35% 40%
Raw
8% cement
6% cement
4% cement
6%cem+6%FB
4%cem+8%FB
2%cem+10%FB
6%cem+4%TF+2%FB
4%cem+6%TF+4%FB
2%cem+8%TF+6%FB
OPTIMUM MOISTURE CONTENT (%)
Figure 5-4. Port of Los Angeles Physical Test Results

5-26
0 5000 10000 15000 20000 25000
Raw
8% cement
6% cement
4% cement
6%cem+6%FB
4%cem+8%FB
2%cem+10%FB
6%cem+4%TF+2%FB
4%cem+6%TF+4%FB
2%cem+8%TF+6%FB
2%cem
2%cem+4%TF
UCS (PSF)
7-DAY
28-DAY
0 0.1 0.2 0.3 0.4 0.5 0.6 0.7
Raw
8% cement
6% cement
4% cement
6%cem+6%FB
4%cem+8%FB
2%cem+10%FB
6%cem+4%TF+2%FB
4%cem+6%TF+4%FB
2%cem+8%TF+6%FB
2%cem
2%cem+4%TF
COMPRESSION INDEX
0 200 400 600 800 1000 1200 1400
Raw
8% cement
6% cement
4% cement
6%cem+6%FB
4%cem+8%FB
2%cem+10%FB
6%cem+4%TF+2%FB
4%cem+6%TF+4%FB
2%cem+8%TF+6%FB
2%cem
2%cem+4%TF
SHEAR STRENGTH (PSF)
5 FEET
10 FEET
Figure 5-4. Port of Los Angeles Physical Test Results

5-27
0.0E+00 2.0E-05 4.0E-05 6.0E-05 8.0E-05 1.0E-04 1.2E-04 1.4E-04
Raw
8% cement
6% cement
4% cement
6%cem+6%FB
4%cem+8%FB
2%cem+10%FB
6%cem+4%TF+2%FB
4%cem+6%TF+4%FB
2%cem+8%TF+6%FB
2%cem
2%cem+4%TF
PERMEABILITY (CM/SEC).
Figure 5-4. Port of Los Angeles Physical Test Results
6-1
6.0 CHEMICAL TEST PROGRAM AND RESULTS The preceding section summarized the solidification effects of the cement-based stabilization (CBS) technology. Equally important are the stabilization effects, i.e., reduction in mobility, toxicity and leachability of hazardous chemical constituents within the dredged material. The purpose of the chemical testing program was to assess the effectiveness of CBS technology to allow for beneficial reuse of regional contaminated dredged sediments in upland applications.
6.1 CHEMICAL TESTING PROGRAM
The chemical testing was performed by ToxScan, Inc. of Watsonville, California. Details of the chemical testing program are described in Section 2.4.6 of this report. Analytical procedures associated with sediment samples from this project include:
• Total metals—As, Cd, Cr, Cu, Pb, Hg, Ni, Se, Ag, Zn.
• Pesticides and PCB’s
• Semi-volatile compounds
• Butyltins
• Grain size
• Percent moisture
• Total organic carbon
• Total and dissolved sulfides
• Oil and grease
• Total petroleum hydrocarbons
• Ammonia
• Pore water salinity
• WET leaching procedure
• SPLP leaching procedure

6-2
Following the stabilization procedures, the stabilized samples were tested for the WET and SPLP leaching procedures as well as porewater salinity:
• The WET procedure (Title 22, Waste Extraction Test), uses deionized water as a leaching medium and involves mixing the water and solid in a 10:1 ratio, tumbling the mixture for 72 hours and then analyzing the leachate for the major contaminates listed above.
• The SPLP (Synthetic Precipitation Leaching Procedure) uses an acidic extractant in the range pH 2 or 5, depending upon the initial pH of the sediment. The extractant is mixed with the solid at a 20:1 ratio and is tumbled for 18 hours, followed by analysis of the extract.
Porewater salinity is measured in the interstitial waters found within the sediments. Porewater samples were collected via centrifugation of sediment samples.
6.2 CHEMICAL TEST PROCEDURES
MEC shipped samples of the raw sediment from the LARE, MdR, POLB and POLA sites to ToxScan on July 30, 2001. These samples were received on July 31, 2001 in good condition. Proper chain-of-custody procedures were followed. A portion of this raw material was retained for physical and chemical testing including porewater salinity. A second portion was extracted following the SPLP procedure with chemical testing performed on the extract. A third portion was extracted following the WET procedure with chemical testing performed on this extract as well. The procedures for SPLP and WET extraction are outlined in the preceding section.
After the stabilization process, Smith-Emery forwarded samples of the processed material to ToxScan for chemical analysis. These samples were collected, shipped and received between September 25, 2001 and October 26, 2001. The samples each underwent SPLP and WET extraction prior to chemical analysis. Porewater salinity was measured prior to extraction.
The analyses performed on each sample and extract are listed in Table 6-1 below.
Table 6-1 Chemical and Physical Analyses
Sample Type Grain Size
Percent Solids
Pore-water Salinity TOC pH Total
Sulfides TRPH Metals Butyltins Pesticides PCBs PAHs
Raw Sediment x x x x x x x x x x x x Raw Sediment
SPLP Extraction
x x x x x x x x x Raw Sediment
WET Extraction
x x x x x x x x x Stabilization Blend SPLP Extractions
x1 x x x x x x x x x Stabilization Blend WET Extractions
x x x x x x x x x
1 =Porewater salinity measured on stabiliztion blends prior to extraction.

6-3
Grain size was analyzed utilizing procedures described by Plumb (1981), and percent solids were measured by EPA method 160.3. Porewater salinity was measured by electrical conductance following EPA Standard Method 2520B. Total organic carbon (TOC) was measured by EPA Method 415.1. Measurement of pH followed EPA Method 9045B for the raw material, and Method 150.1 for the extracts. Total sulfides were measured by EPA Method 9030 for the raw material, and EPA Method 376.1 for the extracts. Total recoverable petroleum hydrocarbons (TRPH) were measured by EPA Method 1664. Arsenic was measured by hybrid AA using EPA Method 7061 for the raw material, and Method 206.3 for the extracts. Mercury was measured utilizing cold vapor AA in accordance with EPA Method 7471 for the raw material, and a modified Method 245.1 for the extracts. All other metals were measured by ICP/MS by EPA Method 6020 for the raw material, and Method 200.8 for the extracts. Butyltins were measured using a gas chromatograph with a flame photometric detector (GC/FPD). Organochlorine pesticides and PCBs were measured by EPA Method 8081A. PCBs were identified to the arochlor level. PAHs were measured by EPA Method 8270C.
6.3 QUALITY CONTROL SUMMARY
The laboratory analyses met the quality assurance and quality control criteria outlined in the Scope of Work (SOW), with the exception of duplicate analyses. Duplicate analyses were not run on 10% of the samples, as specified by the SOW.
All samples were analyzed within the holding time limits and met the laboratory’s quality assurance criteria established for the appropriate methods, except where noted below.
• Percent Solids - All QC data were acceptable.
• Total Organic Carbon - All QC data were acceptable.
• pH - All QC data were acceptable.
• Sulfides - All QC data were acceptable.
• TRPH - All QC data were acceptable.
• Metals - All QC data were acceptable.
Butyltins - Dibutyltin was detected (2.8µg/kg) in the method blank for the raw sediment samples. Tributyltin was detected (4.3 µg/kg) in the method blank for the extracts of blend samples WBR-54 through 56. Surrogate recovery (46%) was below acceptable limits (50-140%) for DI WET analysis of the POLB-Channel 2 raw sediment sample. Surrogate recovery was also below acceptable limits for the SPLP extract of the MdR raw sample (34%), and the DI WET extract of the WBR-29 blend sample (47%). Laboratory control spike recovery was below acceptable limits (50-140%) for monobutyltin (0 and 6%) and dibutyltin (47 and 48%) for the SPLP extracts of blends WBR-14 through 31 and for monobutyltin (10 and 9%) for the DI WET extracts of blend samples WBR-14 through 31. Monobutyltin laboratory control spike recovery was below the acceptable limit (12 and 16%) for both DI WET and SPLP extracts for the blend samplesWBR-54 through 56. Because of the large number butyltin samples affected by high
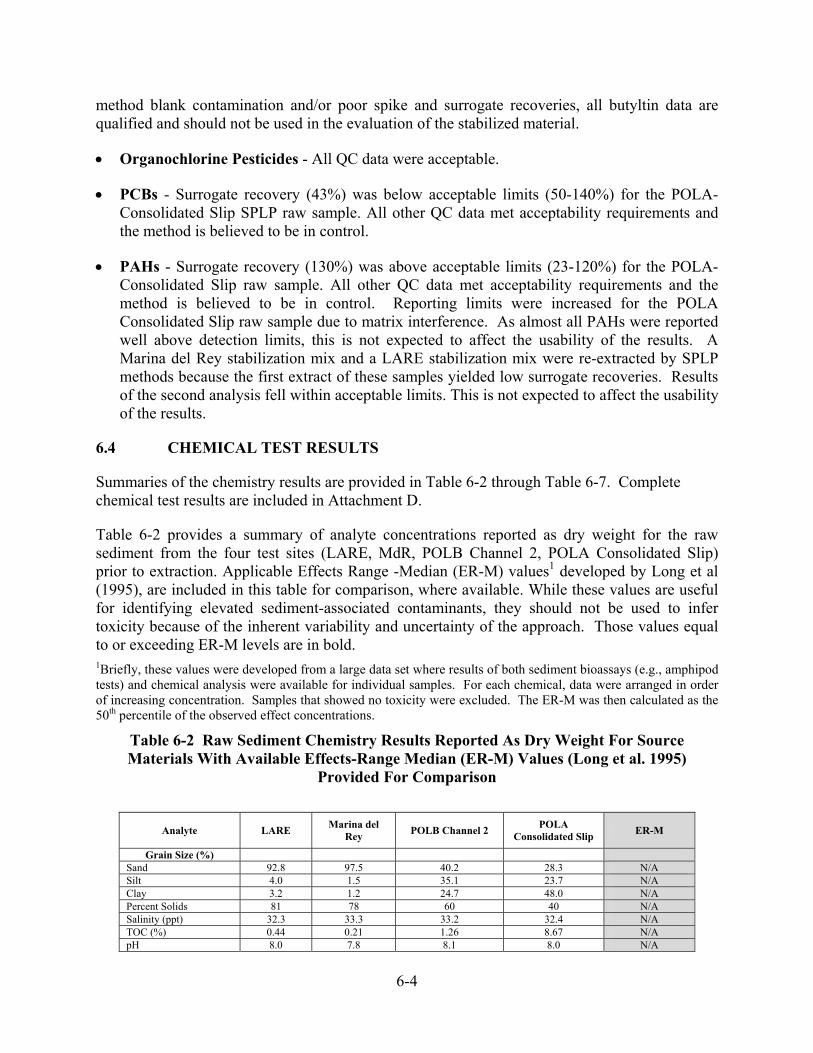
6-4
method blank contamination and/or poor spike and surrogate recoveries, all butyltin data are qualified and should not be used in the evaluation of the stabilized material.
• Organochlorine Pesticides - All QC data were acceptable.
• PCBs - Surrogate recovery (43%) was below acceptable limits (50-140%) for the POLA-Consolidated Slip SPLP raw sample. All other QC data met acceptability requirements and the method is believed to be in control.
• PAHs - Surrogate recovery (130%) was above acceptable limits (23-120%) for the POLA-Consolidated Slip raw sample. All other QC data met acceptability requirements and the method is believed to be in control. Reporting limits were increased for the POLA Consolidated Slip raw sample due to matrix interference. As almost all PAHs were reported well above detection limits, this is not expected to affect the usability of the results. A Marina del Rey stabilization mix and a LARE stabilization mix were re-extracted by SPLP methods because the first extract of these samples yielded low surrogate recoveries. Results of the second analysis fell within acceptable limits. This is not expected to affect the usability of the results.
6.4 CHEMICAL TEST RESULTS
Summaries of the chemistry results are provided in Table 6-2 through Table 6-7. Complete chemical test results are included in Attachment D.
Table 6-2 provides a summary of analyte concentrations reported as dry weight for the raw sediment from the four test sites (LARE, MdR, POLB Channel 2, POLA Consolidated Slip) prior to extraction. Applicable Effects Range -Median (ER-M) values1 developed by Long et al (1995), are included in this table for comparison, where available. While these values are useful for identifying elevated sediment-associated contaminants, they should not be used to infer toxicity because of the inherent variability and uncertainty of the approach. Those values equal to or exceeding ER-M levels are in bold. 1Briefly, these values were developed from a large data set where results of both sediment bioassays (e.g., amphipod tests) and chemical analysis were available for individual samples. For each chemical, data were arranged in order of increasing concentration. Samples that showed no toxicity were excluded. The ER-M was then calculated as the 50th percentile of the observed effect concentrations.
Table 6-2 Raw Sediment Chemistry Results Reported As Dry Weight For Source Materials With Available Effects-Range Median (ER-M) Values (Long et al. 1995)
Provided For Comparison
Analyte LARE Marina del Rey POLB Channel 2 POLA
Consolidated Slip ER-M
Grain Size (%) Sand 92.8 97.5 40.2 28.3 N/A Silt 4.0 1.5 35.1 23.7 N/A Clay 3.2 1.2 24.7 48.0 N/A Percent Solids 81 78 60 40 N/A Salinity (ppt) 32.3 33.3 33.2 32.4 N/A TOC (%) 0.44 0.21 1.26 8.67 N/A pH 8.0 7.8 8.1 8.0 N/A

6-5
Analyte LARE Marina del Rey POLB Channel 2 POLA
Consolidated Slip ER-M
Total Sulfides (mg/kg) 84 120 150 2300 N/A TRPH (mg/kg) 540 440 760 41000 N/A
Metals (mg/kg) Arsenic 1.6 2.7 14 23 70 Cadmium 0.29 ND 0.22 4.7 9.6 Chromium 12 12 48 560 370 Copper 15 8.4 65 830 270 Lead 31 39 80 400 218 Mercury 0.030 0.028 0.59 4.8 0.71 Nickel 7.7 9.3 20 70 51.6 Silver ND ND 0.18 9.0 3.7 Zinc 69 45 150 710 410
Butyltins (µg/kg)1 Monobutyltin 3.8 2.0 6.8 ND N/A Dibutyltin 46 ND 12 14 N/A Tributyltin 16 ND ND ND N/A Tetrabutyltin ND ND ND ND N/A
Pesticides (µg/kg) Aldrin ND ND ND 23 N/A alpha-BHC ND ND ND ND N/A beta-BHC 6.6 ND 9.3 ND N/A delta-BHC ND ND ND ND N/A gamma-BHC ND ND ND ND N/A alpha-Chlordane 5.1 3.8 ND 2.7 N/A gamma-Chlordane 2.9 2.7 2.3 ND N/A Technical Chlordane ND ND ND ND N/A Total Chlordane 8.0 6.5 2.3 2.7 6 4,4’-DDD 7.1 4.1 20 60 20 2,4’-DDD ND ND ND ND 20 4,4’-DDE 5.1 2.4 40 45 27 2,4’-DDE ND ND ND ND 27 4,4’DDT ND ND ND ND 7 2,4’-DDT ND ND ND ND 7 Dieldrin ND ND ND 3.0 8 Endosulfan I ND ND ND ND N/A Endosulfan II ND ND ND ND N/A Endosulfan Sulfate ND ND ND ND N/A Endrin 4.8 ND ND ND N/A Endrin Aldehyde ND ND ND ND N/A Endrin Ketone ND ND ND ND N/A Heptachlor ND ND ND ND N/A Heptachlor Epoxide ND ND ND ND N/A Methoxychlor ND ND ND ND N/A Toxaphene ND ND ND ND N/A
PCBs (µg/kg) Arochlor-1016 ND ND ND ND N/A Arochlor-1221 ND ND ND ND N/A Arochlor-1232 ND ND ND ND N/A Arochlor-1242 ND ND ND ND N/A Arochlor-1248 ND ND ND ND N/A Arochlor-1254 34 18 71 190 N/A Arochlor-1260 ND ND ND ND N/A Total PCBs 34 18 71 190 180
PAHs (µg/kg) Naphthalene ND ND ND 9000 2100 2-Methylnaphthalene ND ND ND 65000 670 Acenaphthylene ND ND 61 2000 640 Acenaphthene ND ND 36 11000 500 Fluorene ND ND 89 19000 540 Phenanthrene 120 27 580 95000 1500 Anthracene ND ND 250 16000 1100 Flouranthene 210 74 980 5500 5100 Pyrene 260 99 1600 23000 2600

6-6
Analyte LARE Marina del Rey POLB Channel 2 POLA
Consolidated Slip ER-M
Benzo(a)anthracene 82 41 460 3700 1600 Chrysene 110 42 680 5500 2800 Benzo(b)fluoranthene 82 56 860 1600 N/A Benzo(k)fluoranthene 84 37 860 ND N/A Benzo(a)pyrene 48 ND 380 1300 1600 Perylene ND ND ND ND N/A Indeno(1,2,3-cd)pyrene 45 ND 350 ND N/A Dibenzo(a,h)anthracene ND ND 150 320 260 Benzo(g,h,i)perylene ND ND ND ND N/A Total PAHs 1000 380 7300 260000 44792
ND = Not Detected
N/A = Not Available
Bold = Value equal to or above ER-M values.
1 All butyltin data are qualified due to QC issues and are provided for informational purposes only.
Table 6-3 through Table 6-6 summarize the results of the chemistry analyses of the raw sediment (concentrations reported as wet weight), the SPLP and WET extracts of the raw sediment, and the SPLP and WET extracts of the stabilization blends. The tables are listed by site. The Total Threshold Limit Concentrations (TTLC) and Soluble Threshold Limit Concentrations (STLC) for inorganic persistent and bio-accumulative toxic substances from the California Code of Regulations, Title 22, are provided for comparative purposes where available. TTLC values are compared to the values reported for the raw sediment (solids), and STLC values are compared to the values reported for the extracts (liquids). Values above these threshold limits are believed to be harmful and the sample is defined as hazardous waste by Title 22 criteria.

6-7
Table 6-3 SPLP And WET Chemistry Results For The LARE Raw Source Material And Associated Blends With Available TTLC And STLC Values For Comparison.
Identification / Analyte
Raw Sample
(Wet Weight)
TTLC (Wet
Weight)
Raw Sample SPLP/ WET
8% Cement SPLP/ WET
6% Cement SPLP/ WET
4% Cement SPLP/ WET
6% Cement + 6%
Fluid-Bed Fly Ash
SPLP/WET
4% Cement + 8%
Fluid-Bed Fly Ash
SPLP/WET
2% Cement + 10%
Fluid-Bed Fly Ash
SPLP/WET
6% Cement + 4% Type F
Fly Ash + 2% Fluid-
Bed Fly Ash SPLP/WET
4% Cement + 6% Type F
Fly Ash + 4% Fluid-
Bed Fly Ash SPLP/WET
2% Cement + 8% Type F Fly Ash + 6% Fluid-Bed Fly
Ash SPLP/WET
STLC
WBR ID Number1 N/A - N/A 14 15 16 17 18 19 26 27 28 - Grain Size (%)
Sand 92.8 N/A N/A N/A N/A N/A N/A N/A N/A N/A N/A N/A N/A Silt 4.0 N/A N/A N/A N/A N/A N/A N/A N/A N/A N/A N/A N/A Clay 3.2 N/A N/A N/A N/A N/A N/A N/A N/A N/A N/A N/A N/A Percent Solids 81 N/A N/A N/A N/A N/A N/A N/A N/A N/A N/A N/A N/A Porewater Salinity (ppt) 32.3 N/A N/A 12.82 12.82 12.82 12.8 10.8 10.8 7.0 9.0 12.8 N/A TOC (mg/l) 0.44% N/A 4.9/9.7 12/20 12/20 11/18 11/19 11/17 11/17 11/19 11/13 10/18 N/A pH 8.0 N/A 7.5/8.0 11/12 11/11 11/11 11/11 11/11 11/11 11/11 11/11 10/11 <2, >12.54 Total Sulfides (mg/kg) 68 N/A ND/ND ND/ND ND/ND ND/ND ND/ND ND/ND ND/ND ND/ND ND/ND ND/ND N/A TRPH (mg/kg) 430 N/A ND/ND ND/ND ND/ND ND/ND ND/ND ND/ND ND/ND ND/ND ND/ND ND/ND N/A
Metals (mg/kg) (mg/kg) (µg/l) (µg/l) (µg/l) (µg/l) (µg/l) (µg/l) (µg/l) (µg/l) (µg/l) (µg/l) (µg/l) Arsenic 1.3 500 3.3/6.7 ND/ND ND/ND ND/ND ND/ND ND/ND ND/ND ND/ND ND/ND ND/ND 5000 Cadmium 0.23 100 ND/ND ND/ND ND/ND ND/ND ND/ND ND/ND ND/ND ND/ND ND/ND ND/ND 1000 Chromium 9.3 2500 ND/ND ND/ND ND/ND ND/ND ND/ND ND/ND ND/ND ND/ND ND/ND ND/ND 5000 Copper 12 2500 ND/ND ND/ND ND/ND ND/ND ND/ND ND/ND ND/ND ND/ND ND/ND ND/ND 25000 Lead 25 1000 ND/ND ND/ND ND/ND ND/ND ND/ND ND/ND ND/ND ND/ND ND/ND ND/ND 5000 Mercury 0.028 20 ND/ND ND/ND ND/ND ND/ND ND/ND ND/ND ND/ND ND/ND ND/ND ND/ND 200 Nickel 6.3 2000 ND/ND ND/ND ND/ND ND/ND ND/ND ND/ND ND/ND ND/ND ND/ND ND/ND 20000 Silver ND 500 ND/ND ND/ND ND/ND ND/ND ND/ND ND/ND ND/ND ND/ND ND/ND ND/ND 5000 Zinc 56 5000 ND/ND ND/ND ND/ND ND/ND ND/ND ND/ND ND/ND ND/ND ND/ND ND/ND 250000
Butyltins5 (µg/kg) (µg/kg) (ng/l) (ng/l) (ng/l) (ng/l) (ng/l) (ng/l) (ng/l) (ng/l) (ng/l) (ng/l) (ng/l) Monobutyltin 3.1 N/A ND/ND ND/ND ND/ND ND/ND ND/ND ND/ND ND/ND ND/ND ND/ND ND/ND N/A Dibutyltin 37 N/A ND/ND ND/ND ND/ND ND/ND ND/ND ND/ND ND/ND ND/ND ND/ND ND/ND N/A Tributyltin 13 N/A ND/ND 7.9/ND 8.9/ND ND/ND ND/ND ND/ND ND/ND ND/8.2 8.1/8.2 ND/8.1 N/A Tetrabutyltin ND N/A ND/ND ND/ND ND/ND ND/ND ND/ND ND/ND ND/ND ND/ND ND/ND ND/ND N/A
Pesticides (µg/kg) (µg/kg) (µg/l) (µg/l) (µg/l) (µg/l) (µg/l) (µg/l) (µg/l) (µg/l) (µg/l) (µg/l) (µg/l) Aldrin ND 1400 ND/ND ND/ND ND/ND ND/ND ND/ND ND/ND ND/ND ND/ND ND/ND ND/ND 140 alpha-BHC ND N/A ND/ND ND/0.06 ND/ND ND/ND ND/ND ND/ND ND/ND ND/ND ND/ND ND/ND N/A beta-BHC 5.3 N/A ND/ND ND/ND ND/ND ND/ND ND/ND ND/ND ND/ND ND/ND ND/0.054 ND/ND N/A delta-BHC ND N/A ND/ND ND/ND ND/ND ND/ND ND/ND ND/ND ND/ND ND/ND ND/ND ND/ND N/A gamma-BHC ND N/A ND/ND ND/ND ND/ND ND/ND ND/ND ND/ND ND/ND ND/ND ND/ND ND/ND N/A alpha-Chlordane 4.1 N/A ND/ND ND/ND ND/ND ND/ND ND/ND ND/ND ND/ND ND/ND ND/ND ND/ND N/A gamma-Chlordane 2.3 N/A ND/ND ND/ND ND/ND ND/ND ND/ND ND/ND ND/ND ND/ND ND/ND ND/ND N/A

6-8
Identification / Analyte
Raw Sample
(Wet Weight)
TTLC (Wet
Weight)
Raw Sample SPLP/ WET
8% Cement SPLP/ WET
6% Cement SPLP/ WET
4% Cement SPLP/ WET
6% Cement + 6%
Fluid-Bed Fly Ash
SPLP/WET
4% Cement + 8%
Fluid-Bed Fly Ash
SPLP/WET
2% Cement + 10%
Fluid-Bed Fly Ash
SPLP/WET
6% Cement + 4% Type F
Fly Ash + 2% Fluid-
Bed Fly Ash SPLP/WET
4% Cement + 6% Type F
Fly Ash + 4% Fluid-
Bed Fly Ash SPLP/WET
2% Cement + 8% Type F Fly Ash + 6% Fluid-Bed Fly
Ash SPLP/WET
STLC
Technical Chlordane ND N/A ND/ND ND/ND ND/ND ND/ND ND/ND ND/ND ND/ND ND/ND ND/ND ND/ND N/A Total Chlordane 6.4 2500 ND/ND ND/ND ND/ND ND/ND ND/ND ND/ND ND/ND ND/ND ND/ND ND/ND 250 4,4’-DDD 5.7 1000 ND/ND ND/ND ND/ND ND/ND ND/ND ND/ND ND/ND ND/ND ND/ND ND/ND 100 2,4’-DDD ND 1000 ND/ND N/A/N/A3 N/A/N/A3 N/A/N/A3 N/A/N/A3 N/A/N/A3 N/A/N/A3 N/A/N/A3 N/A/N/A3 N/A/N/A3 100 4,4’-DDE 4.1 1000 ND/ND ND/ND ND/ND ND/ND ND/ND ND/ND ND/ND ND/ND ND/ND ND/ND 100 2,4’-DDE ND 1000 ND/ND N/A/N/A3 N/A/N/A3 N/A/N/A3 N/A/N/A3 N/A/N/A3 N/A/N/A3 N/A/N/A3 N/A/N/A3 N/A/N/A3 100 4,4’DDT ND 1000 ND/ND ND/ND ND/ND ND/ND ND/ND ND/ND ND/ND ND/ND ND/ND ND/ND 100 2,4’-DDT ND 1000 ND/ND N/A/N/A3 N/A/N/A3 N/A/N/A3 N/A/N/A3 N/A/N/A3 N/A/N/A3 N/A/N/A3 N/A/N/A3 N/A/N/A3 100 Dieldrin ND 8000 ND/ND ND/ND ND/ND ND/ND ND/ND ND/ND ND/ND ND/ND ND/ND ND/ND 800 Endosulfan I ND N/A ND/ND ND/ND ND/ND ND/ND ND/ND ND/ND ND/ND ND/ND ND/ND ND/ND N/A Endosulfan II ND N/A ND/ND ND/ND ND/ND ND/ND ND/ND ND/ND ND/ND ND/ND ND/ND ND/ND N/A Endosulfan Sulfate ND N/A ND/ND ND/ND ND/ND ND/ND ND/ND ND/ND ND/ND ND/ND ND/ND ND/ND N/A Endrin 3.9 200 ND/ND ND/ND ND/ND ND/ND ND/ND ND/ND ND/ND ND/ND ND/ND ND/ND 20 Endrin Aldehyde ND N/A ND/ND ND/ND ND/ND ND/ND ND/ND ND/ND ND/ND ND/ND ND/ND ND/ND N/A Endrin Ketone ND N/A ND/ND ND/ND ND/ND ND/ND ND/ND ND/ND ND/ND ND/ND ND/ND ND/ND N/A Heptachlor ND 4700 ND/ND ND/ND ND/ND ND/ND ND/ND ND/ND ND/ND ND/ND ND/ND ND/ND 47 Heptachlor Epoxide ND N/A ND/ND ND/ND ND/ND ND/ND ND/ND ND/ND ND/ND ND/ND ND/ND ND/ND N/A Methoxychlor ND 100000 ND/ND ND/ND ND/ND ND/ND ND/ND ND/ND ND/ND ND/ND ND/ND ND/ND 10000 Toxaphene ND 5000 ND/ND ND/ND ND/ND ND/ND ND/ND ND/ND ND/ND ND/ND ND/ND ND/ND 500
PCBs (µg/kg) (µg/kg) (µg/l) (µg/l) (µg/l) (µg/l) (µg/l) (µg/l) (µg/l) (µg/l) (µg/l) (µg/l) (µg/l) Arochlor-1016 ND N/A ND/ND ND/ND ND/ND ND/ND ND/ND ND/ND ND/ND ND/ND ND/ND ND/ND N/A Arochlor-1221 ND N/A ND/ND ND/ND ND/ND ND/ND ND/ND ND/ND ND/ND ND/ND ND/ND ND/ND N/A Arochlor-1232 ND N/A ND/ND ND/ND ND/ND ND/ND ND/ND ND/ND ND/ND ND/ND ND/ND ND/ND N/A Arochlor-1242 ND N/A ND/ND ND/ND ND/ND ND/ND ND/ND ND/ND ND/ND ND/ND ND/ND ND/ND N/A Arochlor-1248 ND N/A ND/ND ND/ND ND/ND ND/ND ND/ND ND/ND ND/ND ND/ND ND/ND ND/ND N/A Arochlor-1254 27 N/A ND/ND ND/ND ND/ND ND/ND ND/ND ND/ND ND/ND ND/ND ND/ND ND/ND N/A Arochlor-1260 ND N/A ND/ND ND/ND ND/ND ND/ND ND/ND ND/ND ND/ND ND/ND ND/ND ND/ND N/A Total PCBs 27 50000 ND/ND ND/ND ND/ND ND/ND ND/ND ND/ND ND/ND ND/ND ND/ND ND/ND N/A
PAHs (µg/kg) (µg/kg) (µg/l) (µg/l) (µg/l) (µg/l) (µg/l) (µg/l) (µg/l) (µg/l) (µg/l) (µg/l) (µg/l) Naphthalene ND N/A ND/ND ND/ND ND/ND ND/ND ND/ND ND/ND ND/ND ND/ND ND/ND ND/ND N/A 2-Methylnaphthalene ND N/A ND/ND ND/ND ND/ND ND/ND ND/ND ND/ND ND/ND ND/ND ND/ND ND/ND N/A Acenaphthylene ND N/A ND/ND ND/ND ND/ND ND/ND ND/ND ND/ND ND/ND ND/ND ND/ND ND/ND N/A Acenaphthene ND N/A ND/ND ND/ND ND/ND ND/ND ND/ND ND/ND ND/ND ND/ND ND/ND ND/ND N/A Fluorene ND N/A ND/ND ND/ND ND/ND ND/ND ND/ND ND/ND ND/ND ND/ND ND/ND ND/ND N/A Phenanthrene 100 N/A ND/ND ND/ND ND/ND ND/ND ND/ND ND/ND ND/ND ND/ND ND/ND ND/ND N/A Anthracene ND N/A ND/ND ND/ND ND/ND ND/ND ND/ND ND/ND ND/ND ND/ND ND/ND ND/ND N/A Flouranthene 170 N/A ND/ND ND/ND ND/ND ND/ND ND/ND ND/ND ND/ND ND/ND ND/ND ND/ND N/A Pyrene 210 N/A ND/ND ND/ND ND/ND ND/ND ND/ND ND/ND ND/ND ND/ND ND/ND ND/ND N/A Benzo(a)anthracene 66 N/A ND/ND ND/ND ND/ND ND/ND ND/ND ND/ND ND/ND ND/ND ND/ND ND/ND N/A Chrysene 87 N/A ND/ND ND/ND ND/ND ND/ND ND/ND ND/ND ND/ND ND/ND ND/ND ND/ND N/A Benzo(b)fluoranthene 66 N/A ND/ND ND/ND ND/ND ND/ND ND/ND ND/ND ND/ND ND/ND ND/ND ND/ND N/A
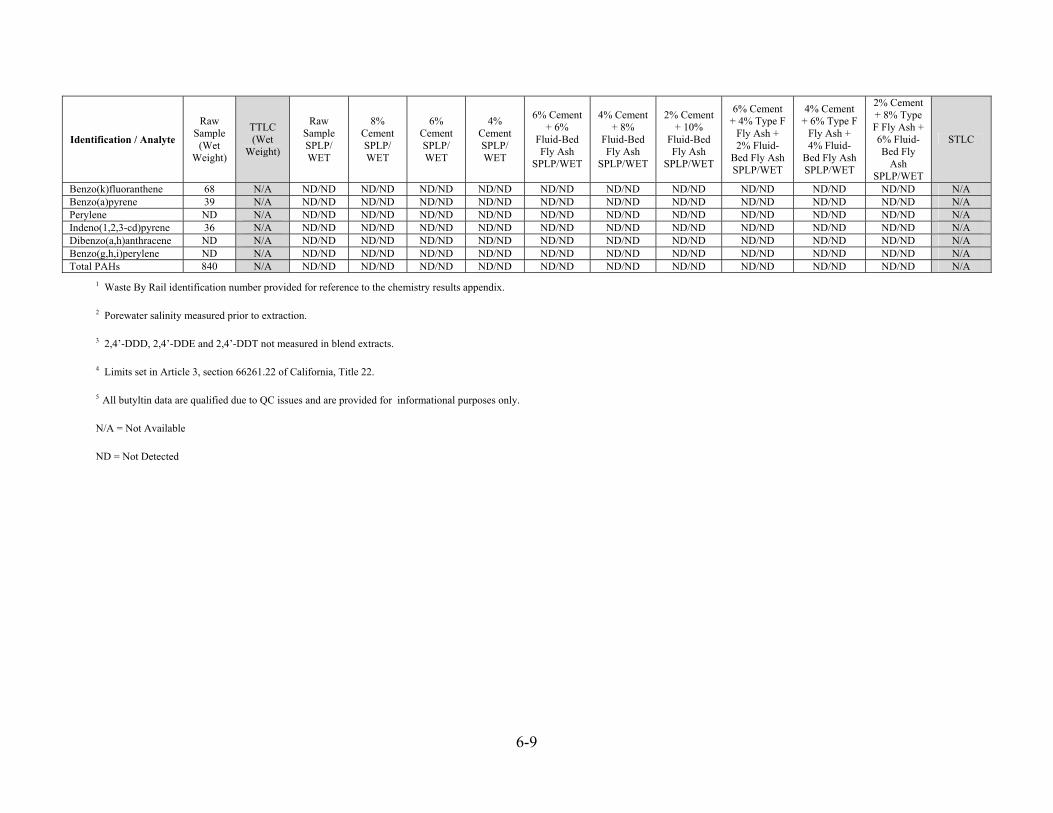
6-9
Identification / Analyte
Raw Sample
(Wet Weight)
TTLC (Wet
Weight)
Raw Sample SPLP/ WET
8% Cement SPLP/ WET
6% Cement SPLP/ WET
4% Cement SPLP/ WET
6% Cement + 6%
Fluid-Bed Fly Ash
SPLP/WET
4% Cement + 8%
Fluid-Bed Fly Ash
SPLP/WET
2% Cement + 10%
Fluid-Bed Fly Ash
SPLP/WET
6% Cement + 4% Type F
Fly Ash + 2% Fluid-
Bed Fly Ash SPLP/WET
4% Cement + 6% Type F
Fly Ash + 4% Fluid-
Bed Fly Ash SPLP/WET
2% Cement + 8% Type F Fly Ash + 6% Fluid-Bed Fly
Ash SPLP/WET
STLC
Benzo(k)fluoranthene 68 N/A ND/ND ND/ND ND/ND ND/ND ND/ND ND/ND ND/ND ND/ND ND/ND ND/ND N/A Benzo(a)pyrene 39 N/A ND/ND ND/ND ND/ND ND/ND ND/ND ND/ND ND/ND ND/ND ND/ND ND/ND N/A Perylene ND N/A ND/ND ND/ND ND/ND ND/ND ND/ND ND/ND ND/ND ND/ND ND/ND ND/ND N/A Indeno(1,2,3-cd)pyrene 36 N/A ND/ND ND/ND ND/ND ND/ND ND/ND ND/ND ND/ND ND/ND ND/ND ND/ND N/A Dibenzo(a,h)anthracene ND N/A ND/ND ND/ND ND/ND ND/ND ND/ND ND/ND ND/ND ND/ND ND/ND ND/ND N/A Benzo(g,h,i)perylene ND N/A ND/ND ND/ND ND/ND ND/ND ND/ND ND/ND ND/ND ND/ND ND/ND ND/ND N/A Total PAHs 840 N/A ND/ND ND/ND ND/ND ND/ND ND/ND ND/ND ND/ND ND/ND ND/ND ND/ND N/A
1 Waste By Rail identification number provided for reference to the chemistry results appendix.
2 Porewater salinity measured prior to extraction.
3 2,4’-DDD, 2,4’-DDE and 2,4’-DDT not measured in blend extracts.
4 Limits set in Article 3, section 66261.22 of California, Title 22.
5 All butyltin data are qualified due to QC issues and are provided for informational purposes only.
N/A = Not Available
ND = Not Detected

6-10
Table 6-4 SPLP And WET Chemistry Results For The Marina Del Rey Raw Source Material And Associated Blends With Available TTLC And STLC Values For
Comparison.
Identification / Analyte
Raw Sample
(Wet Weight)
TTLC Raw Sample SPLP/WET
6% Cement SPLP/WET
4% Cement + 8% Fluid
Bed Fly Ash SPLP/WET
4% Cement + 6% Type F
Fly Ash + 4% Fluid
Bed Fly Ash SPLP/WET
STLC
WBR ID Number1 N/A - N/A 29 30 31 -
Grain Size (%)
Sand 97.5 N/A N/A N/A N/A N/A N/A Silt 1.5 N/A N/A N/A N/A N/A N/A Clay 1.2 N/A N/A N/A N/A N/A N/A Percent Solids 78 N/A N/A N/A N/A N/A N/A Porewater Salinity (ppt) 33.3 N/A N/A 9.02 7.02 7.02 N/A
TOC (mg/l) 0.21% N/A 2.3/2.3 9.9/15 6.8/11 5.5/9.7 N/A pH 7.8 N/A 8.1/7.6 11/12 11/11 11/11 <2, >12.54 Total Sulfides (mg/kg) 90 N/A ND/ND ND/ND ND/ND ND/ND N/A
TRPH (mg/kg) 350 N/A ND/ND ND/ND ND/ND ND/ND N/A Metals (mg/kg) (mg/kg) (µg/l) (µg/l) (µg/l) (µg/l) (µg/l)
Arsenic 2.1 500 2.8/3.5 ND/ND ND/ND ND/ND 5000 Cadmium ND 100 ND/ND ND/ND ND/ND ND/ND 1000 Chromium 9.4 2500 ND/ND ND/ND ND/ND ND/ND 5000 Copper 6.6 2500 ND/ND ND/ND ND/ND ND/ND 25000 Lead 31 1000 ND/ND ND/ND ND/ND ND/ND 5000 Mercury 0.022 20 ND/ND ND/ND ND/ND ND/ND 200 Nickel 7.3 2000 ND/ND ND/ND ND/ND ND/ND 20000 Silver ND 500 ND/ND ND/ND ND/ND ND/ND 5000 Zinc 35 5000 ND/ND ND/ND ND/ND ND/ND 250000
Butyltins5 (µg/kg) (µg/kg) (ng/l) (ng/l) (ng/l) (ng/l) (ng/l) Monobutyltin 1.5 N/A ND/ND ND/ND ND/ND ND/ND N/A Dibutyltin ND N/A ND/ND ND/ND ND/ND ND/ND N/A Tributyltin ND N/A ND/ND ND/ND ND/ND ND/10 N/A Tetrabutyltin ND N/A ND/ND ND/ND ND/ND ND/ND N/A
Pesticides (µg/kg) (µg/kg) (µg/l) (µg/l) (µg/l) (µg/l) (µg/l) Aldrin ND 1400 ND/ND ND/ND ND/ND ND/ND 140 alpha-BHC ND N/A ND/ND ND/ND ND/ND ND/ND N/A beta-BHC ND N/A ND/ND ND/ND ND/ND ND/ND N/A delta-BHC ND N/A ND/ND ND/ND ND/ND ND/ND N/A gamma-BHC ND N/A ND/ND ND/ND ND/ND ND/ND N/A alpha-Chlordane 3.0 N/A ND/ND ND/ND ND/ND ND/ND N/A
gamma-Chlordane 2.1 N/A ND/ND ND/ND ND/ND ND/ND N/A
Technical Chlordane ND N/A ND/ND ND/ND ND/ND ND/ND N/A
Total Chlordane 5.1 2500 ND/ND ND/ND ND/ND ND/ND 250
4,4’-DDD 3.2 1000 ND/ND ND/ND ND/ND ND/ND 100 2,4’-DDD ND 1000 ND/ND N/A/N/A3 N/A/N/A3 N/A/N/A3 100 4,4’-DDE 1.9 1000 ND/ND ND/ND ND/ND ND/ND 100 2,4’-DDE ND 1000 ND/ND N/A/N/A3 N/A/N/A3 N/A/N/A3 100 4,4’DDT ND 1000 ND/ND ND/ND ND/ND ND/ND 100 2,4’-DDT ND 1000 ND/ND N/A/N/A3 N/A/N/A3 N/A/N/A3 100 Dieldrin ND 8000 ND/ND ND/ND ND/ND ND/ND 800 Endosulfan I ND N/A ND/ND ND/ND ND/ND ND/ND N/A Endosulfan II ND N/A ND/ND ND/ND ND/ND ND/ND N/A Endosulfan Sulfate ND N/A ND/ND ND/ND ND/ND ND/ND N/A

6-11
Identification / Analyte
Raw Sample
(Wet Weight)
TTLC Raw Sample SPLP/WET
6% Cement SPLP/WET
4% Cement + 8% Fluid
Bed Fly Ash SPLP/WET
4% Cement + 6% Type F
Fly Ash + 4% Fluid
Bed Fly Ash SPLP/WET
STLC
Endrin ND 200 ND/ND ND/ND ND/ND ND/ND 20 Endrin Aldehyde ND N/A ND/ND ND/ND ND/ND ND/ND N/A
Endrin Ketone ND N/A ND/ND ND/ND ND/ND ND/ND N/A Heptachlor ND 4700 ND/ND ND/ND ND/ND ND/ND 47 Heptachlor Epoxide ND N/A ND/ND ND/ND ND/ND ND/ND N/A
Methoxychlor ND 100000 ND/ND ND/ND ND/ND ND/ND 10000 Toxaphene ND 5000 ND/ND ND/ND ND/ND ND/ND 500
PCBs (µg/kg) (µg/kg) (µg/l) (µg/l) (µg/l) (µg/l) (µg/l) Arochlor-1016 ND N/A ND/ND ND/ND ND/ND ND/ND N/A Arochlor-1221 ND N/A ND/ND ND/ND ND/ND ND/ND N/A Arochlor-1232 ND N/A ND/ND ND/ND ND/ND ND/ND N/A Arochlor-1242 ND N/A ND/ND ND/ND ND/ND ND/ND N/A Arochlor-1248 ND N/A ND/ND ND/ND ND/ND ND/ND N/A Arochlor-1254 14 N/A ND/ND ND/ND ND/ND ND/ND N/A Arochlor-1260 ND N/A ND/ND ND/ND ND/ND ND/ND N/A Total PCBs 14 50000 ND/ND ND/ND ND/ND ND/ND 5000 WBR ID Number1 N/A - N/A 29 30 31 -
PAHs (µg/kg) (µg/kg) (µg/l) (µg/l) (µg/l) (µg/l) (µg/l) Naphthalene ND N/A ND/ND ND/ND ND/ND ND/ND N/A 2-Methylnaphthalene
ND N/A
ND/ND ND/ND ND/ND ND/ND N/A
Acenaphthylene ND N/A ND/ND ND/ND ND/ND ND/ND N/A
Acenaphthene ND N/A ND/ND ND/ND ND/ND ND/ND N/A Fluorene ND N/A ND/ND ND/ND ND/ND ND/ND N/A Phenanthrene 21 N/A ND/ND ND/ND ND/ND ND/ND N/A Anthracene ND N/A ND/ND ND/ND ND/ND ND/ND N/A Flouranthene 58 N/A ND/ND ND/ND ND/ND ND/ND N/A Pyrene 77 N/A ND/ND ND/ND ND/ND ND/ND N/A Benzo(a)anthracene 32 N/A ND/ND ND/ND ND/ND ND/ND N/A
Chrysene 33 N/A ND/ND ND/ND ND/ND ND/ND N/A Benzo(b)fluoranthene 44 N/A ND/ND ND/ND ND/ND ND/ND N/A
Benzo(k)fluoranthene 29 N/A ND/ND ND/ND ND/ND ND/ND N/A
Benzo(a)pyrene ND N/A ND/ND ND/ND ND/ND ND/ND N/A
Perylene ND N/A ND/ND ND/ND ND/ND ND/ND N/A Indeno(1,2,3-cd)pyrene ND N/A ND/ND ND/ND ND/ND ND/ND N/A
Dibenzo(a,h) anthracene ND N/A ND/ND ND/ND ND/ND ND/ND N/A
Benzo(g,h,i) perylene ND N/A ND/ND ND/ND ND/ND ND/ND N/A
Total PAHs 290 N/A ND/ND ND/ND ND/ND ND/ND N/A 1 Waste By Rail identification number provided for reference to the chemistry results appendix. 2 Porewater salinity measured prior to extraction. 3 2,4’-DDD, 2,4’-DDE and 2,4’-DDT not measured in blend extracts. 4 Limits set in Article 3, section 66261.22 of California, Title 22. 5 All butyltin data are qualified due to QC issues and are provided for informational purposes only.
N/A = Not Available
ND = Not Detected

6-12
Table 6-5 SPLP and WET chemistry results for the POLB Channel 2 raw source material and associated blends with available TTLC and STLC values for comparison.
Identification / Analyte
Raw Sample
(Wet Weight)
TTLC
Raw Sample SPLP/ WET
6% Cement SPLP/ WET
4% Cement + 8% Fluid
Bed Fly Ash
SPLP/WET
4% Cement + 6% Type F Fly Ash +
4% Fluid Bed Fly
Ash SPLP/WET
2% Cement SPLP/ WET
STLC
WBR ID Number1 N/A - N/A 20 21 22 56 - Grain Size (%)
Sand 40.2 N/A N/A N/A N/A N/A N/A N/A Silt 35.1 N/A N/A N/A N/A N/A N/A N/A Clay 24.7 N/A N/A N/A N/A N/A N/A N/A Percent Solids 60 N/A N/A N/A N/A N/A N/A N/A Porewater Salinity (ppt) 33.2 N/A N/A 26.42 28.42 24.42 21.82 N/A TOC (mg/l) 1.26% N/A 8.6/8.3 10/17 9.5/16 9.0/15 15/26 N/A pH 8.1 N/A 7.4/8.2 11/11 9.9/9.8 10/10 7.0/2.5 <2, >12.54 Total Sulfides (mg/kg) 89 N/A ND/ND ND/ND ND/ND ND/ND ND/ND N/A TRPH (mg/kg) 460 N/A ND/ND ND/ND ND/ND ND/ND ND/ND N/A
Metals (mg/kg) (mg/kg) (µg/l) (µg/l) (µg/l) (µg/l) (µg/l) (µg/l) Arsenic 8.5 500 12/25 ND/ND ND/ND ND/ND 15/12 5000 Cadmium 0.13 100 ND/ND ND/ND ND/ND ND/ND ND/0.33 1000 Chromium 29 2500 ND/ND ND/ND ND/ND ND/ND 0.74/1.8 5000 Copper 39 2500 ND/ND ND/ND ND/ND ND/ND 64/75 25000 Lead 48 1000 ND/ND ND/ND ND/ND ND/ND ND/ND 5000 Mercury 0.36 20 ND/ND ND/ND ND/ND ND/ND ND/ND 200 Nickel 12 2000 ND/ND ND/ND ND/ND ND/ND 2.0/6.8 20000 Silver 0.11 500 ND/ND ND/ND ND/ND ND/ND ND/0.55 5000 Zinc 89 5000 ND/ND ND/ND ND/ND ND/ND ND/ND 250000
Butyltins5 (µg/kg) (µg/kg) (ng/l) (ng/l) (ng/l) (ng/l) (ng/l) (ng/l) Monobutyltin 4.1 N/A ND/ND ND/ND ND/ND ND/ND ND/ND N/A Dibutyltin 7.1 N/A 6.3/5.9 12/14 8.0/9.6 ND/ND 2.1/3.7 N/A Tributyltin ND N/A 20/27 200/210 310/220 40/69 8.5/26 N/A Tetrabutyltin ND N/A ND/ND ND/ND ND/ND ND/ND ND/ND N/A
Pesticides (µg/kg) (µg/kg) (µg/l) (µg/l) (µg/l) (µg/l) (µg/l) (µg/l) Aldrin ND 1400 ND/ND ND/ND ND/ND ND/ND ND/ND 140 alpha-BHC ND N/A ND/ND ND/ND ND/ND ND/ND ND/ND N/A
beta-BHC 5.6 N/A ND/ND ND/ND ND/ND ND/ND ND/0.087 N/A
delta-BHC ND N/A ND/ND ND/ND ND/ND ND/ND ND/ND N/A gamma-BHC ND N/A ND/ND ND/ND ND/ND ND/ND ND/ND N/A alpha-Chlordane ND N/A ND/ND ND/ND ND/ND ND/ND ND/ND N/A gamma-Chlordane 1.4 N/A ND/ND ND/ND ND/ND ND/ND ND/ND N/A Technical Chlordane ND N/A ND/ND ND/ND ND/ND ND/ND ND/ND N/A Total Chlordane 1.4 2500 ND/ND ND/ND ND/ND ND/ND ND/ND 250 4,4’-DDD 12 1000 ND/ND ND/ND ND/ND ND/ND ND/ND 100
2,4’-DDD ND 1000 ND/ND N/A/N/A3 N/A/N/A3 N/A/N/A3 N/A/N/A3 100
4,4’-DDE 24 1000 ND/ND ND/ND ND/ND ND/ND ND/ND 100
2,4’-DDE ND 1000 ND/ND N/A/N/A3 N/A/N/A3 N/A/N/A3 N/A/N/A3 100
4,4’DDT ND 1000 ND/ND ND/ND ND/ND ND/ND ND/ND 100
2,4’-DDT ND 1000 ND/ND N/A/N/A3 N/A/N/A3 N/A/N/A3 N/A/N/A3 100
Dieldrin ND 8000 ND/ND ND/ND ND/ND ND/ND ND/ND 800 Endosulfan I ND N/A ND/ND ND/ND ND/ND ND/ND ND/ND N/A Endosulfan II ND N/A ND/ND ND/ND ND/ND ND/ND ND/ND N/A Endosulfan Sulfate ND N/A ND/ND ND/ND ND/ND ND/ND ND/ND N/A Endrin ND 200 ND/ND ND/ND ND/ND ND/ND ND/ND 20 Endrin Aldehyde ND N/A ND/ND ND/ND ND/ND ND/ND ND/ND N/A Endrin Ketone ND N/A ND/ND ND/ND ND/ND ND/ND ND/ND N/A Heptachlor ND 4700 ND/ND ND/ND ND/ND ND/ND ND/ND 47 Heptachlor Epoxide ND N/A ND/ND ND/ND ND/ND ND/ND ND/ND N/A Methoxychlor ND 100000 ND/ND ND/ND ND/ND ND/ND ND/ND 10000

6-13
Identification / Analyte
Raw Sample
(Wet Weight)
TTLC
Raw Sample SPLP/ WET
6% Cement SPLP/ WET
4% Cement + 8% Fluid
Bed Fly Ash
SPLP/WET
4% Cement + 6% Type F Fly Ash +
4% Fluid Bed Fly
Ash SPLP/WET
2% Cement SPLP/ WET
STLC
Toxaphene ND 5000 ND/ND ND/ND ND/ND ND/ND ND/ND 500 PCBs (µg/kg) (µg/kg) (µg/l) (µg/l) (µg/l) (µg/l) (µg/l) (µg/l)
Arochlor-1016 ND N/A ND/ND ND/ND ND/ND ND/ND ND/ND N/A Arochlor-1221 ND N/A ND/ND ND/ND ND/ND ND/ND ND/ND N/A Arochlor-1232 ND N/A ND/ND ND/ND ND/ND ND/ND ND/ND N/A Arochlor-1242 ND N/A ND/ND ND/ND ND/ND ND/ND ND/ND N/A Arochlor-1248 ND N/A ND/ND ND/ND ND/ND ND/ND ND/ND N/A Arochlor-1254 43 N/A ND/ND ND/ND ND/ND ND/ND ND/ND N/A Arochlor-1260 ND N/A ND/ND ND/ND ND/ND ND/ND ND/ND N/A Total PCBs 43 50000 ND/ND ND/ND ND/ND ND/ND ND/ND 5000 WBR ID Number1 N/A - N/A 20 21 22 56 -
PAHs (µg/kg) (µg/kg) (µg/l) (µg/l) (µg/l) (µg/l) (µg/l) (µg/l) Naphthalene ND N/A ND/ND ND/ND ND/ND ND/ND ND/ND N/A 2-Methylnaphthalene ND N/A ND/ND ND/ND ND/ND ND/ND ND/ND N/A Acenaphthylene 37 N/A ND/ND ND/ND ND/ND ND/ND ND/ND N/A Acenaphthene 22 N/A ND/ND ND/ND ND/ND ND/ND ND/ND N/A Fluorene 54 N/A ND/ND ND/ND ND/ND ND/ND ND/ND N/A Phenanthrene 350 N/A ND/ND ND/ND ND/ND ND/ND ND/ND N/A Anthracene 150 N/A ND/ND ND/ND ND/ND ND/ND ND/ND N/A Flouranthene 590 N/A ND/ND ND/ND ND/ND ND/ND ND/ND N/A Pyrene 990 N/A ND/ND ND/ND ND/ND ND/ND ND/ND N/A Benzo(a)anthracene 280 N/A ND/ND ND/ND ND/ND ND/ND ND/ND N/A Chrysene 410 N/A ND/ND ND/ND ND/ND ND/ND ND/ND N/A Benzo(b)fluoranthene 520 N/A ND/ND ND/ND ND/ND ND/ND ND/ND N/A Benzo(k)fluoranthene 520 N/A ND/ND ND/ND ND/ND ND/ND ND/ND N/A Benzo(a)pyrene 230 N/A ND/ND ND/ND ND/ND ND/ND ND/ND N/A Perylene ND N/A ND/ND ND/ND ND/ND ND/ND ND/ND N/A Indeno(1,2,3-cd)pyrene 210 N/A ND/ND ND/ND ND/ND ND/ND ND/ND N/A Dibenzo(a,h)anthracene 90 N/A ND/ND ND/ND ND/ND ND/ND ND/ND N/A Benzo(g,h,i)perylene ND N/A ND/ND ND/ND ND/ND ND/ND ND/ND N/A Total PAHs 4500 N/A ND/ND ND/ND ND/ND ND/ND ND/ND N/A
1 Waste By Rail identification number provided for reference to the chemistry results appendix. 2 Porewater salinity measured prior to extraction. 3 2,4’-DDD, 2,4’-DDE and 2,4’-DDT not measured in blend extracts. 4 Limits set in Article 3, section 66261.22 of California, Title 22. 5 All butyltin data are qualified due to QC issues and are provided for informational purposes only. N/A = Not Available ND = Not Detected

6-14
Table 6-6 SPLP And WET Chemistry Results For The POLA Consolidated Slip Raw Source Material And Associated Blends With Available TTLC And STLC
Values For Comparison
Identification / Analyte Raw Sample (Wet Weight) TTLC Raw Sample
SPLP/WET 6% Cement SPLP/WET
4% Cement + 8% Fluid Bed
Fly Ash SPLP/WET
4% Cement + 6% Type F
Fly Ash + 4% Fluid Bed Fly
Ash SPLP/WET
2% Cement SPLP/WET
2% Cement + 4% Type F
Fly Ash SPLP/WET
STLC
WBR ID Number1 N/A - N/A 23 24 25 54 55 - Grain Size (%)
Sand 28.3 N/A N/A N/A N/A N/A N/A N/A N/A Silt 23.7 N/A N/A N/A N/A N/A N/A N/A N/A Clay 48.0 N/A N/A N/A N/A N/A N/A N/A N/A Percent Solids 40 N/A N/A N/A N/A N/A N/A N/A N/A Porewater Salinity (ppt) 32.4 N/A N/A 63.22 38.02 32.22 47.62 43.22 N/A TOC (mg/l) 8.67% N/A 18/12 14/21 13/31 14/23 33/53 28/47 N/A pH 8.0 N/A 8.0/8.1 10/10 9.8/9.7 10/3.5 6.9/6.6 7.0/2.6 <2, >12.54 Total Sulfides (mg/kg) 930 N/A ND/ND ND/ND ND/ND ND/ND ND/ND ND/ND N/A TRPH (mg/kg) 17000 N/A ND/ND ND/ND ND/ND ND/ND ND/ND ND/ND N/A
Metals (mg/kg) (mg/kg) (µg/l) (µg/l) (µg/l) (µg/l) (µg/l) (µg/l) (µg/l) Arsenic 9.0 500 33/79 ND/ND ND/ND ND/ND 18/13 16/13 5000 Cadmium 1.9 100 ND/ND ND/ND ND/ND ND/ND 0.53/0.89 0.46/0.88 1000 Chromium 220 2500 ND/ND ND/ND ND/ND ND/ND 2.6/4.8 3.6/6.0 5000 Copper 330 2500 ND/ND ND/ND ND/ND ND/1.0 130/180 100/160 25000 Lead 160 1000 ND/ND ND/ND ND/ND ND/ND 1.8/1.8 2.2/2.0 5000 Mercury 1.9 20 ND/ND ND/ND ND/ND ND/ND ND/ND ND/ND 200 Nickel 28 2000 ND/ND ND/ND ND/ND ND/ND 5.8/13 6.0/13 20000 Silver 3.6 500 ND/ND ND/ND ND/ND ND/ND 6.0/26 2.6/21 5000 Zinc 290 5000 ND/ND ND/ND ND/ND ND/ND ND/ND ND/ND 250000
Butyltins5 (µg/kg) (µg/kg) (ng/l) (ng/l) (ng/l) (ng/l) (ng/l) (ng/l) (ng/l) Monobutyltin ND N/A ND/ND ND/ND ND/ND ND/ND ND/ND ND/ND N/A Dibutyltin 5.6 N/A 37/ND ND/ND ND/ND ND/ND ND/ND 2.2/ND N/A Tributyltin ND N/A 11/ND 8.4/ND ND/ND ND/ND 5.6/4.9 6.6/6.4 N/A Tetrabutyltin ND N/A ND/ND ND/ND ND/ND ND/ND ND/ND ND/ND N/A
Pesticides (µg/kg) (µg/kg) (µg/l) (µg/l) (µg/l) (µg/l) (µg/l) (µg/l) (µg/l) Aldrin 9.1 1400 ND/ND ND/ND ND/ND ND/ND ND/ND ND/ND 140 alpha-BHC ND N/A ND/ND ND/ND ND/ND ND/ND 0.26/0.35 0.15/0.19 N/A beta-BHC ND N/A ND/ND ND/ND ND/ND ND/ND ND/ND ND/ND N/A delta-BHC ND N/A ND/ND ND/ND ND/ND ND/ND ND/ND ND/ND N/A gamma-BHC ND N/A ND/ND ND/0.19 ND/0.077 0.15/ND ND/ND ND/ND N/A alpha-Chlordane 1.1 N/A ND/ND ND/ND ND/ND ND/ND ND/ND ND/ND N/A gamma-Chlordane ND N/A ND/ND ND/ND ND/ND ND/ND ND/ND ND/ND N/A

6-15
Identification / Analyte Raw Sample (Wet Weight) TTLC Raw Sample
SPLP/WET 6% Cement SPLP/WET
4% Cement + 8% Fluid Bed
Fly Ash SPLP/WET
4% Cement + 6% Type F
Fly Ash + 4% Fluid Bed Fly
Ash SPLP/WET
2% Cement SPLP/WET
2% Cement + 4% Type F
Fly Ash SPLP/WET
STLC
Technical Chlordane ND N/A ND/ND ND/ND ND/ND ND/ND ND/ND ND/ND N/A Total Chlordane 1.1 2500 ND/ND ND/ND ND/ND ND/ND ND/ND ND/ND 250 4,4’-DDD 24 1000 ND/ND ND/0.12 ND/0.31 ND/ND ND/ND ND/ND 100 2,4’-DDD ND 1000 ND/ND N/A/N/A3 N/A/N/A3 N/A/N/A3 N/A/N/A3 N/A/N/A3 100 4,4’-DDE 18 1000 ND/ND ND/0.25 ND/0.42 ND/0.29 0.27/0.38 0.29/0.35 100 2,4’-DDE ND 1000 ND/ND N/A/N/A3 N/A/N/A3 N/A/N/A3 N/A/N/A3 N/A/N/A3 100 4,4’DDT ND 1000 ND/ND ND/ND ND/ND ND/ND ND/ND ND/ND 100 2,4’-DDT ND 1000 ND/ND N/A/N/A3 N/A/N/A3 N/A/N/A3 N/A/N/A3 N/A/N/A3 100 Dieldrin 1.2 8000 ND/ND 0.093/ND ND/ND 0.063/0.089 ND/ND ND/ND 800 Endosulfan I ND N/A ND/ND ND/ND ND/ND ND/ND ND/ND ND/ND N/A Endosulfan II ND N/A ND/ND ND/ND ND/ND ND/ND ND/ND ND/ND N/A Endosulfan Sulfate ND N/A ND/ND ND/ND ND/0.093 ND/ND ND/ND ND/ND N/A Endrin ND 200 ND/ND ND/ND ND/0.31 ND/0.27 0.066/ND 0.079/0.098 20 Endrin Aldehyde ND N/A ND/ND ND/ND ND/ND ND/ND ND/ND ND/ND N/A Endrin Ketone ND N/A ND/ND ND/ND ND/ND ND/ND ND/ND ND/ND N/A Heptachlor ND 4700 ND/ND 0.22/ND ND/ND ND/ND ND/ND ND/ND 47 Heptachlor Epoxide ND N/A ND/ND ND/ND ND/ND ND/ND ND/ND ND/ND N/A Methoxychlor ND 100000 ND/ND ND/ND ND/ND ND/ND ND/ND ND/ND 10000 Toxaphene ND 5000 ND/ND ND/ND ND/ND ND/ND ND/ND ND/ND 500
PCBs (µg/kg) (µg/kg) (µg/l) (µg/l) (µg/l) (µg/l) (µg/l) (µg/l) (µg/l) Arochlor-1016 ND N/A ND/ND ND/ND ND/ND ND/ND ND/ND ND/ND N/A Arochlor-1221 ND N/A ND/ND ND/ND ND/ND ND/ND ND/ND ND/ND N/A Arochlor-1232 ND N/A ND/ND ND/ND ND/ND ND/ND ND/ND ND/ND N/A Arochlor-1242 ND N/A ND/ND ND/ND ND/ND ND/ND ND/ND ND/ND N/A Arochlor-1248 ND N/A ND/ND ND/ND ND/ND ND/ND ND/ND ND/ND N/A Arochlor-1254 77 N/A ND/ND ND/ND ND/ND ND/ND ND/ND ND/ND N/A Arochlor-1260 ND N/A ND/ND ND/ND ND/ND ND/ND ND/ND ND/ND N/A Total PCBs 77 50000 ND/ND ND/ND ND/ND ND/ND ND/ND ND/ND 5000
PAHs (µg/kg) (µg/kg) (µg/l) (µg/l) (µg/l) (µg/l) (µg/l) (µg/l) (µg/l) Naphthalene 3600 N/A 11/ND ND/ND ND/ND ND/ND ND/ND ND/ND N/A 2-Methylnaphthalene 26000 N/A 21/13 14/12 13/13 11/ND ND/ND ND/ND N/A Acenaphthylene 790 N/A ND/ND ND/ND ND/ND ND/ND ND/ND ND/ND N/A Acenaphthene 4600 N/A ND/ND ND/ND ND/ND ND/ND ND/ND ND/ND N/A Fluorene 7600 N/A ND/ND ND/ND ND/ND ND/ND ND/ND ND/ND N/A Phenanthrene 38000 N/A ND/ND ND/10 ND/10 ND/ND ND/ND ND/ND N/A Anthracene 6400 N/A ND/ND ND/ND ND/ND ND/ND ND/ND ND/ND N/A Flouranthene 2200 N/A ND/ND ND/ND ND/ND ND/ND ND/ND ND/ND N/A Pyrene 9300 N/A ND/ND ND/ND ND/ND ND/ND ND/ND ND/ND N/A Benzo(a)anthracene 1500 N/A ND/ND ND/ND ND/ND ND/ND ND/ND ND/ND N/A Chrysene 2200 N/A ND/ND ND/ND ND/ND ND/ND ND/ND ND/ND N/A Benzo(b)fluoranthene 640 N/A ND/ND ND/ND ND/ND ND/ND ND/ND ND/ND N/A Benzo(k)fluoranthene ND N/A ND/ND ND/ND ND/ND ND/ND ND/ND ND/ND N/A

6-16
Identification / Analyte Raw Sample (Wet Weight) TTLC Raw Sample
SPLP/WET 6% Cement SPLP/WET
4% Cement + 8% Fluid Bed
Fly Ash SPLP/WET
4% Cement + 6% Type F
Fly Ash + 4% Fluid Bed Fly
Ash SPLP/WET
2% Cement SPLP/WET
2% Cement + 4% Type F
Fly Ash SPLP/WET
STLC
Benzo(a)pyrene 510 N/A ND/ND ND/ND ND/ND ND/ND ND/ND ND/ND N/A Perylene ND N/A ND/ND ND/ND ND/ND ND/ND ND/ND ND/ND N/A Indeno(1,2,3-cd)pyrene ND N/A ND/ND ND/ND ND/ND ND/ND ND/ND ND/ND N/A Dibenzo(a,h)anthracene 130 N/A ND/ND ND/ND ND/ND ND/ND ND/ND ND/ND N/A Benzo(g,h,i)perylene ND N/A ND/ND ND/ND ND/ND ND/ND ND/ND ND/ND N/A Total PAHs 100000 N/A 32/13 14/22 13/23 11/ND ND/ND ND/ND N/A
1 Waste By Rail identification number provided for reference to the chemistry results appendix. 2 Porewater salinity measured prior to extraction. 3 2,4’-DDD, 2,4’-DDE and 2,4’-DDT not measured in blend extracts. 4 Limits set in Article 3, section 66261.22 of California, Title 22. 5 All butyltin data are qualified due to QC issues and are provided for informational purposes only. N/A = Not Available ND = Not Detected

6-17
6.5 SUMMARY OF CHEMICAL TESTING RESULTS
The LARE, MdR, POLB Channel 2 and POLA Consolidated Slip raw sediment samples all exceeded ER-M values in at least one category, indicating elevated contaminant levels. POLA Consolidated Slip exceeded the most ER-M values at 23.
None of the raw sediment samples exceeded TTLC values. Similarly none of the extracts exceeded STLC values, either before or after stabilization. The results indicate that none of the samples (raw or treated) would be considered hazardous waste under California Title 22 criteria.
All metals analyzed were measured in the four raw sediment samples, with the exception of silver in the LARE and Marina del Rey samples, and cadmium in the Marina del Rey sample. Values ranged from 0.022 mg/kg for mercury in the Marina del Rey sample, to 330 mg/kg for copper in the POLA Consolidated Slip sample (wet weight). The only metal to persist through the SPLP and WET extractions of the raw sediment samples was arsenic, at values of 2.8 µg/l for Marina del Rey SPLP to 79µg/l for POLA Consolidated Slip WET. The only blend extracts with reported values above non-detect for metals were POLA Consolidated Slip 4% Cement + 6% Type F Fly Ash + 4% Fluid Bed Fly Ash (WBR-25) DI WET, POLB Channel II 2% Cement (WBR-56), POLA Consolidated Slip 2% Cement (WBR-54), and POLA Consolidated Slip 2% Cement + 4% Type F Fly Ash (WBR-55). Copper was detected at a level of 1.0 µg/l in WBR-25. Arsenic, cadmium, copper, nickel, and silver were detected in the extracts of the last three of these blends, and lead was detected in the extracts of WBR-54 and 55.The highest metal value reported in the blend extracts was 180 µg/l for copper in WBR-54 WET extract, which is well below the STLC limit of 25000 µg/l.
The differences in metal results between the WBR-54 through 56 blend extracts and the previous blend extracts (WBR-14 through 31) may be attributable to the holding time for the source material and the fact that source material was held in sealed buckets at ambient temperatures (i.e., not refrigerated). The initial batch of blends was prepared in August 2001, and the second batch was prepared in December 2001 (i.e., source material for the second batch was held four months longer than the source material used initially). The same lots of cement and fly ash were used to prepare both batches of blends, so it is unlikely that the differences in chemical results are attributable to differences in the additives. However, it is possible that the metals might have become more available over time in the original sediment sample. Additionally, the fact that samples were held at ambient temperatures may have resulted in changes in moisture content and other factors that might have influenced metal availability through the treatment and extraction process. Sample WBR-25 DI WET was analyzed for metals about five months later than the rest of the first batch of samples, which may have contributed to it being the only extraction of the first set of blends to have a reported value for a metal. QC data were not provided for this analysis.
Butyltin data for seven of the samples analyzed were qualified due to method blank issues (values reported were within 3x that reported for the method blank). Butyltin data were also qualified from forty-two of the samples due to low recovery issues (both surrogate recovery and laboratory spike recovery). Five of these samples were qualified for both method blank and low recovery issues (WBR-54 and 55 SPLP and WET extracts, and WBR-56 SPLP extract). As 85%
6-18
of the samples were affected by least one of the issues mentioned above, all butyltin data were qualified and no analysis of the data was performed.
Low levels of pesticides were present in some of the stabilization blend extracts for LARE and POLA Consolidated Slip. These pesticides were not present in the extracts from the raw sediment. It is not clear why pesticides were detected in extracts of the blends and not in the extracts of the raw source material. Some plausible explanations for higher concentrations in the blend extracts include: 1) an error in the chemistry analysis (though all measures of quality assurance and quality control indicate that analytical methods were in control with the exception of the butyltin analysis); 2) pesticides were contributed from another source such as the additives being used for the blends; 3) matrix interferences in the raw material were eliminated in the stabilization blends making it possible to detect the pesticides; and/or 4) a constituent in the blends caused the pesticides to be more extractable. In all cases, whether the pesticide was present in the raw sediment or not, the level of pesticides in the extracts were close to the limits of detection and well below STLC values. The highest level is 0.42 µg/l of 4,4’-DDE in the WET extract of the 4% cement + 8% fluid bed fly ash blend (WBR -24) of POLA Consolidated Slip, the STLC value for p,p’-DDE is 100 µg/l.
The PCB arochlor-1254 was present in all four raw sediment samples, however it was not detected in any of the WET or STLC extracts of the raw sediment or the stabilization blends.
PAHs were measured in all four raw sediment samples, however, they were only present in the extracts when the values exceeded 10,000 µg/kg wet weight in the raw sediment, with one exception (napthalene, reported at a level of 3600 µg/kg wet weight in the raw sediment of POLA Consolidated Slip, and a level of 11 µg/l in the raw sample SPLP extract). The only site that had values above 10,000 µg/kg-wet weight was POLA Consolidated Slip. 2-methylnaphthalene, which was reported at a level of 26000 µg/kg wet weight in raw sample, was present in all of the extracts with the exception of the 4% cement + 6% type F fly ash + 4% fluid bed fly ash (WBR-25) WET extract. Values ranged from 11 µg/l in the WBR-25 SPLP extract to 21 µg/l in the raw sample SPLP extract. Phenanthrene, which was reported at a level of 38000 µg/kg wet weight in the raw sediment sample, was present in two of the extracts at a reported level of 10 µg/l. Those extracts were the 6% cement (WBR-23) WET extract and the 4% cement + 8% fluid bed fly ash (WBR-24) WET extract.
Though the total PAH values for the first batch of POLA Consolidated Slip extracts (WBR-23 – 25) were similar, WBR-25 had the lowest values at non-detect for the WET extract and 11 µg/l for the SPLP extract. The highest values were reported for the raw sample extracts, at 13 µg/l for the WET extract and 32 µg/l for the SPLP extract. There were no PAHs detected in the second batch of extracts (WBR-54-56). This may be attributable to the increased holding time associated with raw source material used to prepare these blends. Additionally, the raw sediment samples were not refrigerated so it is possible that some loss due to volatilization of PAHs may have occurred. There are no published Title 22 STLC values for PAHs.

7-1
7.0 CONCLUSIONS AND RECOMMENDATIONS 7.1 CONCLUSIONS
Of the four source sites, raw materials from Marina del Rey and the Los Angeles River Estuary already possess generally good engineering properties based on their high sand content, and would be generally suitable for upland applications. However, the CBS process improved the ability to manage the material in a timely manner through hydration of excess porewater. This benefit will be a function of the amount of excess water in the dredged material as well as its drainage characteristics.
The Port of Long Beach (POLB) material possessed greater silt and clay content, and clearly benefited from the CBS process. The material became manageable in a matter of hours, whereas the untreated material would require extensive drying time. Unexpectedly, the CBS process either had no impact or increased compressibility, depending on the specific reagent mix. However, the process greatly increased the permeability of the material to improve drainage characteristics. The CBS mixes demonstrating the best combination of engineering qualities were the 4% cement + 8 % fluidized bed ash, and the 4% cement + 8% Type F ash + 4% fluidized bed ash combinations.
The Port of Los Angeles (POLA) material also demonstrated poor inherent engineering properties, and benefited from the CBS process. Similar to the Port of Long Beach material, the CBS treatment rendered manageable material in a matter of hours, except for the low cement mixes. Both compressive and shear strength was improved. The process greatly reduced the compressibility of the untreated material. Permeability was moderately increased. The 4% cement + 8% fluidized bed ash mixture was found to produce the best overall improvement of engineering qualities.
In summary, the CBS process resulted in significant improvement of the POLB and POLA material for general upland use. However, high fine content and low density may limit their broad application, particularly the POLA material. Final assessment of suitability would be based on the specific application and associated material performance requirements.
Chemical testing results showed that none of the raw sediment samples evaluated exceeded the TTLC limits indicating these sediments are not hazardous waste by California Title 22 criteria. Similarly, none of the extracts (i.e., either the raw sediments or stabilization blends) exceeded STLC limits indicating that these materials would not be considered hazardous waste by California Title 22 criteria. With the exception of some pesticides and metals, contaminants appeared to be less available in the blends than in the raw samples. The blend with the lowest reported values of contaminants overall was the 4% cement + 6% type F fly ash + 4% fluid bed fly ash blend.

7-2
A subsequent pilot-scale study of cement-based stabilization technology under preparation for the Los Angeles District (draft to be published June 2002) projects costs on the order of $45 per cubic yard for dredging through treatment. The cost was based on a reagent mix of 5 percent cement. Of that amount, only about $7 was associated with reagent purchase. Thus, the overall treatment costs is not highly sensitive to type nor volume of reagent.
7.2 RECOMMENDATIONS
One surprising result of the study was the limited levels of contaminants in the raw materials, particularly the Port of Los Angeles material from the Consolidated Slip. One known contaminant of concern in this area is the pesticide DDT. It would be of interest to conduct further sampling and process those samples with more representative detection levels to further assess the efficacy of the CBS process in binding regional contaminants of concern.
To further assess the potential applicability of the CBS technology, the findings of this and the upcoming pilot-scale study should be integrated with studies of the market demand for such beneficial re-use material, including the market study currently being conducted under the direction of the Contaminated Sediments Task Force (CSTF).

8-1
8.0 REFERENCES
Holtz, R.D. and Kovacs, W.D. 1981. An Introduction to Geotechnical Engineering. Prentice-Hall. pp. 155-156.
Loest, K. 1998. Brownfield Reuse of Dredged New York Harbor Sediment by Cement- Based Solidification/Stabilization.
Long, E. R., D. D. MacDonald, S. L. Smith, and F. D. Calder. 1995. Incidence of Adverse Biological Effects within Ranges of Chemical Concentrations in Marine and Estuarine Sediments. Environmental Management 19(1): 81–97.
Plumb, R. H., Jr. 1981. Procedure for Handling and Chemical Analysis of Sediment and Water Samples. Technical Report EPA/CE-81-1. Prepared by Great Lake Laboratory, State University College at Buffalo, New York, for the U.S. Environmental Protection Agency/ U.S. Army Corps of Engineers Technical Committee on Criteria for Dredged and Fill Material. Vicksburg, MS: U.S. Army Engineer Waterways Experiment Station.
Sowers, G.F. 1979. Soil Mechanics and Foundations: Geotechnical Engineering. MacMillan Publishing Co. New York.
Uniform Building Code. 1997. International Conference of Building Officials. Chapter 18, Table 18-I-A.
U.S. Environmental Protection Agency and U.S. Army Corps of Engineers. 1991. Evaluation of Dredged Material Proposed for Ocean Disposal: Testing Manual. EPA-503/8-91/001.
U.S. Army Corps of Engineers and U.S. Environmental Protection Agency. 1993. Draft Regional Implementation Agreement (RIA) for the Evaluation of Dredged Material for Ocean Disposal. 13 April 1993. 19pp.
U.S. Environmental Protection Agency and U.S. Army Corps of Engineers. 1998. Evaluation of Dredged Material Proposed for Discharge in Waters of the U.S. - Testing Manual, Inland Testing Manual, EPA-823-B-98-004, February 1998.