peatt pilot project community presentation
TRANSCRIPT

PEATT Pilot ProjectPFAS Testing
in the Warrington, Warminster and Horsham areas
Pennsylvania Department of HealthSharon Watkins, Ph.D.
Director, Bureau of EpidemiologyState Epidemiologist
PFAS Community Meeting April 29, 2019

PFAS Exposure in Southeastern PA• Affected area = population of 84,184 (2010 census)
Horsham Air Guard Station Naval Air Warfare Center

PFAS Exposure in Southeastern PA
• The Naval Air Warfare Center Warminster and the Horsham Air Guard Station (formerly Naval Air Station Joint Reserve Base Willow Grove)
Military and firefighter training
Aqueous Film Forming Foam (AFFF) used on bases
PFAS in the foam
Exact composition of AFFF is proprietary
• PFAS levels in community drinking water1,440 ppt - about 21 times higher than the Lifetime Health advisory Level (70 ppt) found in a municipal well in Warminster Municipal Authority (WMA) area

Participant Selection Total households contacted: 600 Total households responded: 276 Household level response rate: 46% Number of eligible participants identified: 584 (including 113 kids aged
3-17 years) Number of eligible participants who completed the questionnaire and
the informed consent form: 305 Number of eligible participants who completed paperwork AND
provided blood samples: 235 – from 118 households Individual participation rate: 40% (235 out of 584) Household level participation rate: 19.6% (118 out of 600 contacted)

PEATT Project Timeline

• Study group determined by water service area, community determined by Warrington, Warminster, Horsham Twps, and Ivyland Borough
Study Participants (%) Community (%) U.S. (%)
Under 12 years 5.1 14.9 15.8 12 to 19 years 8.1 10.9 11.2 20+ years 86.8 74.2 73.0
Male 44.3 48.8 49.2Female 55.7 51.2 50.8
Hispanic or Latino 0 5.1 16.3 White 94.5 85.6 63.7 Black 0 3.0 12.2 Asian 0.4 4.8 4.7 Other 5.1 1.5 3.0
Lower than College 20.6 34.7 40.5 Some College or more 74.2 65.3 59.5 Other 5.3 0.0 0.0
Sex
Age
Race/Ethnicity
Education Level (18+ years old)
PEATT Project Demographics - Comparison

Results Overall
• Tested for 11 PFAS compounds (all perfluorinated)4 compounds were commonly detected
PFOS in 235 participants (100%)PFHxS in 233 participants (99.1%)PFOA in 232 participants (98.7%)PFNA in 185 participants (78.7%)All four detected in 79% of participants
Note: PFOS, PFOA and PFHxS are main components found in Aqueous Film Forming Foams (AFFF)PFHxS has longer half-life in the bodyPFNA is a biodegradation product during polyvinyl fluoride production/applicationPFNA blood levels are rising in the general population as PFOA, PFOS, and PFHxS levels decline
Das et al., (2015)

Results Overall
• Of the remaining 7 compounds-PFDeA was found in 14 participantsMeFOSAA was found in 9 participantsPFUA in 8 participantsPFHpA in 1 participant

Results Overall—4 main compounds
Community Results NHANES Results (2013-2014)
PFAS Compound
Average 95% Confidence Interval
Median Range Average 95% Confidence Interval
PFOA 3.13 2.81-3.50 3.06 0.55-24.8 1.94 1.76-2.14
PFOS 10.24 8.86-11.83 9.86 1.02-105.00
4.99 4.50-5.52
PFHxS 6.64 5.51-7.99 6.61 0.54-116.00
1.35 1.20-1.52
PFNA 0.74 0.67-0.80 0.76 0.50-2.56 0.68 0.61-0.74
• Results shown in ug/L. Range excludes <LOD
• Average serum PFAS levels (level of PFAS in the blood) were higher compared to NHANES’s averages94% had higher levels of PFHxS
81% had higher levels of PFOS
75% had higher levels of PFOA
59% had higher levels of PFNA
• Results are consistent with other studies on PFAS exposure through drinking water

Results Overall – Univariate Analyses• In general, PFAS levels increased with:
Age Male genderResidence timeBMIPrivate well useQuantity of tap water consumedWater service area’s proximity to military base

Serum PFAS Levels by Public Water System (PWS) Area-Current Address
PFAS Compound
HWSA (n=69) WMA (n=98) WTWSD (n=41) WTWSD/NWWA(n=27)
Average 95% C.I. Average 95% C.I. Average 95% C.I. Average 95% C.I.
PFOA 3.69 2.99-4.56 3.17 2.71-3.71 3.35 2.62-4.29 1.78 1.44-2.20
PFOS 12.38 9.47-16.19 10.06 8.06-12.57 11.47 8.69-15.15 5.65 4.17-7.67
PFHxS 8.81 6.28-12.37 6.98 5.32-9.16 6.56 4.61-9.33 2.72 1.72-4.30
PFNA 0.79 0.68-0.92 0.72 0.62-0.84 0.78 0.66-0.94 0.59 0.51-0.67
• Significant difference in levels of all four PFAS (P≤0.05 for all) among PWS areas
Serum PFAS levels among participants in different PWS areas (includes all drinking water sources)
• Results shown in ug/L

Serum PFAS Levels-Public Water Users- Current Address
PFAS Compound
HWSA (n=61) WMA (n=83) WTWSD (n=31) WTWSD/NWWA (n=18)
Average 95% C.I. Average 95% C.I. Average 95% C.I. Average 95% C.I.
PFOA 3.65 2.89-4.60 3.24 2.73-3.84 3.63 2.76-4.78 1.63 1.25-2.11
PFOS 12.17 9.03-16.39 10.06 7.89-12.83
12.39 9.08-16.91 4.53 3.51-5.85
PFHxS 8.90 6.11-12.96 7.19 5.31-9.73 7.69 5.41-10.92 2.42 1.55-3.79
PFNA 0.76 0.65-0.89 0.72 0.60-0.85 0.81 0.66-0.99 0.56 0.51-0.61
• Significant difference (P≤0.05) in levels of all four PFAS compounds• Consumers in HWSA had higher mean serum levels for all 4 PFAS compounds except PFNA
and PFOS
• Results shown in ug/L

Serum PFAS Levels- Private Well Users – Current Address
PFAS Compound
HWSA (n=1) WMA (n=10) WTWSD (n=3) WTWSD/NWWA (n=6)
Average 95% C.I. Average 95% C.I. Average 95% C.I. Average 95% C.I.
PFOA 7.78 7.78-7.78 3.23 2.30-4.55 4.87 2.43-9.79 2.33 1.27-4.28
PFOS 23.60 23.60-23.60 12.59 8.36-18.97 15.94 7.19-35.33 7.55 5.86-9.74
PFHxS 25.90 25.90-25.90 8.05 4.48-14.47 11.75 8.99-15.35 2.29 0.99-5.28
PFNA 1.44 1.44-1.44 0.76 0.58-0.99 0.96 0.68-1.35 0.69 0.37-1.31
• Significant difference in levels of all four PFAS compounds• HWSA had higher PFAS serum levels
• Results shown in ug/L
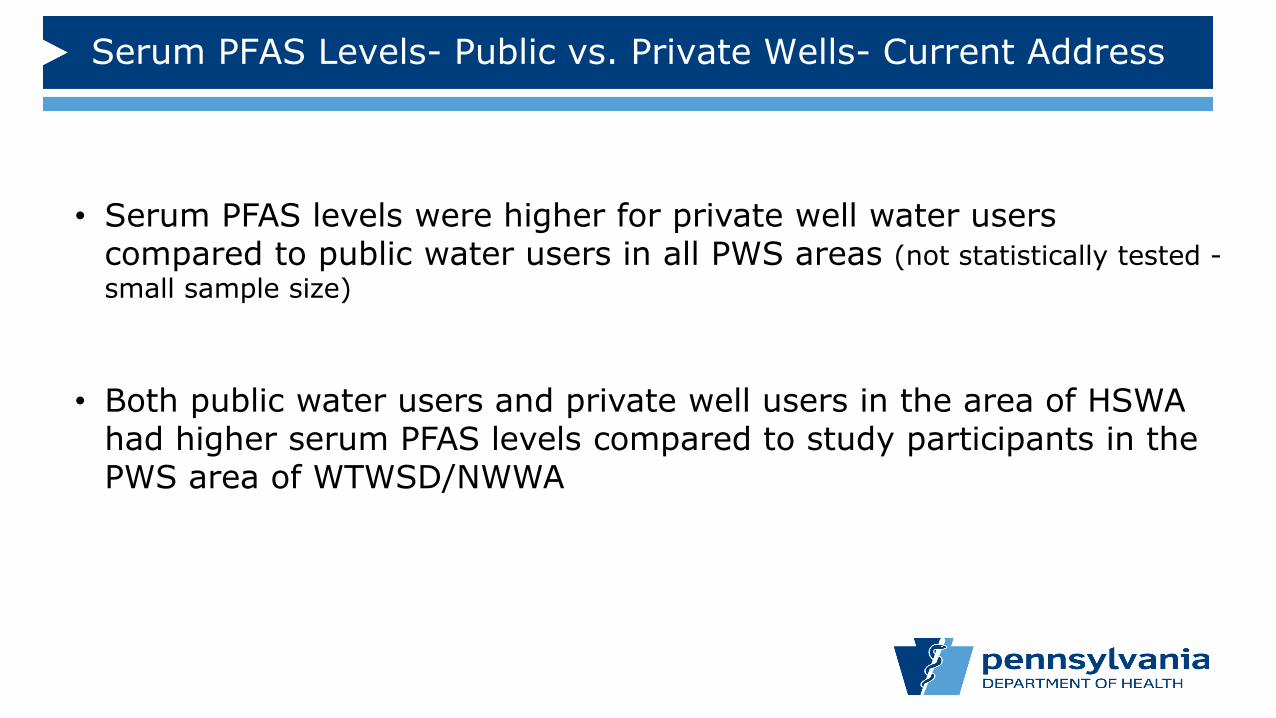
Serum PFAS Levels- Public vs. Private Wells- Current Address
• Serum PFAS levels were higher for private well water users compared to public water users in all PWS areas (not statistically tested -small sample size)
• Both public water users and private well users in the area of HSWA had higher serum PFAS levels compared to study participants in the PWS area of WTWSD/NWWA

Serum PFOS levels by PWS area

Results—Multivariate analysis
• Multivariate analysis = when we analyze more than two variables (e.g. age, sex, water source, serum PFAS levels, etc.) at the same time.
• It lets us predict the effect a change in one variable will have on the outcome variable while controlling for the effects of other variables.
• Analysis determined that average serum levels for PFOA, PFOS, PFHxS and PFNA were positively associated with drinking water source, and total length of residence in the study area.

Results—Multivariate analysis
• Multivariate analysis did not account for the location of
private well/bottled water users.
• Public water users were geocoded to the correct PWS
area based on their addresses.

Multivariate analysis• Demographic characteristics
• age• gender• education
• Exposure characteristics• water source at current address
• HSWA, WMA, WTWSD, WTWSD/NWWA, private well, other• quantity of water consumed at current address• total length of residence in the study area• employment information - ever employed on the base, in the
area • Health information
• health status, BMI

Multivariate analysis - Results
Overall, serum PFAS (PFOA, PFOS, PFHxS and PFNA) levels were positively aligned with total length of residence in the study area.
Those who lived in the area more than 10 years generally had higher PFAS serum levels compared to those who lived in the area less than 10 yrs).
Total Length of Residence
PFOApercent higher
PFOS percent higher
PFHxS percent higher
PFNA percent higher
10-19 yrs 22.5% 89.1% 49.8% 17.3%20-29 yrs 27.7% 66.0% 67.6% 5.8%30-39 yrs 38.9% 77.9% 65.4% 46.1%40+ yrs 55.4% 124.3% 171.8% 17.0%
Bold = statistically significant (p<0.05)

Multivariate analysis - Results
In general, PFAS levels were higher the closer the water source was to the military base
Water sources were compared to the source farthest from the military bases (WTWSD/NWWA reference group):
Drinking water source
PFOA percent higher
PFOS percent higher
PFHxS percent higher
PFNA percent higher
HWSA 157.4% 168.5% 257.2% 33.6%WMA 104.5% 88.5% 137.4% 15.3%WTWSD 94% 98.7% 113.9% 10.4%Other (bottled water, unknown)
78.1% 97.84% 77.2% 29.6%
Private Well 105.9% 101.24% 97.9 38.6%Bold= statistically significant p<0.05)WTWSD/NWWA reference group

Multivariate analysis - Results• Higher serum levels associated with proximity to the base• HWSA consumers compared to WTWSD/NWWA consumers
157% higher PFOA169% higher PFOS257% higher PFHxS34% higher PFNA
HAGS NAWC
HWSA areaWMA area
WTWSD area
NWWA area
WMA compared to WTWSD/NWWA105% higher PFOA89% higher PFOS137% higher PFHxS
WTWSD compared to WTWSD/NWWA94% higher PFOA99% higher PFOS114% higher PFHxS
“Other” category compared to WTWSD/NWWA78% higher PFOA98% higher PFOS30% higher PFNA
Private well users compared to WTWSD/NWWA106% higher PFOA101% higher PFOS39% higher PFNA

Multivariate analysis - Results
Average PFHxS serum levels 32% higher in men than women
Average PFHxS serum levels 35% higher in employed than never employed in study area (self-reported)
Average PFOA serum levels of participants consuming 4-7 cups of tap water daily were 29% higher than participants consuming 0-3 cups daily
Average serum levels of PFOA, PFOS and PFNA increased with participant age

CDC/ASTHO Report Presentation
• Atlanta, March 18–19, 2019
PA DOH and NY DOH presented PEATT findings
New York saw similar results to ours
New York had many more resources available to them
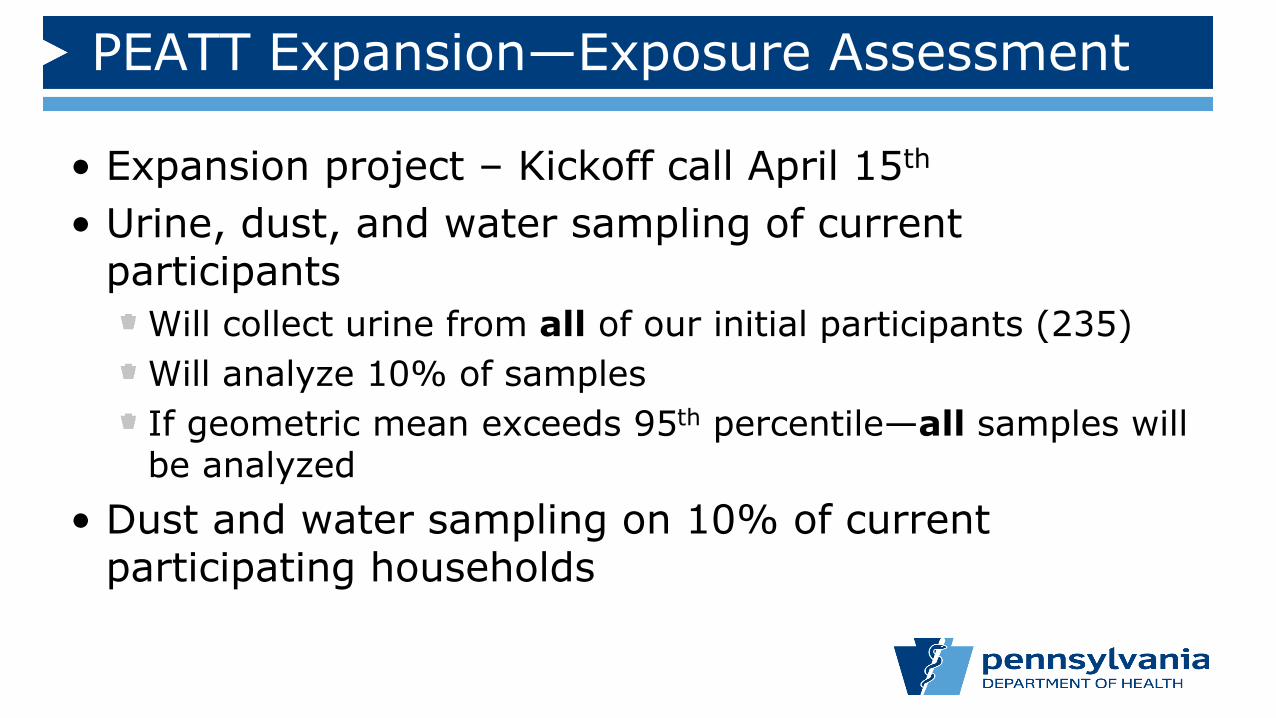
PEATT Expansion—Exposure Assessment
• Expansion project – Kickoff call April 15th
• Urine, dust, and water sampling of current participants
Will collect urine from all of our initial participants (235) Will analyze 10% of samplesIf geometric mean exceeds 95th percentile—all samples will be analyzed
• Dust and water sampling on 10% of current participating households
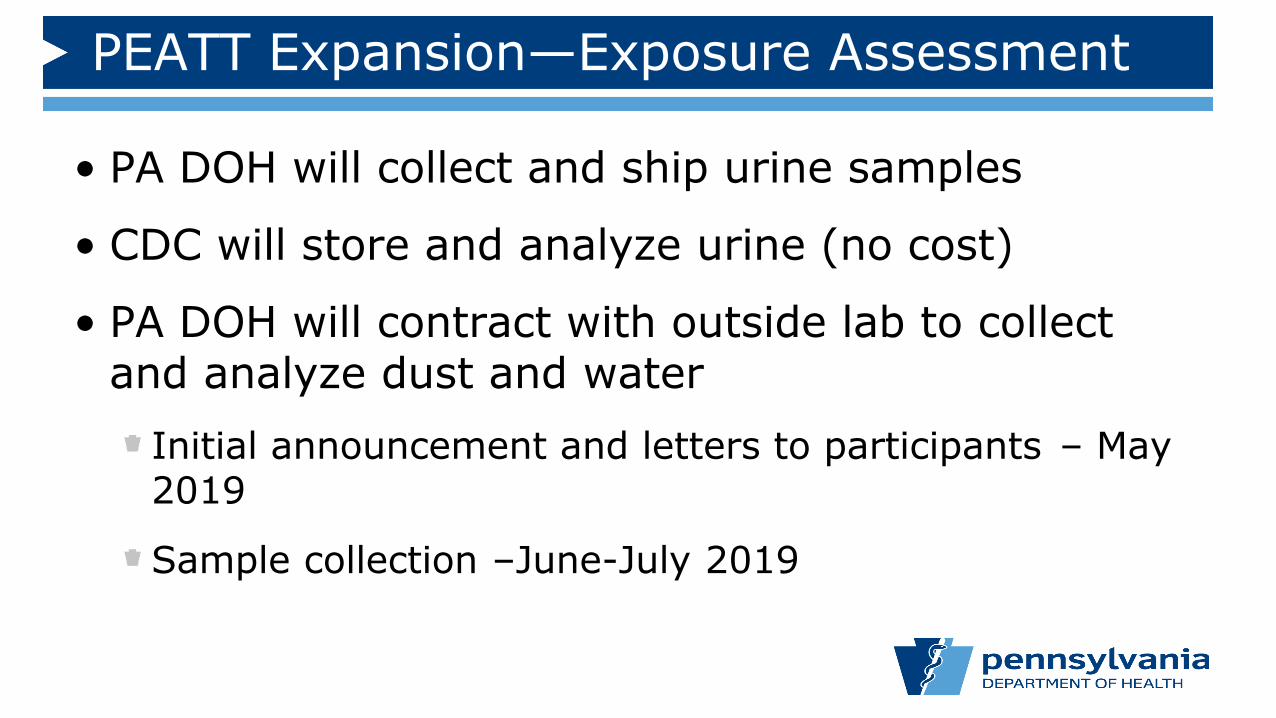
PEATT Expansion—Exposure Assessment
• PA DOH will collect and ship urine samples
• CDC will store and analyze urine (no cost)
• PA DOH will contract with outside lab to collect and analyze dust and water
Initial announcement and letters to participants – May 2019
Sample collection –June-July 2019

Multi-Site Health Study Opportunity
• CDC/ATSDR taking applications to participate in Multi-Site National Health Study
• Will study health implications of exposure to PFAS-contaminated drinking water
• Six sites will be accepted and given grants
• Goal is to enroll at least 6,000 adults and 2,000 children (in total across all sites)
• Research oriented, competitive grant

Multi-Site Health Study Opportunity
• Historical reconstruction of water and serum PFAS concentrations using models
• Will study health conditions including high cholesterol, immunity issues, and thyroid function
• Can propose additional research questions for studyDOH is considering cancer-related investigator initiated (University) study
• Application due May 30th

Our Partners
• Centers for Disease Control and Prevention (CDC)
• Association of State and Territorial Health Officials (ASTHO)
• Agency for Toxic Substances and Disease Registry (ATSDR)
• Bucks County Health Department
• Montgomery County Health Department
• New York State Health Department Laboratory
• Pennsylvania Department of Environmental Protection

PEATT Pilot Project Team
• Dr. Sharon Watkins
• Dr. Anil Nair
• Dr. Farhad Ahmed
• Dr. Marshal Ma
• Susan Schrack Wood

Contact Information
Should you have any questions or concerns, feel free to contact us
at [email protected] or by phone at 717-787-3350
For more information:
https://www.health.pa.gov/topics/envirohealth/Pages/PFAS.aspx

Recommendations
• Selection ProcessOption to include volunteer participants and special categories of exposure (i.e. veterans)Create initial eligibility form to determine number of participants in a household. This facilitates sending the correct number of forms to a household, along with return postage-paid envelopes
• QuestionnairesNeed to accommodate for long duration of exposureFewer open-ended questions and more structured, multiple choice questions for health conditionsGuidance for households with college-aged children (considered residents?)Blood donation/transfusion/major surgeries

Recommendations
• Participant Drop-outPaper questionnaire visually overwhelming- consider online survey options with built-in “skips” to lessen the perceived burdenStreamline the participation process- possible online scheduling for clinicsConsider visiting nurses/teams to collect informationPossible tokens of appreciation
• Results ProcessLetter templates complete for information and numbers, but limited in psychological comfort for those with high levels
• Additional GuidanceLiterature review and continuing education on PFAS studies and the current state of the science regarding this emerging contaminant