pfas exposure assessment technical toolkit (peatt) pilot ... health/peatt pilot project...final...
TRANSCRIPT
Table of Contents
PFAS Exposure Assessment Technical Toolkit (PEATT) Pilot Project Final Report Division of Environmental Health Epidemiology
April 2019

2
PEATT PILOT PROJECT PENNSYLVANIA DEPARTMENT OF HEALTH
Table of Contents
Executive Summary 3
Background 4
Methods 6
Results 9
Discussion 25
Conclusions 28
Limitations and Challenges 28
Feedback and Recommendations 30
Citations 32
Appendix 1 33
Appendix 2 34
Appendix 3 36
3
PEATT PILOT PROJECT PENNSYLVANIA DEPARTMENT OF HEALTH
Executive Summary Per- and polyfluoroalkyl substances (PFAS) are a large group of chemicals widely used in commercial and industrial processes. PFAS consist of a very strong carbon-fluorine bond that provides high thermal and chemical stability and prevents breakdown in the natural environment. Studies on the public health implications of PFAS are still in process, but results to-date have been inconsistent, given that there are thousands of compounds in the PFAS family. There is evidence that PFAS exposure may pose risks to the developmental, immune, metabolic and endocrine health of those exposed. PFAS contamination was discovered in public drinking water supplies in Pennsylvania’s Bucks and Montgomery counties that was linked to operations in the nearby military bases. The Pennsylvania Department of Health (DOH) conducted biomonitoring of 235 randomly selected community members who live in any of the four public water system service areas surrounding two military bases as part of a pilot project to evaluate the PFAS Exposure Assessment Technical Tools (PEATT) developed by the Centers for Disease Control and Prevention (CDC) and the Agency for Toxic Substances and Disease Registry (ATSDR). DOH also collected data on demographics, exposure history and health conditions from the study participants using a questionnaire developed as part of the PEATT. The pilot project was funded through the Association of State and Territorial Health Officials (ASTHO). Serum samples were analyzed for 11 PFAS compounds. Only perfluorooctanoic acid (PFOA), perfluorooctanesulfonic acid (PFOS), perfluorohexanesulfonic acid (PFHxS) and perfluorononanoic acid (PFNA) were consistently detected in the serum samples of the study participants. The other seven PFAS compounds were detected in less than 15 participants. The average levels of PFOA, PFOS, PFHxS and PFNA among the study participants were 3.13, 10.24, 6.64 and 0.74 microgram per liter (µg/L), respectively. Overall, 75, 81, 94 and 59 percent of the study participants had levels exceeding the national average for PFOA (1.94 µg/L), PFOS (4.99 µg/L), PFHxS (1.35 µg/L) and PFNA (0.66 µg/L), respectively, and the levels in general increased with age. Though the difference was not statistically significant, males in the study had higher levels of PFOA, PFOS and PFHxS, whereas females had higher levels of PFNA. The serum PFAS levels significantly increased with the length of residence in the area. Private well water users had higher levels of PFOA, PFOS and PFNA than public water users; however, the differences were not statistically significant. Estimated quantity of tap water consumed (self-reported) daily did not show a consistent relationship with serum PFAS levels. The study participants who reported ever working on the military base had higher levels (not statistically significant) of PFOA, PFOS and PFHxS compared to the other study participants. The most frequently reported health condition was elevated cholesterol level, followed by endocrine disruptions and cancer. A multivariate analysis (adult participants only) indicated statistically significant association between serum levels of some of the PFAS compounds and sex, employment in the study area, receiving water from select public water systems (PWS), quantity of daily tap water consumption, total length of residence in the study area, and age of the study participants. The cooperation from the community members was key to the successful completion of the PEATT pilot project. DOH would like to thank them for their involvement in the project.
4
PEATT PILOT PROJECT PENNSYLVANIA DEPARTMENT OF HEALTH
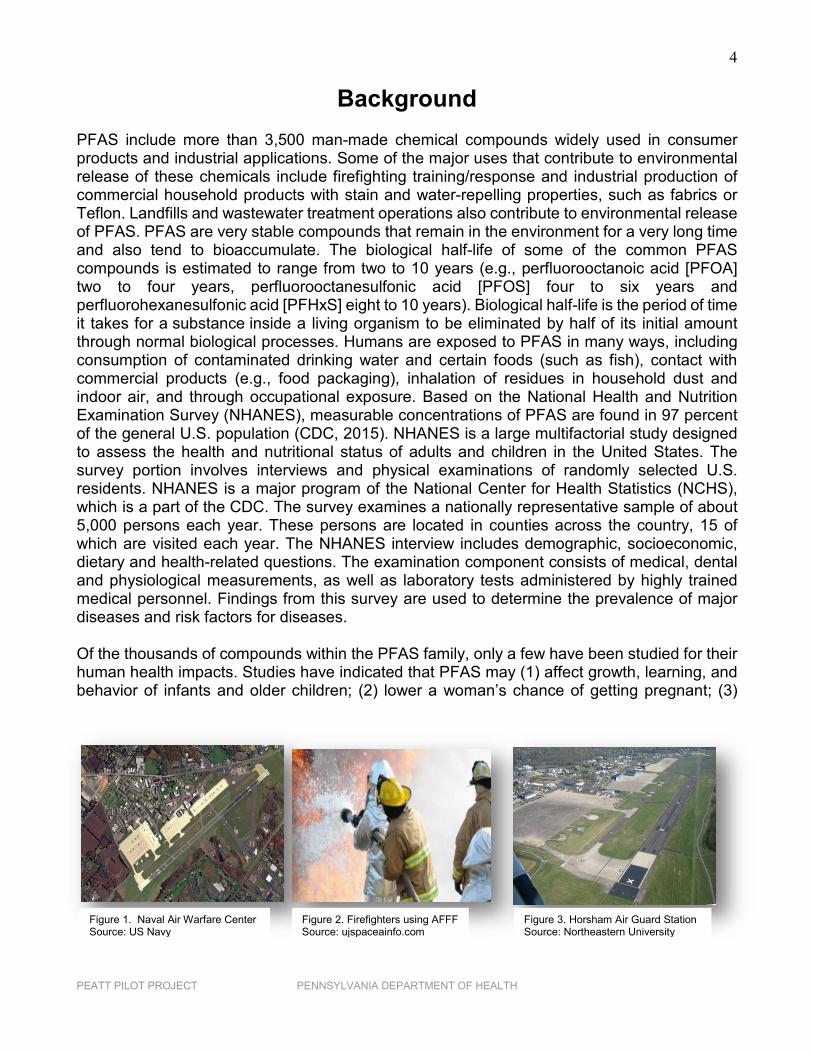
Background PFAS include more than 3,500 man-made chemical compounds widely used in consumer products and industrial applications. Some of the major uses that contribute to environmental release of these chemicals include firefighting training/response and industrial production of commercial household products with stain and water-repelling properties, such as fabrics or Teflon. Landfills and wastewater treatment operations also contribute to environmental release of PFAS. PFAS are very stable compounds that remain in the environment for a very long time and also tend to bioaccumulate. The biological half-life of some of the common PFAS compounds is estimated to range from two to 10 years (e.g., perfluorooctanoic acid [PFOA] two to four years, perfluorooctanesulfonic acid [PFOS] four to six years and perfluorohexanesulfonic acid [PFHxS] eight to 10 years). Biological half-life is the period of time it takes for a substance inside a living organism to be eliminated by half of its initial amount through normal biological processes. Humans are exposed to PFAS in many ways, including consumption of contaminated drinking water and certain foods (such as fish), contact with commercial products (e.g., food packaging), inhalation of residues in household dust and indoor air, and through occupational exposure. Based on the National Health and Nutrition Examination Survey (NHANES), measurable concentrations of PFAS are found in 97 percent of the general U.S. population (CDC, 2015). NHANES is a large multifactorial study designed to assess the health and nutritional status of adults and children in the United States. The survey portion involves interviews and physical examinations of randomly selected U.S. residents. NHANES is a major program of the National Center for Health Statistics (NCHS), which is a part of the CDC. The survey examines a nationally representative sample of about 5,000 persons each year. These persons are located in counties across the country, 15 of which are visited each year. The NHANES interview includes demographic, socioeconomic, dietary and health-related questions. The examination component consists of medical, dental and physiological measurements, as well as laboratory tests administered by highly trained medical personnel. Findings from this survey are used to determine the prevalence of major diseases and risk factors for diseases. Of the thousands of compounds within the PFAS family, only a few have been studied for their human health impacts. Studies have indicated that PFAS may (1) affect growth, learning, and behavior of infants and older children; (2) lower a woman’s chance of getting pregnant; (3)
Figure 3. Horsham Air Guard Station Source: Northeastern University
Figure 2. Firefighters using AFFF Source: ujspaceainfo.com
Figure 1. Naval Air Warfare Center Source: US Navy
5
PEATT PILOT PROJECT PENNSYLVANIA DEPARTMENT OF HEALTH
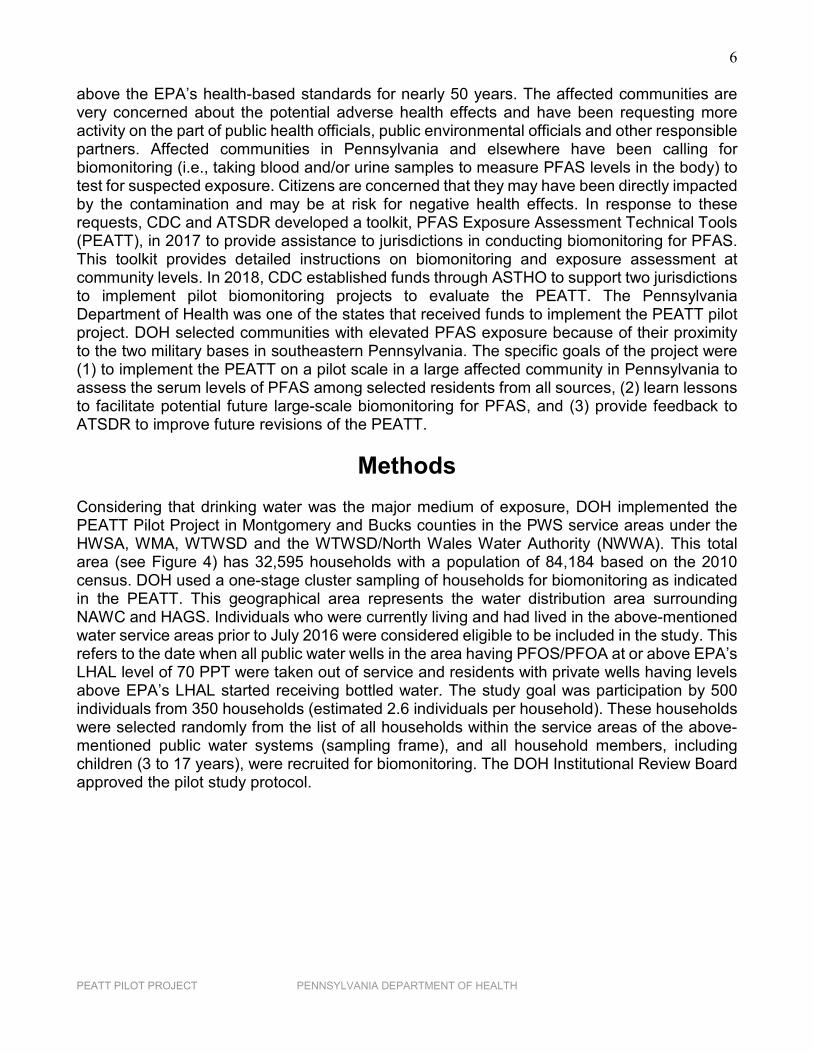
interfere with the body’s natural hormones; (4) increase cholesterol levels; (5) affect the immune system; and (6) increase the risk of cancer (ATSDR, 2018). Large scale contamination of drinking water sources by PFAS occurred in Pennsylvania and in many other states among communities near military bases where PFAS were used in firefighting exercises. These bases were routinely performing firefighting trainings using PFAS-containing, aqueous film-forming foams (AFFF) for several decades. The use of AFFF in training exercises led to direct release of PFAS into surface and ground waters. Montgomery and Bucks counties in southwestern Pennsylvania were the locations of two such large military bases. The former Naval Air Warfare Center (NAWC) in Warminster Township, Bucks County, Pennsylvania, (Figure 1) was used to research, develop and test naval aircraft systems since 1949 and was located near four of the 18 Warminster Municipal Authority (WMA) public water supply wells. PFAS compounds were detected in the WMA system in the summer of 2013. Further study was performed by the U.S. Environmental Protection Agency (EPA), and, as of September 2015, PFAS were detected in 93 out of the 100 private wells within a one to three-mile radius of the military site. Consequent to the detection of PFAS at or above EPA’s Provisional Health Advisory Levels (PHAL) of 0.2 microgram per liter (µg/L) for PFOS and 0.4 µg/L for PFOA, all contaminated public water system wells were taken out of service by July 2014, and the Navy and EPA provided bottled water to all residents with contaminated private wells. A subset of additional private wells with lower levels of PFAS within 25 percent of the PFOS or PFOA PHALs are being monitored through quarterly resampling. The U.S. Navy, EPA and WMA are currently implementing a long-term plan to address the PFAS groundwater contamination in the public water wells at the site. The Horsham Air Guard Station (HAGS) in Horsham Township, Montgomery County, Pennsylvania (Figure 2), located a few miles away from NAWC, is on a 1,200-acre site that was shared with the Naval Air Station Joint Reserve Base (NASJRB) until the U.S. Navy departed in 2011. Military operations began during the 1920s, and the base is currently operated under the Pennsylvania Air National Guard. The firefighting training area is in the southcentral region of the NASJRB and was used from 1942 to 1975. The AFFF used on the HAGS base resulted in PFAS contamination of two nearby public water systems, the Horsham Water and Sewer Authority (HWSA) and the Warrington Township Water and Sewer Department (WTWSD). In July 2014, two of the 15 HWSA wells were above the PHAL for a specific PFAS (PFOS) and were taken out of service. In October 2014, three of the nine WTWSD wells with levels above the PHAL for PFOS were taken out of service. In May 2016, EPA released a lifetime health advisory level (LHAL) of 70 parts per trillion (PPT) or 0.07 µg/L for PFOS and PFOA combined. The public water systems immediately removed additional wells from service that had PFAS levels above the new health-based standard. The remaining wells retested below the LHAL. Additional private well owners whose wells retested above the LHAL were supplied with bottled water. AFFF containing PFAS have been available since the mid-1960s; therefore, it is likely that the communities near these bases have been exposed to PFAS in their drinking water at levels
6
PEATT PILOT PROJECT PENNSYLVANIA DEPARTMENT OF HEALTH
above the EPA’s health-based standards for nearly 50 years. The affected communities are very concerned about the potential adverse health effects and have been requesting more activity on the part of public health officials, public environmental officials and other responsible partners. Affected communities in Pennsylvania and elsewhere have been calling for biomonitoring (i.e., taking blood and/or urine samples to measure PFAS levels in the body) to test for suspected exposure. Citizens are concerned that they may have been directly impacted by the contamination and may be at risk for negative health effects. In response to these requests, CDC and ATSDR developed a toolkit, PFAS Exposure Assessment Technical Tools (PEATT), in 2017 to provide assistance to jurisdictions in conducting biomonitoring for PFAS. This toolkit provides detailed instructions on biomonitoring and exposure assessment at community levels. In 2018, CDC established funds through ASTHO to support two jurisdictions to implement pilot biomonitoring projects to evaluate the PEATT. The Pennsylvania Department of Health was one of the states that received funds to implement the PEATT pilot project. DOH selected communities with elevated PFAS exposure because of their proximity to the two military bases in southeastern Pennsylvania. The specific goals of the project were (1) to implement the PEATT on a pilot scale in a large affected community in Pennsylvania to assess the serum levels of PFAS among selected residents from all sources, (2) learn lessons to facilitate potential future large-scale biomonitoring for PFAS, and (3) provide feedback to ATSDR to improve future revisions of the PEATT.
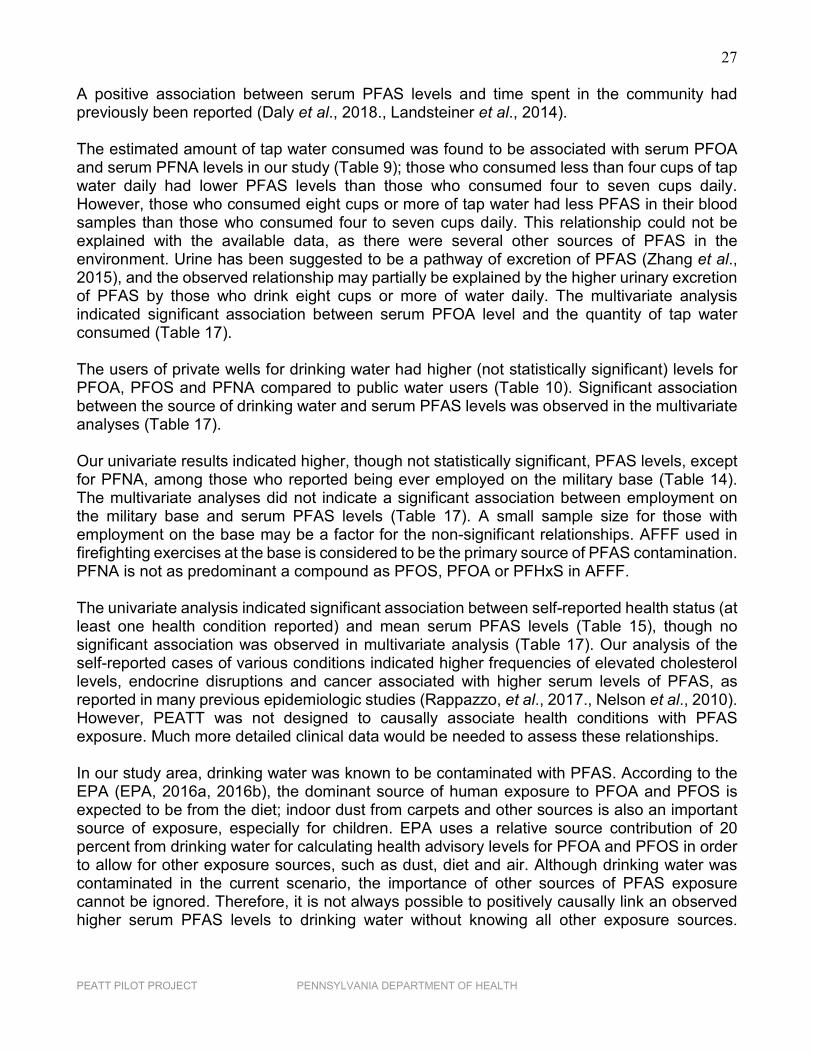
Methods Considering that drinking water was the major medium of exposure, DOH implemented the PEATT Pilot Project in Montgomery and Bucks counties in the PWS service areas under the HWSA, WMA, WTWSD and the WTWSD/North Wales Water Authority (NWWA). This total area (see Figure 4) has 32,595 households with a population of 84,184 based on the 2010 census. DOH used a one-stage cluster sampling of households for biomonitoring as indicated in the PEATT. This geographical area represents the water distribution area surrounding NAWC and HAGS. Individuals who were currently living and had lived in the above-mentioned water service areas prior to July 2016 were considered eligible to be included in the study. This refers to the date when all public water wells in the area having PFOS/PFOA at or above EPA’s LHAL level of 70 PPT were taken out of service and residents with private wells having levels above EPA’s LHAL started receiving bottled water. The study goal was participation by 500 individuals from 350 households (estimated 2.6 individuals per household). These households were selected randomly from the list of all households within the service areas of the above-mentioned public water systems (sampling frame), and all household members, including children (3 to 17 years), were recruited for biomonitoring. The DOH Institutional Review Board approved the pilot study protocol.
7
PEATT PILOT PROJECT PENNSYLVANIA DEPARTMENT OF HEALTH
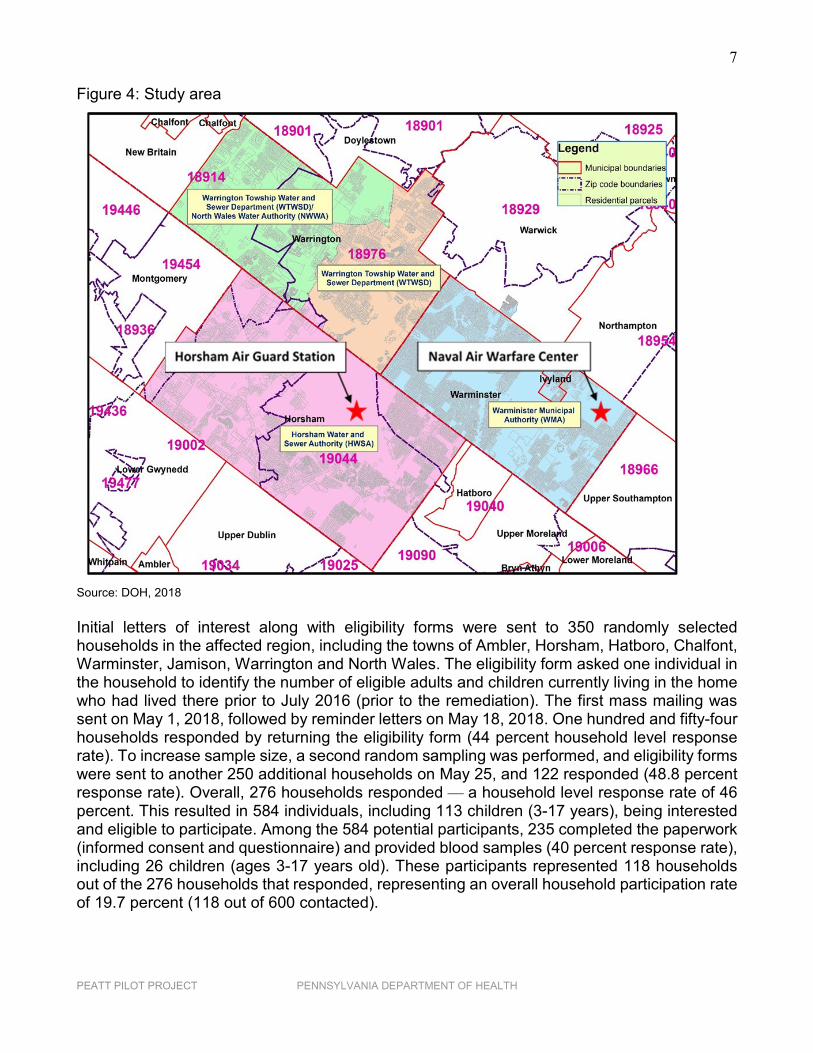
Figure 4: Study area
Source: DOH, 2018 Initial letters of interest along with eligibility forms were sent to 350 randomly selected households in the affected region, including the towns of Ambler, Horsham, Hatboro, Chalfont, Warminster, Jamison, Warrington and North Wales. The eligibility form asked one individual in the household to identify the number of eligible adults and children currently living in the home who had lived there prior to July 2016 (prior to the remediation). The first mass mailing was sent on May 1, 2018, followed by reminder letters on May 18, 2018. One hundred and fifty-four households responded by returning the eligibility form (44 percent household level response rate). To increase sample size, a second random sampling was performed, and eligibility forms were sent to another 250 additional households on May 25, and 122 responded (48.8 percent response rate). Overall, 276 households responded — a household level response rate of 46 percent. This resulted in 584 individuals, including 113 children (3-17 years), being interested and eligible to participate. Among the 584 potential participants, 235 completed the paperwork (informed consent and questionnaire) and provided blood samples (40 percent response rate), including 26 children (ages 3-17 years old). These participants represented 118 households out of the 276 households that responded, representing an overall household participation rate of 19.7 percent (118 out of 600 contacted).
8
PEATT PILOT PROJECT PENNSYLVANIA DEPARTMENT OF HEALTH
Exposure History and Demographic Data Collection All selected households were sent a participation packet through the U.S. Postal Service. This packet included a cover letter, consent forms for each eligible and interested person in the household, information sheets on PFAS, a physician interim guidance document (from the PEATT), an instruction sheet explaining how to make a clinic appointment for blood draw, and questionnaires for each member of the household. The adult questionnaire asked about demographic factors, drinking water habits, years of residence in current and prior area homes, health conditions, pregnancy status if female, workplace history and locations, and water sources. The child questionnaire included questions about school/daycare water sources, as well as breastfeeding and formula consumption. Once questionnaires and signed consent forms were returned, participants could schedule appointments to have their blood samples drawn at Montgomery and Bucks county health department clinics. Blood Sample Collection and Serum Extraction DOH collaborated with the local health departments of Montgomery and Bucks counties, the Pennsylvania State Bureau of Laboratories (BOL) and the New York State Health Department in blood sample collection and analysis. A list of all project collaborators is provided in Appendix 1. Wadsworth Laboratory at the New York State Department of Health is a Clinical Laboratory Improvement Amendments (CLIA) certified laboratory accredited to test blood samples for PFAS. This laboratory provided testing and analysis of the following panel of 11 PFAS compounds:
• Perfluorobutanesulfonic acid (PFBS) • Perfluorohepatnoic acid (PFHpA) • Perfluorohexanesulfonic acid (PFHxS) • Perfluorononanoic acid (PFNA) • Perfluorooctanoic acid (PFOA) • Perfluorooctanesulfonic acid (PFOS) • Perfluorodecanoic acid (PFDeA) • Perfluoroundecanoic acid (PFUA) • Perfluorododecanoic acid (PFDoA) • Perfluorooctane sulfonamide (PFOSA) • 2-(N-Methyl-perfluorooctane sulfonamido) acetic acid (MeFOSAA)
Blood draw clinics were organized by the county health departments from May through September 2018. County personnel separated the serum and stored it, according to laboratory protocol, prior to transporting the samples to BOL’s Lionsville facility. BOL personnel received the samples and sent them to Wadsworth Laboratory in batches of 20 or more, following the protocols for interstate transfer and packaging of biological specimens. Serum samples were collected in bar-coded vials with no identifiable information about the participant. DOH linked the serum test results to the correct participants using barcodes and reconfirmed the linkage using a unique identification system established for this project.
9
PEATT PILOT PROJECT PENNSYLVANIA DEPARTMENT OF HEALTH
Data Analysis Data on demography, exposure, occupation and health conditions from the questionnaires were transcribed into a database. Prior to analysis, the questionnaire data and PFAS test result data were merged, and quality checks were performed. The data were analyzed (proc surveymean and proc surveyreg, using log-transformed PFAS values) for (1) generating summary statistics (average/geometric mean, confidence interval, median and range) and (2) understanding the relationship between demographic, exposure and occupational variables and serum concentration of PFAS. The addresses of public water users and private well users were geocoded to the corresponding PWS area prior to analysis. A new variable, total length of residence in the study area, was calculated by summing the length of residence at all addresses of the participants ages 20 and above who reported multiple addresses in the study area prior to July 2016. Given the small sample size (n=26) for children (3-17 years), separate detailed analysis for this age group was not performed. When test results were below the laboratory’s limit of detection (LOD) of 0.5 nanogram per milliliter (ng/mL), the value was estimated by dividing the LOD by the square root of two. All analyses were performed using SAS v 9.4 (SAS Institute, Carry, NC). A p-value ≤ 0.05 was considered statistically significant in all analyses. P-values are calculated based on the hypothesis or assumption that there is no difference between the groups compared. In simple terms, the lower the p-value, the more confident we are that the alternate hypothesis is true — that there is significant difference between the groups compared. Individual results were mailed to the participants as soon as their results were ready, along with a comparison of individual results with the average and 95th percentile values at the national level (NHANES) for the individuals’ corresponding age group. A second letter was sent in November 2018 to all participants when all results were available, comparing individual results with the community average and providing 95th percentile values for the corresponding age group both at the community and national levels. A detailed list of activities during the project period and a time line of major events are presented in Appendix 2.
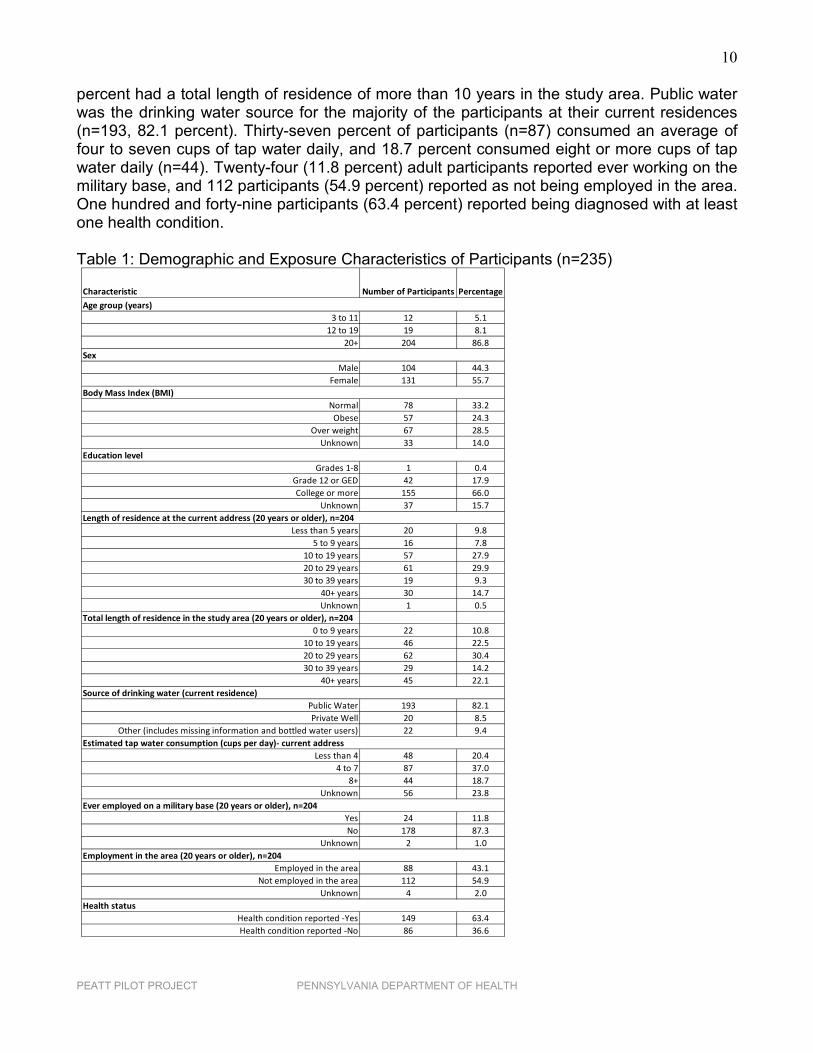
Results A total of 235 individuals submitted blood samples for testing from May to September 2018. Table 1 presents the demographic and exposure characteristics of the study participants. Twelve (5.1 percent) were children aged 3-11 years, 19 (8.1 percent) were aged 12-19 years and 204 (86.8 percent) were aged 20 years or older. Most of the individuals tested were females (n=131, 55.7 percent). Seventy-eight (33.2 percent) participants had normal body mass index (BMI). Sixty-six percent (n=155) had some college or higher level of education, with 29.4 percent (n=69) having an annual household income of >$75,000 (data not shown). However, information on household income was unavailable for the majority of the study participants (n=144, 61.3 percent). Approximately 30 percent of the study participants (n=71) had more than one prior residence in the study area (data not shown). In addition, 53.9 percent of the participants had been living at their current addresses for more than 20 years (n=110), and 81.9 percent had lived at their current addresses 10 years or more. Approximately 89
10
PEATT PILOT PROJECT PENNSYLVANIA DEPARTMENT OF HEALTH
percent had a total length of residence of more than 10 years in the study area. Public water was the drinking water source for the majority of the participants at their current residences (n=193, 82.1 percent). Thirty-seven percent of participants (n=87) consumed an average of four to seven cups of tap water daily, and 18.7 percent consumed eight or more cups of tap water daily (n=44). Twenty-four (11.8 percent) adult participants reported ever working on the military base, and 112 participants (54.9 percent) reported as not being employed in the area. One hundred and forty-nine participants (63.4 percent) reported being diagnosed with at least one health condition. Table 1: Demographic and Exposure Characteristics of Participants (n=235)
Characteristic Number of Participants Percentage
3 to 11 12 5.112 to 19 19 8.1
20+ 204 86.8
Male 104 44.3Female 131 55.7
Normal 78 33.2Obese 57 24.3
Over weight 67 28.5Unknown 33 14.0
Grades 1-8 1 0.4Grade 12 or GED 42 17.9College or more 155 66.0
Unknown 37 15.7
Less than 5 years 20 9.85 to 9 years 16 7.8
10 to 19 years 57 27.920 to 29 years 61 29.930 to 39 years 19 9.3
40+ years 30 14.7Unknown 1 0.5
Total length of residence in the study area (20 years or older), n=2040 to 9 years 22 10.8
10 to 19 years 46 22.520 to 29 years 62 30.430 to 39 years 29 14.2
40+ years 45 22.1
Public Water 193 82.1Private Well 20 8.5
Other (includes missing information and bottled water users) 22 9.4
Less than 4 48 20.44 to 7 87 37.0
8+ 44 18.7Unknown 56 23.8
Yes 24 11.8No 178 87.3
Unknown 2 1.0
Employed in the area 88 43.1Not employed in the area 112 54.9
Unknown 4 2.0
Health condition reported -Yes 149 63.4Health condition reported -No 86 36.6
Sex
Source of drinking water (current residence)
Age group (years)
Estimated tap water consumption (cups per day)- current address
Ever employed on a military base (20 years or older), n=204
Length of residence at the current address (20 years or older), n=204
Education level
Body Mass Index (BMI)
Employment in the area (20 years or older), n=204
Health status

11
PEATT PILOT PROJECT PENNSYLVANIA DEPARTMENT OF HEALTH
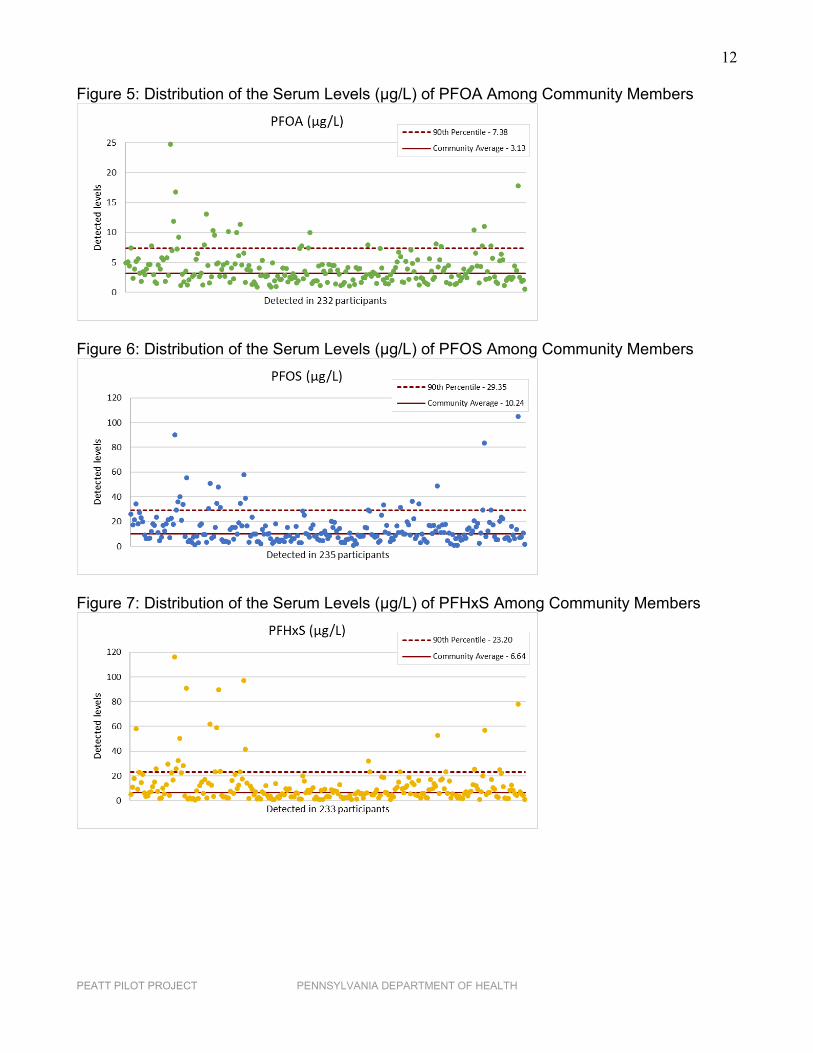
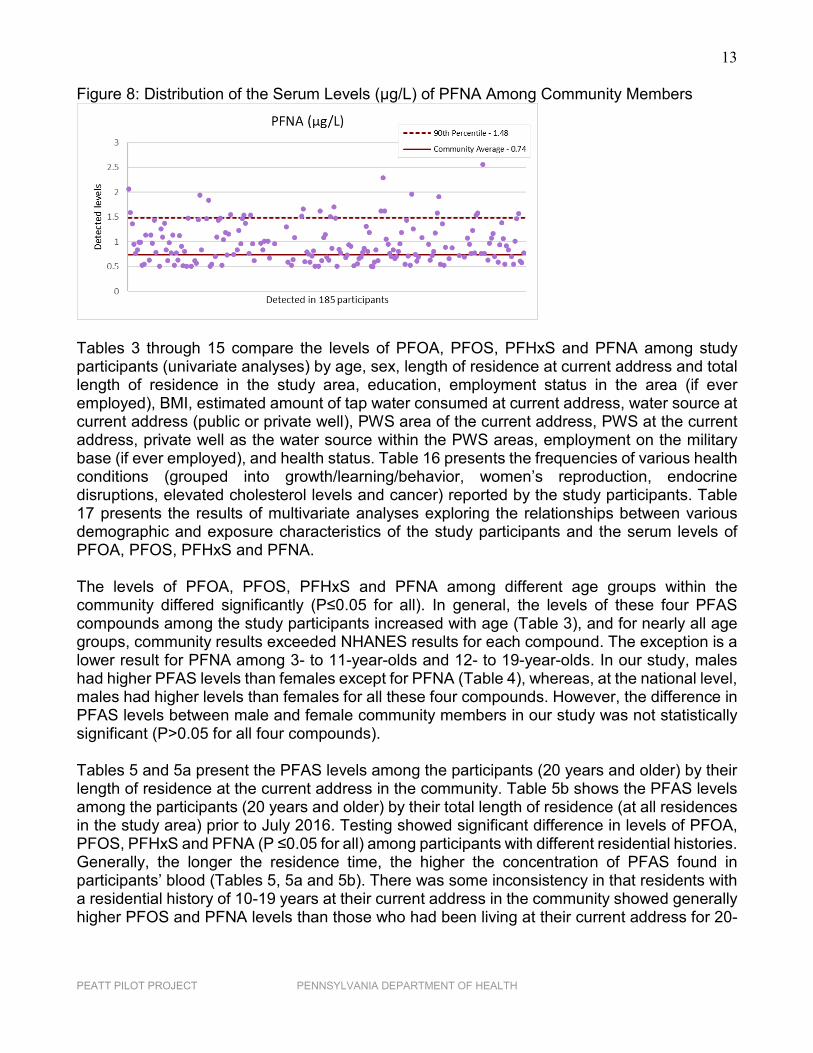
Among the 11 PFAS tested for, only four compounds (PFOS, PFOA, PFHxS and PFNA) were detected consistently. PFOS was detected in all 235 participants. Two hundred and thirty-two, 233 and 185 participants had detectable levels of PFOA, PFHxS and PFNA in their serum samples, respectively. PFOS, PFOA and PFHxS together were detected in 232 of the 235 participants. PFOA, PFOS, PFHxS and PFNA together were detected in 185 of the 235 participants, meaning 79 percent of the residents had all four PFAS compounds in their blood samples. In addition to these four compounds, MeFOSAA and PFDeA were present in nine and 14 participants, respectively. The serum level ranges for the three compounds detected in less than 15 participants were PFDeA (n=14) 0.51-0.90 µg/L, MeFOSAA (n=9) 0.52-1.6 µg/L and PFUA (n=8) 0.51-0.95 µg/L. PFHpA was detected in one participant. PFBuS, PFDoA and PFOSA were not detected in the blood samples of any study participant. Table 2 presents the averages (geometric means), confidence intervals, median and ranges of PFOS, PFOA, PFHxS and PFNA reported in the serum samples of the participants in this study, along with the averages and confidence intervals for these compounds reported at the national level. Overall, 75, 81, 94 and 59 percent of the study participants had levels exceeding the national average for PFOA (1.94 µg/L), PFOS (4.99 µg/L), PFHxS (1.35 µg/L) and PFNA (0.68 µg/L), respectively. Table 2: Selected PFAS Levels (µg/L) in the Community (n=235) and at the National Level*
Source: NHANES: The National Report on Human Exposure to Environmental Chemicals, Updated Tables, Volume 1, March 2018, is available at: https://www.cdc.gov/exposurereport/. *NHANES includes participants aged 12 years and above. NHANES sample sizes were 2,165 for PFOA and PFOS and 2,168 for PFHxS and PFNA. Range excludes values <LOD. The community sample included all participants including children. The average levels of PFOA, PFOS, PFHxS and PFNA among participants of the study were higher than the average levels reported at the national level based on the 2013-2014 NHANES survey. The distributions of serum PFAS levels among community members are presented in Figure 5 to Figure 8. The x-axes in Figure 5 to Figure 8 represent the study participants, and are not in any particular order.
Average 95% Confidence Interval Median Range Average 95% Confidence IntervalPFOA 3.13 2.81-3.50 3.06 0.55-24.8 1.94 1.76-2.14PFOS 10.24 8.86-11.83 9.86 1.02-105.00 4.99 4.50-5.52PFHxS 6.64 5.51-7.99 6.61 0.54-116.00 1.35 1.20-1.52PFNA 0.74 0.67-0.80 0.76 0.50-2.56 0.68 0.61-0.74
NHANES Results (2013-2014)PFAS Compound
Community Results
12
PEATT PILOT PROJECT PENNSYLVANIA DEPARTMENT OF HEALTH
Figure 5: Distribution of the Serum Levels (µg/L) of PFOA Among Community Members
Figure 6: Distribution of the Serum Levels (µg/L) of PFOS Among Community Members
Figure 7: Distribution of the Serum Levels (µg/L) of PFHxS Among Community Members
13
PEATT PILOT PROJECT PENNSYLVANIA DEPARTMENT OF HEALTH
Figure 8: Distribution of the Serum Levels (µg/L) of PFNA Among Community Members
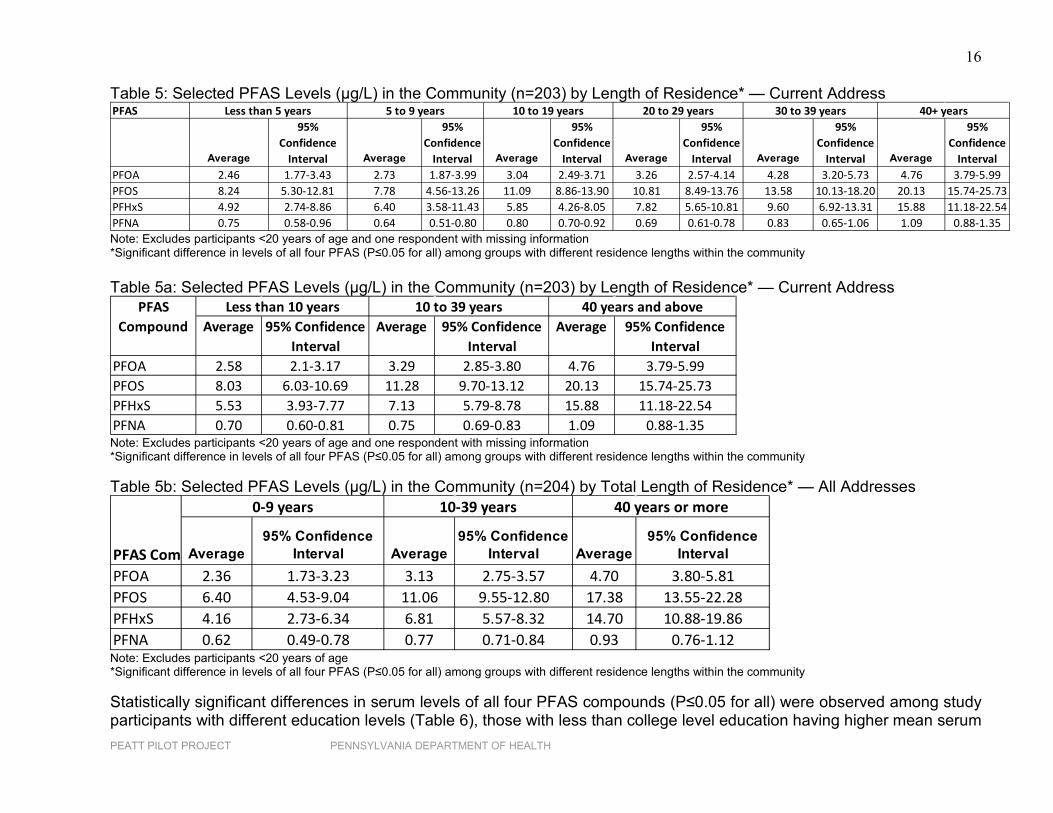
Tables 3 through 15 compare the levels of PFOA, PFOS, PFHxS and PFNA among study participants (univariate analyses) by age, sex, length of residence at current address and total length of residence in the study area, education, employment status in the area (if ever employed), BMI, estimated amount of tap water consumed at current address, water source at current address (public or private well), PWS area of the current address, PWS at the current address, private well as the water source within the PWS areas, employment on the military base (if ever employed), and health status. Table 16 presents the frequencies of various health conditions (grouped into growth/learning/behavior, women’s reproduction, endocrine disruptions, elevated cholesterol levels and cancer) reported by the study participants. Table 17 presents the results of multivariate analyses exploring the relationships between various demographic and exposure characteristics of the study participants and the serum levels of PFOA, PFOS, PFHxS and PFNA. The levels of PFOA, PFOS, PFHxS and PFNA among different age groups within the community differed significantly (P≤0.05 for all). In general, the levels of these four PFAS compounds among the study participants increased with age (Table 3), and for nearly all age groups, community results exceeded NHANES results for each compound. The exception is a lower result for PFNA among 3- to 11-year-olds and 12- to 19-year-olds. In our study, males had higher PFAS levels than females except for PFNA (Table 4), whereas, at the national level, males had higher levels than females for all these four compounds. However, the difference in PFAS levels between male and female community members in our study was not statistically significant (P>0.05 for all four compounds). Tables 5 and 5a present the PFAS levels among the participants (20 years and older) by their length of residence at the current address in the community. Table 5b shows the PFAS levels among the participants (20 years and older) by their total length of residence (at all residences in the study area) prior to July 2016. Testing showed significant difference in levels of PFOA, PFOS, PFHxS and PFNA (P ≤0.05 for all) among participants with different residential histories. Generally, the longer the residence time, the higher the concentration of PFAS found in participants’ blood (Tables 5, 5a and 5b). There was some inconsistency in that residents with a residential history of 10-19 years at their current address in the community showed generally higher PFOS and PFNA levels than those who had been living at their current address for 20-

14
PEATT PILOT PROJECT PENNSYLVANIA DEPARTMENT OF HEALTH
29 years. Those who lived at their current address for less than five years had slightly higher levels of PFOS and PFNA than those with a residential length of five to nine years in their current addresses (Table 5). However, these inconsistencies were not visible when the data were analyzed by grouping the participants into those with less than 10 years, 10-39 years and 40 years or more of residential history at the current address in the community (Table 5a).
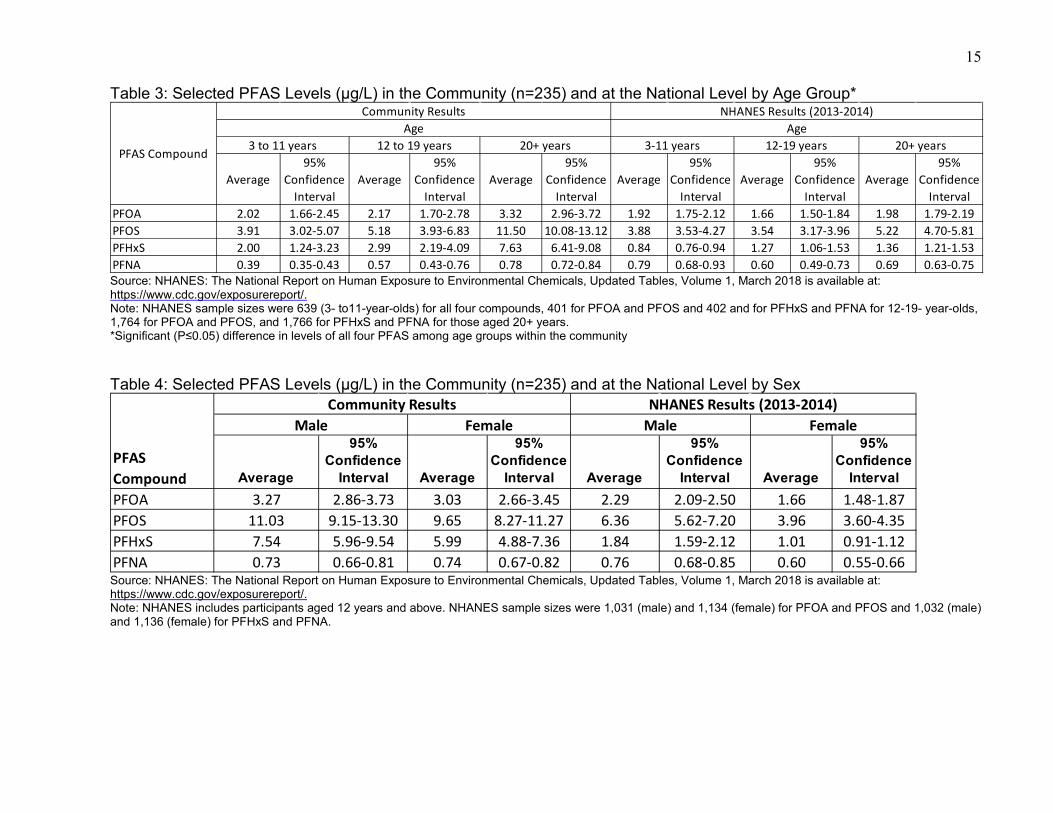
15 Table 3: Selected PFAS Levels (µg/L) in the Community (n=235) and at the National Level by Age Group*
Source: NHANES: The National Report on Human Exposure to Environmental Chemicals, Updated Tables, Volume 1, March 2018 is available at: https://www.cdc.gov/exposurereport/. Note: NHANES sample sizes were 639 (3- to11-year-olds) for all four compounds, 401 for PFOA and PFOS and 402 and for PFHxS and PFNA for 12-19- year-olds, 1,764 for PFOA and PFOS, and 1,766 for PFHxS and PFNA for those aged 20+ years. *Significant (P≤0.05) difference in levels of all four PFAS among age groups within the community Table 4: Selected PFAS Levels (µg/L) in the Community (n=235) and at the National Level by Sex
Source: NHANES: The National Report on Human Exposure to Environmental Chemicals, Updated Tables, Volume 1, March 2018 is available at: https://www.cdc.gov/exposurereport/. Note: NHANES includes participants aged 12 years and above. NHANES sample sizes were 1,031 (male) and 1,134 (female) for PFOA and PFOS and 1,032 (male) and 1,136 (female) for PFHxS and PFNA.
Average95%
Confidence Interval
Average95%
Confidence Interval
Average95%
Confidence Interval
Average95%
Confidence Interval
Average95%
Confidence Interval
Average95%
Confidence Interval
PFOA 2.02 1.66-2.45 2.17 1.70-2.78 3.32 2.96-3.72 1.92 1.75-2.12 1.66 1.50-1.84 1.98 1.79-2.19PFOS 3.91 3.02-5.07 5.18 3.93-6.83 11.50 10.08-13.12 3.88 3.53-4.27 3.54 3.17-3.96 5.22 4.70-5.81PFHxS 2.00 1.24-3.23 2.99 2.19-4.09 7.63 6.41-9.08 0.84 0.76-0.94 1.27 1.06-1.53 1.36 1.21-1.53PFNA 0.39 0.35-0.43 0.57 0.43-0.76 0.78 0.72-0.84 0.79 0.68-0.93 0.60 0.49-0.73 0.69 0.63-0.75
PFAS Compound
Community Results NHANES Results (2013-2014)Age Age
3 to 11 years 12 to 19 years 20+ years 3-11 years 12-19 years 20+ years
Average
95% Confidence
Interval Average
95% Confidence
Interval Average
95% Confidence
Interval Average
95% Confidence
IntervalPFOA 3.27 2.86-3.73 3.03 2.66-3.45 2.29 2.09-2.50 1.66 1.48-1.87PFOS 11.03 9.15-13.30 9.65 8.27-11.27 6.36 5.62-7.20 3.96 3.60-4.35PFHxS 7.54 5.96-9.54 5.99 4.88-7.36 1.84 1.59-2.12 1.01 0.91-1.12PFNA 0.73 0.66-0.81 0.74 0.67-0.82 0.76 0.68-0.85 0.60 0.55-0.66
PFAS Compound
Community Results NHANES Results (2013-2014)Male Female Male Female
16
PEATT PILOT PROJECT PENNSYLVANIA DEPARTMENT OF HEALTH
Table 5: Selected PFAS Levels (µg/L) in the Community (n=203) by Length of Residence* — Current Address
Note: Excludes participants <20 years of age and one respondent with missing information *Significant difference in levels of all four PFAS (P≤0.05 for all) among groups with different residence lengths within the community Table 5a: Selected PFAS Levels (µg/L) in the Community (n=203) by Length of Residence* — Current Address
Note: Excludes participants <20 years of age and one respondent with missing information *Significant difference in levels of all four PFAS (P≤0.05 for all) among groups with different residence lengths within the community Table 5b: Selected PFAS Levels (µg/L) in the Community (n=204) by Total Length of Residence* — All Addresses
Note: Excludes participants <20 years of age *Significant difference in levels of all four PFAS (P≤0.05 for all) among groups with different residence lengths within the community Statistically significant differences in serum levels of all four PFAS compounds (P≤0.05 for all) were observed among study participants with different education levels (Table 6), those with less than college level education having higher mean serum
PFAS
Average
95% Confidence
Interval Average
95% Confidence
Interval Average
95% Confidence
Interval Average
95% Confidence
Interval Average
95% Confidence
Interval Average
95% Confidence
IntervalPFOA 2.46 1.77-3.43 2.73 1.87-3.99 3.04 2.49-3.71 3.26 2.57-4.14 4.28 3.20-5.73 4.76 3.79-5.99PFOS 8.24 5.30-12.81 7.78 4.56-13.26 11.09 8.86-13.90 10.81 8.49-13.76 13.58 10.13-18.20 20.13 15.74-25.73PFHxS 4.92 2.74-8.86 6.40 3.58-11.43 5.85 4.26-8.05 7.82 5.65-10.81 9.60 6.92-13.31 15.88 11.18-22.54PFNA 0.75 0.58-0.96 0.64 0.51-0.80 0.80 0.70-0.92 0.69 0.61-0.78 0.83 0.65-1.06 1.09 0.88-1.35
40+ years30 to 39 yearsLess than 5 years 5 to 9 years 10 to 19 years 20 to 29 years
Average 95% Confidence Interval
Average 95% Confidence Interval
Average 95% Confidence Interval
PFOA 2.58 2.1-3.17 3.29 2.85-3.80 4.76 3.79-5.99PFOS 8.03 6.03-10.69 11.28 9.70-13.12 20.13 15.74-25.73PFHxS 5.53 3.93-7.77 7.13 5.79-8.78 15.88 11.18-22.54PFNA 0.70 0.60-0.81 0.75 0.69-0.83 1.09 0.88-1.35
Less than 10 years 10 to 39 years 40 years and abovePFAS Compound
Average95% Confidence
Interval Average95% Confidence
Interval Average95% Confidence
IntervalPFOA 2.36 1.73-3.23 3.13 2.75-3.57 4.70 3.80-5.81PFOS 6.40 4.53-9.04 11.06 9.55-12.80 17.38 13.55-22.28PFHxS 4.16 2.73-6.34 6.81 5.57-8.32 14.70 10.88-19.86PFNA 0.62 0.49-0.78 0.77 0.71-0.84 0.93 0.76-1.12
40 years or more
PFAS Com
0-9 years 10-39 years
17
PEATT PILOT PROJECT PENNSYLVANIA DEPARTMENT OF HEALTH
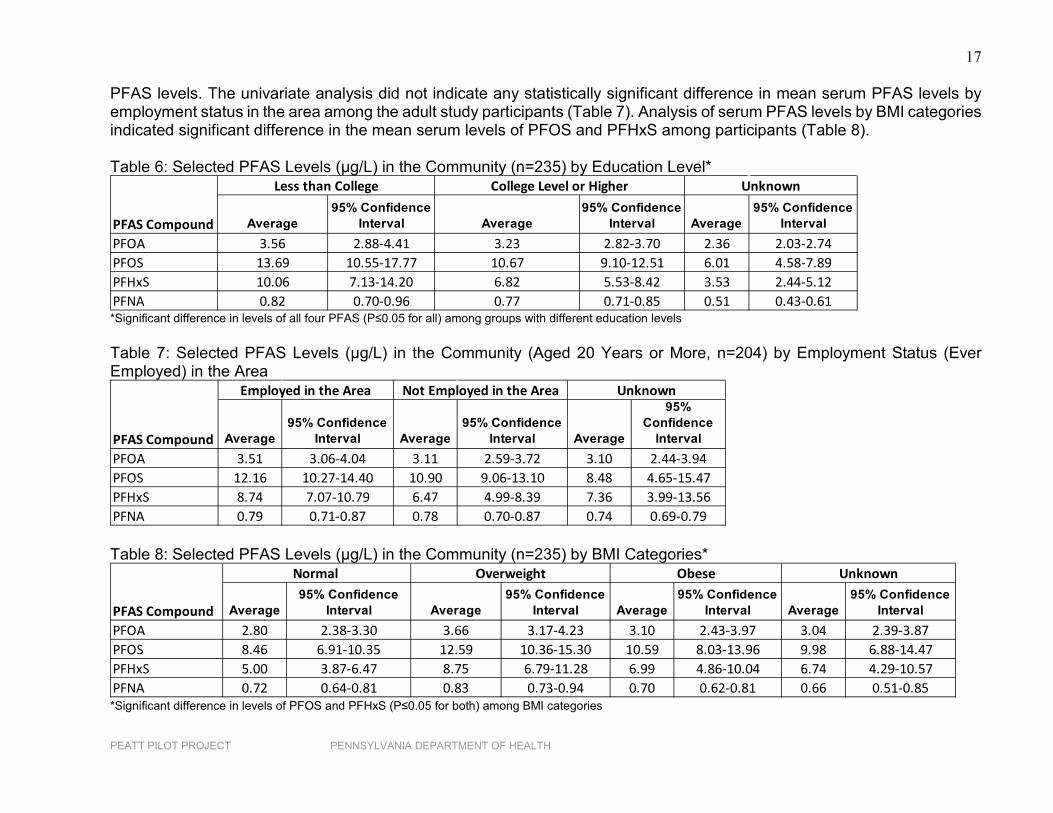
PFAS levels. The univariate analysis did not indicate any statistically significant difference in mean serum PFAS levels by employment status in the area among the adult study participants (Table 7). Analysis of serum PFAS levels by BMI categories indicated significant difference in the mean serum levels of PFOS and PFHxS among participants (Table 8). Table 6: Selected PFAS Levels (µg/L) in the Community (n=235) by Education Level*
*Significant difference in levels of all four PFAS (P≤0.05 for all) among groups with different education levels Table 7: Selected PFAS Levels (µg/L) in the Community (Aged 20 Years or More, n=204) by Employment Status (Ever Employed) in the Area
Table 8: Selected PFAS Levels (µg/L) in the Community (n=235) by BMI Categories*
*Significant difference in levels of PFOS and PFHxS (P≤0.05 for both) among BMI categories
Average95% Confidence
Interval Average95% Confidence
Interval Average95% Confidence
IntervalPFOA 3.56 2.88-4.41 3.23 2.82-3.70 2.36 2.03-2.74PFOS 13.69 10.55-17.77 10.67 9.10-12.51 6.01 4.58-7.89PFHxS 10.06 7.13-14.20 6.82 5.53-8.42 3.53 2.44-5.12PFNA 0.82 0.70-0.96 0.77 0.71-0.85 0.51 0.43-0.61
Unknown
PFAS Compound
Less than College College Level or Higher
Average95% Confidence
Interval Average95% Confidence
Interval Average
95% Confidence
IntervalPFOA 3.51 3.06-4.04 3.11 2.59-3.72 3.10 2.44-3.94PFOS 12.16 10.27-14.40 10.90 9.06-13.10 8.48 4.65-15.47PFHxS 8.74 7.07-10.79 6.47 4.99-8.39 7.36 3.99-13.56PFNA 0.79 0.71-0.87 0.78 0.70-0.87 0.74 0.69-0.79
Not Employed in the Area Unknown
PFAS Compound
Employed in the Area
Average95% Confidence
Interval Average95% Confidence
Interval Average95% Confidence
Interval Average95% Confidence
IntervalPFOA 2.80 2.38-3.30 3.66 3.17-4.23 3.10 2.43-3.97 3.04 2.39-3.87PFOS 8.46 6.91-10.35 12.59 10.36-15.30 10.59 8.03-13.96 9.98 6.88-14.47PFHxS 5.00 3.87-6.47 8.75 6.79-11.28 6.99 4.86-10.04 6.74 4.29-10.57PFNA 0.72 0.64-0.81 0.83 0.73-0.94 0.70 0.62-0.81 0.66 0.51-0.85
Obese Unknown
PFAS Compound
Normal Overweight
18
PEATT PILOT PROJECT PENNSYLVANIA DEPARTMENT OF HEALTH
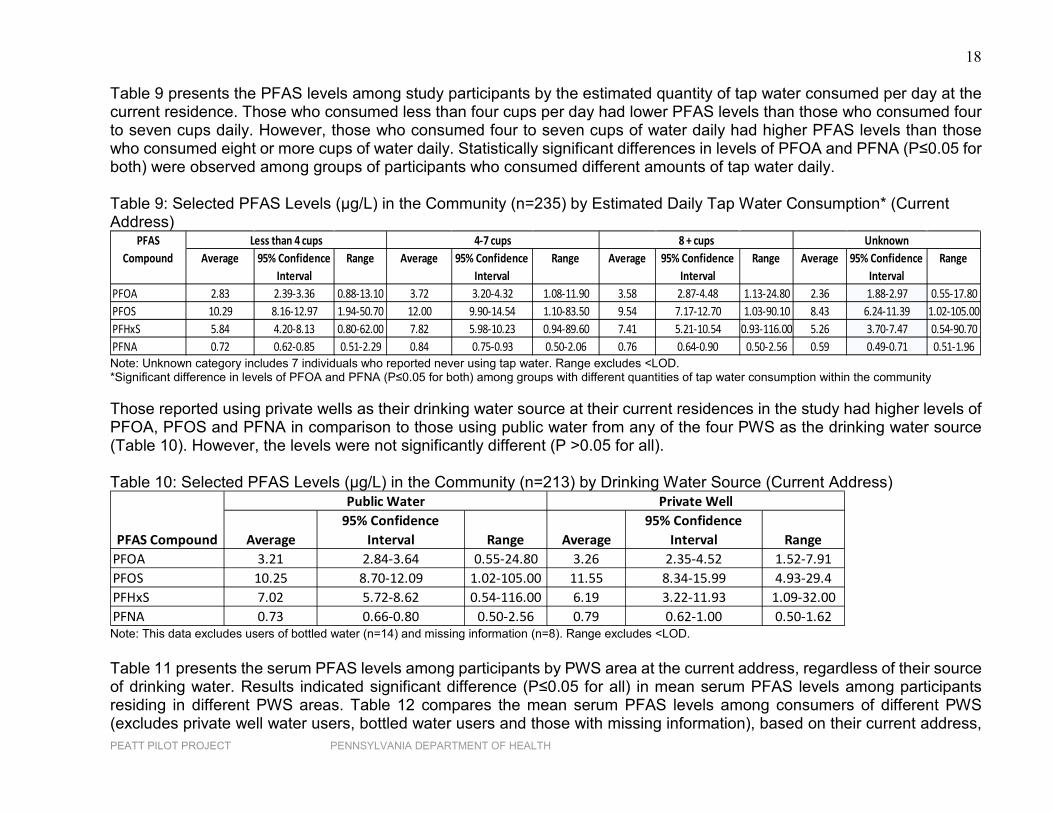
Table 9 presents the PFAS levels among study participants by the estimated quantity of tap water consumed per day at the current residence. Those who consumed less than four cups per day had lower PFAS levels than those who consumed four to seven cups daily. However, those who consumed four to seven cups of water daily had higher PFAS levels than those who consumed eight or more cups of water daily. Statistically significant differences in levels of PFOA and PFNA (P≤0.05 for both) were observed among groups of participants who consumed different amounts of tap water daily. Table 9: Selected PFAS Levels (µg/L) in the Community (n=235) by Estimated Daily Tap Water Consumption* (Current Address)
Note: Unknown category includes 7 individuals who reported never using tap water. Range excludes <LOD. *Significant difference in levels of PFOA and PFNA (P≤0.05 for both) among groups with different quantities of tap water consumption within the community Those reported using private wells as their drinking water source at their current residences in the study had higher levels of PFOA, PFOS and PFNA in comparison to those using public water from any of the four PWS as the drinking water source (Table 10). However, the levels were not significantly different (P >0.05 for all). Table 10: Selected PFAS Levels (µg/L) in the Community (n=213) by Drinking Water Source (Current Address)
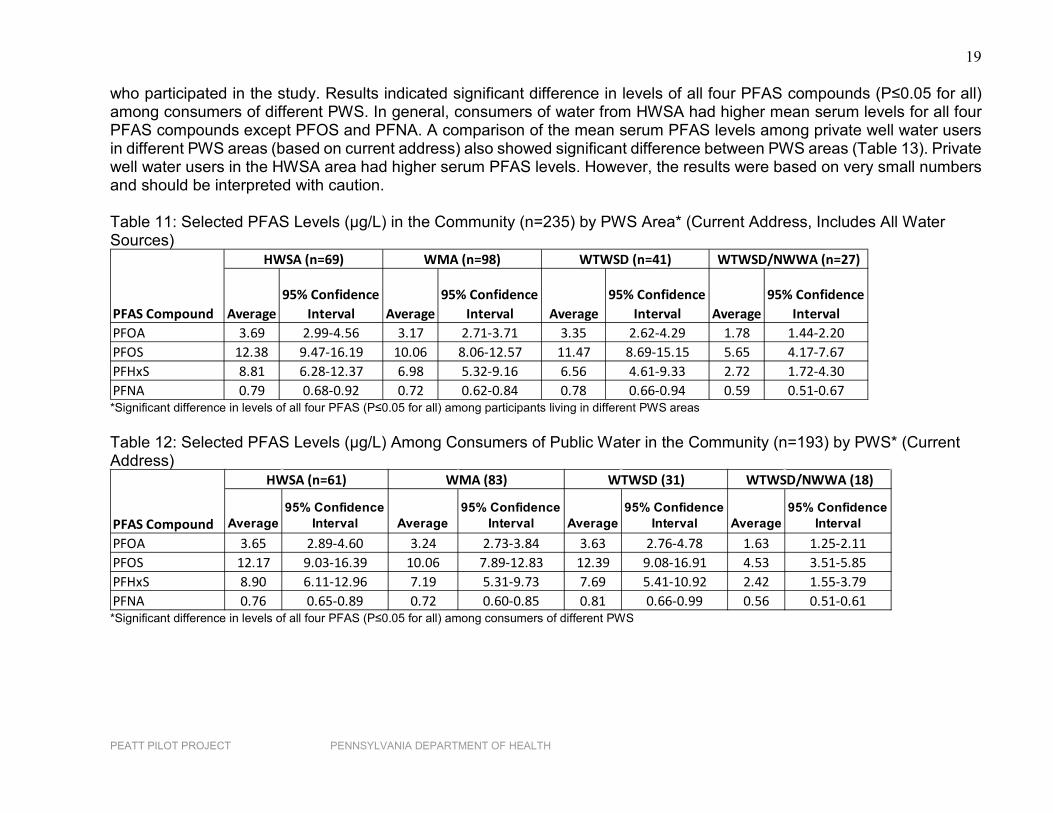
Note: This data excludes users of bottled water (n=14) and missing information (n=8). Range excludes <LOD. Table 11 presents the serum PFAS levels among participants by PWS area at the current address, regardless of their source of drinking water. Results indicated significant difference (P≤0.05 for all) in mean serum PFAS levels among participants residing in different PWS areas. Table 12 compares the mean serum PFAS levels among consumers of different PWS (excludes private well water users, bottled water users and those with missing information), based on their current address,
Average 95% Confidence Interval
Range Average 95% Confidence Interval
Range Average 95% Confidence Interval
Range Average 95% Confidence Interval
Range
PFOA 2.83 2.39-3.36 0.88-13.10 3.72 3.20-4.32 1.08-11.90 3.58 2.87-4.48 1.13-24.80 2.36 1.88-2.97 0.55-17.80PFOS 10.29 8.16-12.97 1.94-50.70 12.00 9.90-14.54 1.10-83.50 9.54 7.17-12.70 1.03-90.10 8.43 6.24-11.39 1.02-105.00PFHxS 5.84 4.20-8.13 0.80-62.00 7.82 5.98-10.23 0.94-89.60 7.41 5.21-10.54 0.93-116.00 5.26 3.70-7.47 0.54-90.70PFNA 0.72 0.62-0.85 0.51-2.29 0.84 0.75-0.93 0.50-2.06 0.76 0.64-0.90 0.50-2.56 0.59 0.49-0.71 0.51-1.96
Less than 4 cupsPFAS Compound
Unknown8 + cups4-7 cups
Average95% Confidence
Interval Range Average95% Confidence
Interval RangePFOA 3.21 2.84-3.64 0.55-24.80 3.26 2.35-4.52 1.52-7.91PFOS 10.25 8.70-12.09 1.02-105.00 11.55 8.34-15.99 4.93-29.4PFHxS 7.02 5.72-8.62 0.54-116.00 6.19 3.22-11.93 1.09-32.00PFNA 0.73 0.66-0.80 0.50-2.56 0.79 0.62-1.00 0.50-1.62
Public Water Private Well
PFAS Compound
19
PEATT PILOT PROJECT PENNSYLVANIA DEPARTMENT OF HEALTH
who participated in the study. Results indicated significant difference in levels of all four PFAS compounds (P≤0.05 for all) among consumers of different PWS. In general, consumers of water from HWSA had higher mean serum levels for all four PFAS compounds except PFOS and PFNA. A comparison of the mean serum PFAS levels among private well water users in different PWS areas (based on current address) also showed significant difference between PWS areas (Table 13). Private well water users in the HWSA area had higher serum PFAS levels. However, the results were based on very small numbers and should be interpreted with caution. Table 11: Selected PFAS Levels (µg/L) in the Community (n=235) by PWS Area* (Current Address, Includes All Water Sources)
*Significant difference in levels of all four PFAS (P≤0.05 for all) among participants living in different PWS areas Table 12: Selected PFAS Levels (µg/L) Among Consumers of Public Water in the Community (n=193) by PWS* (Current Address)
*Significant difference in levels of all four PFAS (P≤0.05 for all) among consumers of different PWS
Average95% Confidence
Interval Average95% Confidence
Interval Average95% Confidence
Interval Average95% Confidence
IntervalPFOA 3.69 2.99-4.56 3.17 2.71-3.71 3.35 2.62-4.29 1.78 1.44-2.20PFOS 12.38 9.47-16.19 10.06 8.06-12.57 11.47 8.69-15.15 5.65 4.17-7.67PFHxS 8.81 6.28-12.37 6.98 5.32-9.16 6.56 4.61-9.33 2.72 1.72-4.30PFNA 0.79 0.68-0.92 0.72 0.62-0.84 0.78 0.66-0.94 0.59 0.51-0.67
HWSA (n=69) WMA (n=98) WTWSD (n=41) WTWSD/NWWA (n=27)
PFAS Compound
Average95% Confidence
Interval Average95% Confidence
Interval Average95% Confidence
Interval Average95% Confidence
IntervalPFOA 3.65 2.89-4.60 3.24 2.73-3.84 3.63 2.76-4.78 1.63 1.25-2.11PFOS 12.17 9.03-16.39 10.06 7.89-12.83 12.39 9.08-16.91 4.53 3.51-5.85PFHxS 8.90 6.11-12.96 7.19 5.31-9.73 7.69 5.41-10.92 2.42 1.55-3.79PFNA 0.76 0.65-0.89 0.72 0.60-0.85 0.81 0.66-0.99 0.56 0.51-0.61
PFAS Compound
HWSA (n=61) WMA (83) WTWSD (31) WTWSD/NWWA (18)
20
PEATT PILOT PROJECT PENNSYLVANIA DEPARTMENT OF HEALTH
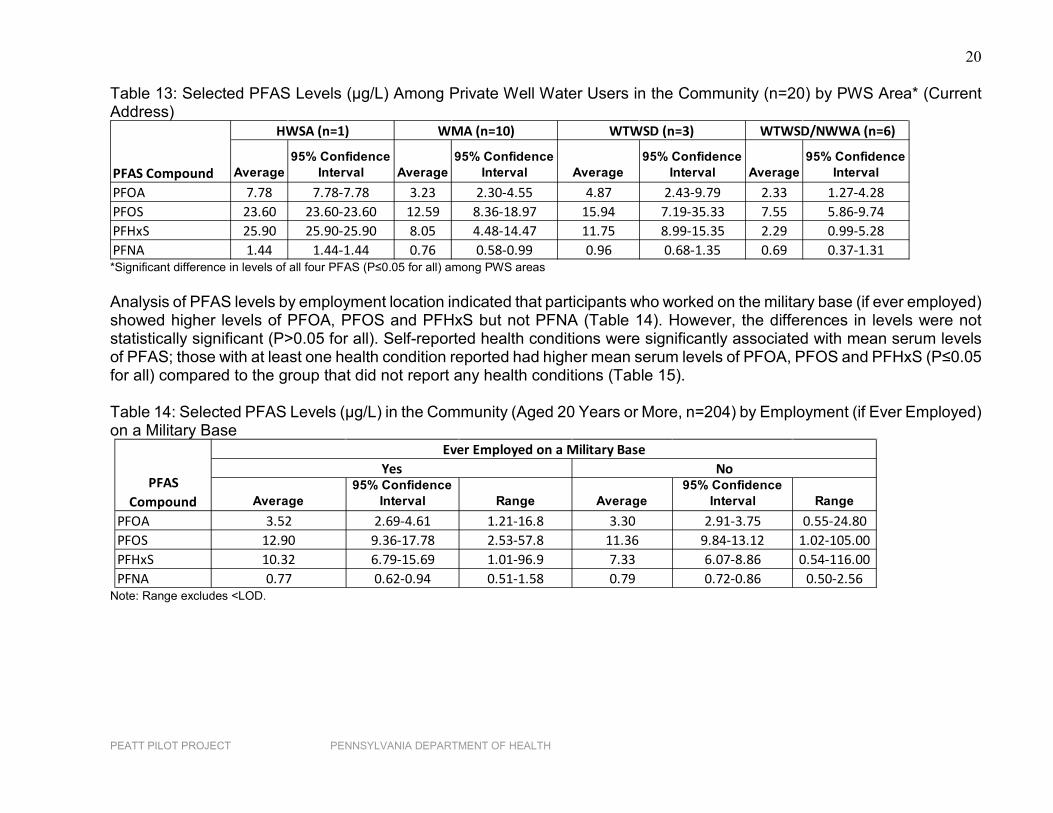
Table 13: Selected PFAS Levels (µg/L) Among Private Well Water Users in the Community (n=20) by PWS Area* (Current Address)
*Significant difference in levels of all four PFAS (P≤0.05 for all) among PWS areas Analysis of PFAS levels by employment location indicated that participants who worked on the military base (if ever employed) showed higher levels of PFOA, PFOS and PFHxS but not PFNA (Table 14). However, the differences in levels were not statistically significant (P>0.05 for all). Self-reported health conditions were significantly associated with mean serum levels of PFAS; those with at least one health condition reported had higher mean serum levels of PFOA, PFOS and PFHxS (P≤0.05 for all) compared to the group that did not report any health conditions (Table 15). Table 14: Selected PFAS Levels (µg/L) in the Community (Aged 20 Years or More, n=204) by Employment (if Ever Employed) on a Military Base
Note: Range excludes <LOD.
Average95% Confidence
Interval Average95% Confidence
Interval Average95% Confidence
Interval Average95% Confidence
IntervalPFOA 7.78 7.78-7.78 3.23 2.30-4.55 4.87 2.43-9.79 2.33 1.27-4.28PFOS 23.60 23.60-23.60 12.59 8.36-18.97 15.94 7.19-35.33 7.55 5.86-9.74PFHxS 25.90 25.90-25.90 8.05 4.48-14.47 11.75 8.99-15.35 2.29 0.99-5.28PFNA 1.44 1.44-1.44 0.76 0.58-0.99 0.96 0.68-1.35 0.69 0.37-1.31
HWSA (n=1) WMA (n=10) WTWSD (n=3) WTWSD/NWWA (n=6)
PFAS Compound
Average95% Confidence
Interval Range Average95% Confidence
Interval RangePFOA 3.52 2.69-4.61 1.21-16.8 3.30 2.91-3.75 0.55-24.80PFOS 12.90 9.36-17.78 2.53-57.8 11.36 9.84-13.12 1.02-105.00PFHxS 10.32 6.79-15.69 1.01-96.9 7.33 6.07-8.86 0.54-116.00PFNA 0.77 0.62-0.94 0.51-1.58 0.79 0.72-0.86 0.50-2.56
PFAS Compound
Ever Employed on a Military BaseYes No
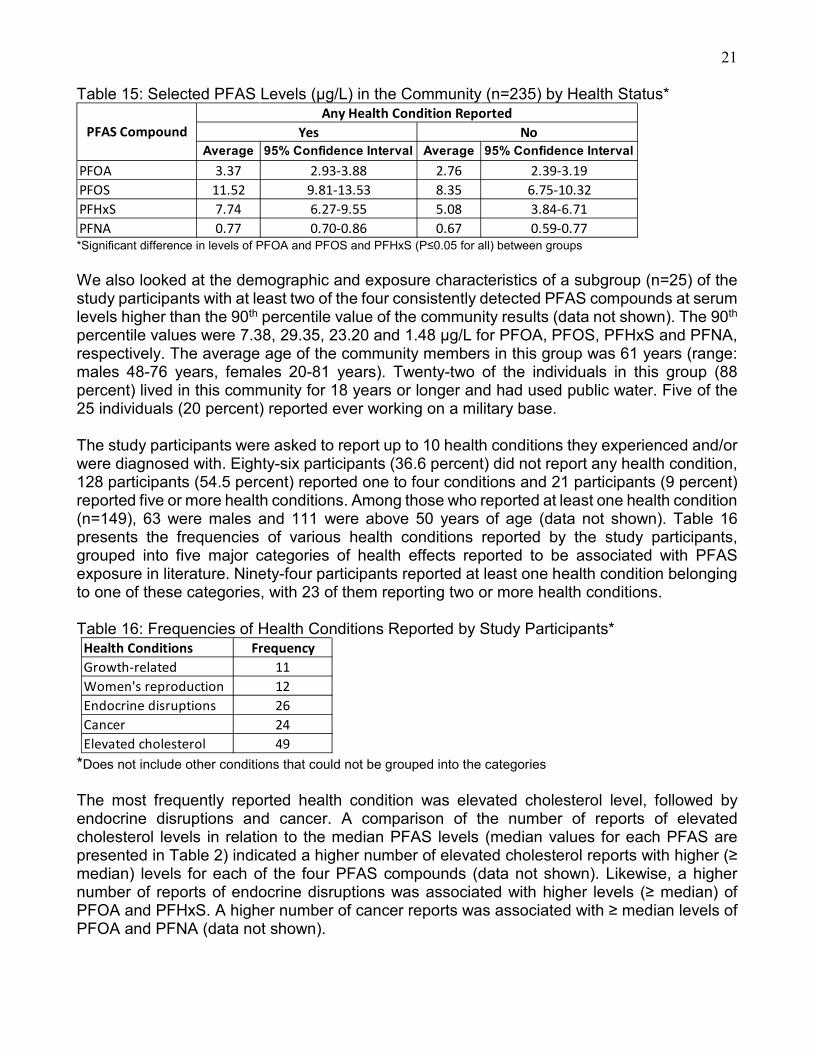
21 Table 15: Selected PFAS Levels (µg/L) in the Community (n=235) by Health Status*
*Significant difference in levels of PFOA and PFOS and PFHxS (P≤0.05 for all) between groups We also looked at the demographic and exposure characteristics of a subgroup (n=25) of the study participants with at least two of the four consistently detected PFAS compounds at serum levels higher than the 90th percentile value of the community results (data not shown). The 90th percentile values were 7.38, 29.35, 23.20 and 1.48 µg/L for PFOA, PFOS, PFHxS and PFNA, respectively. The average age of the community members in this group was 61 years (range: males 48-76 years, females 20-81 years). Twenty-two of the individuals in this group (88 percent) lived in this community for 18 years or longer and had used public water. Five of the 25 individuals (20 percent) reported ever working on a military base. The study participants were asked to report up to 10 health conditions they experienced and/or were diagnosed with. Eighty-six participants (36.6 percent) did not report any health condition, 128 participants (54.5 percent) reported one to four conditions and 21 participants (9 percent) reported five or more health conditions. Among those who reported at least one health condition (n=149), 63 were males and 111 were above 50 years of age (data not shown). Table 16 presents the frequencies of various health conditions reported by the study participants, grouped into five major categories of health effects reported to be associated with PFAS exposure in literature. Ninety-four participants reported at least one health condition belonging to one of these categories, with 23 of them reporting two or more health conditions. Table 16: Frequencies of Health Conditions Reported by Study Participants*
*Does not include other conditions that could not be grouped into the categories The most frequently reported health condition was elevated cholesterol level, followed by endocrine disruptions and cancer. A comparison of the number of reports of elevated cholesterol levels in relation to the median PFAS levels (median values for each PFAS are presented in Table 2) indicated a higher number of elevated cholesterol reports with higher (≥ median) levels for each of the four PFAS compounds (data not shown). Likewise, a higher number of reports of endocrine disruptions was associated with higher levels (≥ median) of PFOA and PFHxS. A higher number of cancer reports was associated with ≥ median levels of PFOA and PFNA (data not shown).
Average 95% Confidence Interval Average 95% Confidence IntervalPFOA 3.37 2.93-3.88 2.76 2.39-3.19PFOS 11.52 9.81-13.53 8.35 6.75-10.32PFHxS 7.74 6.27-9.55 5.08 3.84-6.71PFNA 0.77 0.70-0.86 0.67 0.59-0.77
Any Health Condition ReportedPFAS Compound Yes No
Health Conditions FrequencyGrowth-related 11Women's reproduction 12Endocrine disruptions 26Cancer 24Elevated cholesterol 49
22
PEATT PILOT PROJECT PENNSYLVANIA DEPARTMENT OF HEALTH
Multivariate linear regression analysis Although significant differences were found in the above analyses in PFAS levels among various demographic and exposure categories, each of these analyses evaluated only one characteristic at a time, not accounting for the possible confounding effects of other characteristics. It is possible that characteristics may interact, modifying the outcome (i.e., serum PFAS levels). Therefore, it is important to include all characteristics simultaneously in a multivariate analysis to understand how different demographic and exposure characteristics influence serum PFAS levels. Given the small number of children in our study, multivariate analyses were performed using information pertaining only to the adult participants of the study. Analyses were performed for each of the four consistently detected PFAS compounds (PFOA, PFOS, PFHxS and PFNA). Table 17 presents the variables and categories, regression estimate, percentage changes in serum levels in relation to the reference level, and the corresponding levels of statistical significance. In these multivariate linear regression models, the following predictor variables were included in simultaneous analysis: sex (male, female), education (college level or higher, other, less than college level), health status (health condition reported or not), ever employed in the area (yes, no, other), employment on a military base (yes, no), drinking water source at the current address (HWSA, WMA, WTWSD and WTWSD/NWWA, private well, other), total length of residence in the study area at all addresses (0-9 years, 10-19 years, 20-29 years, 30-39 years, 40 years or more), BMI (normal weight, over-weight, obese, other), daily tap water consumption at current residence (0-3 cups, 4-7 cups, 8 cups or more and unknown), and age (20-34 years, 35-49 years, 50-64 years and 65 years or more). Log-transformed PFAS serum levels were used in these analyses as the response variable.
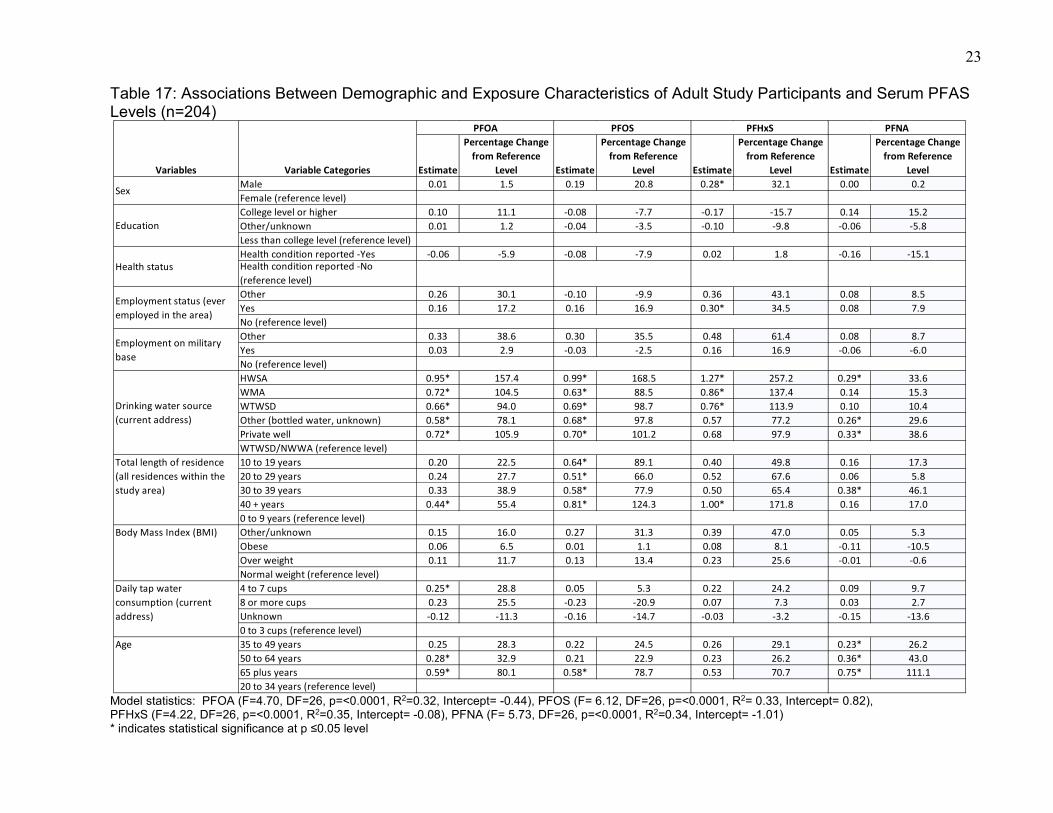
23 Table 17: Associations Between Demographic and Exposure Characteristics of Adult Study Participants and Serum PFAS Levels (n=204)
Model statistics: PFOA (F=4.70, DF=26, p=<0.0001, R2=0.32, Intercept= -0.44), PFOS (F= 6.12, DF=26, p=<0.0001, R2= 0.33, Intercept= 0.82), PFHxS (F=4.22, DF=26, p=<0.0001, R2=0.35, Intercept= -0.08), PFNA (F= 5.73, DF=26, p=<0.0001, R2=0.34, Intercept= -1.01) * indicates statistical significance at p ≤0.05 level
Estimate
Percentage Change from Reference
Level Estimate
Percentage Change from Reference
Level Estimate
Percentage Change from Reference
Level Estimate
Percentage Change from Reference
LevelMale 0.01 1.5 0.19 20.8 0.28* 32.1 0.00 0.2Female (reference level)College level or higher 0.10 11.1 -0.08 -7.7 -0.17 -15.7 0.14 15.2Other/unknown 0.01 1.2 -0.04 -3.5 -0.10 -9.8 -0.06 -5.8Less than college level (reference level)Health condition reported -Yes -0.06 -5.9 -0.08 -7.9 0.02 1.8 -0.16 -15.1Health condition reported -No (reference level)Other 0.26 30.1 -0.10 -9.9 0.36 43.1 0.08 8.5Yes 0.16 17.2 0.16 16.9 0.30* 34.5 0.08 7.9No (reference level)Other 0.33 38.6 0.30 35.5 0.48 61.4 0.08 8.7Yes 0.03 2.9 -0.03 -2.5 0.16 16.9 -0.06 -6.0No (reference level)HWSA 0.95* 157.4 0.99* 168.5 1.27* 257.2 0.29* 33.6WMA 0.72* 104.5 0.63* 88.5 0.86* 137.4 0.14 15.3WTWSD 0.66* 94.0 0.69* 98.7 0.76* 113.9 0.10 10.4Other (bottled water, unknown) 0.58* 78.1 0.68* 97.8 0.57 77.2 0.26* 29.6Private well 0.72* 105.9 0.70* 101.2 0.68 97.9 0.33* 38.6WTWSD/NWWA (reference level)10 to 19 years 0.20 22.5 0.64* 89.1 0.40 49.8 0.16 17.320 to 29 years 0.24 27.7 0.51* 66.0 0.52 67.6 0.06 5.830 to 39 years 0.33 38.9 0.58* 77.9 0.50 65.4 0.38* 46.140 + years 0.44* 55.4 0.81* 124.3 1.00* 171.8 0.16 17.00 to 9 years (reference level)Other/unknown 0.15 16.0 0.27 31.3 0.39 47.0 0.05 5.3Obese 0.06 6.5 0.01 1.1 0.08 8.1 -0.11 -10.5Over weight 0.11 11.7 0.13 13.4 0.23 25.6 -0.01 -0.6Normal weight (reference level)4 to 7 cups 0.25* 28.8 0.05 5.3 0.22 24.2 0.09 9.78 or more cups 0.23 25.5 -0.23 -20.9 0.07 7.3 0.03 2.7Unknown -0.12 -11.3 -0.16 -14.7 -0.03 -3.2 -0.15 -13.60 to 3 cups (reference level)35 to 49 years 0.25 28.3 0.22 24.5 0.26 29.1 0.23* 26.250 to 64 years 0.28* 32.9 0.21 22.9 0.23 26.2 0.36* 43.065 plus years 0.59* 80.1 0.58* 78.7 0.53 70.7 0.75* 111.120 to 34 years (reference level)
PFOA PFOS PFHxS PFNA
Variables Variable Categories
Age
Sex
Education
Health status
Employment status (ever employed in the area)
Employment on military base
Total length of residence (all residences within the study area)
Body Mass Index (BMI)
Daily tap water consumption (current address)
Drinking water source (current address)
24 No statistically significant interactions among the variables were observed. Drinking water source at current address and total length of residence in the study area were the only variables significantly associated with serum levels of all four PFAS compounds analyzed (Table 17) in all four multivariate linear regression models, after adjusting for other variables. In general, the mean serum PFAS levels were lower for those whose drinking water source (at current address) was the PWS farthest from the military base. Consumers of water from HWSA had higher (P≤0.05 for all) mean serum levels (geometric mean) for PFOA (157 percent higher), PFOS (169 percent higher), PFHxS (257 percent higher) and PFNA (34 percent higher) than the comparison group, consumers of water from WTWSD/NWWA, the PWS area located farther away from base. Those who reported having WMA and WTWSD as the water source at their current address had higher (P≤0.05 for all) mean serum levels of PFOA (105 and 94 percent higher, respectively), PFOS (89 and 99 percent higher, respectively) and PFHxS (137 and 114 percent higher, respectively) compared to the consumers of WTWSD/NWWA. Likewise, the other category (which included 14 bottled water users and eight participants with unknown water source) and private well water users had higher (P≤0.05 for all) mean serum levels of PFOA (78 and 106 percent higher, respectively), PFOS (98 and 101 percent higher, respectively) and PFNA (30 and 39 percent higher, respectively) than the comparison group, consumers of WTWSD/NWWA, while controlling for other study variables. Those with a total residential length of 10 years or more in the study area had higher mean serum levels of PFOS than those with less than 10 years of residential history in the study area, specifically, 89, 66, 78 and 124 percent higher (P≤0.05 for all) mean serum PFOS levels for those with 10 to 19 years, 20 to 29 years, 30 to 39 years and 40 years or more of residence, respectively. A similar association was observed for mean serum PFHxS levels, though the increase in mean serum PFHxS level was significant (P≤0.05) only for those with a total residential length of 20-29 years (68 percent) and 40 years or more (172 percent). Likewise, those with a total residential length of 40 years or more in the study area had a 55 percent higher (P≤0.05) mean serum PFOA level, and those with a total residential length of 30-39 years in the area had a 46 percent higher (P≤0.05) mean serum PFNA level than the comparison group, those with a total residential length of less than 10 years in the area. Men had higher mean serum levels of PFHxS (32 percent higher) than women (P≤0.05), while adjusting for the effects of other variables. Those who reported being ever employed in the study area had 35 percent higher (P≤0.05) mean serum PFHxS levels than those who responded as not ever being employed in the study area. Quantity of tap water consumed per day at the current residence was positively associated with mean serum PFOA level; those consuming 4-7 cups daily had a 29 percent higher (P≤0.05) mean serum level compared to those consuming 0-3 cups daily. Age was another variable significantly associated with serum levels of PFOA, PFOS and PFNA with respect to the comparison group, 20-34-year-old participants. Those ages 65 years or more had 80, 79 and 111 percent higher mean serum levels of PFOA, PFOS and PFNA, respectively, than those in the 20 to 34-year old comparison group (P≤0.05 for all). Participants in the age group 50 to 64 years had a 33 percent higher (P≤0.05) mean serum PFOA level and a 43 percent higher mean serum PFNA level than the comparison group. Those in the age
25
PEATT PILOT PROJECT PENNSYLVANIA DEPARTMENT OF HEALTH
group of 35 to 49 years also had a higher (26 percent higher, p≤0.05) mean serum PFNA level than the comparison group. Other variables, such as education level, health status, employment on a military base and BMI, were not found to be significantly associated with serum PFAS levels in the multivariate analyses.
Discussion Elevated levels of PFAS observed among the community members in the current study are comparable to levels reported in other communities with PFAS contaminated drinking water. New Hampshire residents exposed to drinking water contaminated with PFAS from a nearby military base showed an average community serum level of 3.1 µg/L for PFOA, 8.6 µg/L for PFOS and 4.1 µg/L for PFHxS in 2015 (Daly et al., 2018). In 2009, Minnesota residents exposed to drinking water contaminated with PFAS from industrial sources had average community serum levels of 15.4, 35.9 and 8.4 µg/L for PFOA, PFOS and PFHxS, respectively (Landsteiner et al., 2014). The PFAS compounds consistently found in our community study are also similar to the ones reported in these studies. PFNA was another compound detected consistently in our study. A comparison of PFAS levels among age groups showed that levels of PFOA, PFOS, PFHxS and PFNA increased with age (Table 3). This is consistent with other studies (e.g., Landsteiner et al., 2014) that examined PFAS levels by age category, particularly for PFOS. However, some studies (e.g., Eriksson et al., 2017) have shown higher levels of PFOA in younger age groups. In contrast to the levels and pattern reported nationally, the levels of PFOS and PFHxS in the current study increased dramatically with increasing age. The multivariate analyses also indicated a significant positive association between age and serum levels of PFOA, PFOS and PFNA (Table 17). In our study, males had higher PFAS levels than females except for PFNA (Table 4), though the differences were not statistically significant in univariate analysis involving all participants including children. Also, at the national level the difference in PFAS levels among males and females was more marked than levels observed in the current study. The multivariate analysis including only the adult participants indicated significantly higher serum levels of PFHxS among males (Table 17). Other studies (Jain, 2018., Daly et al., 2018., Landsteiner et al., 2014) have also reported higher PFAS levels among males. The lower levels found in females is often attributed to female elimination routes such as breast feeding and menstruation. Our results indicated a strong association between participants’ length of residence at the current address and PFAS serum levels (Table 5), with longer residence time corresponding to higher PFAS concentrations in participants’ blood in general. Exceptions were the groups with less than five years of residential history and those with 10-19 years having higher levels of PFOS and PFNA than groups with 5-9 and 20-29 years of residential history, respectively — an inconsistency that disappeared when residential length at current address was regrouped to represent the groups with shorter versus longer residential histories (Table 5a). A similar relationship with mean serum PFAS levels was observed when analysis using total length of residence (sum of the residential lengths at all addresses within the study area prior to July
26
PEATT PILOT PROJECT PENNSYLVANIA DEPARTMENT OF HEALTH
2016) in the study area was completed (Table 5b). The multivariate analyses, including total length of residence within the study area, indicated an increase in mean serum PFOS levels with an increase in total residential length (Table 17). Although the associations between serum PFAS levels and the total length of residence in the study area were positive in the multivariate analyses, only a few were statistically significant. A positive association between serum PFAS levels and time spent in the community had previously been reported (Landsteiner et al., 2014., Daly et al., 2018). Another variable that was significantly associated with all of the four PFAS compunds included in the multivariate analysis was the drinking water source at the current residence. Consumers of water from the PWS that was closer to the military base (HWSA) had significantly higher mean serum levels for all four compunds compared to the comparison group, consumers of water from the PWS in the study area farthest away from the base (WTWSD/NWWA), even after controlling for other demographic and exposure characteristics. More information about the location of the PWS wells and other relevant geological and exposure information is needed to better understand the observed relationships. Our univariate analysis indicated private well water users had higher mean serum levels for all four PFAS compounds analyzed (except PFHxS [Table 10]) than public water users. Our univariate analysis of the serum PFAS levels among study participants in the areas of the four PWS, based on their current address (Table 11), which included users of public water, private well and bottled water, also indicated lowest levels among participants in the WTWSD/NWWA area. Our multivariate analysis and the analysis referred to in Table 11 did not account for the geographic location of private wells or the location of the current residences of the consumers of bottled water within the study area. To better understand the observed relationship, we geocoded the current addresses of public water users to the four PWS areas (Table 12) and compared the serum PFAS levels. We geocoded private well water users to the four PWS areas and compared their serum PFAS levels as well (Table 13). Both these analyses indicated lower mean serum PFAS levels among participants currently living in the PWS area farther away from the base (WTWSD/NWWA). Another factor to note is that these PWS water sources are reported to be intermittently interconnected. However, we do not know the frequency and/or quantity of water sharing in the past and to what extent the sharing of water impacted the PFAS concentration in the water distributed to consumers. Univariate analyses indicated significant difference in mean serum PFAS levels among study participants with different levels of education (Table 6) and BMI (Table 8), whereas employment (ever employed) status in the study area was not significantly associated with mean serum PFAS levels. Education level and BMI were not found to be significantly associated with mean serum PFAS levels in the multivariate analyses, whereas employment status in the study area was significantly associated with mean serum PFHxS levels in the multivariate analysis (Table 17). A recent study also reported a lack of association between BMI and serum PFAS levels (Blake et al., 2018). An occupational link to elevated serum PFOS and PFHxS in firefighters exposed to AFFF was previously reported (Rotander et al., 2015). However, the variable ‘employment status’ in the study area in the current study did not indicate the specific type of occupation; rather, it represented the length of time the respondent was employed in any capacity in the study area. Those who responded ‘yes’ were likely to spend more time daily in the area compared to those who responded ‘no,’ thereby increasing their chances of exposure.
27
PEATT PILOT PROJECT PENNSYLVANIA DEPARTMENT OF HEALTH
A positive association between serum PFAS levels and time spent in the community had previously been reported (Daly et al., 2018., Landsteiner et al., 2014). The estimated amount of tap water consumed was found to be associated with serum PFOA and serum PFNA levels in our study (Table 9); those who consumed less than four cups of tap water daily had lower PFAS levels than those who consumed four to seven cups daily. However, those who consumed eight cups or more of tap water had less PFAS in their blood samples than those who consumed four to seven cups daily. This relationship could not be explained with the available data, as there were several other sources of PFAS in the environment. Urine has been suggested to be a pathway of excretion of PFAS (Zhang et al., 2015), and the observed relationship may partially be explained by the higher urinary excretion of PFAS by those who drink eight cups or more of water daily. The multivariate analysis indicated significant association between serum PFOA level and the quantity of tap water consumed (Table 17). The users of private wells for drinking water had higher (not statistically significant) levels for PFOA, PFOS and PFNA compared to public water users (Table 10). Significant association between the source of drinking water and serum PFAS levels was observed in the multivariate analyses (Table 17). Our univariate results indicated higher, though not statistically significant, PFAS levels, except for PFNA, among those who reported being ever employed on the military base (Table 14). The multivariate analyses did not indicate a significant association between employment on the military base and serum PFAS levels (Table 17). A small sample size for those with employment on the base may be a factor for the non-significant relationships. AFFF used in firefighting exercises at the base is considered to be the primary source of PFAS contamination. PFNA is not as predominant a compound as PFOS, PFOA or PFHxS in AFFF. The univariate analysis indicated significant association between self-reported health status (at least one health condition reported) and mean serum PFAS levels (Table 15), though no significant association was observed in multivariate analysis (Table 17). Our analysis of the self-reported cases of various conditions indicated higher frequencies of elevated cholesterol levels, endocrine disruptions and cancer associated with higher serum levels of PFAS, as reported in many previous epidemiologic studies (Rappazzo, et al., 2017., Nelson et al., 2010). However, PEATT was not designed to causally associate health conditions with PFAS exposure. Much more detailed clinical data would be needed to assess these relationships. In our study area, drinking water was known to be contaminated with PFAS. According to the EPA (EPA, 2016a, 2016b), the dominant source of human exposure to PFOA and PFOS is expected to be from the diet; indoor dust from carpets and other sources is also an important source of exposure, especially for children. EPA uses a relative source contribution of 20 percent from drinking water for calculating health advisory levels for PFOA and PFOS in order to allow for other exposure sources, such as dust, diet and air. Although drinking water was contaminated in the current scenario, the importance of other sources of PFAS exposure cannot be ignored. Therefore, it is not always possible to positively causally link an observed higher serum PFAS levels to drinking water without knowing all other exposure sources.
28
PEATT PILOT PROJECT PENNSYLVANIA DEPARTMENT OF HEALTH
Though our analyses indicated significant associations between serum PFAS levels and various demographic and exposure characteristics, it is also important to note that these associations do not confirm causation but do strengthen those hypotheses. The half-lives of these compounds range from two to 10 years. Therefore, participants’ blood levels were likely higher prior to 2016. PFAS levels in blood are declining overall across the nation. Although PFOA and PFOS were phased out of production starting in 2002 and general blood levels of most PFAS are declining, there are still many alternative PFAS compounds replacing PFOA and PFOS. These alternative compounds and mixtures, when released into the environment, can still combine and change into PFOA, PFOS and PFNA (Buck et al., 2011).
Conclusions This pilot study involving residents in the Warminster, Warrington and Horsham communities in Southeastern Pennsylvania showed that participants had elevated levels of PFAS compounds compared to the U.S. general population. This is consistent with other studies involving residents in communities with drinking water containing PFAS compounds at levels above the EPA’s recommended LHAL of 70 PPT. This pilot study tested levels of 11 PFAS compounds and consistently found four PFAS compounds (PFOA, PFOS, PFHxS and PFNA) in the blood samples of the study participants. Overall, 75, 81, 94 and 59 percent of the study participants had levels exceeding the national average for PFOA (1.94 µg/L), PFOS (4.99 µg/L), PFHxS (1.35 µg/L) and PFNA (0.66 µg/L), respectively. The other seven PFAS compounds were detected in fewer (less than 15) participants. In light of the fact that, nationally, PFAS levels in blood are declining steadily, it is likely that the PFAS levels were significantly higher in the years prior to this 2018 testing. Overall, PFAS levels increased with the age of participant as well as length of residence in the community. Males, private well water users and those who ever worked on the military base also had higher PFAS levels, though the increases in levels were not statistically different from the comparison groups (females, public water users and those who never worked on the military base, respectively) in univariate analyses. Multivariate analyses indicated significant association between the serum levels of some of the PFAS compounds and sex, age, total length of residence in the study area, drinking water source at current residence and employment status in the study area. Drinking water source at current residence and the total length of residence in the study area were the only variables that were significantly associated with all four PFAS compounds analyzed (PFOA, PFOS, PFHxS and PFNA).
Limitations and Challenges Sample size, selection and response rate: The goal and original estimated sample size for this study was 500. However, only 235 randomly selected participants could be recruited. Of the 600 households contacted over two recurrent cycles, 276 responded (46 percent total household response rate). Only 26 children (ages 3-17) could be included in the study, limiting the scope of any meaningful analysis of the data for this age group. The method of sample selection proved both challenging and limiting for this project. A stratified sample was desired; however, basic information about potential participants (age, work history, military base
29
PEATT PILOT PROJECT PENNSYLVANIA DEPARTMENT OF HEALTH
presence, pregnancy, private well use, etc.) was needed initially to ensure that adequate numbers of various groups and sensitive populations were recruited. A prior population survey is needed to determine pre-and post-stratification weights for meaningful analysis of the data from a stratified sampling design. The PEATT required a one-stage cluster sampling of households, but there was no advice as to how to obtain the sampling frame information (list of names and addresses). The smallest geographical region for which information can be obtained from census data is census block or block group. Using information on census block and households within census block would mean a two-stage cluster sampling, not a one-stage cluster sampling as suggested in the toolkit. Fortunately, in our case, the county health departments assisted in providing household parcel information, which was then geocoded to ensure households were in the exposure area. The toolkit provides information on basic calculation of geometric mean of serum PFAS levels. It would have been more helpful to have actual SAS program coding to support calculation of geometric means. Exposure assessment: Information on all potential sources of exposure could not be collected in this study. The measured serum PFAS levels actually represent exposure from all sources. Laboratory availability: The PEATT protocol does not address the limited national laboratory availability. Use of contracted or out-of-state laboratories can increase the study time, given that additional contractual processes and review may be needed. Most states will likely need to utilize interstate shipping to send samples for laboratory analysis. This requires specific certification. Timing of the study: Testing of specimens took place approximately two years after contamination was discovered and remediated. Serum concentrations measured in our study likely do not capture the peak exposure levels. The seasonal timing of the testing was also a challenge due to participants traveling and summer vacations, particularly for the families with multiple children who have challenging schedules due to summer sports and extra-curricular camps. Limited turnaround time: The project had an extremely short turnaround time of approximately nine months. Successful completion of all administrative steps and procedures within this timeframe was challenging. There are only few laboratories in the country capable of analyzing PFAS in blood samples. DOH faced significant delay in finding a laboratory to start the project. A longer timeframe could have helped to increase the sample size and include more children. National PFAS issues: Another challenge was dealing with the unfolding issues related to PFAS at the national level. The fact that media had reported potential new advisory levels were being blocked by the EPA and the White House added an extra level of community mistrust in the government. It also led to questions from the community that were not appropriate for program investigators (at the state level) to answer, as they were targeted at federal activities. There were also challenges with trying to keep up with the rapidly changing developments surrounding PFAS exposures. Questions about the national assessment and multi-site health studies frequently came in from citizens and legislators, and DOH had limited ability to answer these fully. In addition, questions regarding military veterans and the actions by various military branches were challenging for state officials. These included questions such as whether
30
PEATT PILOT PROJECT PENNSYLVANIA DEPARTMENT OF HEALTH
veterans, particularly those who lived and/or worked on the military base, will be tested and studied outside of the community studies.
Feedback and Recommendations
Selection process: Although the need for a scientifically designed random sampling exposure assessment is appreciated, we recommend the ability to incorporate volunteer participants into the testing as well. This subset of participants could be analyzed separately from the randomly chosen sample and compared. We had repeated emails and phone calls from residents and their legislators requesting to have their PFAS levels measured. We created an outreach document to provide an answer to those requests and started a volunteer list in case we could incorporate future testing with volunteers. Having an option to test volunteers would improve relations with the affected community and provide greater ability to analyze different subsets of the population, including at-risk and occupationally exposed residents. Questionnaires: The questionnaires assume current PFAS exposure through drinking water, which was not the case with our pilot population, whose drinking water exposure ended in 2016. Questions therefore had to be rephrased, and participants had to be selected based on an exposure cut-off date. There needs to be a way of obtaining information on residency and eligibility prior to mailing the questionnaires. Sending a packet with all questionnaires, outreach materials and consent forms to all households in the sampling frame based on random selection is not practical, as we do not know how many eligible participants are in a household, nor do we know the amount of prepaid postage to include on return envelopes. We recommend (as we did in Pa.) creating and sending an initial eligibility letter to selected households asking the number of people currently living in the household, the number of people living there prior to July 2016 (exposure end date), and the number of people willing to participate in the project. As potential participants return the letter, we know the number of adult and child questionnaires, and assent and consent forms to provide to that household. We also know the amount of postage to put on the return envelope included for our participants. The question bank for the questionnaires does not take into consideration the complexity of long-duration exposure. Our exposure window was 50 years, and we needed to account for the fact that participants likely had more than one address in the area during that long window of time. The questionnaires must therefore allow for multiple addresses, workplaces, schools, and daycares. Trying to account for multiple variations in the above factors complicated the questionnaire process and added length to the questionnaires. Potential participants stated that this contributed to visual fatigue and participant drop-out. We recommend an option to complete the questionnaires and paperwork in an electronic format. This can streamline the questionnaire process with built-in “skips” for sections that do not pertain to all participants. This would include sections on female-related exposure and elimination, multiple addresses, multiple workplaces, and private well testing. Most participants are accustomed to the convenience of electronic surveys that can fit into a busy schedule more easily, particularly if the material is compatible with mobile phones. The question bank and questionnaire provided blanks for participants to list diagnosed health conditions. There were basic categories, but the open-ended nature of that section allowed for
31
PEATT PILOT PROJECT PENNSYLVANIA DEPARTMENT OF HEALTH
participants to list any and all health conditions using a variety of titles. This made analysis of health conditions very difficult. We recommend making that section more structured with multiple choice-style options for listing health conditions. This would allow for more uniform answers and more effective and meaningful data analysis. There should also be some guidance for households with college-aged children where the children live in a household during weekends, summers and other months of the year, but are not necessarily living there fulltime. It was not clear whether this group was to be considered as current members of a household. The question bank should also include questions about blood donation and blood transfer, as this can affect the levels of PFAS in a person’s blood. Participants who regularly donate blood have an elimination route that needs to be considered. Participants who undergo routine blood transfusions for other health conditions or those who receive blood in surgical procedures may have an additional exposure source. Participant dropout: Although we had 584 interested participants who returned their eligibility forms, only 305 returned their questionnaires and signed consent forms. Repeated reminder phone calls and reminder emails did not greatly improve the return rate. Potential participants who chose to drop out described the questionnaire process as too time consuming with too much paperwork. The packet appeared to be labor-intensive from a visual standpoint, so some chose not to complete it. Of the 305 who returned paperwork, only 235 made clinic appointments and gave blood samples. When asked why they were not making and keeping their appointments, participants indicated the method of calling and scheduling an appointment was not convenient. We recommend streamlining the testing process to make it as easy and convenient as possible. This may involve offering online scheduling for clinic appointments so participants can do it when convenient rather than having to remember to call during certain office hours. Offering the questionnaire online in addition to paper surveys may also make it easier for busy families to complete the process. In addition, having a visiting nurse or team that could collect questionnaire information, do blood draws and collect urine samples could also improve participation rates. Tokens of appreciation for completion of each step may also improve participation and completion rates. Results process: Results letters provided in the PEATT were as complete as possible in terms of numbers and information. Participants were informed that there is insufficient research on PFAS and health outcomes, and individual results could not tell them whether this caused a health condition or would lead to a health condition. Unfortunately, and as to be expected, these disclaimers did not provide psychological comfort to those with higher than normal levels of PFAS compounds. A majority of the pilot project participants had levels of at least one compound above the national average, and some had levels above the 95th percentile. Participants now knew their PFAS levels but not what those levels meant for them health-wise or what to do about it. When participants took their results and the physician guidance informational sheet to their physicians, some physicians were not able or willing to offer any assistance or advice. We recommend some additional guidance be developed for use in addressing the inevitable questions about health outcomes. Environmental health education for physicians would be an option to consider, and/or a list of physicians trained in
32
PEATT PILOT PROJECT PENNSYLVANIA DEPARTMENT OF HEALTH
environmental health matters who would be willing to discuss results with concerned participants. Additional guidance: We recommend providing additional guidance and education on PFAS exposure and health outcomes. The included information on PFAS is helpful for a basic idea of the compounds and exposure sources, although our experience was that it was not enough information. We performed our own research and educational efforts through extensive academic journal article reviews and webinars. A clear, detailed literature review of PFAS exposures, health concerns and outcomes, as well as information on the individual compounds and their sources would be extremely helpful. Some state organizations may not have the staff nor the access to academic journal databases to perform their own research. We would also recommend additional resources providing guidance on how to anticipate and answer questions asked by the community. A list of the most common questions we received in community meetings is provided in Appendix 3.
Citations ATSDR (2018). Per- and Polyfluoroalkyl Substances (PFAS) and Your Health. https://www.atsdr.cdc.gov/pfas/health-effects.html accessed: December 2018. Blake, B.E., Pinney, S.M., Hines, E.P., Fenton, S.E. and Ferguson, K.K. (2018). Associations between longitudinal serum perfluoroalkyl substance (PFAS) levels and measures of thyroid hormone, kidney function, and body mass index in the Fernald Community Cohort. Environmental Pollution 242 (Pt A):894-904. Buck, R.C., Franklin, J., Berger, U., Conder, J.M., Cousins, I.T., de Voogt, P., Jensen, A.A., Kannan, K., Mabury, S.A. and van Leeuwen, S.P. (2011). Perfluoroalkyl and Polyfluoroalkyl Substances in the Evironment: Terminology, Classification, and Origins. Integrated Environmental Assessment and Management 7: 513-541. CDC (2015) National Report on Human Exposure to Environmental Chemicals, Updated Tables 2018. https://www.cdc.gov/exposurereport/index.html accessed: December 2018. Daly, E., Chan, B., Talbot, E., Nassif, J., Bean, C., Cavallo, S., Metcalf, E., Simone, K. and Woolf, A. (2018). Per-and polyfluoroalkyl substance (PFAS) exposure assessment in a community exposed to contaminated drinking water, New Hampshire, 2015. International Journal of Hygiene and Environmental Health 221: 569-577. EPA (2016a). Drinking Water Health Advisory for Perfluorooctanoic acid (PFOA) https://www.epa.gov/sites/production/files/2016-05/documents/pfoa_health_advisory_final-plain.pdf EPA (2016b). Drinking Water Health Advisory for Perfluorooctane Sulfonate (PFOS) www.epa.gov/sites/production/files/2016-05/documents/pfos_health_advisory_final_508.pdf
33
PEATT PILOT PROJECT PENNSYLVANIA DEPARTMENT OF HEALTH
Eriksson, U., Mueller, J., Toms, L.-M. and Hobson, P. (2017). Temporal trendds of PFSAs, PFCAs and selected precursors in Australian serum from 2002 to 2013. Environmental Pollution 220: 168-177. Jain, R. B. (2018). Time trends over 2003-2014 in the concentrations of selected perfluoroalkyl substances among US adults aged greater than or equal to 20 years: Interpretational issues. Science of the Total Environment 645: 946-957. Landsteiner, A., Huset, C., Johnson, J. and Williams, A. (2014). Biomonitoring for Perfluorochemicals in a Minnesota Community with Known Drinking Water Contamination. Journal of Environmental Health 77: 14-19. Nelson, J., Hatch, E.E. and Webster, T. (2010). Exposure to Polyfluoroalkyl Chemicals and Cholesterol, Body Weight, and Insulin Resistance in the General U.S. Population. Environ Health Perspect. 118: 197-202. Rappazzo, K.M., Coffman,E. and Hines, E.P (2017). Exposure to Perfluorinated Alkyl Substances and Health Outcomes in Children: A Systematic Review of the Epidemiologic Literature. Int. J. Environ. Res. Public Health. 14: 691. Rotander, A., Toms, L.L., Aylward, L.L., Kay, M. and Mueller, J.F. (2015). Elevated levels of PFOS and PFHxS in firefighters exposed to aqueous film forming foam (AFFF). Environment International 82: 28-34. Zhang, T., Sun, H., Qin, X., Gan, Z. and Kannan, K. (2015). PFOS and PFOA in paired urine and blood from general adults and pregnant women: assessment of urinary elimination. Environ Sci Pollut Res Int. 22: 5572-5579.
Appendix 1 Collaborations Successful completion of the PEATT Pilot Project would not have been possible without the interest and participation of community members, and DOH would like to thank them for their involvement. Implementation of the PEATT Pilot Project required extensive collaboration with federal, state, and local agencies. Pennsylvania Department of Health would like to acknowledge the following agencies’ contributions to the successful completion of the PEATT Pilot Project: FEDERAL AGENCIES AND ORGANIZATIONS: Agency for Toxic Substances and Disease Registry (ATSDR) Association of State and Territorial Health Officials (ASTHO) Department of Defense Restoration Advisory Board Environmental Protection Agency (EPA) Council of State and Territorial Epidemiologists (CSTE)
34
PEATT PILOT PROJECT PENNSYLVANIA DEPARTMENT OF HEALTH
STATE AGENCIES: Pa. Governor’s Office Pennsylvania Bureau of Laboratories (BOL) DOH Office of Communications Pennsylvania Department of Environmental Protection (DEP) New York Department of Health LOCAL AGENCIES: Horsham Township Warrington Township Warminster Township Bucks County Health Department Montgomery County Health Department ELECTED SENETORS AND REPRESENTATIVES: U.S. Senator Robert Casey Jr. U.S. Senator Pat Toomey U.S. Representative Mike Fitzpatrick U.S. Representative Brian Fitzpatrick U.S. Representative Madeline Dean U.S. Representative Mary Gay Scanlon Pa. Senator Steven Santarsiero Pa. Senator Charles Mcilhinney Pa. Senator Robert Tomlinson Pa. Senator Maria Collet Pa. Senator Stewart Greenleaf Pa. Senator Vincent Hughes Pa. Representative F. Todd Polinchock Pa. Representative Meredith Buck Pa. Representative Meghan Schroeder Pa. Representative Mary Jo Daley Pa. Representative Thomas Murt Pa. Representative Todd Stephens Pa. Representative Liz Hanbidge Pa. Representative Benjamin Sanchez
Appendix 2 Activities
• Weekly team conference calls were established between the DOH and stakeholders at Wadsworth Laboratory, the Pa. BOL, Bucks County Health Department and the
35
PEATT PILOT PROJECT PENNSYLVANIA DEPARTMENT OF HEALTH
Montgomery County Health Department. These calls facilitated clinic planning and communication through the duration of the project.
• DOH created its own outreach communication materials, which included cover letters to participants, household eligibility forms, PFAS fact sheets, clinic instructions, reminder letters and emails, phone scripts, results letters, and press releases. DOH modified the PEATT-supplied consent/assent form and invitation letter, used the questionnaire template, and suggested questions for creating the adult and child questionnaires.
• DOH created a laboratory protocol for all parties involved in the collection, processing, and transport of specimens. This was necessary due to working with county-level health agencies as well as two different state health agencies (New York and Pennsylvania). Pa. BOL provided guidance on the document to ensure compliance with and complete understanding of all necessary procedures and contacts.
• Initial cover letters and eligibility forms comprised the first mailing to a random sample of potential participants (350). The eligibility form asked the current number of people living in the household, the number living there prior to July 1, 2016, and the current number in the household interested in participating in the study. A reminder letter was sent to the households that did not return an eligibility form. This letter produced very few (six) responses, the majority being “not interested.” Overall, 154 households responded, with 343 individuals (282 adults and 61 children) indicating interest.
• In an attempt to reach 500 participants, initial cover letters and eligibility forms were sent to a second random sampling of households (250). One-hundred twenty-two households responded, bringing our total number of eligible and interested households to 276. Of those households, 633 individuals indicated interest in participating. Over time, 49 participants were lost due to ineligibility or loss of interest, giving us 584 potential participants.
• Blood draw clinics were scheduled beginning at the end of May 2018 and continuing through September of the same year. Each county offered a weekly afternoon clinic with some clinics extending into evening or Saturday hours.
• DOH made biweekly phone calls and sent biweekly emails to participants reminding them to complete and return their questionnaires and consent forms. This occurred from June through September 2018.
• DOH maintains an active website with details about the PEATT Pilot Project and general information on PFAS for public review. This has been in progress since 2016 and includes information/documents related to the cancer investigations conducted in the study area. These include PFOS and PFOA fact sheet, PFAS Family Tree, Cancer Data Review-(1985-2013), Cancer Data Review (1985-2013) – Addendum 1, Addendum 2, and PEATT.
• DOH also addressed the community through public meetings on May 16, May 30, Sept. 13, and Dec. 19. During these meetings, Dr. Sharon Watkins presented updates on the pilot project and answered community questions. (See Appendix 3 for commonly asked community questions.) DOH also attended the federal EPA meeting held in Horsham on July 25, where Dr. Sharon Watkins presented information on the pilot project and its progress.
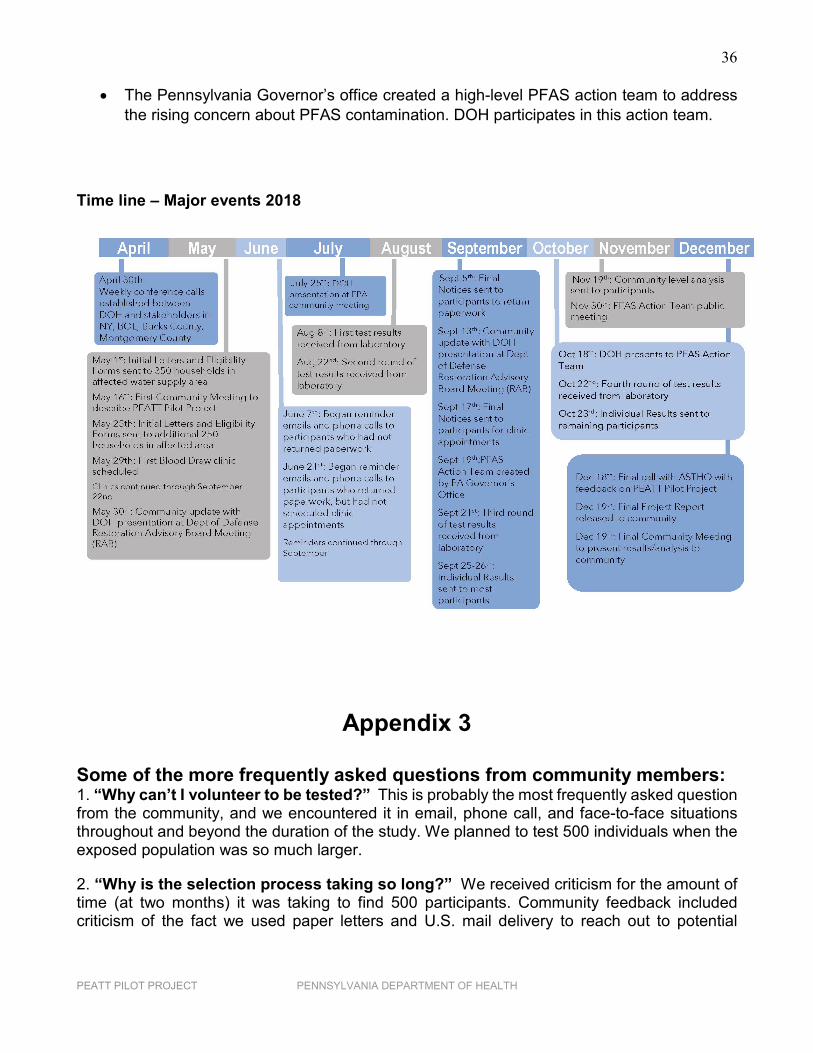
36
PEATT PILOT PROJECT PENNSYLVANIA DEPARTMENT OF HEALTH
• The Pennsylvania Governor’s office created a high-level PFAS action team to address the rising concern about PFAS contamination. DOH participates in this action team.
Time line – Major events 2018
Appendix 3
Some of the more frequently asked questions from community members: 1. “Why can’t I volunteer to be tested?” This is probably the most frequently asked question from the community, and we encountered it in email, phone call, and face-to-face situations throughout and beyond the duration of the study. We planned to test 500 individuals when the exposed population was so much larger.
2. “Why is the selection process taking so long?” We received criticism for the amount of time (at two months) it was taking to find 500 participants. Community feedback included criticism of the fact we used paper letters and U.S. mail delivery to reach out to potential
37
PEATT PILOT PROJECT PENNSYLVANIA DEPARTMENT OF HEALTH
households for participation. We were described as being “in the dark ages” due to using a paper and “snail mail” systems of communication.
3. “Why is the testing happening now, since it’s been years since the exposure has stopped?” The community expressed some concerns that the process of getting the actual biomonitoring started took so very long. They compared this pilot project to the extensive biomonitoring work in other states, and there was criticism that, now that some work was being performed, it wasn’t enough of an effort.
4. “Will we be a part of the bigger study? Will you be able to come back and do more testing on more people?” After learning that this was a pilot project for use in refining a protocol for a larger, national study, this was a constant question from the community, media and legislators.
5. “Why does everyone use different units and how do they correlate to each other?” This was a frequent comment and complaint from community members. PFAS is an issue that involves many different environmental and health agencies. Each agency uses different measurements (does versus concentration) and the terminologies (health advisories, lifetime health advisories, minimal risk levels, maximum contaminant levels, etc.) When different agencies attend community meetings, there is confusion as to what each term means and what the differences are between them. Our community members did not understand MCL vs. HAL vs. ATSDR vs. EPA levels.
5. “What do these numbers really mean for my health? Should I be worried?” This was a common question from our participants, specifically, but also from the community in general. We referred participants to their physicians, and they were provided the physician guidance document from the PEATT. Most participants stated that their physicians were not interested or informed about the issue and were therefore not helpful.
6. “Will veterans and people who lived and worked on the military bases be tested and studied? What about veterans who worked there but are no longer living in the area?” This was a concern that was brought up at many community meetings. There are military personnel and their families that lived and worked on the base for periods of time but recently moved outside of the affected water service area. What will be done for those people? Will they get a separate study?