pecos/devils river watershed projects part ii
TRANSCRIPT

Page 1
Texas Water Conservation Association71st Annual Convention
Pecos/Devils River Watershed Projects
Part II
Ronald T. Green, Ph.D., P.G., F. Paul Bertetti, P.G.,
and Nathanial Toll
Geosciences and Engineering Division
Southwest Research Institute®
Presented on behalf of the Irrigation Panel

Page 2
Why is Preserving and Protecting the Devils River and Lower Pecos River Important?
Need to put
these two
rivers in a
broader
geographical
context
Pecos River
Devils River
Page 3www.water.usgs.gov
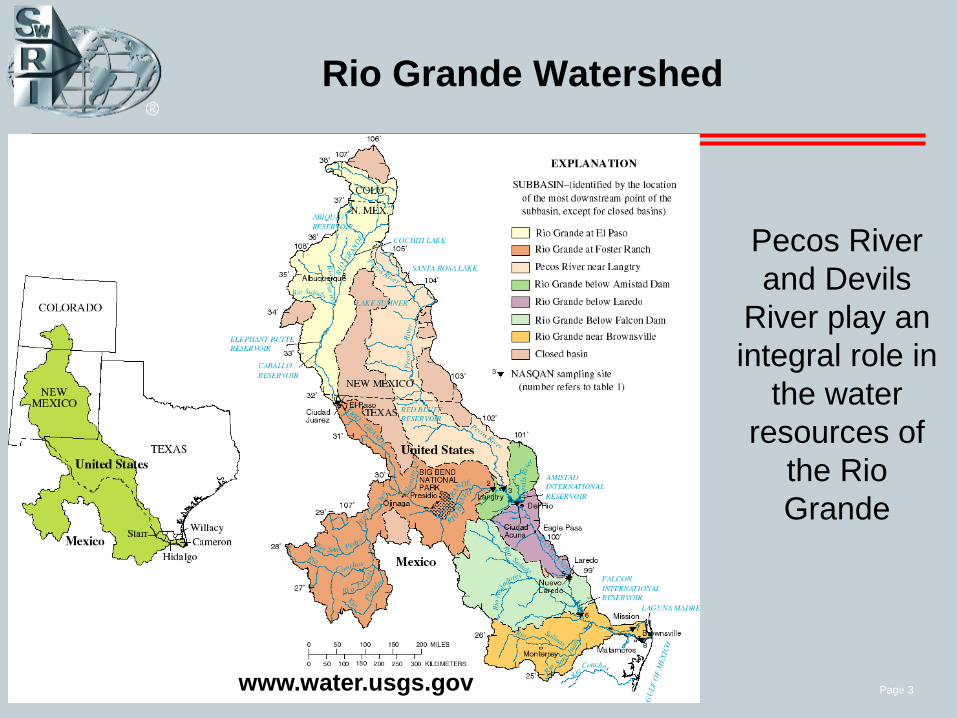
Rio Grande Watershed
Pecos River
and Devils
River play an
integral role in
the water
resources of
the Rio
Grande

Page 4
Rio Grande Watershed
Of flow to the
lower Rio
Grande, 1/3
comes from NM
and CO, 1/3
comes from
Mexico and mid-
Texas, and 1/3
comes from Val
Verde County
1/3
1/3
1/3
www.water.usgs.gov
Page 5
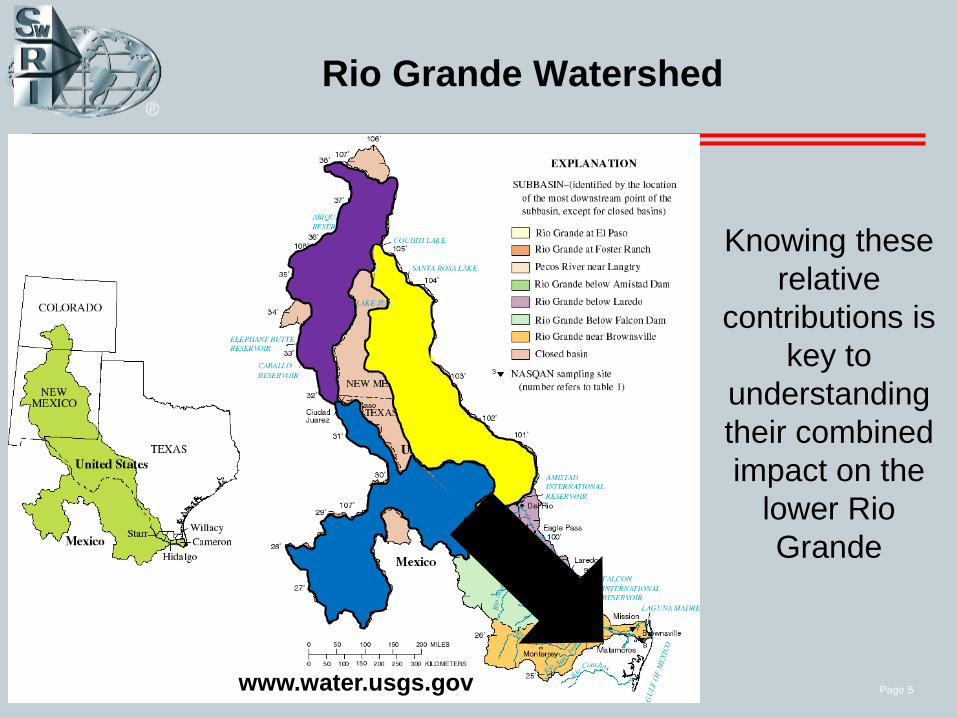
Rio Grande Watershed
Knowing these
relative
contributions is
key to
understanding
their combined
impact on the
lower Rio
Grande
www.water.usgs.gov
Page 6
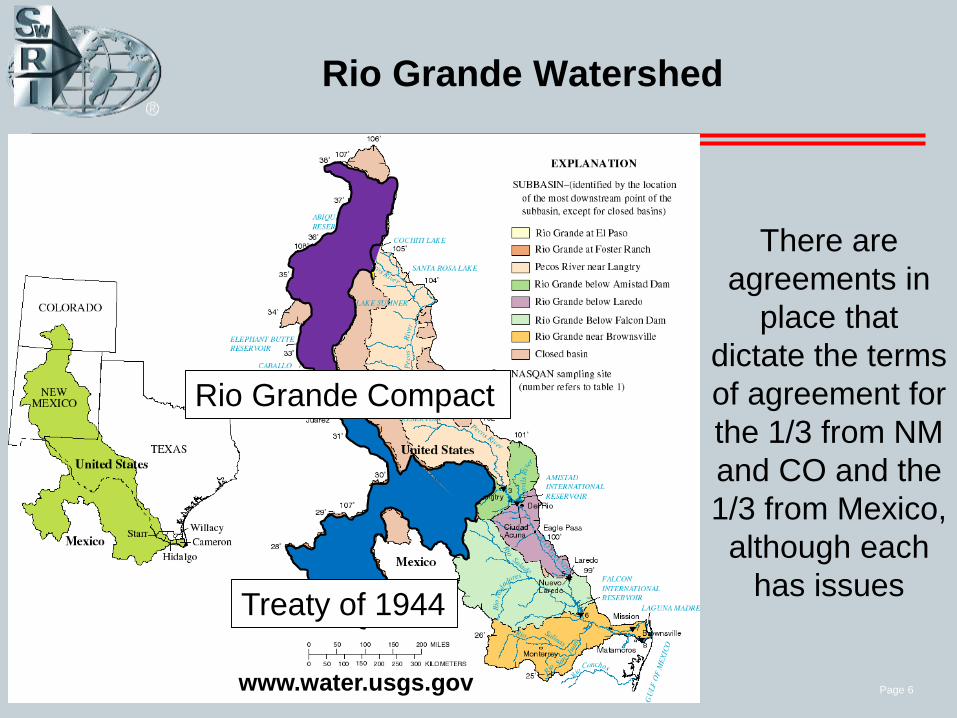
Rio Grande Watershed
There are
agreements in
place that
dictate the terms
of agreement for
the 1/3 from NM
and CO and the
1/3 from Mexico,
although each
has issues
Rio Grande Compact
Treaty of 1944
www.water.usgs.gov
Page 7
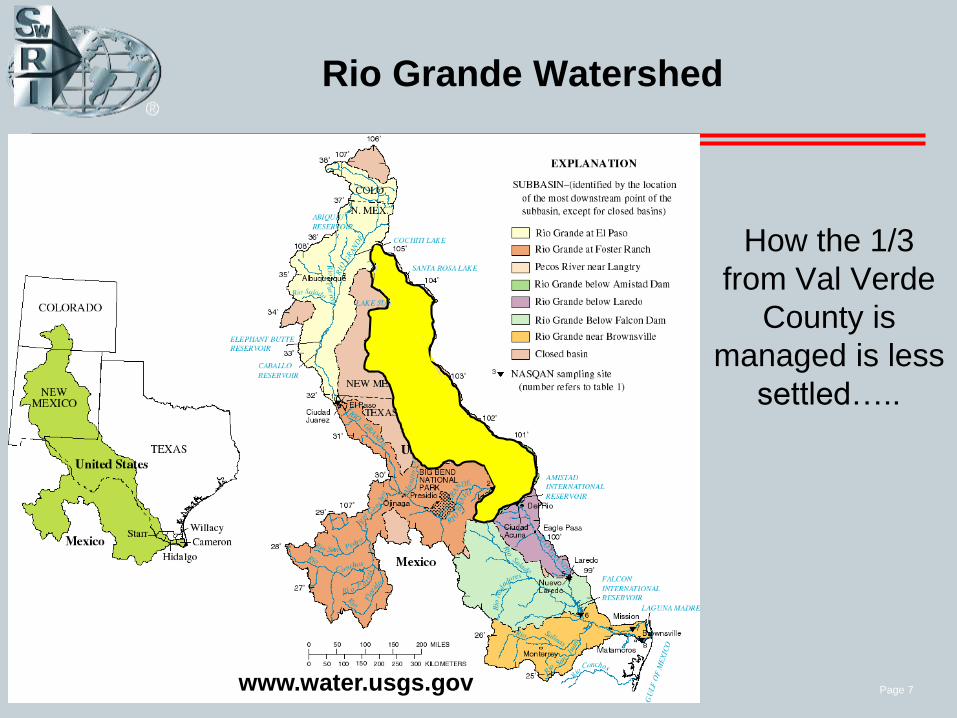
Rio Grande Watershed
How the 1/3
from Val Verde
County is
managed is less
settled…..
www.water.usgs.gov
Page 8
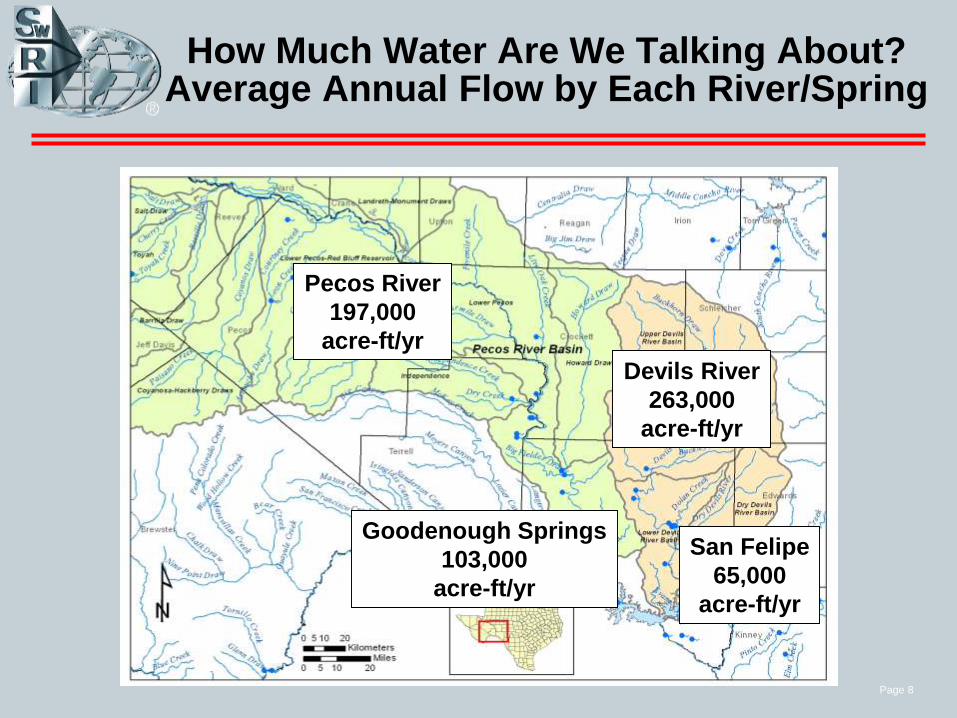
How Much Water Are We Talking About?Average Annual Flow by Each River/Spring
Pecos River
197,000
acre-ft/yr
Devils River
263,000
acre-ft/yr
Goodenough Springs
103,000
acre-ft/yr
San Felipe
65,000
acre-ft/yr

Page 9
Rio Grande Water Budgetin Val Verde County (acre-ft/yr)
AmistadReservoir
Devils
River
263,000
Pecos
River
197,000
Rio Grande at Langtry
1,071,000
San Felipe
Creek
65,000
Rio Grande below Amistad Dam
1,659,000
Rio Grande at Del Rio
1,659,000
Cienegas
Creek
8,700
Gauging Station
Goodenough
Spring 103,000
In an average year, 1.07 million acre-ft flows into Val Verde County and
1.7 million acre-ft flows out of Val Verde County via the Rio Grande
Page 10
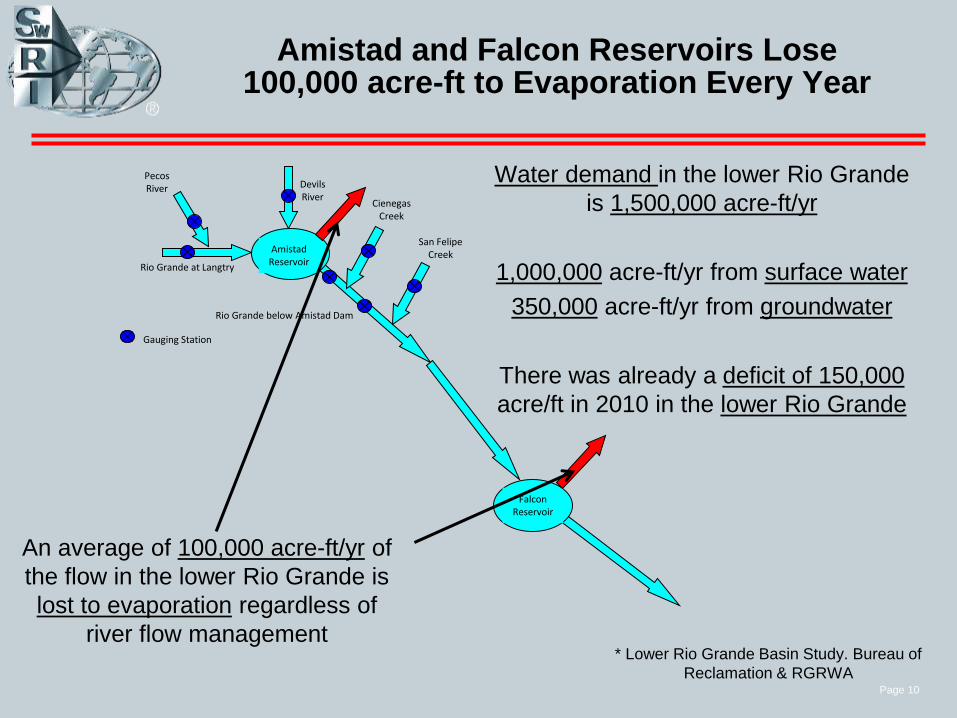
Amistad and Falcon Reservoirs Lose 100,000 acre-ft to Evaporation Every Year
AmistadReservoir
DevilsRiver
PecosRiver
Rio Grande at Langtry
San FelipeCreek
Rio Grande below Amistad Dam
CienegasCreek
Gauging Station
FalconReservoir
Water demand in the lower Rio Grande
is 1,500,000 acre-ft/yr
1,000,000 acre-ft/yr from surface water
350,000 acre-ft/yr from groundwater
There was already a deficit of 150,000
acre/ft in 2010 in the lower Rio Grande
An average of 100,000 acre-ft/yr of
the flow in the lower Rio Grande is
lost to evaporation regardless of
river flow management* Lower Rio Grande Basin Study. Bureau of
Reclamation & RGRWA

Page 11
Studies are Underway to Better Characterize the Water Resources of the Lower Pecos River and
Devils River Watersheds

Page 12
Related Studies Suggest There Is Limited Groundwater Flow from Adjacent Watersheds
Distinct Watersheds
Related studies of the Edwards Aquifer suggest watersheds on the edge of the Edwards Plateau act
separately and there is limited groundwater flow between adjacent watersheds
Page 13
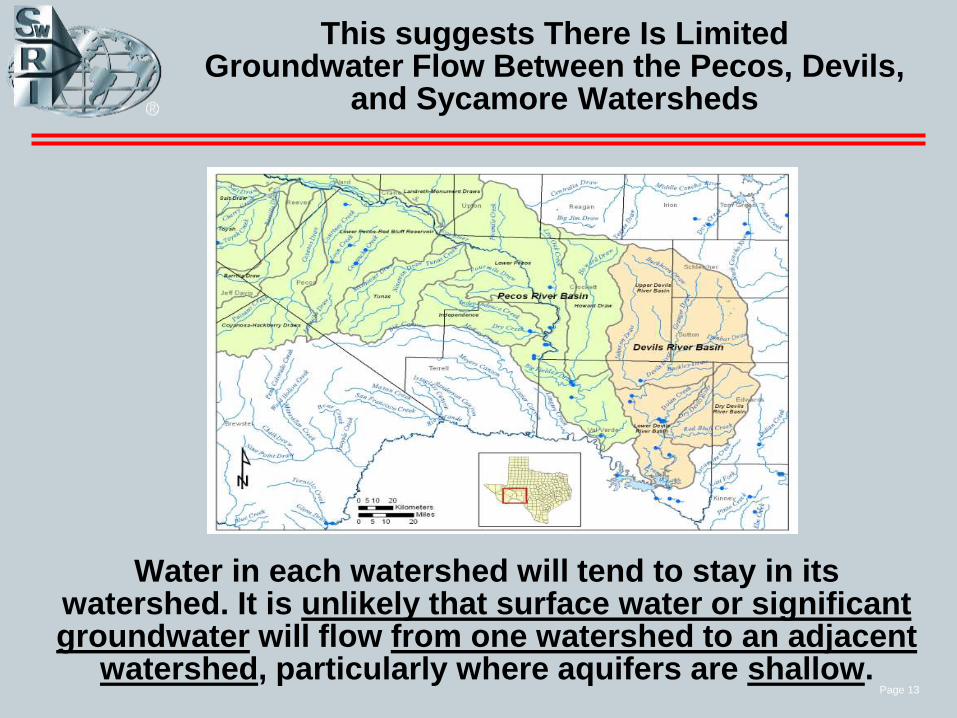
This suggests There Is Limited Groundwater Flow Between the Pecos, Devils,
and Sycamore Watersheds
Water in each watershed will tend to stay in its watershed. It is unlikely that surface water or significantgroundwater will flow from one watershed to an adjacent
watershed, particularly where aquifers are shallow.

Page 14
Lower Pecos River Watershed andPecos River Watershed
Should be Investigated Separately
Page 15
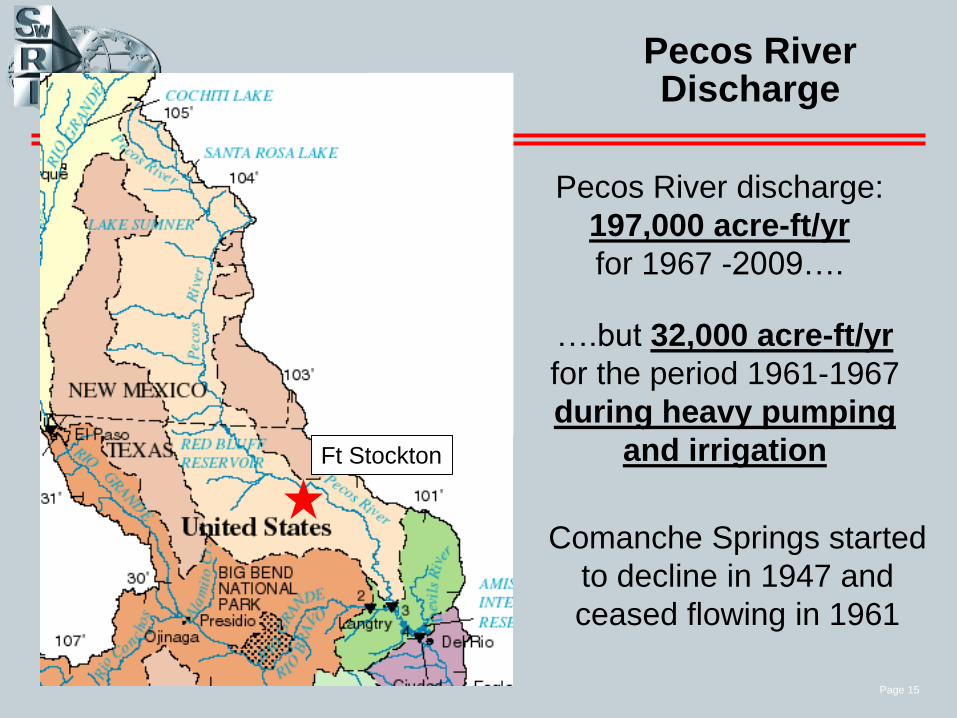
Pecos River Discharge
Ft Stockton
Pecos River discharge:
197,000 acre-ft/yr
for 1967 -2009….
Comanche Springs started
to decline in 1947 and
ceased flowing in 1961
….but 32,000 acre-ft/yr
for the period 1961-1967
during heavy pumping
and irrigation
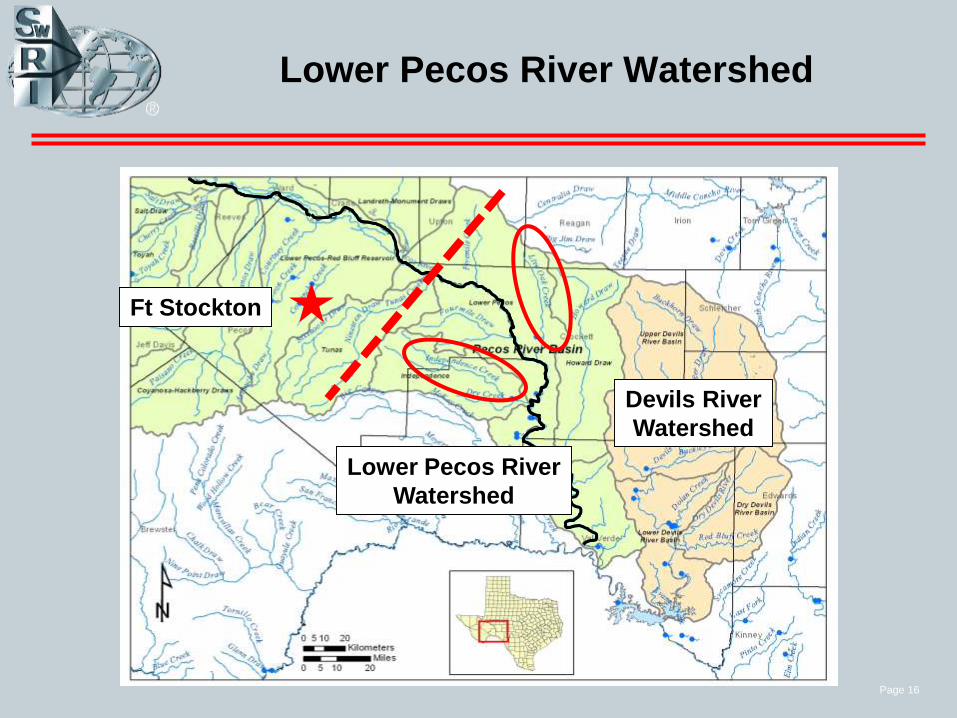
Page 16
Lower Pecos River Watershed
Lower Pecos River
Watershed
Ft Stockton
Devils River
Watershed
Page 17
How is this much water conveyed through this desert landscape?
Page 18
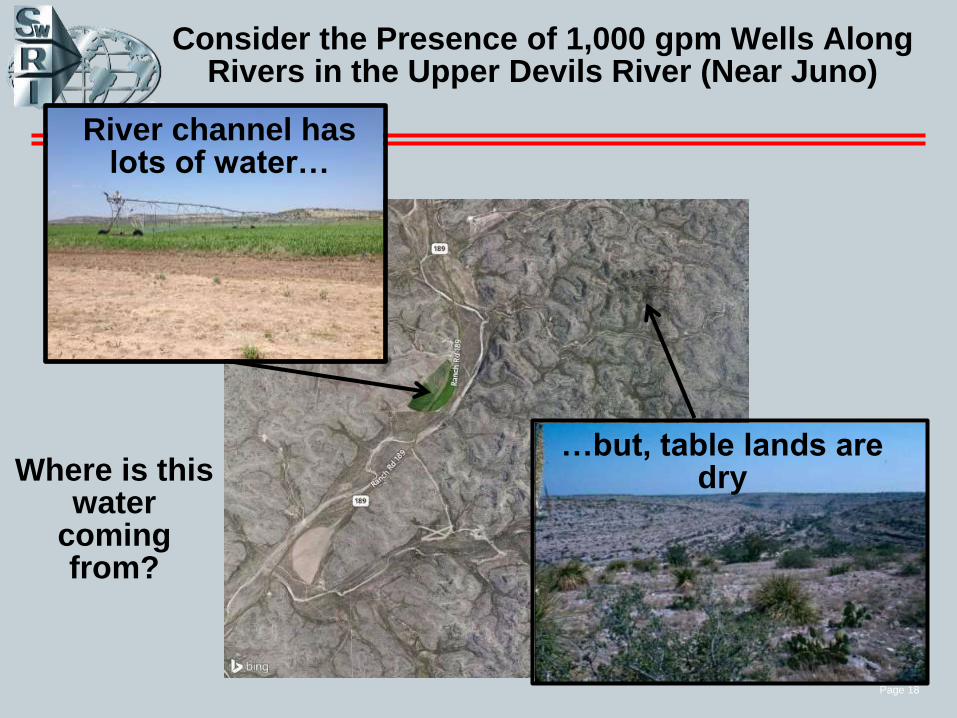
Consider the Presence of 1,000 gpm Wells Along Rivers in the Upper Devils River (Near Juno)
Where is this water
coming from?
…but, table lands are dry
River channel has lots of water…
Page 19
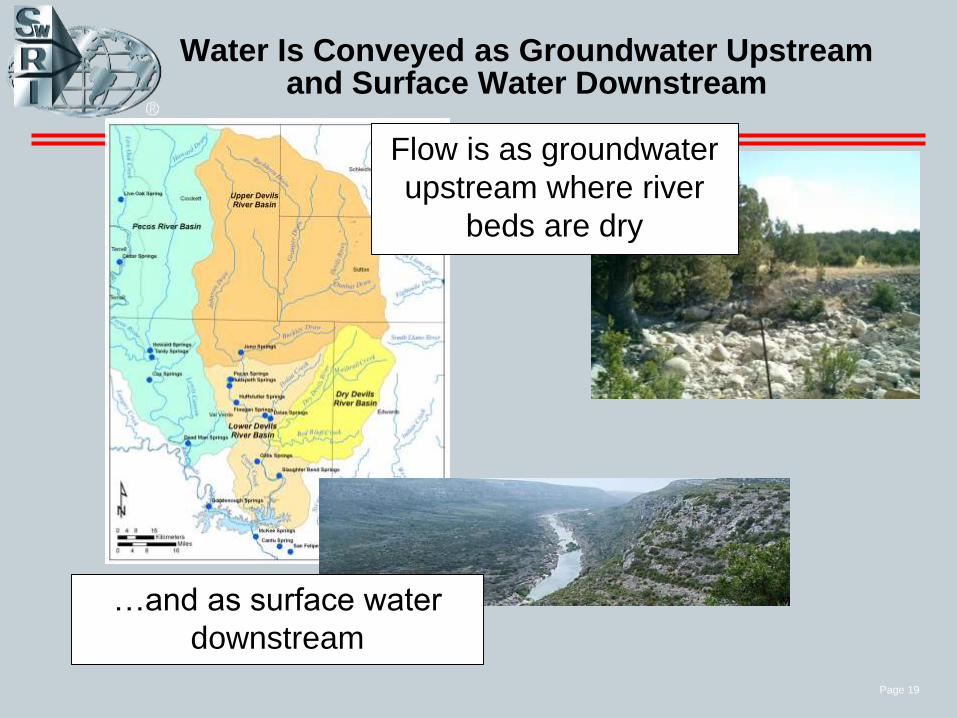
Water Is Conveyed as Groundwater Upstream and Surface Water Downstream
Flow is as groundwater
upstream where river
beds are dry
…and as surface water
downstream
Page 20
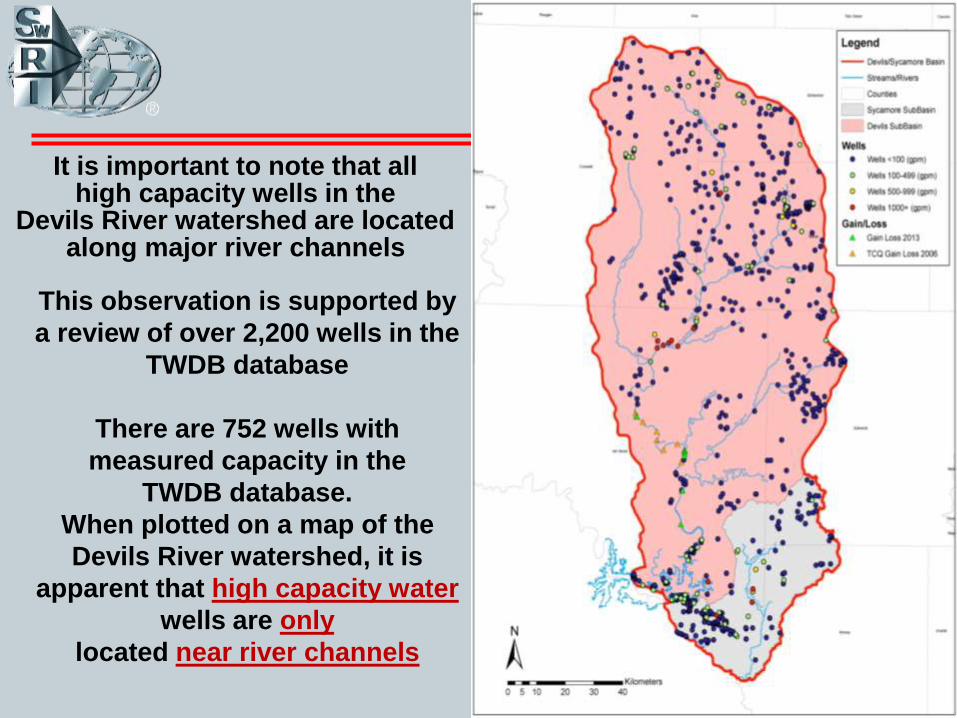
It is important to note that allhigh capacity wells in the
Devils River watershed are located along major river channels
This observation is supported by
a review of over 2,200 wells in the
TWDB database
There are 752 wells with
measured capacity in the
TWDB database.
When plotted on a map of the
Devils River watershed, it is
apparent that high capacity water
wells are only
located near river channels

Page 21
0
500
1,000
1,500
2,000
2,500
3,000
0 2 4 6 8 10 12 14 16
We
ll P
um
p R
ate
(g
pm
)
Distance from Closest River Channel (mi)
A Graph of These Data Support This Observation
Distance From River Channel Versus Well Capacity
Virtually all wells with capacity of 500 gpmare within 1.5 miles of a river

Page 22
The well data suggest there are preferential flow paths in the subsurface located near rivers that carry
significant water.
If we consider the Edwards-Trinity Aquifer a sponge, then these preferential flow paths can be thought of as pipes in
the sponge

Page 23
Step 1: The Edwards Plateau Was Formed by Sea Sediments that Solidified Then Lifted
Over 10s of Millions of Years

Page 24
Step 2: River Basins Are Formed as the Edwards Plateau Is Uplifted and Rock Is Eroded
Once started, these river channels and basins probably retain the same alignment over millions of years
Page 25
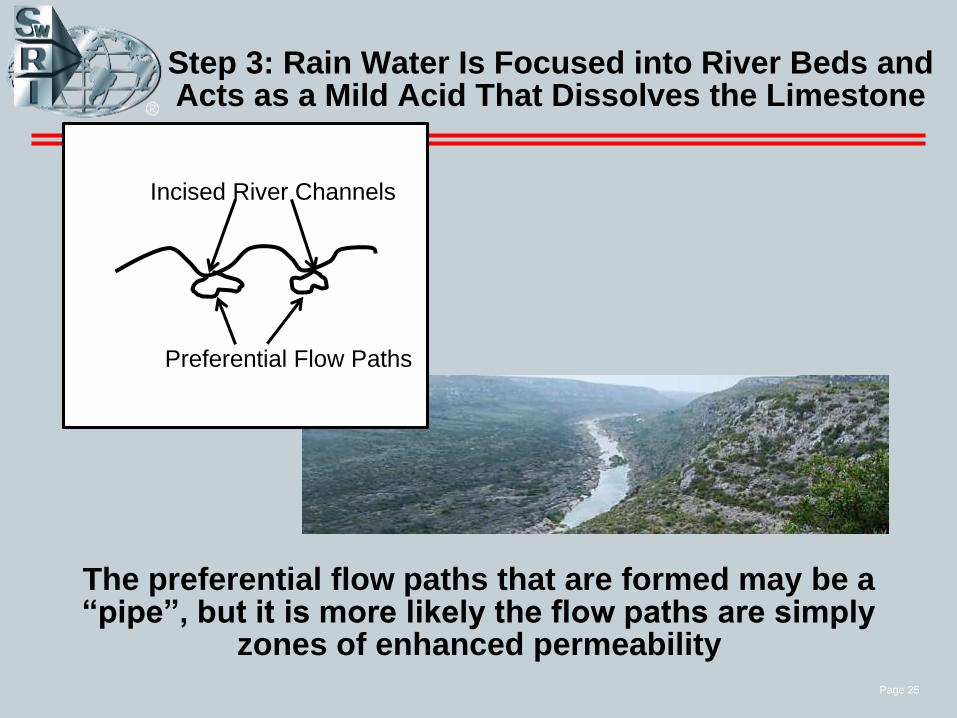
Step 3: Rain Water Is Focused into River Beds and Acts as a Mild Acid That Dissolves the Limestone
The preferential flow paths that are formed may be a “pipe”, but it is more likely the flow paths are simply
zones of enhanced permeability
Incised River Channels
Preferential Flow Paths

Page 26
1)These preferential flow paths are in bed rock,
not gravel beds
2) You cannot assume to have high capacity wells everywhere
in Edwards-Trinity Aquifer just because you happen to have a
high-capacity well that’s near a river channel
Two Important Points:

Page 27
Supporting Proof of Preferential Flow Channels in River Channels
Dye tracer tests in Sonora confirm the presence of preferential flow in
Devils River channel
Groundwater will flow at most a few 10s of feet/yr in a porous media
aquifer such as the Carrizo-Wilcox
Preliminary results from the Sonoratracer test suggests
groundwater travels a half to one mile a day in the “pipes” associated with Devils River

Page 28
What is needed to
build a model of the Devils River watershed?
1) Need to model the
entire watershed
2) Need to add pipes
Page 29
How is Groundwater Flow Characterized by the Texas Groundwater Development Board?
Page 30
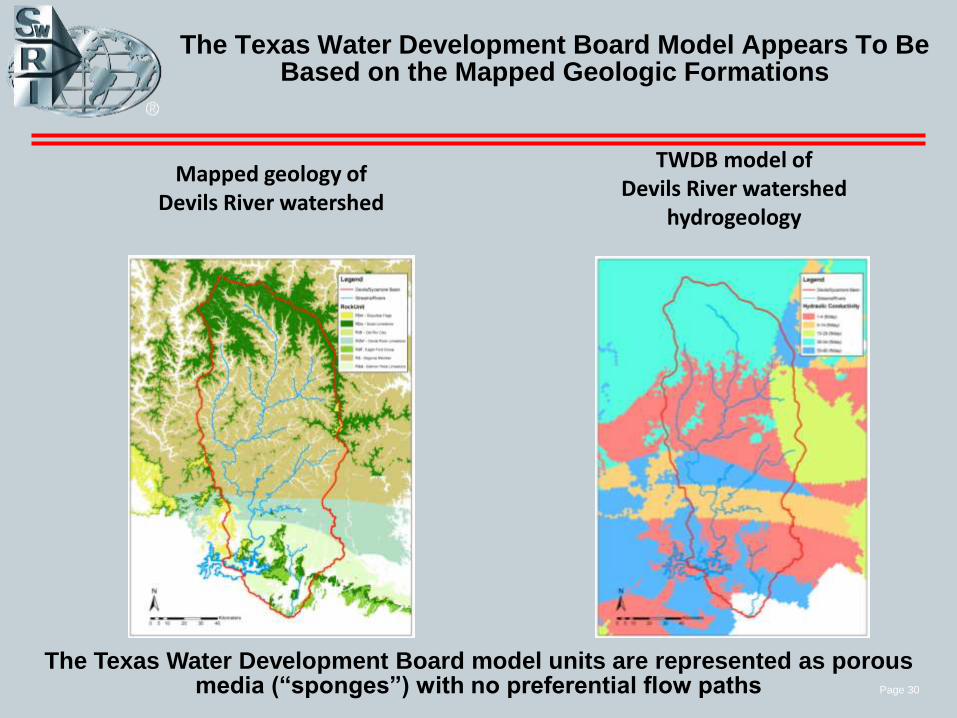
The Texas Water Development Board Model Appears To Be Based on the Mapped Geologic Formations
Mapped geology of Devils River watershed
TWDB model of Devils River watershed
hydrogeology
The Texas Water Development Board model units are represented as porous media (“sponges”) with no preferential flow paths

Page 31
It is recommended the Devils River and Lower Pecos River watersheds be modeled as separate hydrologic entities with preferential flow paths
(i.e., “pipes”) embedded in porous media (i.e.,
“sponges”)
Refined characterization Of Devils River watershed
hydrogeology
How Should the Devils River Watershed Be Modeled?

Page 32
Summary
• High capacity water wells are only located near
river channels
• There are preferential flow paths in the
subsurface located near rivers that carry
significant groundwater
• Related studies suggest there is limited
groundwater flow from adjacent watersheds
• Lower Pecos River and Devils River watersheds
should be modeled as separate hydrologic
entities
• Lower Rio Grande is dependent on management
of groundwater resources that supply
Amistad Reservoir
0
500
1,000
1,500
2,000
2,500
3,000
0 5 10 15
We
ll P
um
p R
ate
(g
pm
)
Distance from Closest River Channel (mi)
1/3
1/3
1/3
Page 33
Acknowledgements
Funding for water-resource assessment of
Devils River Watershed provided by the
Coypu Foundation
Funding for Devils River
Groundwater Flow Model provided by the
Nueces River Authority
Project support provided by the
Devils River Conservancy

Page 34
Contact Information
Ronald T. Green, Ph.D., P.G.
Institute Scientist
Geosciences and Engineering Division
Southwest Research Institute
6220 Culebra
San Antonio, Texas 78238
1.210.522.5305 (office)
1.210.522.5184 (fax)
1.210.316.9242 (cell)