pedestrian master plan update public … master plan update, public survey report ... update project...
TRANSCRIPT

Seattle Department of Transportation
PEDESTRIAN MASTER PLAN UPDATE PUBLIC SURVEY REPORT
January 2016

PEDESTRIAN MASTER PLAN UPDATE, PUBLIC SURVEY REPORT | 3
OVERVIEW
ABOUT THE PEDESTRIAN MASTER PLAN UPDATE
The Seattle Department of Transportation (SDOT) is currently in the process of updating the City’s Pedestrian Master Plan (PMP). Adopted in 2009, Seattle’s PMP establishes a vision to make Seattle the most walkable city in the nation.
The Plan’s goals of safety, equity, vibrancy, and health drive decisions about where to provide new sidewalks, curb ramps, crosswalks, signs, and many other improvements that make it easier to walk in our neighborhoods.
The PMP Update will: • Refresh the Plan’s prioritization
methodology and the data used in the prioritization process
• Update the toolbox of implementing strategies
• Establish new performance targets to measure the Plan’s effectiveness over time
The updated Plan will help determine the types and locations of pedestrian improvements the City will make over the course of the next several years, based on safety, demand, and equity factors.
PURPOSE OF THE PUBLIC SURVEY
To make sure the updated prioritization methodology reflects priorities of Seattle residents, we put together an online survey that received over 4,500 responses citywide. The survey was a key component of our outreach and engagement strategy. It also served as an opportunity to get initial public reaction to a variety of lower cost improvements the City is considering for residential streets without sidewalks.
The survey feedback described in this report will inform the updated prioritization methodology as well as the updated strategies and actions.
Overview................................................................................................................3
Distribution Methods.............................................................................................4
Who Responded....................................................................................................7
Survey Results.....................................................................................................11
Next Steps............................................................................................................23
Appendix.............................................................................................................24
CONTENTS

4 | PEDESTRIAN MASTER PLAN UPDATE, PUBLIC SURVEY REPORT PEDESTRIAN MASTER PLAN UPDATE, PUBLIC SURVEY REPORT | 5
DISTRIBUTION METHODS
Another important step in disseminating the survey was making it available in languages other than English. SDOT worked with the Office of Immigrant and Refugee Affairs (OIRA) to determine the following eight languages for translation for both our print and online surveys:
• Vietnamese• Spanish• Laotian• Cambodian• Korean• Thai• Russian• Chinese (simplified)
To help reach non-English speaking segments of the city’s population, SDOT staff worked with OIRA to identify community business organizations and individuals to assist with targeted outreach to minority communities.
PMP & Urban Trails Upgrade Plan Open HousesBallard Summer ParkwayFreight Advisory BoardSeattle Design CommissionCommission for People with DisabilitiesPark(ing) DaySeattle Comprehensive Plan Open HousesCentral District Summer ParkwayDistrict Council and Community Council meetingsFreight Master Plan Open Houses“Seattle at Work” eventImmigrant and Refugee CommissionBicycle Advisory BoardSeattle Planning CommissionUrban Forestry Commission
TABLE 1: COMMUNITY BRIEFINGS
The survey was posted online on SDOT’s home page for approximately six weeks, between October 21 and December 7, 2015. During that time, SDOT worked with other City departments, outside agencies, advocacy organizations, and media outlets to electronically distribute the survey as broadly as possible across the city. The public survey was advertised and distributed on the following channels:
• PMP Update project email list • SDOT social media • Department of Neighborhoods District
Coordinator newsletters• Safe Routes to School networks • Parent Teacher Student Associations • Partner organizations newsletters: Seattle
Neighborhood Greenways, Feet First, Cascade Bicycle Club, Downtown Seattle Association, and Commute Seattle
• Office of Immigrant and Refugee Affairs (OIRA) social media
• Senior networks (“Aging your Way,” Villages)• University of Washington student networks• Other press and social media outlets:
KUOW, Nextdoor, MyNorthwest.com, other neighborhood blogs and newsletters
In addition to disseminating the survey electronically, we held two public open houses to inform attendees about the Pedestrian Master Plan Update, and to advertise the public surveys and solicit survey responses. The Pedestrian Master Plan Update open houses were held jointly with the Trails Upgrade Plan, a concurrent SDOT project seeking to make pedestrian improvements throughout the city.
The two public open houses were held in October. The first was held in North Seattle, at the
Northgate Library, and the second was held in Southeast Seattle, in Hillman City. At both events, SDOT gathered digital survey responses in real time, and asked attendees to circulate the link to the survey to others in their neighborhoods.
Throughout the survey period, the project team also briefed various City Boards and Commissions on the PMP Update and the public survey. In addition to soliciting survey feedback from board/commission members, the project team requested that members distribute the survey to their social and professional networks. Boards and Commissions briefed during this period include:
• Seattle Planning Commission• Seattle Design Commission• Pedestrian Advisory Board• Bicycle Advisory Board• Freight Advisory Board• Urban Forestry Commission• Commission for People with Disabilities• Immigrant and Refugee Commission
The project team also worked closely with the Department of Neighborhoods (DON) to help circulate the survey to neighborhood groups across the city. SDOT staff attended a series of District and Neighborhood Council meetings to brief council members on the Plan update and to help advertise the public survey. Throughout the survey period, SDOT staff monitored incoming survey responses, and worked with DON on targeted outreach to neighborhoods with low response rates in order to gather more responses from underrepresented areas of the city.
Table 1 lists the community briefings attended.
The project team worked with Asian Counseling and Referral Service (ACRS) to hold a focus group to help gather survey responses from native Vietnamese and Chinese speakers. With assistance from ACRS, SDOT engaged a Vietnamese translator to help communicate the survey in real time to attendees.
The project team also engaged an OIRA-identified community member to assist with gathering survey responses from the East African community. This targeted outreach resulted in a total of 100 survey responses from the East African community.

6 | PEDESTRIAN MASTER PLAN UPDATE, PUBLIC SURVEY REPORT PEDESTRIAN MASTER PLAN UPDATE, PUBLIC SURVEY REPORT | 7
PMP PUBLIC SURVEY IN NUMBERS
WHO RESPONDED
We received a total of approximately 4,700 survey responses from across the city, exceeding the initial projection of 3,600 responses.
Figure 1 shows the number of responses divided by north, central and south areas of Seattle. We recieved the most responses from the northern part of the city (2,322). We received a similar number of responses from the central (854) and south (844) sections. A list of responses received according to neighborhood of residence is included in the Appendix.
To ensure we received survey responses from as broad a cross-section of Seattle residents as possible, the project team worked with OIRA staff to set initial survey response targets for various segments of the city’s population. These targets were based on assuming an overall survey response target of 3,600 responses, and aiming
for a response rate roughly proportionate to the overall ratio each group represents as part of the overall population of the city (according to 2010 census data). Table 2 summarizes both the initial target number of responses for each group, as well as the actual number of survey responses received.
While the total number of responses received was higher than the initial projection, generally speaking, the total number of responses received from most non-white groups was somewhat lower than these groups’ overall proportion of the city’s population (with the exception of American Indian/Alaska Native and Native Hawaiian/Pacific Islander, both of which constituted a slightly higher proportion of survey responses than their proportion of the city’s overall population).
4,700Total Survey Responses Collected
Outdoor SummerEvents
Pedestrian Master Plan Open Houses
Over 6,000 Written Comments
Over 25CommunityBriefings
45 Neighborhoods Represented
2
Laotian Spanish Vietnamese
Different Languages Translated for the Survey
Cambodian
Korean Thai Russian Chinese
3
RACE TARGETRESPONSES
RESPONSES RECEIVED
Total Responses 3,600 4,678White 2,502 3,295Asian 497 203
Black/African American 284 162American Indian/Alaska Native 29 46
Native Hawaiian or other Pacific Islander
14 17
Two or More 184 132Other 86 75
Prefer not to say - 391
TABLE 2: SURVEY RESPONDENTS BY RACE

8 | PEDESTRIAN MASTER PLAN UPDATE, PUBLIC SURVEY REPORT PEDESTRIAN MASTER PLAN UPDATE, PUBLIC SURVEY REPORT | 9
2010 US CENSUS
PMP SURVEY RESULTS
32%Male
<1%Transgender
<1%Other
Prefer not to answer
12%
50%Male
50%Female
55%Female
SURVEY RESPONSES BY GENDER
TABLE 3: WHERE RESPONDENTS LIVE
We also compared the percentage of responses received for each age group to the percentage these age groups represent of the city’s population as a whole (according to the 2010 census). The figure at right shows that approximately half of all responders were between the ages of 40 and 64, while the 2010 census estimates that this group constitutes approximately 33% of the city’s overall population. This discrepancy may be due in part to the tendency of older people to be more civically engaged, and thus more likely to respond to a public survey. Additionally, this skewed representation may also be due in part to the low rate of survey responses received from people 17 or younger (minors), a group that constitutes approximately 15% of the overall Seattle population.
In comparing the total number of survey responses from males and females against the composition of the city’s overall population, we found that the survey responses were generally consistent with the ratio of the larger population, with only a slightly higher response rate from female citizens.
The figures on page 10 summarize additional self-reported demographic information provided by survey responders, including family status, vehicles per household, and typical walking patterns.
SURVEY RESPONSES BY AGE
2010 US CENSUS
18%50-64
<1%17 or younger
15%17 or younger
8%18-29
27%30-39
26%40-49
25%50-64
2%Prefer not to answer
18%30-39
15%40-49
11%65 or over
23%18-29
12%65 or over
18%50-64
PMP SURVEY RESULTS
FIGURE 1: NUMBER OF RESPONSES BY AREA
1 2 3 40.5Miles
¯North Seattle
2,322
Central Seattle854
South Seattle844
Outside of Seattle
62
Other or No Response: 619

10 | PEDESTRIAN MASTER PLAN UPDATE, PUBLIC SURVEY REPORT PEDESTRIAN MASTER PLAN UPDATE, PUBLIC SURVEY REPORT | 11
CHILDREN UNDER 17 IN HOUSEHOLD VEHICLES PER HOUSEHOLD
RENT OR OWN RESPONDENT OR FAMILY MEMBER HAS A DISABILITY
Two41%
One40%
Three9%
Zero8%
Four or more2%
No65%
Yes35%
No90%
Yes10%
Rent22%
Own77%
Other1%
WALKING FREQUENCY (DAYS/WEEK WALKING MORE THAN ONE BLOCK)REASONS TO WALK
5-626%
1-27%
3-414%
02%Commuting
to work or school
Accessing public transit
21%
54%
Shopping or dining
out 76%
Going to community
destinations72%
Exercise / leisure
(including walking a
pet) 85%
Taking children to/from school 7
51%
The Pedestrian Master Plan Update public survey asked for feedback on two principal topics to help inform the ongoing update to the Plan. The first set of questions were intended to help SDOT better understand the types and locations of pedestrian improvements that are most important to people. The second set of questions were intended to gather feedback on the various low-cost design options the City is evaluating as a means of providing more walking improvements to more neighborhoods. In addition, the survey included a general, open-ended question, asking respondents to tell us the single, most important thing we can do to improve walking in Seattle. The following section summarizes the responses we received to these questions.
GENERAL SURVEY QUESTIONS: PRIORITIZING WALKING IMPROVEMENTS
To help provide input on the types and locations of pedestrian improvements to prioritize within the update, the survey asked respondents to provide feedback on three key questions about walking conditions in Seattle:
• What makes it difficult or unpleasant for you to walk?
• Where should the City prioritize walking improvements first?
• What types of pedestrian improvements should we build first?
We asked respondents to provide a numbered rating for each possible answer options, from one (which was either “not a problem” or “not very important”) to six (which was either “absolute barrier to walking” or “extremely important”).
SURVEY RESULTS
66%
Busy streets with no sidewalks
Residential streets with no sidewalks
Tripping hazards on sidewalks
Sidewalks that are too narrow
Sidewalks that do not provide a buffer
Not enough safe ways to cross busy streets
Missing curb ramps at intersections
People driving too fast
Poor Lighting
Drivers not stopping for people crossing streets
Not enough time to cross with signal
Blocked sidewalks
Other
4.74
4.15
3.48
3.00
3.18
4.15
2.59
4.07
3.73
4.15
2.89
3.58
3.74
46%
28%
21%
23%
20%
31%
13%
13%
10%
9%
6%
7%
8%
Percent Giving Highest Score Average Point Value
Higher score means absolute barrier to walking.
TABLE 3: QUESTION #1, “WHAT MAKES IT DIFFICULT OR UNPLEASANT FOR YOU TO WALK?”
12 | PEDESTRIAN MASTER PLAN UPDATE, PUBLIC SURVEY REPORT PEDESTRIAN MASTER PLAN UPDATE, PUBLIC SURVEY REPORT | 13
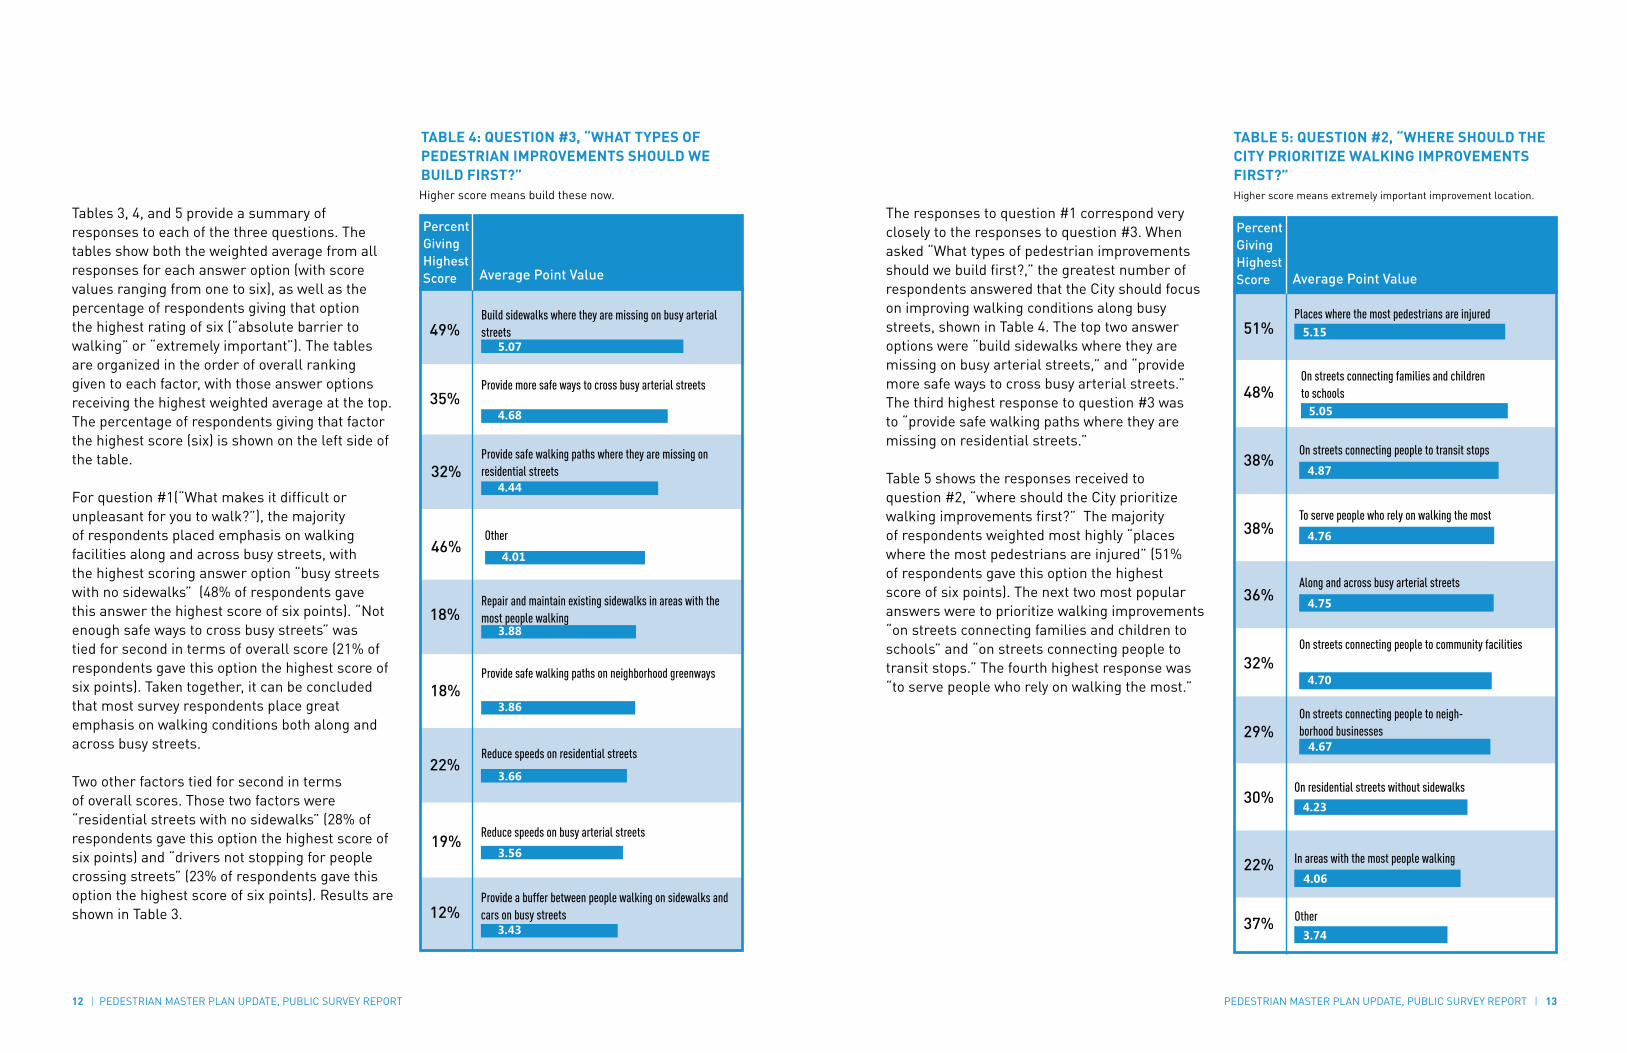
The responses to question #1 correspond very closely to the responses to question #3. When asked “What types of pedestrian improvements should we build first?,” the greatest number of respondents answered that the City should focus on improving walking conditions along busy streets, shown in Table 4. The top two answer options were “build sidewalks where they are missing on busy arterial streets,” and “provide more safe ways to cross busy arterial streets.” The third highest response to question #3 was to “provide safe walking paths where they are missing on residential streets.”
Table 5 shows the responses received to question #2, “where should the City prioritize walking improvements first?” The majority of respondents weighted most highly “places where the most pedestrians are injured” (51% of respondents gave this option the highest score of six points). The next two most popular answers were to prioritize walking improvements “on streets connecting families and children to schools” and “on streets connecting people to transit stops.” The fourth highest response was “to serve people who rely on walking the most.”
TABLE 4: QUESTION #3, “WHAT TYPES OF PEDESTRIAN IMPROVEMENTS SHOULD WE BUILD FIRST?”
Build sidewalks where they are missing on busy arterial streets
Provide more safe ways to cross busy arterial streets
Provide a buffer between people walking on sidewalks and cars on busy streets
Provide safe walking paths where they are missing on residential streets
Repair and maintain existing sidewalks in areas with the most people walking
Reduce speeds on residential streets
Other
Reduce speeds on busy arterial streets
Provide safe walking paths on neighborhood greenways
49%
35%
32%
46%
18%
18%
22%
19%
12%
Average Point Value
3.43
3.56
3.66
3.86
3.88
4.01
4.44
4.68
5.07
Higher score means build these now.
Percent Giving Highest Score
TABLE 5: QUESTION #2, “WHERE SHOULD THE CITY PRIORITIZE WALKING IMPROVEMENTS FIRST?”
In areas with the most people walking
On streets connecting people to transit stops
To serve people who rely on walking the most
Along and across busy arterial streets
Places where the most pedestrians are injured
On residential streets without sidewalks
Other
On streets connecting families and children to schools
On streets connecting people to community facilities
On streets connecting people to neigh-borhood businesses
51%
48%
38%
38%
36%
32%
29%
30%
22%
37%
4.06
4.87
4.76
4.70
4.75
4.67
5.15
4.23
5.05
3.74
Average Point Value
Higher score means extremely important improvement location.
Percent Giving Highest Score
Tables 3, 4, and 5 provide a summary of responses to each of the three questions. The tables show both the weighted average from all responses for each answer option (with score values ranging from one to six), as well as the percentage of respondents giving that option the highest rating of six (“absolute barrier to walking” or “extremely important”). The tables are organized in the order of overall ranking given to each factor, with those answer options receiving the highest weighted average at the top. The percentage of respondents giving that factor the highest score (six) is shown on the left side of the table.
For question #1(“What makes it difficult or unpleasant for you to walk?”), the majority of respondents placed emphasis on walking facilities along and across busy streets, with the highest scoring answer option “busy streets with no sidewalks” (48% of respondents gave this answer the highest score of six points). “Not enough safe ways to cross busy streets” was tied for second in terms of overall score (21% of respondents gave this option the highest score of six points). Taken together, it can be concluded that most survey respondents place great emphasis on walking conditions both along and across busy streets.
Two other factors tied for second in terms of overall scores. Those two factors were “residential streets with no sidewalks” (28% of respondents gave this option the highest score of six points) and “drivers not stopping for people crossing streets” (23% of respondents gave this option the highest score of six points). Results are shown in Table 3.

14 | PEDESTRIAN MASTER PLAN UPDATE, PUBLIC SURVEY REPORT PEDESTRIAN MASTER PLAN UPDATE, PUBLIC SURVEY REPORT | 15
LOW-COST WALKING PATHS
1. Stamped and stained asphalt sidewalk with curb2. Stained asphalt sidewalk with curb 3. Curb-separated walking path at same level as
cars4. Shared walking space with traffic calming
features to slow cars5. Traditional concrete sidewalk with curbs on one
side of the street only, with rain gardens6. Walking path at same level as cars, set behind
landscaping
For each option, we asked respondents to tell us how comfortable they and members of their household or family would feel on each type of walking path. The following pages provide a summary of the feedback for each type of low-cost walking path.
1. STAMPED AND STAINED ASPHALT SIDEWALK WITH CURB
Very Comfortable
60%Comfortable
30%
Not Comfortable
3%Somewhat Uncomfortable
3%
“I really like the stamped asphalt sidewalks as I use them often and find them just as good, and sometimes better than, ‘traditional’ concrete. I know that they are considerably less-expensive to put in, thus more sidewalks could be put in for every dollar spent. I like that a lot!”
[NE 105th St]
[Rainier Summer Streets]
In addition to collecting feedback on the types and locations of improvements to prioritize moving forward, the survey also helped us get feedback on low-cost walking improvements we’re considering. These options can help provide walking improvements to more neighborhoods faster, potentially at as much as one-half the cost of a traditional concrete sidewalk.
While the type of design appropriate for a particular street will vary, we wanted to hear respondent’s thoughts on six different low-cost design options we are considering:
This option is a raised walkway, separated from vehicular traffic by an extruded curb. The asphalt sidewalk is stamped and stained to look like brick. There is no landscaping or other buffer between the roadway and the walking path.
90% of respondents reported that they and members of their household or family would feel comfortable or very comfortable on this type of walking path.

16 | PEDESTRIAN MASTER PLAN UPDATE, PUBLIC SURVEY REPORT PEDESTRIAN MASTER PLAN UPDATE, PUBLIC SURVEY REPORT | 17
2. STAINED ASPHALT SIDEWALK WITH CURB
Very Comfortable
39%
Comfortable42%
Not Comfortable
4%
Somewhat Uncomfortable
15%
“Comfortable so long as the raise is sufficient to keep cars from parking here or drivers thinking this is a parking strip.”
3. CURB-SEPARATED WALKING PATH AT SAME LEVEL AS CARS
Very Comfortable
19%
Comfortable38%
Not Comfortable
10%
Somewhat Uncomfortable 33%
“Very comfortable if the difference between walking and driving spaces are made extremely obvious (i.e., difference in color/material) to drivers.”
[N 97th St & Fremont Ave N]
[28th Ave NW]
[N 87th St.]
This option is a raised walkway, separated from vehicular traffic by an extruded curb. The asphalt is stained gray to appear similar to concrete. There is no landscaping or other buffer between the roadway and the walking path.
81% of respondents reported that they and members of their household or family would feel comfortable or very comfortable on this type of walking path.
This option is a walking path at the same level as the roadway, separated from cars by a curb or wheel-stops. There is no landscaping or other buffer between the roadway and the walking path.
57% of respondents reported that they and members of their household or family would feel comfortable or very comfortable on this type of walking path.

18 | PEDESTRIAN MASTER PLAN UPDATE, PUBLIC SURVEY REPORT PEDESTRIAN MASTER PLAN UPDATE, PUBLIC SURVEY REPORT | 19
4. SHARED WALKING SPACE WITH TRAFFIC CALMING FEATURES TO SLOW CARS
Very Comfortable
8%
Comfortable17%
Not Comfortable
Somewhat Uncomfortable
38%
37%
“In some neighborhoods where traffic is very low on the road this would be ok, but some roads that are more busy I would not be comfortable walking on.”
5. TRADITIONAL CONCRETE SIDEWALK WITH CURBS ON ONE SIDE OF THE STREET ONLY, WITH RAIN GARDENS
Very Comfortable
67%
Comfortable27%
Not Comfortable
2%
Somewhat Uncomfortable
4%
“Sidewalks on only one side of the street seems like a good budget option. Rain gardens are great -- be sure landscaping stays small enough to preserve visibility and safety.”
[Longfellow Shared Space Street, Santa Monica, CA]
[Shared road]
[Speed hump]
[2nd Ave NW]
[2nd Ave NW]
In this option, people walking and people driving share the roadway space. Traffic calming features such as chicanes, landscape elements, and speed humps are used to slow cars.
25% of respondents reported that they and members of their household or family would feel comfortable or very comfortable on this type of walking path.
With this option, project costs would be shared with other City agencies where stormwater retention features are needed. Sidewalks could be built concurrently with drainage improvements.
94% of respondents reported that they and members of their household or family would feel comfortable or very comfortable on this type of walking path.

20 | PEDESTRIAN MASTER PLAN UPDATE, PUBLIC SURVEY REPORT PEDESTRIAN MASTER PLAN UPDATE, PUBLIC SURVEY REPORT | 21
6. WALKING PATH AT SAME LEVEL AS CARS, SET BEHIND LANDSCAPING
Very Comfortable
70%
Comfortable24%
Not Comfortable
2%Somewhat
Uncomfortable5%
“Great buffer between cars and pedestrians. I really love the winding path through the landscape. Seems like a very pleasant place to walk and safe too.”
WRITTEN COMMENTS ON LOW-COST WALKING IMPROVEMENTS
[17th Ave NE Green Street]
[At-grade sidewalk behind landscaping]
This option is a walking path at the same level as the roadway, but is separated by landscaping. The walking path is not raised, and there is no curb.
94% of respondents reported that they and members of their household or family would feel comfortable or very comfortable on this type of walking path.
In addition to the quantitative feedback received for each of these low-cost design options, we received over 2,700 written comments describing what respondents do or do not like about these low-cost walking paths. The principal themes that emerge from these comments were as follows:
• Necessity of a clear barrier between pedestrians and traffic
• Need for durable/long-lasting sidewalks• Need to build for universal access• Desire to maintain neighborhood aesthetics• Need to build the sidewalks wide enough for
comfort• Opinion that building low-cost is a good way
to build more• We need to build sidewalks to connect people• Desire to build sidewalks on both sides of the
street• Worry about loss of parking
The full list of written comments can be found on the project website [http://www.seattle.gov/transportation/pedMasterPlan.htm].
22 | PEDESTRIAN MASTER PLAN UPDATE, PUBLIC SURVEY REPORT PEDESTRIAN MASTER PLAN UPDATE, PUBLIC SURVEY REPORT | 23
OPEN-ENDED SURVEY QUESTION
NEXT STEPS
We will use the public feedback summarized in this report to update the Plan’s prioritization methodology and implementing strategies and actions.
A public review draft of the updated Pedestrian Master Plan will be available on SDOT’s website in early April, 2015.
To be included on the project email list and see project updates, please visit www.seattle.gov/transportation/pedMasterPlan.htm.
• Repair existing sidewalks and ensure that they are kept clear of overgrown vegetation
• Install more pedestrian lighting • Focus on pedestrian safety around schools• Teach drivers, bikers and pedestrians to pay
attention of each other • Build sidewalks on busy roads• Build sidewalks that provide universal access• Restrict sidewalk closures due to construction• Widen sidewalks• Lower crime to make walking safer• Reduce crosswalk wait time• Build sidewalks on both sides of the street
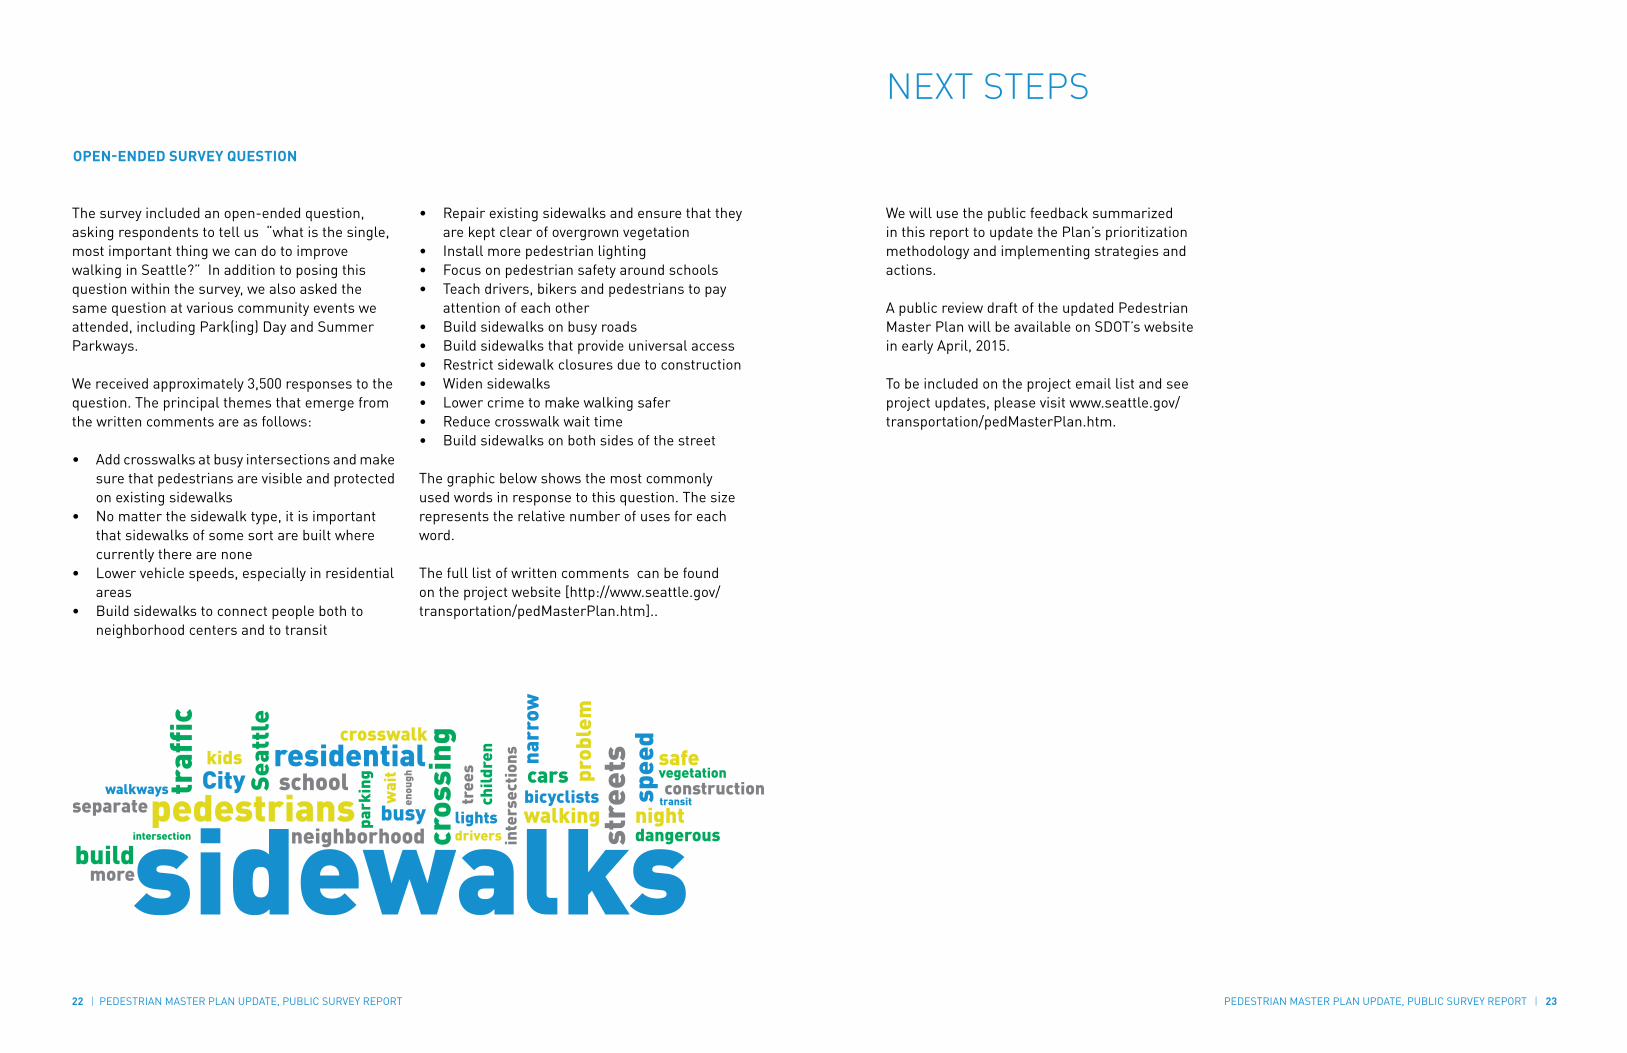
The graphic below shows the most commonly used words in response to this question. The size represents the relative number of uses for each word.
The full list of written comments can be found on the project website [http://www.seattle.gov/transportation/pedMasterPlan.htm]..
sidewalksstreets
walkingpedestrians
traffic
neighborhood crossing
intersectio
ns
drivers
safe
busyschool cars
parking
intersection
residential
dangerous
City Seattle
speed
construction
enough vegetation
wait
nightlights
kids narrow
trees problem
crosswalk
child
ren
bicyclists
buildmore
transitwalkways
separate
The survey included an open-ended question, asking respondents to tell us “what is the single, most important thing we can do to improve walking in Seattle?” In addition to posing this question within the survey, we also asked the same question at various community events we attended, including Park(ing) Day and Summer Parkways.
We received approximately 3,500 responses to the question. The principal themes that emerge from the written comments are as follows:
• Add crosswalks at busy intersections and make sure that pedestrians are visible and protected on existing sidewalks
• No matter the sidewalk type, it is important that sidewalks of some sort are built where currently there are none
• Lower vehicle speeds, especially in residential areas
• Build sidewalks to connect people both to neighborhood centers and to transit
24 | PEDESTRIAN MASTER PLAN UPDATE, PUBLIC SURVEY REPORT PEDESTRIAN MASTER PLAN UPDATE, PUBLIC SURVEY REPORT | 25
APPENDIX
Pedestrian Master Plan Public Survey................................................................25
Table of Responses by Neighborhood.................................................................36
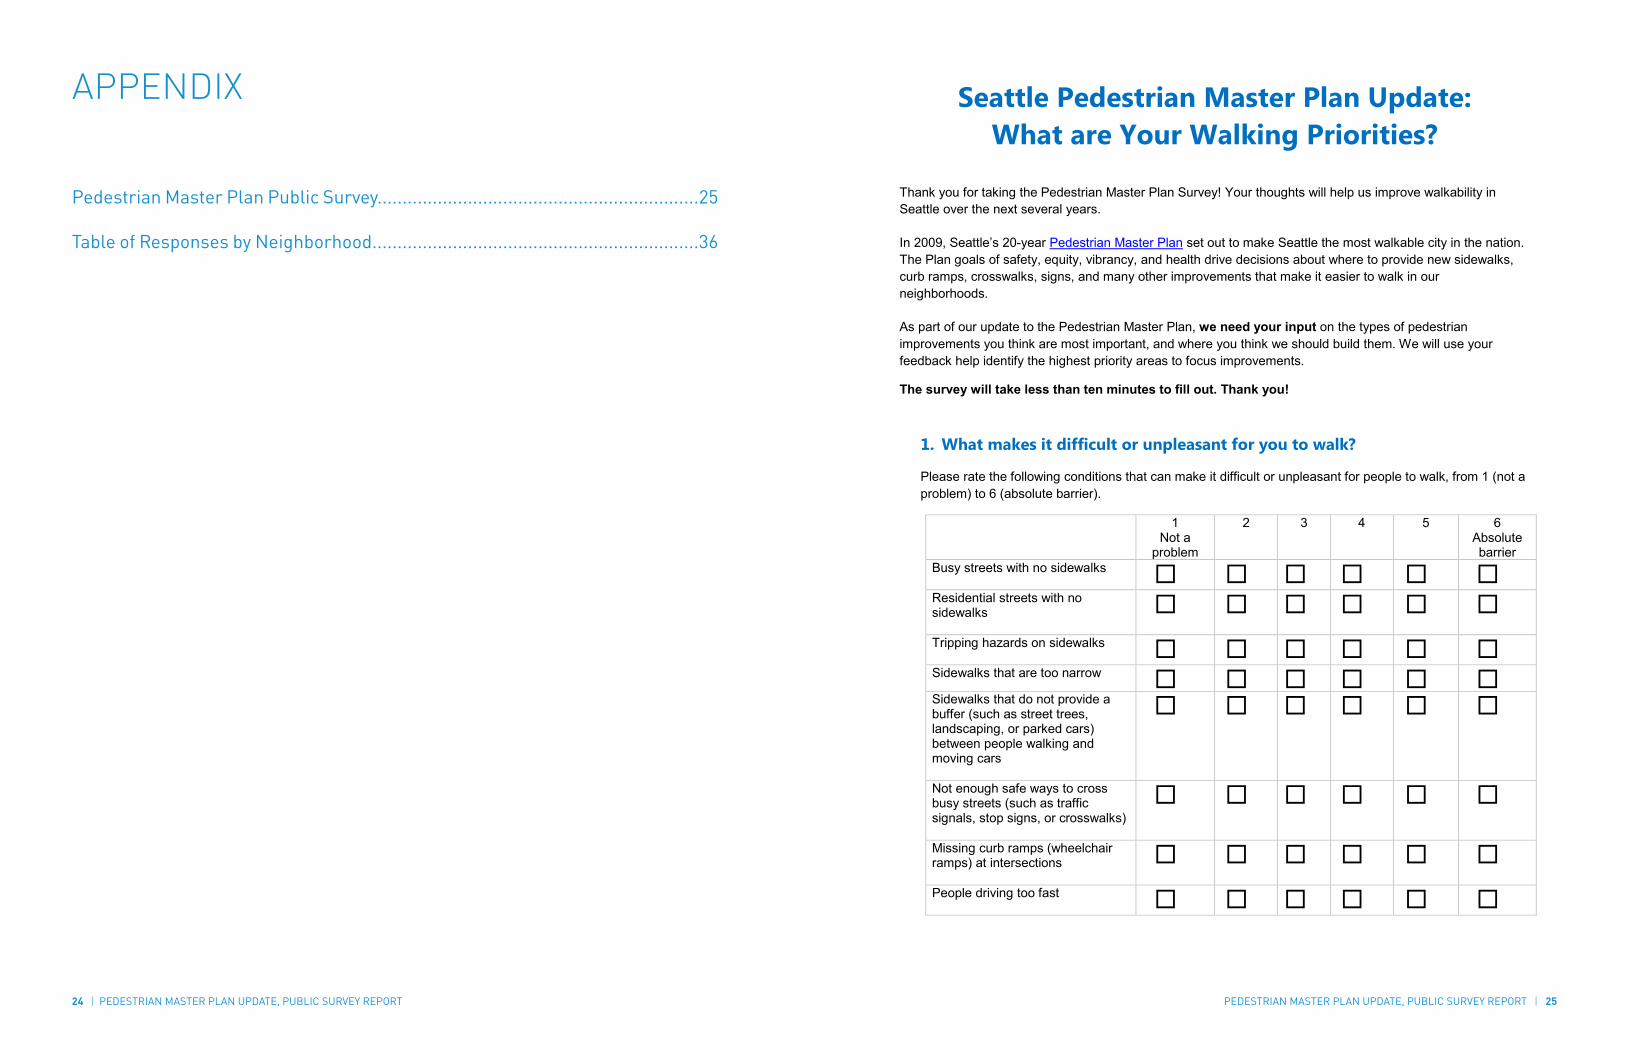
Seattle Pedestrian Master Plan Update: What are Your Walking Priorities?
Thank you for taking the Pedestrian Master Plan Survey! Your thoughts will help us improve walkability in Seattle over the next several years.
In 2009, Seattle’s 20-year Pedestrian Master Plan set out to make Seattle the most walkable city in the nation. The Plan goals of safety, equity, vibrancy, and health drive decisions about where to provide new sidewalks,curb ramps, crosswalks, signs, and many other improvements that make it easier to walk in our neighborhoods.
As part of our update to the Pedestrian Master Plan, we need your input on the types of pedestrian improvements you think are most important, and where you think we should build them. We will use your feedback help identify the highest priority areas to focus improvements.
The survey will take less than ten minutes to fill out. Thank you!
1. What makes it difficult or unpleasant for you to walk?
Please rate the following conditions that can make it difficult or unpleasant for people to walk, from 1 (not a problem) to 6 (absolute barrier).
1Not a
problem
2 3 4 5 6Absolute barrier
Busy streets with no sidewalks Residential streets with no sidewalks Tripping hazards on sidewalks Sidewalks that are too narrow Sidewalks that do not provide a buffer (such as street trees, landscaping, or parked cars) between people walking andmoving cars
Not enough safe ways to cross busy streets (such as traffic signals, stop signs, or crosswalks)
Missing curb ramps (wheelchair ramps) at intersections People driving too fast

26 | PEDESTRIAN MASTER PLAN UPDATE, PUBLIC SURVEY REPORT PEDESTRIAN MASTER PLAN UPDATE, PUBLIC SURVEY REPORT | 27
Poor lighting Drivers not stopping for people crossing streets Not enough time to cross street with signal Blocked sidewalks (by parked cars, utility poles, etc.)
Other (please specify) _________________
2. Where should the City prioritize walking improvements first? Please rate how important each of the following improvement locations is, from 1 (not very important), to 6 (extremely important).
1Not very important
2 3 4 5 6Extremely important
In areas with the most people walking (e.g., Downtown, University District, Capitol Hill, etc.)
On streets connecting people to transit stops To serve people who rely on walking the most (e.g., low-incomeand transit dependent residents)
On streets connecting people to local community facilities such as parks, libraries, and community centers
Along and across busy streets On streets connecting people to neighborhood businesses (grocery stores, coffee shops, restaurants, etc.)
Places where the most people walking are injured On residential streets without sidewalks
On streets connecting families and children to schools Other (please specify) _________________
3. What types of walking improvements should we build first? Please rate how important each of the following improvement types is, from 1 (not very important, so we should build later), to 6 (extremely important, so we should build now).
1Not very important
(build later)
2 3 4 5 6Extremely important
(build now)
Repair and maintain existing sidewalks in areas with the most people walking (e.g., Downtown, University District, Capitol Hill, etc.)
Provide safe walking paths where they are missing on residential streets
Provide a buffer (such as street trees, landscaping, or parked cars) between people walking on sidewalks and cars on busy streets
Build sidewalks where they are missing on busy streets Provide safe walking paths on neighborhood greenways* Provide more safe ways to cross busy streets Reduce speeds on busy streets Reduce speeds on residential streets Other (please specify) _________________
*Neighborhood greenways are calm residential streets with low car volumes and speeds. They provide safe, calm routes for people walking and biking to connect to destinations like parks, schools, shops, and restaurants. See www.seattle.gov/transportation/greenways.htm for more information.

28 | PEDESTRIAN MASTER PLAN UPDATE, PUBLIC SURVEY REPORT PEDESTRIAN MASTER PLAN UPDATE, PUBLIC SURVEY REPORT | 29
4. How comfortable would you feel walking on residential streets with the following types of walking paths?
Background: Many streets in Seattle are missing sidewalks. Because it would cost the City about $3.6 billion and would take many years to build traditional concrete sidewalks where they are currently missing, the City is launching a new program to provide lower-cost options for residential streets without sidewalks. These optionscan get walking improvements to more neighborhoods faster, potentially at as much as one-third the cost.
While the type of improvement appropriate for a particular street will vary, we’d like to hear your thoughts on different options we are considering.
The following questions will show images of different types of walking paths. Please tell us how comfortable you and members of your household or family would feel on each type.
4.a. Stamped and stained asphalt sidewalk with curb (raised walkway)
Very comfortable
Comfortable
Somewhat uncomfortable
Not comfortable
4.b. Stained asphalt sidewalk with curb (raised walkway)
Very comfortable
Comfortable
Somewhat uncomfortable
Not comfortable
4.c. Curb-separated walking path at same level as cars
Very comfortable
Comfortable
Somewhat uncomfortable
Not comfortable

30 | PEDESTRIAN MASTER PLAN UPDATE, PUBLIC SURVEY REPORT PEDESTRIAN MASTER PLAN UPDATE, PUBLIC SURVEY REPORT | 31
4.d. Shared walking space (people walking and driving share the roadway space) with traffic calming features to slow cars, including curved roadways, landscape elements, and speed humps.
Very comfortable
Comfortable
Somewhat uncomfortable
Not comfortable
4.e. Traditional concrete sidewalk with curbson one side of the street only, with raingardens.
Very comfortable
Comfortable
Somewhat uncomfortable
Not comfortable

32 | PEDESTRIAN MASTER PLAN UPDATE, PUBLIC SURVEY REPORT PEDESTRIAN MASTER PLAN UPDATE, PUBLIC SURVEY REPORT | 33
4.f. Walking path at same level as cars, set behind landscaping (no curb).
Very comfortable
Comfortable
Somewhat uncomfortable
Not comfortable
In the box below, please tell us more about what you do or don’t like about these lower-cost walking improvements for residential streets.
[Limit online survey answer to 500 characters]
5. What is the single, most important thing we can do to improve walking in Seattle?
[Limit online survey answer to 500characters]
6. Tell us a Little About You
a. Do you live in the City of Seattle? Yes___ No___
b. What is your home zip code? _______________
c. What neighborhood do you live in? _______________
d. Do you work in the City of Seattle? Yes___ No___
e. What neighborhood do you work in? _______________
f. How many vehicles does your household own? _________
g. During a typical week, how many days do you walk more than one block in the City of Seattle?
0
1-2
3-4
5-6
7
h. Which of the following activities would typically involve you walking more than one block on streets in
the City of Seattle? (Select all that apply to you.)
Commuting to work or school
Shopping or dining out
Going to libraries, community centers, parks, or other community destinations

34 | PEDESTRIAN MASTER PLAN UPDATE, PUBLIC SURVEY REPORT PEDESTRIAN MASTER PLAN UPDATE, PUBLIC SURVEY REPORT | 35
Exercise / leisure (including walking a pet)
Taking children to / from school
Accessing public transit
i. Do you have one or more children (17 or younger) living in your household currently?
Yes
No
We aim to reach out to and hear from a broad cross-section of Seattle. By answering the following optional questions you’ll help us better understand who is engaging with us.
Please select your gender identity:
Male Female Transgender Other _____
Do you:
Rent Own Other ______
Please select your age category:
17 or younger 18-29 30-39 40-49 50-64 65 or over Prefer not to answer
Do you, or a member of your family, have a disability?
Yes No
What is your race? Select all that apply.
American Indian/Alaska Native Asian Black/African American Native Hawaiian or other Pacific Islander White Other Two or more of these Prefer not to answer
Are you of Hispanic, Latino, or Spanish origin?
Yes No
What language do you speak at home? ___________________________
Thank you for completing the survey. We will use your feedback will update the priorities in thePedestrian Master Plan. We expect to release a draft of the updated Plan for public review in February, 2016.
To be included on the project email list and receive project updates, please visit www.seattle.gov/transportation/pedMasterPlan.htm.

36 | PEDESTRIAN MASTER PLAN UPDATE, PUBLIC SURVEY REPORT PEDESTRIAN MASTER PLAN UPDATE, PUBLIC SURVEY REPORT | 37
Lake City 288 Hillman City 44 North Beach/Blue Ridge 14
Ballard 247 Ravenna 42 Puget Ridge 14
Greenwood 214 Mount Baker 40 Madison Park 13
Upper Queen Anne 210 Northgate 34 Alki 12
Wedgewood 175 Olympic Hills 34 Highland Park 12
Rainier Beach 159 Belltown 33 Madrona 12
Broadview 146 Downtown 33 Holly Park 12
Lower Queen Anne 135 Eastlake 32 View Ridge 11
Capitol Hill 133 University District 32 Fauntleroy 10
Maple Leaf 123 Lichton Springs 30 Interbay 9
Crown Hill 120 Bryant 27 Westlake 9
West Seattle 109 Roosevelt 27 Lakeridge 5
Pinehurst 106 Matthews Beach 26 Pioneer Square 5
Beacon Hill 106 Seward Park 24 International District 4
Columbia City 103 Cedar Park 22 Jackson Park 4
Haller Lake 82 Delridge 20 Othello 4
Central District 81 Portage Bay 20 Rainier View 4
Wallingford 76 South Lake Union 20 Yesler Terrace 4Magnolia 69 First Hill 19 Judkins Park 3
Phinney Ridge 68 Sand Point 19 Rainier Valley 3
Montlake 66 High Point 18 Roxhill 3
Meadowbrook 64 Brighton 16 Windermere 3
South Park 59 Victory Heights 16 Loyal Heights 2
Fremont 58 Arbor Heights 15 SoDo 1
Green Lake 58 Laurelhurst 15 Outside of Seattle 62
Bitter Lake 54 Leschi 15 Other 18
Georgetown 51 Madison Valley 14 No Response 601
WHERE RESPONDENTS LIVENEIGHBORHOOD NUMBER OF RESPONSES
The Seattle Department of Transportation700 5th Avenue, Suite 3800PO Box 34996Seattle, WA 98124-4996(206) 684-ROAD (7623)www.Seattle.gov/transportation 01.2016