pediatric nutrition surveillance
TRANSCRIPT
2007 U.S. Department of HealtH anD HUman ServiceS
Pediatric Nutrition Surveillance
2006 Report

Suggested Citation
Polhamus B, Dalenius K, Borland E, Smith B, Grummer-Strawn L. Pediatric Nutrition Surveillance 2006 Report. Atlanta: U.S. Department of Health and Human Services, Centers for Disease Control and Prevention; 2007.
Acknowledgments
We gratefully acknowledge and thank all contributors to the Pediatric Nutrition Surveillance System (PedNSS). The efforts of state surveillance coordinators, data processing staff, and local clinic staff in collecting data and using nutrition surveillance systems make the national PedNSS possible.
This report is available at http://www.cdc.gov/nccdphp/dnpa/pednss.htm.
Division of Nutrition, Physical Activity and Obesity National Center for Chronic Disease Prevention and Health Promotion
Centers for Disease Control and Prevention
4770 Buford Highway NE Mail Stop K-25
Atlanta, GA 30341-3717 (770) 488-5702
This report summarizes selected data on child health and nutrition indicators received from state, territorial, and Indian Tribal Organizations that contributed to the Centers for Disease Control and Prevention (CDC) Pediatric Nutrition Surveillance 2006 Report.
Centers for Disease Control and Prevention . . . . . . . . . . . . Julie Louise Gerberding, MD, MPH, Director
Coordinating Center for Health Promotion . . . . . . . . . . . . Kathleen Toomey, MD, MPH, Director
National Center for Chronic Disease Prevention and Health Promotion . . . . . . . . . . . . . . . . . . . . . . . . . . . . . Janet Collins, PhD, Director
Division of Nutrition, Physical Activity and Obesity . . . . . William Dietz, MD, PhD, Director
Nutrition Branch . . . . . . . . . . . . . . . . . . . . . . . . . . . . . . . . . . Laurence Grummer-Strawn, PhD, Chief
Program Development and Evaluation Branch . . . . . . . . . . Casey Hannan, MPH, Acting Chief
2006 Report 1
The Pediatric Nutrition Surveillance System (PedNSS) is a public health surveillance system that monitors the nutritional status of low-income children in federally funded maternal and child health programs. Data on birthweight, breast-feeding, anemia, short stature, underweight, and overweight are collected for children who attend public health clinics for routine care, nutrition education, and supplemental food.
Data are collected at the clinic level then aggregated at the state level and submitted to the Centers for Disease Control and Prevention (CDC) for analysis. A national nutrition surveillance report is produced using PedNSS data. Surveillance reports also are produced for each contributor (defined as a state, U.S. territory, or Indian Tribal Organization [ITO]).
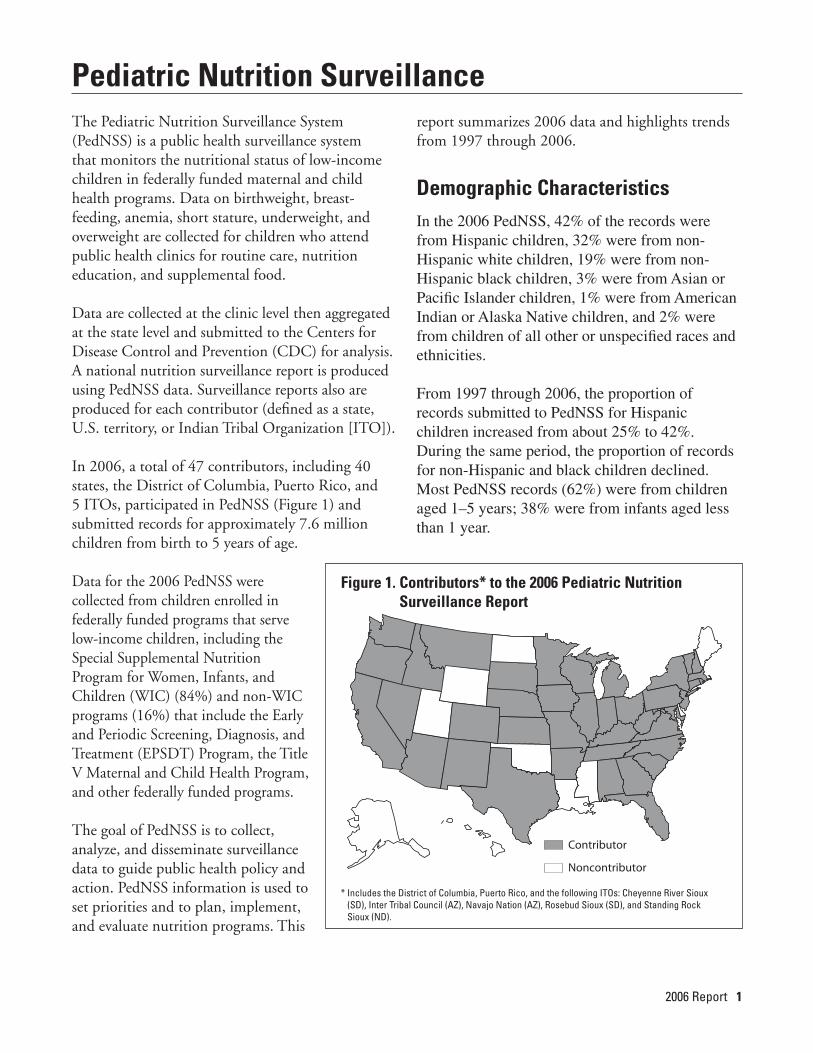
In 2006, a total of 47 contributors, including 40 states, the District of Columbia, Puerto Rico, and 5 ITOs, participated in PedNSS (Figure 1) and submitted records for approximately 7.6 million children from birth to 5 years of age.
Data for the 2006 PedNSS were collected from children enrolled in federally funded programs that serve low-income children, including the Special Supplemental Nutrition Program for Women, Infants, and Children (WIC) (84%) and non-WIC programs (16%) that include the Early and Periodic Screening, Diagnosis, and Treatment (EPSDT) Program, the Title V Maternal and Child Health Program, and other federally funded programs.
The goal of PedNSS is to collect, analyze, and disseminate surveillance data to guide public health policy and action. PedNSS information is used to set priorities and to plan, implement, and evaluate nutrition programs. This
report summarizes 2006 data and highlights trends from 1997 through 2006.
Demographic CharacteristicsIn the 2006 PedNSS, 42% of the records were from Hispanic children, 32% were from non-Hispanic white children, 19% were from non-Hispanic black children, 3% were from Asian or Pacific Islander children, 1% were from American Indian or Alaska Native children, and 2% were from children of all other or unspecified races and ethnicities.
From 1997 through 2006, the proportion of records submitted to PedNSS for Hispanic children increased from about 25% to 42%. During the same period, the proportion of records for non-Hispanic and black children declined. Most PedNSS records (62%) were from children aged 1–5 years; 38% were from infants aged less than 1 year.
Pediatric Nutrition Surveillance
Contributor
Noncontributor
Figure 1. Contributors* to the 2006 Pediatric Nutrition Surveillance Report
* Includes the District of Columbia, Puerto Rico, and the following ITOs: Cheyenne River Sioux (SD), Inter Tribal Council (AZ), Navajo Nation (AZ), Rosebud Sioux (SD), and Standing Rock Sioux (ND).

2 Pediatric Nutrition Surveillance
Table 1. State-specific prevalence of selected nutrition indicators for children aged <5 years, 2006 Pediatric Nutrition Surveillance System
Ever Breastfed Short Contributor LBW* HBW† Breastfed 6 Months Anemia‡ Stature§ Overweight ||
* Low birthweight: <2,500 grams.† High birthweight: >4,000 grams.‡ Children aged 6 months to 2 years: hemoglobin (Hb) <11.0 g/dL or hematocrit (Hct) <32.9%. Children aged 2–5 years: Hb <11.1 g/dL or Hct <33.0%. Adjusted for altitude. § 2000 CDC growth chart percentiles: <5th percentile length-for-age for children younger than aged 2 years or <5th percentile height-for-age for children aged 2 years
or older. || 2000 CDC growth chart percentile: >95th percentile BMI-for-age for children aged 2 years or older.
Alabama 12.4 4.9 33.9 2.0 19.0 6.8 13.7Arizona 8.4 6.9 61.1 25.1 16.5 7.8 13.5Arkansas 9.7 5.9 45.2 9.2 15.7 8.2 13.2California 6.4 7.7 NA NA 14.0 5.1 17.0Cheyenne River Sioux (SD) 8.3 7.7 NA NA 16.1 1.5 18.4Colorado 10.1 4.6 74.2 28.9 12.1 8.1 9.6Connecticut 9.5 6.7 57.8 24.6 9.4 3.9 16.2District of Columbia 12.0 4.9 NA NA 28.8 9.1 15.4Florida 9.7 5.9 66.3 24.4 16.7 4.8 13.9Georgia 10.4 5.4 52.4 18.4 13.2 7.3 14.5Idaho 7.5 7.5 78.9 27.8 12.7 7.0 12.4Illinois 9.7 6.2 61.2 18.2 10.9 7.4 14.4Indiana 9.5 6.3 60.0 19.2 15.9 6.7 14.0Inter Tribal Council (AZ) 7.7 9.2 60.2 31.7 10.4 7.0 24.1Iowa 8.8 7.7 NA NA 9.4 5.8 14.6Kansas 8.3 6.7 66.0 22.2 9.4 6.2 13.8Kentucky 10.2 6.1 NA NA 12.3 7.0 17.4Maryland 11.2 6.0 55.5 39.6 22.3 6.6 14.8Massachusetts 9.0 7.5 70.1 26.2 12.4 4.8 16.7Michigan 9.8 7.3 51.2 15.8 12.9 6.8 13.3Minnesota 7.4 9.1 71.0 32.6 11.6 5.1 13.1Missouri 9.1 6.6 51.6 21.9 17.5 7.1 13.6Montana 8.1 7.6 74.5 31.5 9.1 5.2 12.1Navajo Nation (AZ) 7.2 6.5 75.4 30.8 8.1 5.5 16.3Nebraska 8.6 6.7 67.8 24.4 16.4 5.7 13.1Nevada 8.3 6.5 54.2 23.4 10.7 8.3 14.0New Hampshire 8.0 9.0 64.6 22.8 13.8 6.7 15.9New Jersey 9.3 6.2 58.9 33.7 18.9 6.1 18.1New Mexico 10.0 4.6 71.5 23.8 10.0 7.7 11.5New York 8.9 6.7 69.0 39.3 11.0 4.1 15.3North Carolina 9.7 6.7 57.1 19.6 12.2 5.7 15.4Ohio 11.1 5.7 44.4 16.6 13.6 6.6 11.7Oregon 6.6 9.8 90.4 44.5 14.9 4.9 14.3Pennsylvania 10.6 6.1 42.6 20.8 16.6 6.0 11.1Puerto Rico NA NA 54.5 13.9 5.9 12.0 19.2Rhode Island 8.8 7.6 54.3 17.3 16.4 6.6 16.5Rosebud Sioux (SD) 8.3 6.6 60.7 NA 19.1 1.8 21.7South Carolina 12.4 5.1 NA NA 16.0 13.6 13.7South Dakota 8.4 7.9 NA NA 7.9 6.6 14.3Standing Rock Sioux (ND) 3.2 8.4 NA NA 13.7 1.5 24.8Tennessee 10.9 5.4 40.7 15.6 7.5 5.9 13.1Texas 9.0 6.0 67.6 37.8 18.2 7.2 15.6Vermont 8.5 10.8 69.9 31.8 6.1 5.3 12.9Virginia 9.9 6.3 58.3 23.1 14.8 6.7 17.0Washington 7.4 9.6 83.1 38.8 11.0 5.3 14.2West Virginia 10.8 5.5 42.1 11.8 5.6 5.4 12.7Wisconsin 8.6 7.6 62.6 26.0 10.4 5.7 13.0National PedNSS 9.2 6.6 60.1 25.2 14.0 6.4 14.8

2006 Report 3
Pediatric Health Indicators
Low BirthweightLow birthweight (<2,500 grams) is an important determinant of neonatal and postneonatal mortality. Low-birthweight infants who survive are at increased risk for health problems ranging from neurodevelopmental disabilities to respiratory disorders. In the 2006 PedNSS, 9.2% of infants were low birthweight, compared with 8.2% of all U.S. infants.1
In PedNSS, the prevalence of low birthweight was higher for black infants (13.5%) than for white (8.9%), American Indian or Alaska Native (8.1%), Hispanic (7.2%), and Asian or Pacific Islander (6.4%) infants. Healthy People 2010 Objective 16-10a proposes reducing low birthweight to no more than 5% of all live births.2
The overall prevalence of low birthweight increased slightly from 1997 (8.8%) through 2006 (9.2%), with increases among all racial and ethnic groups (Figure 2). During the 10-year period from 1997 through 2006, the greatest increases in low-birthweight rates were seen among American Indian or Alaska Native (1.1%), black (1.0%), and white (0.8%) infants, compared with Hispanic (0.4%) and Asian (0.4%) infants.
Low Birthweight: Less than 2,500 grams at birth.
High BirthweightHigh birthweight (>4,000 grams) puts infants at increased risk for death and birth injuries such as shoulder dystocia. In the 2006 PedNSS, 6.6% of infants were high birthweight, compared with 8.5% in 1997. The high-birthweight rate for PedNSS was
lower than the overall U.S. rate (8.5%).3 Twenty-three PedNSS contributors reported prevalence of high birthweight higher than the national PedNSS rate (Table 1). In 2006, the prevalence of high birthweight was higher for American Indian or Alaska Native (9.0%) infants than for white (7.4%), Hispanic (7.1%), Asian or Pacific Islander (4.8%), and black (4.2%) infants. The largest decreases in high birthweight during the 10-year period occurred among American Indian or Alaska Native (3.2%) and white (2.6%) infants.
High Birthweight: More than 4,000 grams at birth.
BreastfeedingThe nutritional, immunologic, and economic advantages of breastfeeding are well recognized. In the 2006 PedNSS, 60.1% of infants were ever breastfed, 25.2% were breastfed for at least 6 months, and 18.1% were breastfed for at least 12 months.
5
0
10
15
20062005200420032002200120001999199819975
10
15
2006q2005q2004q2003q2002q2001q2000q1999q1998q1997q
Perc
ent
Year
Figure 2. Trends in prevalence of low birthweight,* by race and ethnicity
* <2,500 grams, among infants born during the reporting period. Year 2010 target: reduce low birthweight to 5% of live births.Source: 2006 National PedNSS Data Table 18D. Available at http://www.cdc.gov/pednss/pednss_tables/tables_numeric.htm.
TotalWhite, non-HispanicBlack, non-Hispanic
Hispanic American Indian/Alaska Native Asian/Pacific Islander

4 Pediatric Nutrition Surveillance
The Healthy People 2010 objective (16-19a-c) to increase the proportion of children ever breastfed to 75%, breastfed at 6 months to 50%, and breastfed at 1 year to 25%2 is far from being achieved in the PedNSS population. However, Idaho, the Navajo Nation, Oregon, and Washington met the Healthy People 2010 objectives for ever breastfeeding (Table 1). Nationally representative data from the National Immunization Survey (NIS) indicate that 73.8% of infants were ever breastfed, 41.5% breastfed for 6 months, and 20.9% breastfed for 12 months.4
From 1997 to 2006, the absolute increase in the prevalence of breastfeed-ing initation for infants in PedNSS was 8.8%. The breastfeeding initiation rate was 47.8% in 1997. Improved breast-feeding rates were evident among all racial and ethnic groups (Figure 3). Hispanic infants had the highest rates of breastfeeding initiation (72.9%), while black infants had the lowest rates (47.3%). Data from the NIS indicate that the ever-breastfed rate in the United States increased from 38.2% in 1999 to 73.8% in 2003.4
Breastfeeding: Child ever breastfed, breastfed until 6 months of age, or breastfed until 12 months of age.
AnemiaAnemia (low hemoglobin/hematocrit) is an indicator of iron deficiency, which is associated with developmental delays and behavioral disturbances in children. In the 2006 PedNSS, the prevalence of anemia was 14.0%. The highest prevalence of anemia was in infants aged 6–11 months (16.9%) and infants aged 12–17 months (17.0%); the lowest prevalence was in children aged 3–5 years (10.3%).
Perc
ent
Figure 4. Trends in prevalence of anemia* among children aged <5 years, by race and ethnicity
* Hb or Hct <5th percentile. CDC. Recommendations to prevent and control iron deficiency in the United States. MMWR Recomm Rep 1998;47(RR-3).Source: 2006 National PedNSS Data Table 18D. Available at http://www.cdc.gov/pednss/pednss_tables/tables_numeric.htm.
Year
TotalWhite, non-HispanicBlack, non-Hispanic
Hispanic American Indian/Alaska Native Asian/Pacific Islander
5
0
10
15
20
25
2006200520042003200220012000199919981997
Perc
ent
Figure 4. Trends in prevalence of anemia* among children aged <5 years, by race and ethnicity
* Hb or Hct <5th percentile. CDC. Recommendations to prevent and control iron deficiency in the United States. MMWR Recomm Rep 1998;47(RR-3).
2006 National PedNSS Data Table 18D. Available at http://www.cdc.gov/pednss/pednss_tables/tables_numeric.htm.
Year
TotalWhite, not HispanicBlack, not Hispanic
HispanicAmerican Indian/Alaska NativeAsian/Pacific Islander
5
10
15
20
25
2006200520042003200220012000199919981997
Perc
ent
Figure 3. Trends in percentage of infants ever breastfed,* by race and ethnicity
* Among infants born during the reporting period. Year 2010 target: increase the proportion of mothers who breastfeed their babies in the early postpartum period to 75%.Source: 2006 National PedNSS Data Table 19D. Available at http://www.cdc.gov/pednss/pednss_tables/tables_numeric.htm.
Year
TotalWhite, non-HispanicBlack, non-Hispanic
HispanicAmerican Indian/Alaska NativeAsian/Pacific Islander
30
0
40
50
60
70
80
2006 20052004200320022001200019991998199730
40
50
60
70
80
2006 200520042003200220012000199919981997

2006 Report 5
pating in the WIC program. The prevalence of short stature in PedNSS was above the expected level (5%) and the Healthy People 2010 objective (19-4) of 5% among low-income children younger than 5 years of age.2 Eight contributors achieved this Healthy People 2010 objective in 2006 (Table 1). The prevalence of short stature remained stable from 1997 (6.1%) through 2006 (6.4%).
Some variation in short stature was evident among racial and ethnic groups. Short stature remained stable among white, black, Hispanic, and American Indian or Alaska Native children, while a decrease was seen among Asian or Pacific Islander children (Figure 5). The highest prevalence of short stature was among black infants younger than 1 year of age (11.2%), which may reflect the high rate of low birthweight in this group.
Short Stature: Based on the 2000 CDC gender-specific growth chart percentiles of less than the 5th percentile length-for-age for children younger than aged 2 years and less than the 5th percentile height-for-age for children aged 2 years or older.
The prevalence of anemia also varied among racial and ethnic groups in PedNSS. The highest prevalence of anemia was among black children (21.0%), while the lowest prevalence was among white children (11.1%). The overall prevalence of anemia in PedNSS children declined only slightly, from 14.5% in 1997 to 14.0% in 2006. Only slight declines were observed among racial and ethnic groups, with the exception of American Indian or Alaska Native (1.2%) and Hispanic (0.8%) children who had greater improvements (Figure 4).
Anemia: Children aged 6 months to 2 years are consid-ered anemic if their hemoglobin (Hb) concentration is less than 11.0 g/dL or hematocrit (Hct) level is less than 32.9%; children aged 2–5 years are considered anemic if their Hb concentration is less than 11.1 g/dL or Hct level is less than 33.0%. Values are adjusted for altitude. Hb concentration and Hct level are not reported for children younger than 6 months.5
Short StatureShort stature (low length/height-for-age) may reflect the long-term health and nutritional status of a child or a population. Although short stature can be associated with short parental stature or low birthweight, it also can result from growth retardation due to chronic malnutrition, recurrent illness, or both. In the 2006 PedNSS, 6.4% of children from birth to age 5 were of short stature, compared with 2.4% of all U.S. children (Dr. Zuguo Mei, CDC, unpublished data analysis, the National Health and Nutrition Examination Survey [NHANES], 1999–2002).
Short stature was considerably higher in the PedNSS population than in the general population, which may reflect the nutritional risk of children partici-
Perc
ent
Year
Figure 5. Trends in prevalence of short stature* among children aged <5 years, by race and ethnicity
* <5th percentile length or height-for-age, CDC growth charts, 2000. Year 2010 target: reduce short stature among low-income children aged <5 years to 5%.Source: 2006 National PedNSS Data Table 18D. Available at http://www.cdc.gov/pednss/pednss_tables/tables_numeric.htm.
TotalWhite, non-HispanicBlack, non-Hispanic
HispanicAmerican Indian/Alaska NativeAsian/Pacific Islander
4
0
5
6
7
8
2006200520042003200220012000199919981997
Perc
ent
Year
Figure 5. Trends in prevalence of short stature* among children aged <5 years, by race and ethnicity
* ≤5th percentile length or height-for-age, CDC growth charts, 2000. Year 2010 target: reduce short stature among low-income children aged <5 years to 5%.
2006 National PedNSS Data Table 18D. Available at http://www.cdc.gov/pednss/pednss_tables/tables_numeric.htm.
TotalWhite, not HispanicBlack, not Hispanic
HispanicAmerican Indian/Alaska NativeAsian/Pacific Islander
4
5
6
7
8
2006200520042003200220012000199919981997
6 Pediatric Nutrition Surveillance
UnderweightData on underweight (low weight-for-length/BMI*-for-age) in children from birth to age 5 years indicate that acute malnutrition was not a public health problem in the PedNSS population. In 2006, the prevalence of underweight (4.7%) was similar to the expected level (5%). The prevalence of underweight for all U.S. children in this age group was 3.8% (Zuguo Mei, MD; CDC; unpublished data analysis, NHANES, 1999–2002).
The highest prevalence of underweight in PedNSS occurred among black (6.1%) and Asian or Pacific Islander (6.2%) children. Black infants younger than 1 year of age had an underweight rate of 8.0%, which may reflect the high rate of low birthweight in this group. The overall prevalence of underweight decreased from 5.9% in 1997 to 4.7% in 2006.
Underweight: Based on the 2000 CDC gender-specific growth chart percentiles of less than the 5th percen-tile weight-for-length for children younger than 2 years of age and less than the 5th percentile BMI-for-age for children aged 2 years or older.
Overweight and At Risk of OverweightOverweight in children has increased in recent years, and the associated health consequences warrant preventive efforts. The American Academy of Pediatrics recommends two categories to screen for overweight in children aged 2 years or older. Children
Overweight At Risk of Overweight
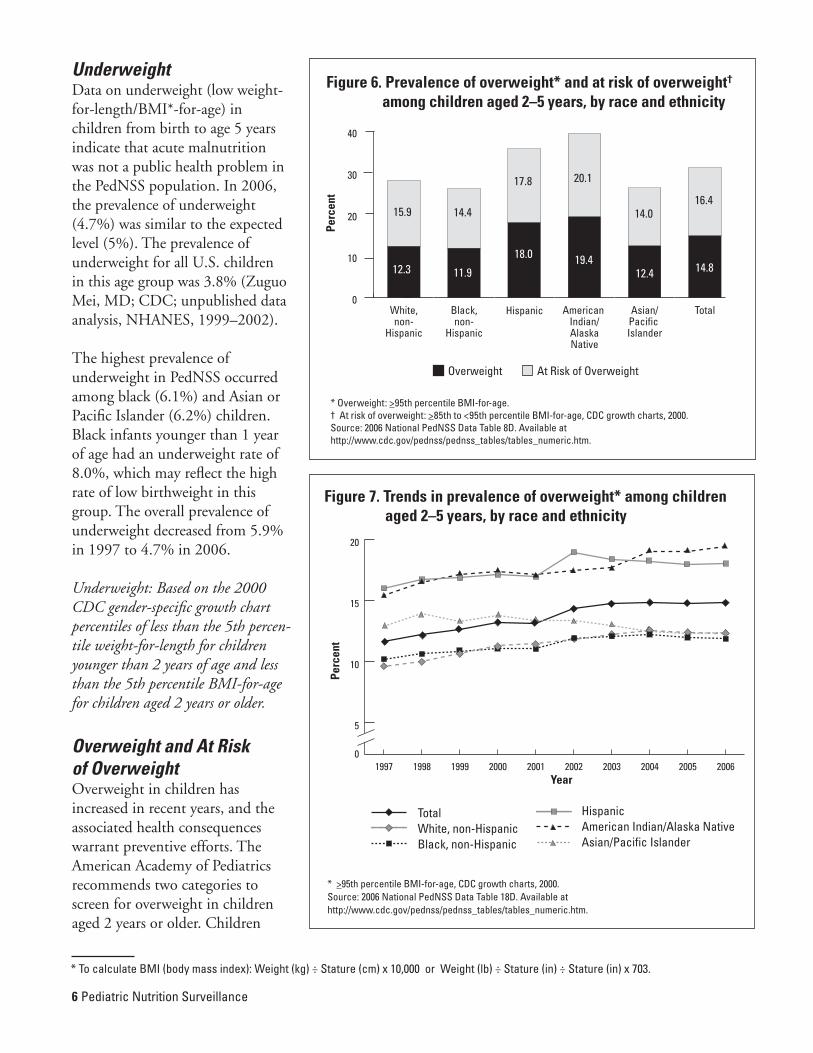
Figure 6. Prevalence of overweight* and at risk of overweight† among children aged 2–5 years, by race and ethnicity
* Overweight: >95th percentile BMI-for-age.† At risk of overweight: >85th to <95th percentile BMI-for-age, CDC growth charts, 2000. Source: 2006 National PedNSS Data Table 8D. Available at http://www.cdc.gov/pednss/pednss_tables/tables_numeric.htm.
Perc
ent
0
10
20
30
40
TotalAsian/Pacific Islander
American Indian/AlaskaNative
HispanicBlack,non-
Hispanic
White,non-
Hispanic
15.9 14.4
17.8 20.1
14.016.4
12.3 11.9
18.0 19.412.4 14.8
Perc
ent
Year
Figure 7. Trends in prevalence of overweight* among children aged 2–5 years, by race and ethnicity
* >95th percentile BMI-for-age, CDC growth charts, 2000.Source: 2006 National PedNSS Data Table 18D. Available at http://www.cdc.gov/pednss/pednss_tables/tables_numeric.htm.
TotalWhite, non-HispanicBlack, non-Hispanic
Hispanic American Indian/Alaska Native Asian/Pacific Islander
5
0
10
15
20
2006200520042003200220012000199919981997
Perc
ent
Year
Figure 7. Trends in prevalence of overweight* among children aged 2–5 years, by race and ethnicity
* ≥95th percentile BMI-for-age, CDC growth charts, 2000.
2006 National PedNSS Data Table 18D. Available at http://www.cdc.gov/pednss/pednss_tables/tables_numeric.htm.
TotalWhite, not HispanicBlack, not Hispanic
HispanicAmerican Indian/Alaska NativeAsian/Pacific Islander
5
10
15
20
2006200520042003200220012000199919981997
* To calculate BMI (body mass index): Weight (kg) ÷ Stature (cm) x 10,000 or Weight (lb) ÷ Stature (in) ÷ Stature (in) x 703.

2006 Report 7
from 11.6% in 1997 to 14.8% in 2006 (Figure 7). Overweight increased among all racial and ethnic groups with the exception of Asian or Pacific Islander children. However, since 2003, overall rates have remained stable.
The data in the 2006 prevalence map illustrating overweight among children in PedNSS by contributor (Figure 8) show that only Colorado had a prevalence of overweight less than 11%, while 10 contributors had a prevalence of overweight greater than or equal to 17%. Although the map shows no clear geographic pattern of overweight prevalence, it is noteworthy that four of the five ITOs participating in PedNSS were in the category with the highest rate.
No contributor had a prevalence of overweight at or less than the expected level of 5% (Table 1). The prevalence of at risk of overweight in children aged 2–5 years increased from 14.6% in 1997 to 16.4% in 2007.
Overweight: Based on the 2000 CDC age- and sex-specific growth chart percentiles of equal to or greater than the 95th percentile BMI-for-age for children aged 2 years or older.
At Risk of Overweight: Based on the 2000 CDC age- and sex-specific growth chart percentiles of the 85th to the 95th percentile BMI-for-age for children aged 2 years or older.
* >95th percentile BMI-for-age, CDC growth charts, 2000. † Includes the District of Columbia (14%–16.9%), Puerto Rico ( >17%), and the following ITOs:
Cheyenne River Sioux (>17%), Inter Tribal Council (AZ) (>17%), Navajo Nation (AZ) (14%–16.9%), Rosebud Sioux (SD) (>17%), and Standing Rock Sioux (ND) (>17%).
Source: 2006 National PedNSS Data Table 6D. Available at http://www.cdc.gov/pednss/pednss_tables/tables_numeric.htm.
Figure 8. Prevalence of overweight* among children aged 2–5 years, by contributor†
<11% 11%–13.9% 14%–16.9% ≥17%No data
DCP RicoCR SiouxITCANavajoR SiouxSR Sioux
whose BMI-for-age is at or above the 95th percen-tile are considered overweight. Those with a BMI-for-age between the 85th and 95th percentiles are considered at risk of overweight.6
In the 2006 PedNSS, the prevalence of overweight in children aged 2–5 years was 14.8%, compared with 13.9% for all U.S. children of a similar age.7 In PedNSS, the highest rates of overweight were among American Indian or Alaska Native (19.4%) and Hispanic (18.0%) children; the lowest rates were among black (11.9%), white (12.3%), and Asian or Pacific Islander (12.4%) children (Figure 6).
Of particular concern is that the prevalence of overweight among children aged 2–5 years increased

8 Pediatric Nutrition Surveillance
Pediatric Health Progress ReviewSeveral advances in nutrition and health indicators were observed in the PedNSS popula-tion from 1997 through 2006 (Figure 9). The prevalence of high birthweight decreased, with the greatest improvement occurring among American Indian or Alaska Native and white children. Substantial improvements occurred in both the prevalence of infants ever breastfed and those breastfed for at least 6 months.
The largest absolute improve-ment in the prevalence of ever being breastfed occurred among black children, while the greatest improvements in breastfeeding for at least 6 months occurred among Hispanic children. Overall, short stature improved during the 10-year period, with the greatest improve-ments seen among Asian or Pacific Islander children.
Areas of concern remain. The low birthweight rate increased during the 10-year period, and this increase was seen among all racial or ethnic groups. The Healthy People 2010 objective to reduce the low-birthweight prevalence to 5%2 remains unmet. Although the prevalence of anemia decreased slightly, it remains high among all racial and ethnic groups.
Overweight is a major public health problem that has increased: 3.2% more children aged 2–5 years were overweight in 2006 than in 1997. This change is a relative increase of 28%. Although Hispanic
and American Indian or Alaska Native children had the highest prevalence of overweight, increases occurred among all racial and ethnic groups, with the exception of Asian or Pacific Islander children.Advances have been made in breastfeeding initiation and breastfeeding for at least 6 months. However, few contributors achieved the Healthy People 2010 objective that 75% of infants are ever breastfed, and no contributors achieved the objective that 50% of infants breastfeed for at least 6 months.2 The prevalence of breastfeeding remained lowest for black infants.
Percent Change 1997–2006
BetterWorsePediatric Health Indicators
Figure 9. Changes in infant and child health status, 1997–2006
-40 -30 -20 -10 0 10 20 30 40 50
Overweight
Short Stature
Anemia
Breastfed 6 Months
Ever Breastfed
High Birthweight
Low Birthweight
28
4
22
5
3
33
50

2006 Report �
Pediatric Nutrition RecommendationsPedNSS data indicate that public health programs need to support the following actions:• Prevent low birthweight by promoting precon-
ception nutrition care and outreach activities to identify pregnancy in its early stages and foster early entry into comprehensive prenatal care, including the Special Supplemental Nutrition Program for Women, Infants, and Children (WIC) and the Title V Maternal and Child Health Program.
• Promote and support breastfeeding interven-tions through public health programs, medical care systems, work sites, and communities.
• Promote adequate dietary iron intake and screening of children at risk for iron deficiency.
• Implement promising approaches to prevent-ing overweight and chronic diseases that are recommended by CDC’s Division of Nutrition, Physical Activity and Obesity. These recommen-dations include 1) increase breastfeeding initia-tion, duration, and exclusivity; 2) increase physical activity; 3) increase the consumption of fruits and vegetables; 4) decrease the consump-tion of sugar-sweetened beverages; 5) reduce the consumption of high energy dense foods; and 6) decrease television viewing.
• Promote routine screening of weight status by physicians or allied health care providers in all children for overweight (BMI >95th percentile for age and sex) and at risk of overweight (BMI >85th percentile to <95th percentile for age and sex) based on the American Academy of Pediatrics policy statement.6
References1. Hamilton BE, Martin JA, Ventura SJ. Births:
preliminary data for 2005. Health E-Stats. Hyattsville, MD: U.S. Department of Health and Human Services, Centers for Disease Control and Prevention, National Center for Health Statistics; 2006. Available at http://www.cdc.gov/nchs/products/pubs/pubd/hestats/prelimbirths05/prelimbirths05.htm.
2. U.S. Department of Health and Human Services. Healthy People 2010. 2nd edition. 2 volumes. Washington, DC: U.S. Government Printing Office; 2000. Available at http://www.healthy-people.gov/publications.
3. Martin JA, Hamilton BE, Sutton PD, et al. Births: final data for 2004. National Vital Statistics Reports 2005;55(1). Available at http://www.cdc.gov/nchs/data/nvsr/nvsr55/nvsr55_01.pdf.
4. Centers for Disease Control and Prevention. Breastfeeding practices: results from the National Immunization Survey by year of child birth. Available at http://www.cdc.gov/breastfeeding/data/NIS_data/data_2004.htm.
5. Centers for Disease Control and Prevention. Recommendations to prevent and control iron deficiency in the United States. MMWR Recommendations and Reports 1998;47(RR-3): 1–30.
6. American Academy of Pediatrics Committee on Nutrition. Policy statement. Prevention of pediatric overweight and obesity. Pediatrics [serial online] 2003;112(2):424–430. Available at http://aappolicy.aappublications.org/cgi/content/full/pediatrics;112/2/424.
7. Ogden CL, Carroll MD, Curtin LR, McDowell MA, Tabak CJ, Flegal KM. Prevalence of overweight and obesity in the United States, 1999–2004. Journal of the American Medical Association 2006;295(13):1549–1555.

10---Pediatric Nutrition Surveillance