pengantar workshop
TRANSCRIPT
7/28/2019 Pengantar Workshop
http://slidepdf.com/reader/full/pengantar-workshop 1/11
Sharing Workshop Badan POM17 Oktober 2012
Prepared by:
7/28/2019 Pengantar Workshop
http://slidepdf.com/reader/full/pengantar-workshop 2/11
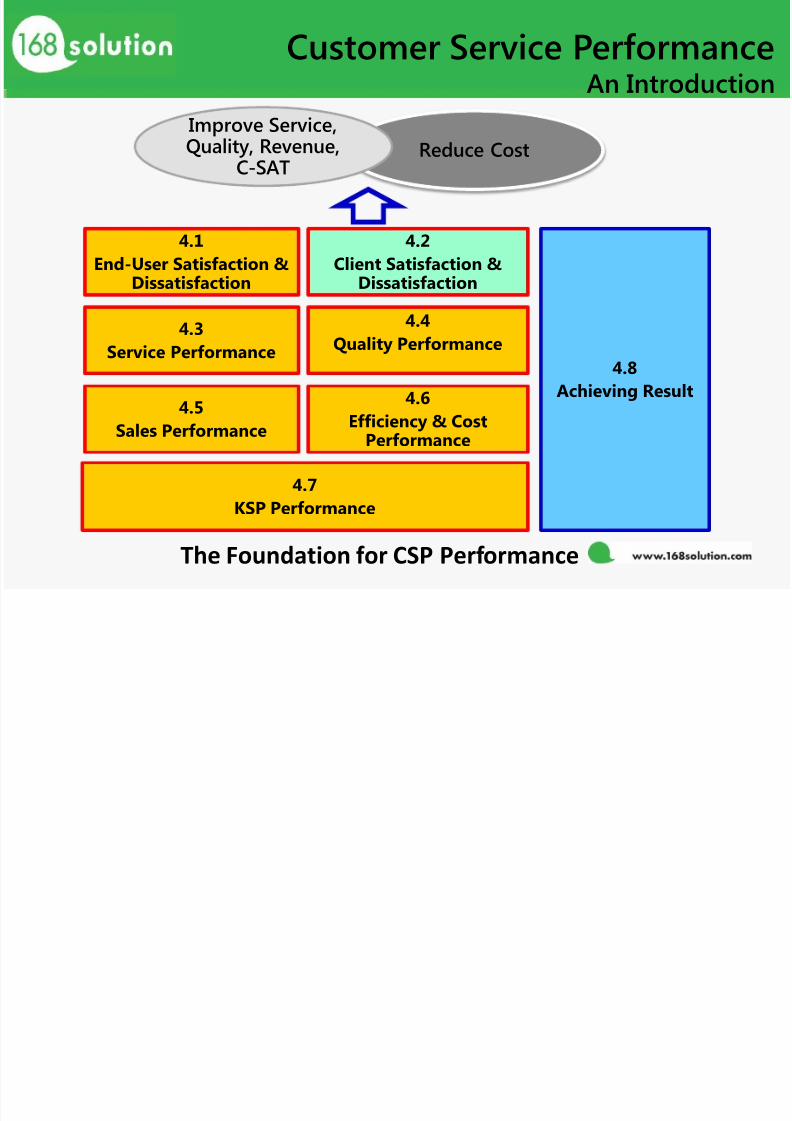
Customer Service PerformanceAn Introduction
4.1
End-User Satisfaction &Dissatisfaction
4.3
Service Performance
4.5Sales Performance
4.2
Client Satisfaction &Dissatisfaction
4.4
Quality Performance
4.6
Efficiency & CostPerformance
4.8
Achieving Result
4.7
KSP Performance
The Foundation for CSP Performance
Reduce Cost
Improve Service,Quality, Revenue,
C-SAT
7/28/2019 Pengantar Workshop
http://slidepdf.com/reader/full/pengantar-workshop 3/11
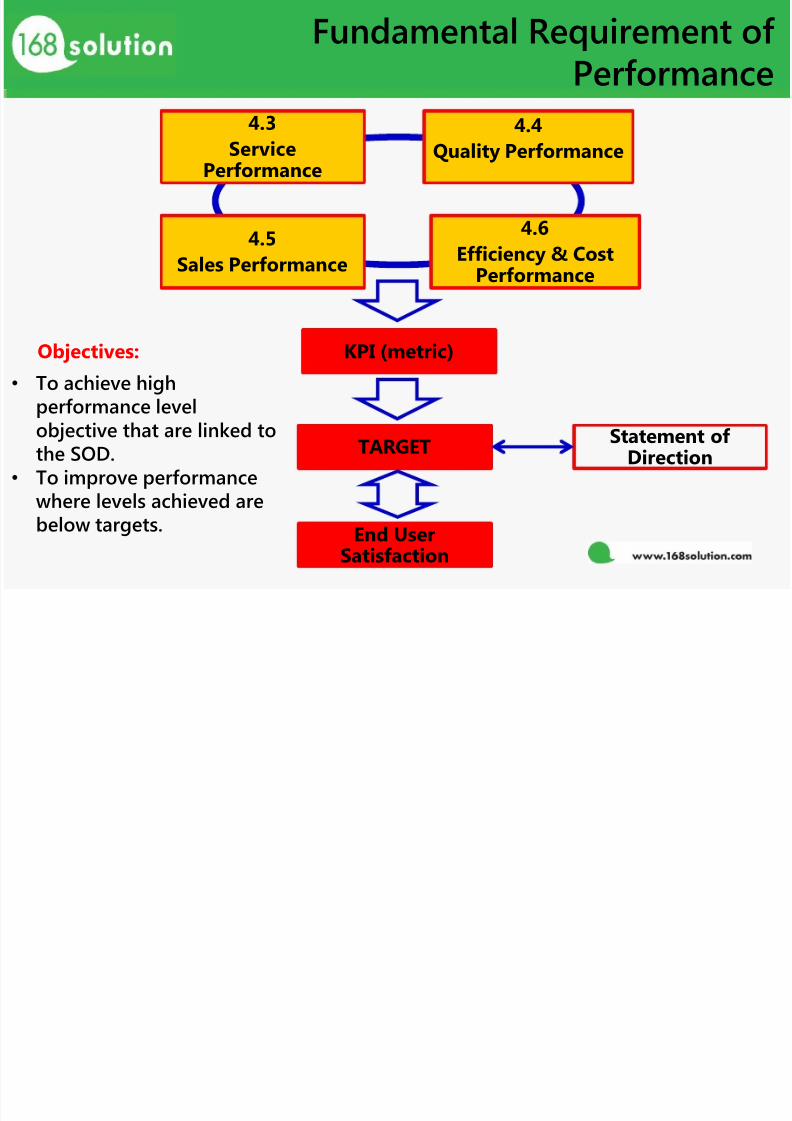
Fundamental Requirement of Performance
4.3
ServicePerformance
4.5
Sales Performance
4.4
Quality Performance
4.6
Efficiency & Cost
Performance
KPI (metric)
TARGET
End User
Satisfaction
Statement of Direction
• To achieve high
performance levelobjective that are linked tothe SOD.
• To improve performancewhere levels achieved arebelow targets.
Objectives:

7/28/2019 Pengantar Workshop
http://slidepdf.com/reader/full/pengantar-workshop 4/11
Structure of Performance Standard
COPC CSP Performance Standard
KCRP
(Key Customer RelatedProcessess)
KSP
(Key Support Processess)
Key Outcome
Metrics
Real Time KCRP
Deferred KCRP requiredmetrics
7/28/2019 Pengantar Workshop
http://slidepdf.com/reader/full/pengantar-workshop 5/11
5
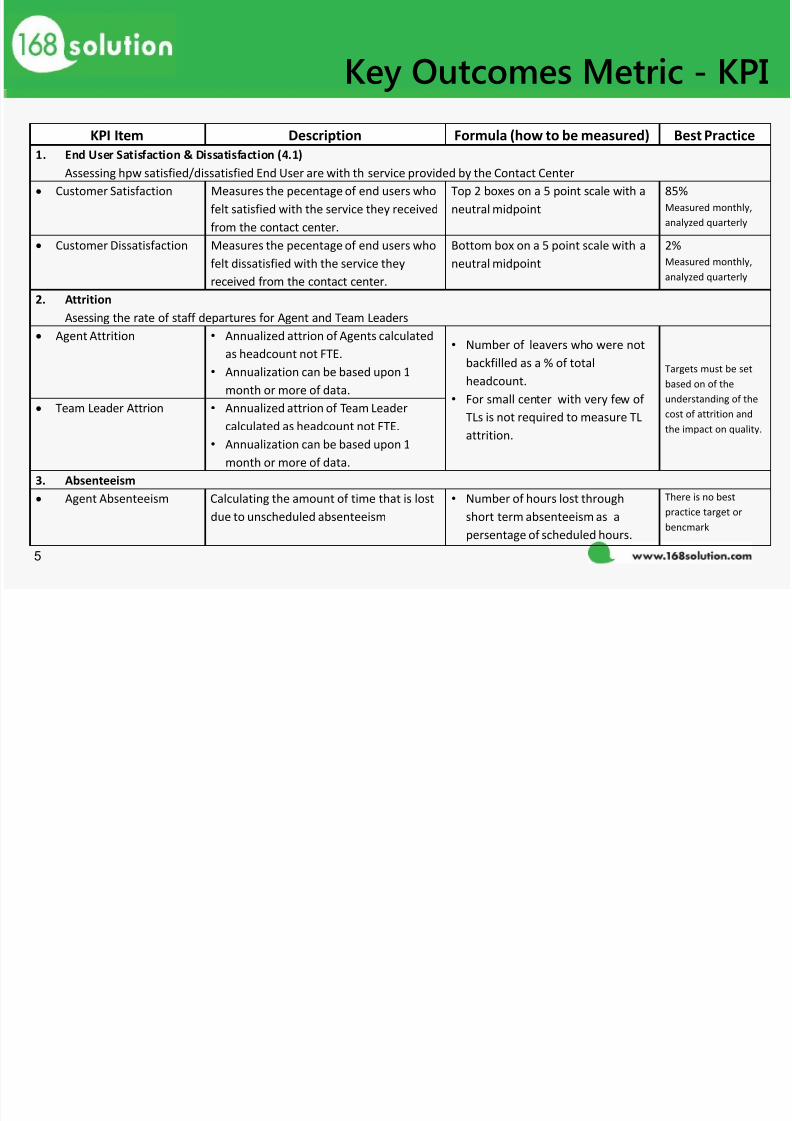
KPI Item Description Formula (how to be measured) Best Practice 1. End User Satisfaction & Dissatisfaction (4.1)
Assessing hpw satisfied/dissatisfied End User are with th service provided by the Contact Center
Customer Satisfaction Measures the pecentage of end users who
felt satisfied with the service they received
from the contact center.
Top 2 boxes on a 5 point scale with a
neutral midpoint
85%
Measured monthly,
analyzed quarterly
Customer Dissatisfaction Measures the pecentage of end users who
felt dissatisfied with the service they
received from the contact center.
Bottom box on a 5 point scale with a
neutral midpoint
2%
Measured monthly,
analyzed quarterly
2. Attrition
Asessing the rate of staff departures for Agent and Team Leaders
Agent Attrition • Annualized attrion of Agents calculated
as headcount not FTE.
• Annualization can be based upon 1
month or more of data.
• Number of leavers who were not
backfilled as a % of total
headcount.
• For small center with very few of
TLs is not required to measure TL
attrition.
Targets must be set
based on of the
understanding of the
cost of attrition andthe impact on quality.
Team Leader Attrion•
Annualized attrion of Team Leadercalculated as headcount not FTE.
• Annualization can be based upon 1
month or more of data.
3. Absenteeism
Agent Absenteeism Calculating the amount of time that is lost
due to unscheduled absenteeism
• Number of hours lost through
short term absenteeism as a
persentage of scheduled hours.
There is no best
practice target or
bencmark
Key Outcomes Metric - KPI

7/28/2019 Pengantar Workshop
http://slidepdf.com/reader/full/pengantar-workshop 6/11
6
Real Time TransactionService & Quality KPI
KPI Item Description Formula (how to be measured) Best Practice
1. Service Performance (4.3)
Service Level Percent of call answered before a
targeted threshold.
Calls answered in Y seconds ÷ (total calls
answered + total calls abandoned after Y
seconds)• There is no best
practice target
• Set target based
on customer
expectation and
type of service
Answered Rate Percent of transaction answered by live
agent
Total time all answered calls have waited,
dividing by the number of answered
calls.
Abandonment Rate Percent of transactions abandoned
before being answered by a live agent.
The number of callers who hang up after
the IVR but before they talk to a live
agent expressed as a percentage of call
offered.
2. Quality Performance (4.4)
Quality Score Percent score of quality attributes that
meet the CSP standard interaction
Measured by Quality Monitoring of
trasaction.
Benchmark 90%
Contact Resolution Percent of customer problem that are
resolved
Number of transactions that were
resolved as precentage of the total
number of transaction answered
• There is no best
practice target
• Should be
consistent with
end user
satisfaction
targets & result
First Contact Resolution Percent of customer problem that are
resolved on the first contact (the caller
doesn’t have no to contact the center or
vice versa).
Number of transactions that were
resolved during the first contact as a
precentage of the total number of
transactions answered
7/28/2019 Pengantar Workshop
http://slidepdf.com/reader/full/pengantar-workshop 7/11
7
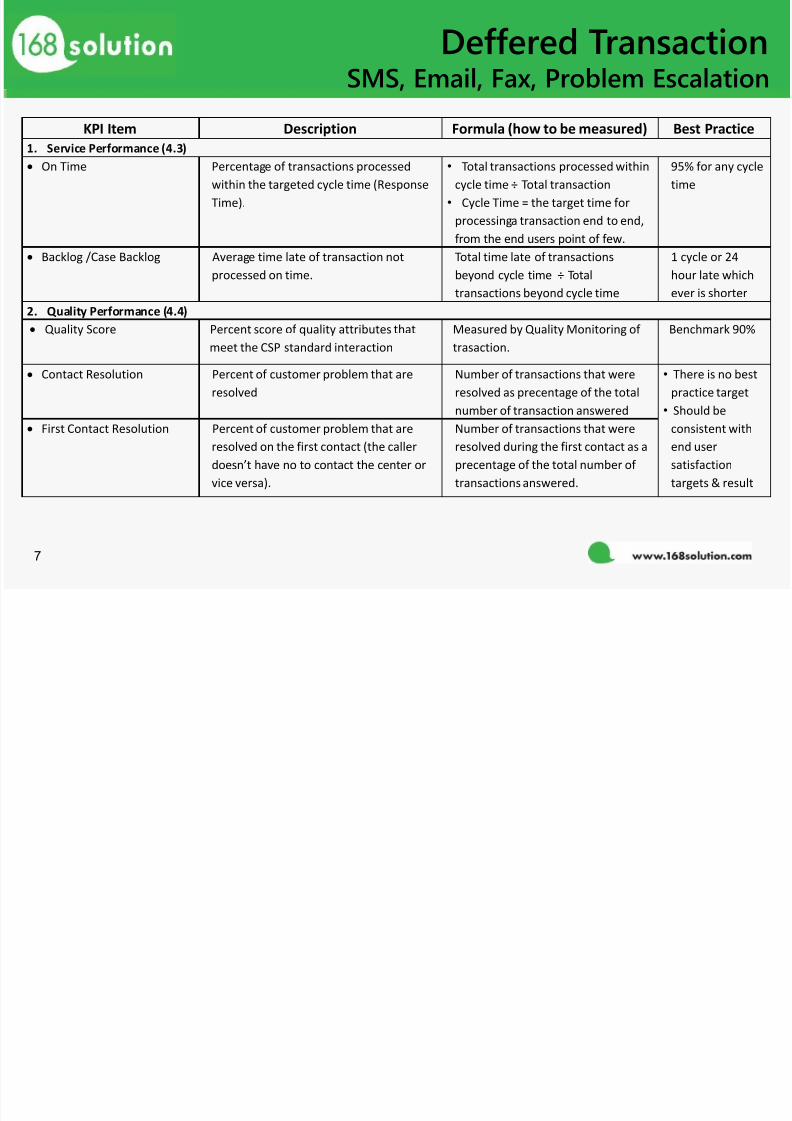
Deffered TransactionSMS, Email, Fax, Problem Escalation
KPI Item Description Formula (how to be measured) Best Practice
1. Service Performance (4.3)
On Time Percentage of transactions processed
within the targeted cycle time (Response
Time).
• Total transactions processed within
cycle time ÷ Total transaction
• Cycle Time = the target time for
processinga transaction end to end,
from the end users point of few.
95% for any cycle
time
Backlog /Case Backlog Average time late of transaction not
processed on time.
Total time late of transactions
beyond cycle time ÷ Totaltransactions beyond cycle time
1 cycle or 24
hour late whichever is shorter
2. Quality Performance (4.4)
Quality Score Percent score of quality attributes that
meet the CSP standard interaction
Measured by Quality Monitoring of
trasaction.
Benchmark 90%
Contact Resolution Percent of customer problem that are
resolved
Number of transactions that were
resolved as precentage of the total
number of transaction answered
• There is no best
practice target
•
Should beconsistent with
end user
satisfaction
targets & result
First Contact Resolution Percent of customer problem that are
resolved on the first contact (the caller
doesn’t have no to contact the center or
vice versa).
Number of transactions that were
resolved during the first contact as a
precentage of the total number of
transactions answered.
7/28/2019 Pengantar Workshop
http://slidepdf.com/reader/full/pengantar-workshop 8/11
8
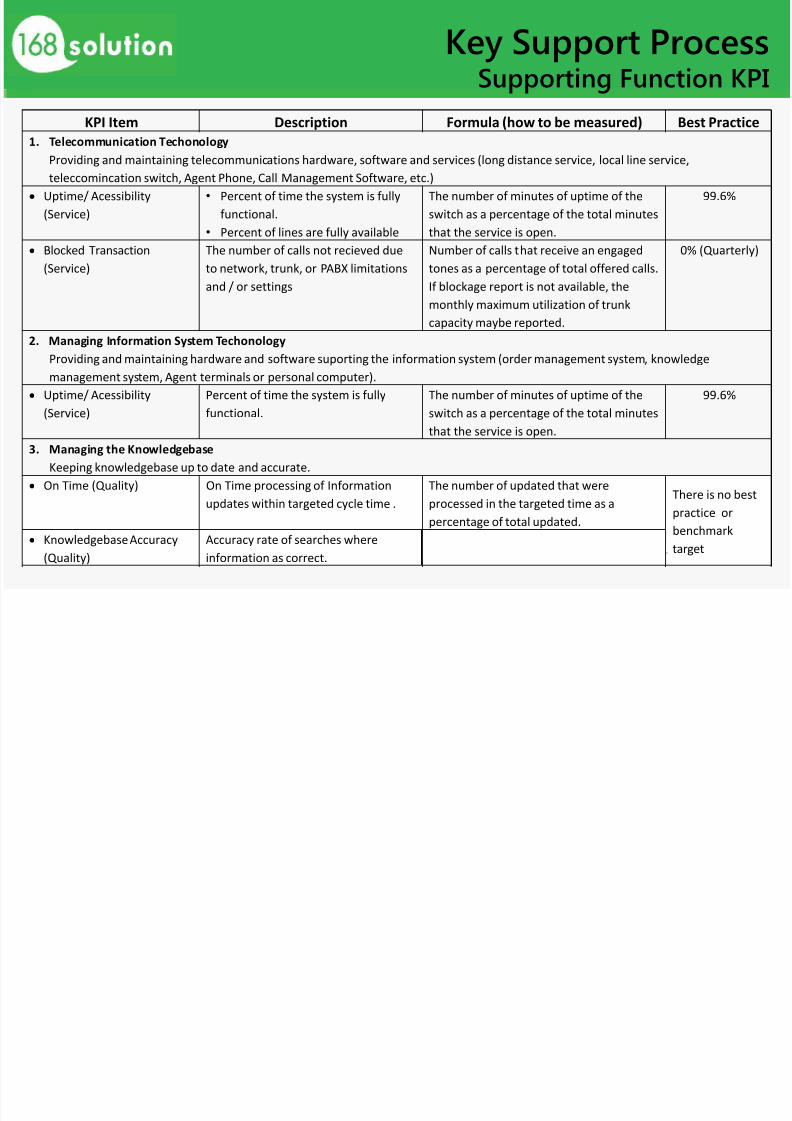
Key Support ProcessSupporting Function KPI
KPI Item Description Formula (how to be measured) Best Practice
1. Telecommunication Techonology
Providing and maintaining telecommunications hardware, software and services (long distance service, local line service,
teleccomincation switch, Agent Phone, Call Management Software, etc.)
Uptime/ Acessibility
(Service)
• Percent of time the system is fully
functional.
• Percent of lines are fully available
The number of minutes of uptime of the
switch as a percentage of the total minutes
that the service is open.
99.6%
Blocked Transaction
(Service)
The number of calls not recieved due
to network, trunk, or PABX limitations
and / or settings
Number of calls that receive an engaged
tones as a percentage of total offered calls.
If blockage report is not available, the
monthly maximum utilization of trunk
capacity maybe reported.
0% (Quarterly)
2. Managing Information System Techonology
Providing and maintaining hardware and software suporting the information system (order management system, knowledge
management system, Agent terminals or personal computer).
Uptime/ Acessibility
(Service)
Percent of time the system is fully
functional.
The number of minutes of uptime of the
switch as a percentage of the total minutesthat the service is open.
99.6%
3. Managing the Knowledgebase
Keeping knowledgebase up to date and accurate.
On Time (Quality) On Time processing of Information
updates within targeted cycle time .
The number of updated that were
processed in the targeted time as a
percentage of total updated.
There is no best
practice or
benchmark
target
Knowledgebase Accuracy
(Quality)
Accuracy rate of searches where
information as correct.
7/28/2019 Pengantar Workshop
http://slidepdf.com/reader/full/pengantar-workshop 9/11
9
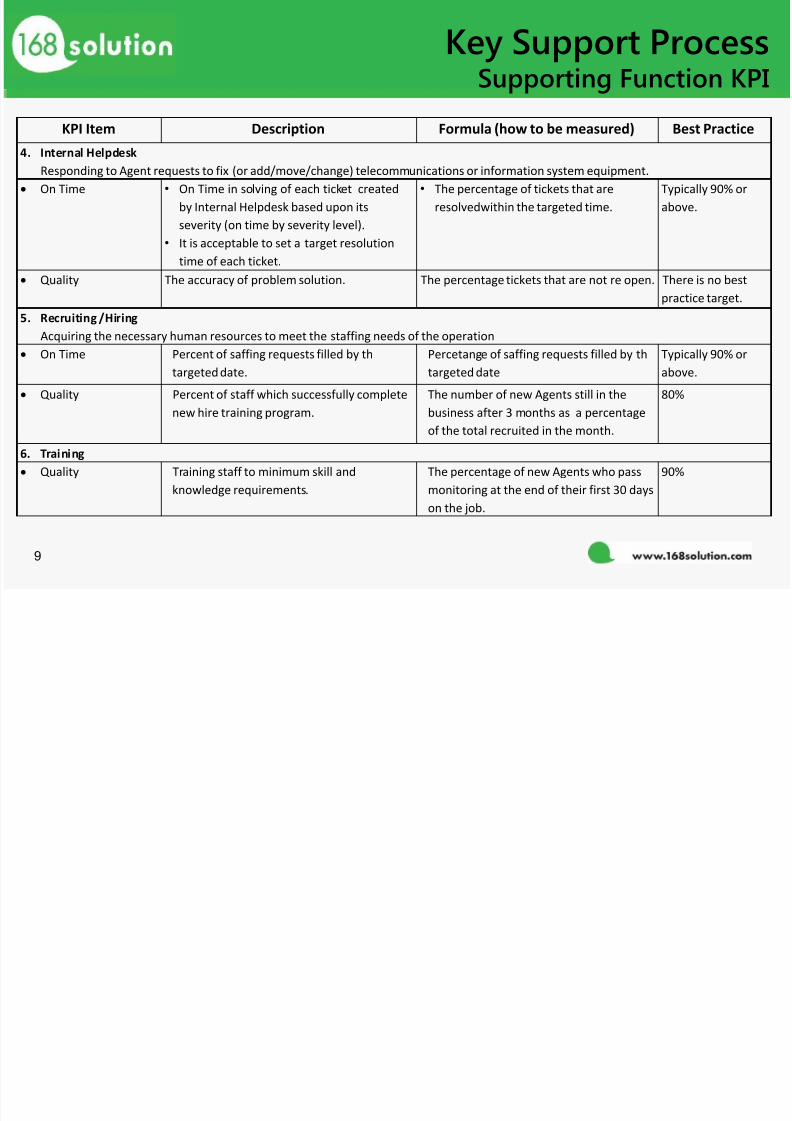
Key Support ProcessSupporting Function KPI
KPI Item Description Formula (how to be measured) Best Practice
4. Internal Helpdesk
Responding to Agent requests to fix (or add/move/change) telecommunications or information system equipment.
On Time • On Time in solving of each ticket created
by Internal Helpdesk based upon its
severity (on time by severity level).
• It is acceptable to set a target resolution
time of each ticket.
• The percentage of tickets that are
resolvedwithin the targeted time.
Typically 90% or
above.
Quality The accuracy of problem solution. The percentage tickets that are not re open. There is no best
practice target.
5. Recruiting /Hiring
Acquiring the necessary human resources to meet the staffing needs of the operation
On Time Percent of saffing requests filled by th
targeted date.
Percetange of saffing requests filled by th
targeted date
Typically 90% or
above.
Quality Percent of staff which successfully complete
new hire training program.
The number of new Agents still in the
business after 3 months as a percentageof the total recruited in the month.
80%
6. Training
Quality Training staff to minimum skill and
knowledge requirements.
The percentage of new Agents who pass
monitoring at the end of their first 30 days
on the job.
90%

7/28/2019 Pengantar Workshop
http://slidepdf.com/reader/full/pengantar-workshop 10/11
10
Outsourcing Bussiness SchemeIn Managing Contact Center
• Inhouse Call Center, all Call Center aspects developed and owned by themself
• Partial Outsourcing, several aspect developed by themself and other aspect owned
or managed by other parties
• Full Outsourcing or Managed Service, all Call Center developed and managed by
other parties.

7/28/2019 Pengantar Workshop
http://slidepdf.com/reader/full/pengantar-workshop 11/11
11