pennsylvania game commission wind energy …
TRANSCRIPT
PENNSYLVANIA GAME COMMISSION
WIND ENERGY VOLUNTARY COOPERATION AGREEMENT
THIRD SUMMARY REPORT
John Taucher, Wildlife Biologist II
Tracey Librandi Mumma, Wildlife Biologist III
William Capouillez, Director
Bureau of Wildlife Habitat Management
December 27, 2012

i
TABLE OF CONTENTS
ACKNOWLEDGEMENTS ................................................................................................................................. III
EXECUTIVE SUMMARY .................................................................................................................................. IV
INTRODUCTION/BACKGROUND ................................................................................................................... 1
COOPERATORS ................................................................................................................................................. 1
NON- COOPERATORS ...................................................................................................................................... 2
OBJECTIVES & GOALS .................................................................................................................................... 2
RISK ASSESSMENTS & PGC REVIEW OF PROJECTS ................................................................................ 3
PENNSYLVANIA WIND PROJECT SITE LOCATION ................................................................................... 3
SURVEY RESULTS SUMMARY ....................................................................................................................... 6
PRE-CONSTRUCTION RESULTS .................................................................................................................................. 7 Birds: Fall raptor migration survey results ......................................................................................................... 7 Birds: Spring raptor migration survey results ..................................................................................................... 9 Birds: Breeding Bird Survey Results .................................................................................................................. 11 Birds: Bird Species of Special Concern Survey ................................................................................................. 12 Bats: Potential Hibernacula Investigations ....................................................................................................... 13 Bats: Acoustic Monitoring ................................................................................................................................. 13 Bats: Mist Net Surveys ....................................................................................................................................... 16 Bats: Telemetry .................................................................................................................................................. 17 Mammals of Special Concern: Allegheny Woodrat ........................................................................................... 18 Mammals of Special Concern: Northern Flying Squirrel .................................................................................. 19
POST-CONSTRUCTION RESULTS ............................................................................................................................... 19 Mortality ............................................................................................................................................................ 20 Bat Mortality ...................................................................................................................................................... 20 Bird Mortality .................................................................................................................................................... 28 Mortality in Relation to Turbine ........................................................................................................................ 34 Searcher Efficiency ............................................................................................................................................ 35 Carcass Removal................................................................................................................................................ 38 Incidental Mortality ........................................................................................................................................... 40 Post-construction Raptor Migration Survey ...................................................................................................... 41 Post-construction Bat Acoustic Surveys ............................................................................................................. 42 Post-construction Radar Surveys ....................................................................................................................... 43 Post-construction Woodrat Surveys ................................................................................................................... 43 Threatened and/or Endangered Species Mortality: Birds .................................................................................. 43 Threatened and/or Endangered Species Mortality: Bats ................................................................................... 43 Large Mortality Events ...................................................................................................................................... 44
CORRELATION BETWEEN PRE-CONSTRUCTION BREEDING BIRD SURVEYS AND POST-
CONSTRUCTION MORTALITY ..................................................................................................................... 45
CAN MORTALITY BE PREDICTED? ............................................................................................................ 46
RAPTORS ................................................................................................................................................................. 46 BIRDS ...................................................................................................................................................................... 46 BATS........................................................................................................................................................................ 47
WILDLIFE INCIDENT REPORTING SYSTEM ............................................................................................. 47

ii
CONTRIBUTIONS TO OTHER WIND RELATED STUDIES ....................................................................... 47
SIGNIFICANT FINDINGS FROM COOPERATORS’ SURVEYS ................................................................. 48
AVOIDANCE, MINIMIZATION, AND MITIGATION BY COOPERATORS .............................................. 49
AVOIDANCE EFFORTS .............................................................................................................................................. 49 MINIMIZATION EFFORTS .......................................................................................................................................... 49 MITIGATION EFFORTS .............................................................................................................................................. 49
RESEARCH ....................................................................................................................................................... 49
SUGGESTED RESEARCH NEEDS: ................................................................................................................................ 50
OVERALL SUCCESSES/CHALLENGES........................................................................................................ 50
SUCCESSES .............................................................................................................................................................. 50 CHALLENGES ........................................................................................................................................................... 50
FUTURE ............................................................................................................................................................. 51
REFERENCES ................................................................................................................................................... 53
APPENDICES .................................................................................................................................................... 56
APPENDIX A: SUMMARY OF PRE-CONSTRUCTION FALL RAPTOR MIGRATION SURVEYS DONE AT PENNSYLVANIA
WIND SITES .......................................................................................................................................................... 57 APPENDIX B: SUMMARY OF PRE-CONSTRUCTION SPRING RAPTOR MIGRATION SURVEYS DONE AT PENNSYLVANIA
WIND SITES .......................................................................................................................................................... 59 APPENDIX C: SUMMARY OF BREEDING BIRD SURVEYS DONE PRE-CONSTRUCTION AT PROPOSED WIND SITES IN
PENNSYLVANIA ................................................................................................................................................... 61 APPENDIX D: PENNSYLVANIA WILDLIFE ACTION PLAN PRIORITY BIRD SPECIES DETECTED DURING POINT COUNTS
AT PENNSYLVANIA WIND SITES ........................................................................................................................... 64 APPENDIX E: WILDLIFE ACTION PLAN PRIORITY BIRD SPECIES DETECTED DURING AREA SEARCHES AT
PENNSYLVANIA WIND SITES ................................................................................................................................ 66 APPENDIX F. WIND ENERGY PROJECT MIST NET SURVEY RESULTS ...................................................................... 68 APPENDIX G. SPECIES COMPOSITION BY COMMON AND SCIENTIFIC NAME OF TOTAL BIRD MORTALITY
DOCUMENTED AT PENNSYLVANIA WIND SITES .................................................................................................... 70 APPENDIX H. SUMMARY OF POST-CONSTRUCTION SPRING AND FALL RAPTOR MIGRATION SURVEYS COMPLETED AT
PENNSYLVANIA WIND SITES ................................................................................................................................ 71

iii
ACKNOWLEDGEMENTS
We thank our colleagues in the Pennsylvania Game Commission who provided helpful
comments and contributions to earlier drafts of this report, particularly Lindsey Heffernan,
Thomas Keller, Andrea Evans, Doug Gross, Patti Barber, Calvin Butchkoski, Greg Turner,
Joshua Johnson, and John Morgan. In addition, several wind energy Cooperators provided
useful feedback to enhance this document, namely Duke Energy, EverPower Renewables,
Iberdrola Renewable Energies, EDF Renewable Energy (formerly enXco), and BP Alternative
Energy. We thank all of the Pennsylvania Game Commission Voluntary Wind Energy
Agreement Cooperators for their continued efforts to minimize impacts to wildlife.
Cooperator Date Signed
AES 04/18/2007
E. ON Climate & Renewables North America, Inc. 04/18/2007
Competitive Power Ventures, Inc. 04/18/2007
Energy Unlimited, Inc. 04/18/2007
Freedom Wind Energy, LLC 04/18/2007
Gamesa Energy USA 04/18/2007
Iberdrola Renewable Energies USA 04/18/2007
PPM Atlantic Renewable 04/18/2007
ReEnergy, LLC 04/18/2007
First Wind 04/18/2007
US Wind Force 04/18/2007
Acconia Wind Energy USA, LLC 08/20/2007
Global Winds Harvest, Inc. 08/20/2007
Penn Wind 09/28/2007
Laurel Hill Wind Energy, LLC 01/08/2008
EverPower Renewables 02/01/2008
AMP-Ohio/MESA 02/15/2008
Lookout Windpower, LLC 03/21/2008
Forward Windpower, LLC 03/21/2008
BP Alternative Energy 06/24/2008
Wind Park Bear Creek, LLC 04/03/2009
Invenergy Wind Development, LLC 06/01/2009
Tuthill Corporation Dba Blue Mountain Ski Area 12/18/2009
PPL Renewable Energy, LLC 12/29/2009
New Tech Wind Inc. 12/30/2009
Duke Energy 02/16/2010
Apex Wind Energy Holdings, LLC 03/10/2010
Allegheny Ridge Wind Farm, LLC 06/03/2010
Volkswind USA 07/20/2010
enXco 02/08/2011
Stony Creek Wind Farm, LLC 08/03/2011
Seldom Seen Wind, LLC 08/26/2011
North East Wind I, LLC 02/25/2012

iv
EXECUTIVE SUMMARY
The Pennsylvania Alternative Energy Portfolio Standards Act, signed in 2004, requires
that 18% of electricity sold to retail customers come from renewable energy sources within 15
years. In 2007, the Pennsylvania Game Commission (PGC) worked collaboratively with the
wind industry to develop a Voluntary Wind Energy Cooperative Agreement (Cooperative
Agreement) to further understand, avoid, minimize, and mitigate potential impacts to wildlife
and its habitat from wind energy development. The Cooperative Agreement requires at least one
year of standardized pre-construction surveys and two years of standardized post-construction
mortality monitoring at proposed or active wind energy facilities. Effort level for surveys is
determined by assigned risk levels designated by the PGC using criteria outlined in the
Cooperative Agreement. The results of pre-construction surveys are used by the PGC to
prescribe avoidance and minimization measures whereas post-construction monitoring enables
the PGC to assess the impacts of wind energy development to wildlife in Pennsylvania and apply
adaptive management techniques to further avoid, minimize, and mitigate wildlife impacts. This
report summarizes pre- and post-construction survey data gathered by Cooperators through
December 31, 2011.
A total of 33 wind energy developers are signatories of the Cooperative Agreement,
representing 70% of wind projects in Pennsylvania, and 76% of the total number of
developers who have active operations in Pennsylvania. See the Cooperators section for
further information.
Over 250 wildlife surveys have been conducted by Cooperators since 2004. At least one
pre-construction survey was conducted at 46 wind sites, and post-construction surveys
were initiated at 16 sites. See Survey Results Summary section for further information.
o Most sites observed at least one bald eagle (Haliaeetus leucocephalus) or golden
eagle (Aquila chrysaetos) during pre-construction raptor surveys. Data from pre-
construction surveys suggest that spring surveys may provide similar migration
data as fall surveys during a shorter timeframe. However, to date no post-
construction eagle mortality has been documented at any Pennsylvania wind site
and overall raptor mortality is low regardless of raptor risk. See Birds: Fall and
Spring Raptor Migration Survey Results section for more details.
o Acoustic surveys conducted at high risk sites indicate that a large majority (69%)
of all bat activity occurred from July 1 to September 30. Additionally, at sites
that followed protocols 60% of all bat activity documented occurred within the
first five hours of nightly monitoring. This information is important to determine
the best times to implement minimization efforts. See Bat: Acoustic Monitoring
section for more details.
o Telemetry surveys conducted on eastern small-footed (Myotis leibii) and Indiana
bats (Myotis sodalis) continue to provide new capture locations, roost locations,
and foraging and home ranges for both species. This new information has since
been submitted for inclusion into the Pennsylvania Natural Diversity Inventory
(PNDI). See the Bats: Telemetry section for further information.

v
o The average estimated bat mortality for surveys that followed PGC protocol was
25 bats/turbine/year (5 – 59). Hoary bats (Lasiurus cinereus) comprised the
largest proportion (31%) of bat mortality documented at cooperating wind
facilities. Adult bats were documented more often than juvenile bats (83% adult:
12% juvenile), and male bats were found more often than female bats (59% male:
29% female. The majority of all bat mortality (76%) occurs between July 1 and
September 30. See Bat Mortality section for more details.
o The average estimated bird mortality for surveys that followed PGC protocol was
4 birds/turbine/year (1 – 10). Passerines continue to account for the largest
proportion (73%) of bird mortality at wind sites. Overall, raptor mortality is low
throughout Pennsylvania, 3% of the total bird mortality. See Bird Mortality
section for more details.
o Cooperators documented one large mortality event in October 2011. This
Cooperator completed two years of standardized mortality monitoring and the
mortality event was later discovered incidentally by maintenance workers. A total
of 258 birds, including 24 state endangered blackpoll warblers (Setophaga
striata), and two bats were discovered at one turbine. The event is believed to be
related to all night lighting at a nearby substation and weather conditions. It is
believed that implementing the lighting Best Management Practices would have
greatly reduced the bird mortality during this event. See Large Mortality Events
section for more details.
o Thirty-one state endangered bird mortalities at five sites were documented
between 2007 and 2011; 29 blackpoll warblers and two yellow-bellied flycatchers
(Empidonax flaviventris). All of the endangered bird mortalities were determined
to be migrants (i.e. not from the local breeding population) by the PGC due to the
lack of breeding habitat in the vicinity and the time of year of mortalities. The
PGC is working with cooperators to mitigate for these documented fatalities. In
September 2012, upland sandpipers (Bartramia longicauda) were downgraded to
Pennsylvania endangered and Northern harriers (Circus cyaneus) were listed as
Pennsylvania threatened. See Threatened and/or Endangered Species Mortality:
Birds for more details.
o Cooperators documented the first state and federally endangered Indiana bat
mortality at a Pennsylvania wind facility. One juvenile female Indiana bat fatality
was documented in September 2011. This site had been previously ranked as low
risk to bats by the PGC. The nearest known Indiana bat hibernaculum is over 10
miles from the project. This event may indicate an increased risk to cave bats
farther than the five miles currently assessed under the Cooperative Agreement.
See Threatened and/or Endangered Species Mortality: Bats section for more
details.
o Nine Seminole bat (Lasiurus seminolus) fatalities were documented between 2007
and 2011 at six wind sites. All suspected Seminole bats were sampled and sent

vi
for genetic analysis to confirm species identification. The sites are located
throughout the state implying Seminole bats are not limited to any one portion of
the state. These results indicate that Seminole bats may frequent Pennsylvania
more than previously believed. See Bat Mortality section for more details.
Data collected over the past five years throughout Pennsylvania provided bat activity and
mortality patterns. The majority of bat activity (69%) and mortality (79%) occurs
between July 1 and September 30. This finding is important because if adjustments to
cut-in speeds are needed, July 1 to September 30 will provide the greatest benefit to bats
while minimizing costs to operators.
One alternative research project, a two-year evaluation of the effectiveness of ultrasonic
acoustic deterrents, was completed by a Cooperator in 2010. The study found a reduction
of bat mortality at turbines where acoustic deterrents were used compared to control
turbines where no acoustic deterrents were used. While the results are promising, several
limitations were observed during the study including humidity and deterrent
malfunctions. See Research section for more details.
After five years of data collection and implications of white nose syndrome, the PGC
recognizes that updates to the Cooperative Agreement are necessary. Thus, a
Cooperators meeting to discuss changes to current surveys and standards will occur in
early 2013. At that time, the PGC and Cooperators will identify and discuss necessary
changes. See Future section for more details.
The PGC strongly encourages Cooperators to implement the Best Management Practices
of a Wildlife Incident Reporting System (WIRS) for each wind facility in Pennsylvania.
The WIRS provides a detailed process for monitoring, response to, and reporting of
wildlife injuries and fatalities after the completion of standard mortality monitoring. A
WIRS allows for detection of special events such as raptor or threatened and endangered
species mortality, as well as large mortality events.
The collaborative efforts of the wind industry and the PGC in Pennsylvania are an unprecedented
effort to develop conscientious renewable energy with regards to wildlife impacts. Data
collected by Cooperators continue to be used to develop methods to avoid and minimize negative
impacts to the Commonwealth’s wild birds and mammals. Cooperators should be commended
for their efforts and have set an example that all industries should aspire to follow.

1
INTRODUCTION/BACKGROUND
Act 213 of 2004, the Alternative Energy Portfolio Standards Act, signed into law by
Governor Edward G. Rendell on November 30, requires that 18% of the electricity sold to retail
customers in Pennsylvania come from renewable and advanced energy sources within 15 years.
One of the technologies that will compete for a substantial share of Pennsylvania’s alternative
energy market is wind power. Under the direction of William A. Capouillez, Bureau Director of
Wildlife Habitat Management, the Pennsylvania Game Commission (PGC) worked
collaboratively with numerous wind energy developers (Cooperators) to immediately address
potential impacts to the Commonwealth’s bird and mammal resources.
As a result of this partnership, PGC biologists from the Bureaus of Wildlife Habitat Management
and Wildlife Management, who have expertise in Pennsylvania mammals, birds, and their
habitats, drafted the PGC Wind Energy Voluntary Cooperative Agreement (Cooperative
Agreement) in 2007. The Cooperative Agreement draft was then presented to all available wind
energy developers as well as the Pennsylvania Wind and Wildlife Collaborative to further
facilitate both natural resource agencies and non-governmental organizations input. The
Cooperative Agreement was finalized and the first Cooperators signed the agreement on April
18, 2007 after a public news release and formal ceremony was held.
To effectively implement the Cooperative Agreement, the PGC created four limited-term
wildlife biologist positions dedicated to wind energy in 2007; a statewide wind energy project
coordinator based in Harrisburg in the Bureau of Wildlife Habitat Management and three field
support positions that are each responsible for two of the six PGC operational regions. The
support positions are based in the Southwest region (NW/SW), Northcentral region (NC/SC),
and Northeast region (NE/SE). The field support positions were strategically placed in regions
of the state to meet the anticipated workload of project reviews and monitoring where the
greatest project development was occurring. Wildlife management supervisors in each of these
regions oversee the support positions and work with the statewide coordinator to manage PGC
program implementation. These positions have been plagued by vacancies resulting in partial
staffing for the majority of the past five years however, the Commission is hopeful the program
will be full staffed in 2013.
This report summarizes pre- and post-construction survey data gathered by Cooperators through
December 31, 2011. For an in-depth review of the Cooperative Agreement and its
accompanying protocols, and background information on the Cooperative Agreement, visit the
PGC’s public website at www.pgc.state.pa.us, click on “Wildlife”, “Habitat Management”, and
then click on “Wind Energy.”
COOPERATORS
The first Cooperators entered into the Cooperative Agreement on April 18, 2007.
Currently, a total of 33 wind developers have signed on to the Cooperative Agreement (listed on page iii). As of June 30, 2012, no Agreements had been terminated by either party
(Cooperator or PGC).

2
The Cooperators’ wind projects represent 70% (70 of the 100) of the wind projects that the PGC
was aware of through June 30, 2012 (Table 1). Of the 70 Cooperator-owned projects, 16 were
grandfathered into the Agreement (14 active sites and two proposed sites), meaning the projects
were either planned for construction within one year of entering the Cooperative Agreement or
were already built and thus were only required to perform post-construction surveys.
Table 1. Status of wind energy projects in Pennsylvania as of June 30, 2012.
Cooperator Non-Cooperator Total
Active 16 5 21
Mega-Watts 829 129 958
Total turbines 431 87 518
Proposed 54 25 79
New 52 25 77
Grandfathered 2 N/A 2
Total projects 70 30 100
NON- COOPERATORS
There are seven wind energy developers in Pennsylvania with active or proposed wind
sites who have not signed the Cooperative Agreement. These companies include a subsidiary of
Florida Power & Light Energy, NextEra Energy Resources (five active wind sites), Reading
Anthracite (one proposed wind site), STK Renewables (two proposed wind sites), OwnEnergy
(one proposed wind site), Laurel Highlands Energy (three proposed wind sites), HEW Group
LLC (one proposed site), and Vox Energy Solutions (one proposed site). There are an additional
16 sites in early stages of project proposal for which the potential developer has not been
identified.
Currently, very few wind developers with active wind sites in Pennsylvania have not signed the
PGC Cooperative Agreement and are not conducting post-construction monitoring. The only
developer that has not signed into the Cooperative Agreement, that currently has active wind
facilities in Pennsylvania, is Florida Power & Light Energy’s subsidiary, NextEra Energy
Resources. In fact, NextEra Energy Resources has received written warnings and several letters
from the PGC regarding their post-construction monitoring efforts at their five active wind
facilities in Pennsylvania. The PGC will continue to investigate all wind sites, paying careful
attention to those not signed into the Cooperative Agreement, in an effort to further ascertain
what avenues, including potential legal action, may be deemed appropriate to safeguard and
conserve wildlife species within the project area.
OBJECTIVES & GOALS
For an in depth review of the Cooperative Agreement pre- and post-construction
objectives and goals, please reference the Cooperative Agreement and the 1st (Capouillez and
Librandi Mumma 2008) and 2nd
(Librandi Mumma and Capouillez 2011) Summary Reports
which can be found on the PGC’s public website at www.pgc.state.pa.us, click on “Wildlife”,
“Habitat Management”, and then click on “Wind Energy.”

3
RISK ASSESSMENTS & PGC REVIEW OF PROJECTS
The risk assessments assigned for bats and raptors dictate what surveys and level of effort
are required. Risks associated with specific bird and mammal species of special concern are
addressed separately through targeted surveys. The PGC, using the criteria listed in the
Cooperative Agreement, determines the risk level for monitoring and survey efforts. The
Cooperative Agreement protocols use the term ‘priority level’ rather than ‘risk level’. These
terms can be used interchangeably. For example, a high risk raptor site is also a high priority site
for raptor surveys. The risk level may be adjusted based on new, relevant information. From
2007 to 2011, bat risk level increased from low to high at six sites based on pre-construction
surveys that resulted in the discovery of threatened or endangered species. Two sites had their
bat risk level decreased because of changes in their project areas. Additionally, between 2007
and 2011, four sites had their raptor risk level increased based on bald and/or golden eagle
presence, and two sites had the raptor level decreased based on revisions to their project areas
(Table 2).
Table 2. Raptor and bat risk levels of the 100 Pennsylvania wind projects as of June 30, 2012.
Risk Level Raptor Bat
Low 50 52
Moderate 35 10
High 15 38
Not assessed yet 0 0
Risk assessments also help developers site their wind energy projects. Cooperators are
encouraged to submit proposed project information greater than 14 months prior to construction
so that the PGC can help in the early planning stages to avoid and minimize impacts to birds and
mammals. Those Cooperators who submitted information on proposed projects greater than 14
months in advance noted the benefit to their planning and investor processes. For example, they
were better equipped to decide whether or not to proceed with conceptual projects based on the
information provided by the PGC. See the Avoidance, Minimization, and Mitigation section of
this report for more details on efforts made by developers to best avoid and minimize impacts to
wildlife.
PENNSYLVANIA WIND PROJECT SITE LOCATION
All 100 proposed and active wind sites in Pennsylvania are located in one or more of the
following physiographic provinces: Appalachian Plateaus, Ridge and Valley, Piedmont, and
Central Lowland (Figure 1). Initially, high elevation ridge tops were targeted for wind
development but as these areas become more developed less prominent ridges and summits are
targeted. Wind developers have begun to target portions of northwest and southeast
Pennsylvania for wind development.

4
Figure 1. Pennsylvania wind projects (active and proposed) by physiographic province and
cooperator status, as of June 30, 2012.
The PGC classifies turbine configuration as one of the following: linear, linear groupings,
clusters, and undetermined (Table 3). “Linear” configuration is a single straight line of turbines.
“Linear groupings” are more than one linear string of turbines. “Clusters” are turbines that are
configured in non-linear groups. “Undetermined” configurations are those projects in which
turbine configuration has not yet been established.
Site locations are described as ridgetop, escarpment, butte, or unknown. This determination is
made by examining topographical maps. “Ridgetop” is a long, narrow chain of hills or
mountains. “Escarpment” is a transition zone involving a sharp, steep elevation differential,
characterized by a cliff or steep slope. “Butte” is an isolated hill (or hills) with steep, often
vertical, sides and a small flat top. Site locations were designated by categories with the
following frequencies: 45 ridgetop, 10 escarpments, 39 butte, and 7 unknown.

5
Table 3. Turbine configuration of 100 Pennsylvania wind projects as of June 30, 2012
Physiographic Province Clusters Linear
Linear
Groupings Undetermined
Appalachian Plateau 7 20 8 24
Appalachian Plateau/Central Lowlands 0 0 0 2
Piedmont 0 1 0 1
Ridge and Valley 1 11 7 18
Total 8 32 15 45
Elevation of wind projects in Pennsylvania ranged from 600 to 3200 feet above sea level (Figure
2); Pennsylvania’s elevation ranges from sea level to 3,213 feet above sea level. The majority of
Pennsylvania’s land cover is deciduous forest (57%; Williams et al. 2005) and 78% of all active
and proposed wind energy project areas are in this landcover type. The forested landcover on
wind energy facilities consists of 63% deciduous dominated, 4% evergreen dominated, and 11%
mixed deciduous and evergreen forests. Agricultural land accounts for an additional 16% of
landcover on wind energy facilities, comprised of row crops and hay/pasture/grass fields.
Developed areas consisting of urban, cave and industrial areas make up 5% of the landcover and
the remaining 1% consists of wetlands and open water.
Figure 2. Pennsylvania wind projects (active and proposed) by median elevation (feet), as of
June 30, 2012.
0
5
10
15
20
25
30
35
<1000 1000-1499 1500-1999 2000-2499 2500+
Num
ber
of
Pen
nsy
lvan
ia w
ind
sit
es
Median elevation (ft)
Proposed
Active

6
SURVEY RESULTS SUMMARY
Two hundred seventy four pre- and post-construction bird and mammal surveys
have been completed at Pennsylvania wind energy sites since 2004 (Table 4).
Inconsistencies in data collection pre- and post- Cooperative Agreement (2007) have resulted in
difficulties interpreting results and comparing the results among sites. Site names and locations
have been replaced with site identification codes in data summary tables to preserve the
confidentiality of this information as is required per the Cooperative Agreement. Since the
Cooperative Agreement has been in place, Cooperators have funded one or more pre-
construction wildlife surveys at 46 wind sites and post-construction surveys have been initiated
at 16 sites, resulting in more than 120,000 hours of surveys.
Table 4. Summary of bird and mammal surveys completed at wind facilities in Pennsylvania,
2004 – 2011.
2004 2005 2006 2007 2008 2009 2010 2011 Total
Pre-construction
Potential Hibernacula Investigationsa 0 2 5 4 3 7 2 1 24
Bat Acoustics 0 2 3 9 9 8 3 2 36
Bat Mist-netting 1 2 5 7 11 8 3 3 40
Bat Telemetry 0 0 0 3 4 1 1 0 9
Breeding Bird Surveys 0 0 2 9 4 7 4 3 29
Fall Raptor Migration 1 1 6 9 5 4 2 2 30
Spring Raptor Migration 0 0 5 6 7 1 1 0 20
Mammal Species of Concern Surveysb 0 1 3 2 6 5 1 0 18
Bird Species of Concern Surveysc 0 1 6 1 1 4 1 4 18
Post-construction
Mortality (bat and bird) 1d 0 1
d 1 4 6 8 5 26
Bat Acoustics 0 0 0 0 3 2 1 0 6
Fall Raptor Migration 0 0 0 0 2 1 4 1 8
Spring Raptor Migration 0 0 0 0 0 1 3 1 5
Breeding Bird Surveys 0 0 0 0 0 0 0 0 0
Radar 0 0 0 0 2 0 0 0 2
Othere 0 0 0 0 0 1 1 1 3
Total 3 9 35 51 59 57 35 23 274
a Potential bat hibernacula surveys refer only to those conducted on the project area by the Cooperator.
b Mammal species of special concern surveys include the following: state threatened Allegheny woodrat (Neotoma
magister) and state endangered northern flying squirrel (Glaucomys sabrinus).
c Bird species of special concern surveys include the following: state endangered upland sandpiper (Bartramia
longicauda) and bald eagle (Haliaeetus leucocephalus), and state endangered short-eared owl (Asio flammeus).
d Mortality surveys conducted prior to the Cooperative Agreement did not follow PGC protocols.
e Other surveys include those such as bat deterrent and curtailment.
For pre-construction surveys, the PGC encourages wind energy developers to have PGC staff
involved in the selection of observation sites and other details of the studies. The PGC attempts

7
to visit each site at least once during every survey to answer questions, make sure the
standardized monitoring protocols are being followed, and the correct data sheets are used and
properly completed. Open lines of communication between consultant, developer, and the PGC
are essential for recognizing and correcting problems as they arise to avoid the collection of a
full season of data that are unusable data. PGC biologists have observed only 59 of 224 (26%)
pre-construction surveys between October 1, 2007 and June 30, 2012 (Table 5). Due to
vacancies within the PGC wind program and last minute coordination from developers and
consultants, the PGC has not been able to achieve its goal of observing one day or night of each
survey. However, from 2007-2011, PGC staff visited all 12 sites where post-construction
monitoring was conducted.
Table 5. Number of bat, bird, and other (woodrat, radar, etc.) pre-construction surveys observed
by PGC between October 1, 2007 and June 30, 2012.
Pre-Construction Surveys
Observed
1st Summary
Report 10/1/07
- 9/30/08
2nd Summary
Report 10/1/08
- 6/30/10
3rd Summary
Report 7/1/10
- 6/30/12
Total
10/1/07 -
6/30/12
Bat Surveys 5 12 7 24
Bird Surveys 12 11 3 26
Other Surveys 5 3 1 9
Total Surveys Observed 22 26 11 59
Pre-Construction Results
Birds: Fall raptor migration survey results
Raptor migration varied across the state as expected. A total of 28 pre-construction fall
raptor surveys were completed at 29 proposed sites between 2004 and 2011 (Appendix A). Each
survey represented one wind site with the exception of two surveys (2-4 & 2-5 and 6-1 & 6-3)
and an additional site (6-10) was surveyed twice. One raptor survey was conducted at sites 2-4
& 2-5 and 6-1 & 6-3, each encompassing both wind sites. These sites are combined in Appendix
A because they represent the same data and will be counted as one site. To determine percent of
flight for each raptor species the total number of each species observed was divided by the total
number of all raptors observed at the site, not just the rotor swept zone (as data specific to the
rotor swept zone was not available from all survey reports). Overall, the raptor risk levels did
not correspond to the total raptor species observed, the total number of raptors observed, or the
raptors observed per hour. Some low and moderate raptor risk sites recorded greater total
number of raptors and raptors per hour than did high raptor risk sites. Sites with few previous
observations were designated as low risk due to lack of information, this provides opportunity
for low risk sites to have greater raptor migration than high risk sites as data is collected. The
PGC uses known ridges that experience varying amounts of raptor migration to determine the
raptor risk (Table 1 of Exhibit A in the Wind Energy Voluntary Cooperative Agreement). There
were 13 fall raptor surveys conducted at low raptor risk wind sites. Two of these sites (2-1 and
35-1) documented higher raptors per hour than many high risk sites. However, half of the
raptors observed at these sites consisted of broad-winged hawks (Buteo platypterus; 18%) and

8
turkey vultures (Cathartes aura; 33%) which were the most commonly observed species during
fall raptor surveys.
Bald eagles were observed during 22 of 28 surveys. Bald eagles were not observed at four low
raptor risk sites and two moderate risk sites. Fourteen of 28 surveys experienced increased bald
eagle migration rates. Increased bald eagle migration is defined as greater than or equal 1% of
raptor flight. One percent was used as the threshold for increased eagle migration based on
historical data from hawk watch sites across Pennsylvania (Hawk Migration Association of
North America 2012). Eleven of the 14 surveys with increased bald eagle migration were at high
or moderate risk sites and three were at low risk sites. The increased bald eagle migration at
three low risk sites does not necessarily indicate a major migration corridor. Low raptor risk
sites are not required to conduct fall raptor monitoring, and many conduct abbreviated surveys.
All three low risk sites which observed increased bald eagle migration conducted surveys of two,
five, and 10 days respectively, far shorter than a full survey season. These shorter surveys may
have resulted in low overall raptor numbers, leading to individual eagles representing a larger
proportion of the raptor migration. Generally, few bald eagles are seen at any site on any given
day, while the number of bald eagles in the Northeastern states has increased as populations
recover (Farmer et al. 2008). Additionally, nesting pairs of bald eagles in Pennsylvania have
been increasing 10-15% per year for the last 20 years (Gross 2010). Bald eagles comprised 3.3%
of the total raptors observed during all fall raptor migration surveys.
Golden eagles (Aquila chrysaetos) were observed at 20 of 28 raptor surveys. The eight sites that
did not document golden eagles included four low, three moderate, and one high risk site. Four
of the sites did not document any golden or bald eagles (two low risk and two moderate risk).
Ten of the 28 surveys experienced golden eagle migration rates greater than or equal to 1%; eight
high or moderate risk (site 2-4 and 2-5 were surveyed with one raptor survey) and three low risk
sites. Again, one percent was used as the threshold for eagle migration based on historical data
from hawk watch sites across Pennsylvania (Hawk Migration Association of North America
2012). The increased golden eagle migration at low risk sites should be interpreted with caution
since a full season of raptor migration surveys was not required for these sites. The three low
risk sites documenting increased golden eagle migration only surveyed for two, five, and 14 days
respectively. Golden eagles comprised 1.0% of the total raptors observed during all fall raptor
migration surveys.
Turkey vultures (33% of total raptors observed), red-tailed hawks (Buteo jamaicensis; 18%), and
broad-winged hawks (18%) were the three most common raptors observed during fall migration
surveys. Unlike the majority of hawk watch sites in Pennsylvania where fall count data is
dominated by broad-winged and sharp-shinned hawks (Accipiter striatus), turkey vultures were
the most frequently observed species during these 30 surveys. Northern goshawks (Accipiter
gentilis) were the least observed raptors (0.1% of total raptors observed) followed by rough-
legged hawks (Buteo lagopus; 0.2%) and Pennsylvania endangered peregrine falcons (Falco
peregrinus; 0.2%). These three species are also observed in low numbers at hawk watch sites
throughout Pennsylvania (Hawk Migration Association of North America 2012). Only two
raptor species were observed at all 28 fall raptor migration surveys: red-tailed hawks and turkey
vultures.

9
Birds: Spring raptor migration survey results Eighteen spring raptor migration surveys were conducted between 2006 and 2011 at 20
sites (Appendix B). With the exception of two surveys, each survey represented one wind site.
Two surveys comprised of two wind sites each; sites 6-1 and 6-3 were surveyed with one survey
and sites 2-4 and 2-5 were surveyed with one survey and are combined in Appendix B and will
be counted as one site. To determine percent in flight for each species, the total number of each
species observed was divided by the total number of all raptors observed at each site, not just in
the rotor swept zone (as data specific to rotor swept zone was not available from all survey
reports). Raptors per hour varied for all sites regardless of the raptor risk level. Six surveys
were conducted on low raptor risk sites. Low risk sites were either located on a ridge or
mountain designated as low risk in Appendix A of the Wind Energy Voluntary Cooperative
Agreement or on a ridge or mountain for which no raptor migration data exists. Low risk raptor
sites are not required to perform raptor migration surveys however, the PGC encourages low risk
sites to conduct abbreviated raptor surveys targeting peak migration periods. It should be noted
that data from these abbreviated surveys tend to show inflated numbers of raptors observed per
hour because the surveys only occur on a few days during peak migration periods.
Bald eagles were observed during 14 of 18 spring raptor surveys. The four surveys where bald
eagles were not observed were at sites with low risk to raptors. The highest percent of bald
eagles was 9% of raptors in 2009 at site 6-12 (high raptor risk). Ten of the 18 surveys observed
greater or equal to 1% bald eagles during their spring surveys; nine sites were high or moderate,
and one was low risk. The low risk site conducted an abbreviated survey recorded low numbers
of raptors overall, inflating the percentage of bald eagles. Bald eagles comprised 1.8% of the
total raptors observed during all spring raptor migration surveys.
Golden eagles were observed at nine of 18 surveys. The nine surveys that did not observe
golden eagles consisted of five low, two moderate, and two high risk sites. The highest
percentage of golden eagles was in 2006 when 21% were observed at site 3-2 (high raptor risk).
Six sites observed greater than or equal to 1% golden eagles during spring raptor surveys; five
sites were high or moderate, and one site was low risk to raptors. Again the low risk site
conducted an abbreviated survey resulting in low raptor observations overall. Golden eagles
comprised 1.9% of the total raptors observed during all spring raptor migration surveys.
More golden eagles were observed during spring raptor migration surveys at high risk sites than
at moderate or low risk sites. One exception was a low risk site that only conducted surveys
during six days in March, possibly skewing the percentage compared to other sites that
conducted surveys throughout March. Turkey vultures (56%), red-tailed hawks (14%), and
broad-winged hawks (6%) were the three most common raptors observed during spring
migration surveys. Peregrine falcons and northern goshawks were the least observed (0.1%),
followed by merlins (0.2%) and rough-legged hawks (0.3%). Only three raptor species were
observed during all spring raptor migration surveys: sharp-shinned hawks, red-tailed hawks, and
turkey vultures.
Fifteen of the 18 of the spring raptor surveys observed at least one bald or golden eagle. Spring
eagle observations are related to the raptor risk level, unlike the fall raptor surveys. High risk

10
sites yielded higher counts of bald and golden eagles than low risk sites, supporting the PGC’s
pre-construction risk assessment designations.
There continue to be variations in raptor migration among species and seasons. During 18 fall
surveys greater than or equal to 1% bald or golden eagles were documented. However, only five
of these surveys documented increased proportions of both bald and golden eagles. Spring
surveys were similar, with 13 surveys documenting greater than or equal to 1% bald or golden
eagles, but only three had increased percent of both bald and golden eagles. For overall eagle
migration, fall and spring surveys provided similar results. Of the 13 sites that
documented increased percent for eagles during spring surveys, 12 also documented
increased percent for eagles during corresponding fall surveys. Seven additional fall surveys
documented increased percent for eagles, but did not conduct corresponding spring surveys. One
additional survey documented increased percent for eagles during fall, but not during
corresponding spring surveys. However, this site was low risk and only conducted two days of
spring surveys. The short survey period could have missed eagles migrating through the area.
These data suggests that spring surveys may provide similar eagle migration data to fall surveys
in a shorter timeframe as well as support conducting spring raptor surveys first, and fall raptor
surveys only if significant eagle migration is noted.
Sites with the highest bald eagle flights varied between spring and fall surveys. Of the 14 sites
that experienced increased bald eagle flights during fall surveys, five documented increases
during corresponding spring surveys, four did not document increases during spring surveys, and
five did not conduct corresponding spring surveys.
For golden eagles, sites with increased percentages were similar between spring and fall
surveys. Of the nine surveys that observed increased percent of golden eagles in the fall, six also
observed increased percent during spring. Two of the nine sites from the fall did not observe
increased percent in the spring, however both sites conducted shortened surveys (two and 15
days respectively). The final survey that experienced increased percent for golden eagles in the
fall was at a site that did not conduct any corresponding spring raptor surveys. Two high risk
sites (3-2 and 3-4) experienced the highest percent in flight of golden eagles for both spring and
fall.
Raptor migration surveys showed similar results of bald and golden eagle migration as research
conducted by Todd Katzner et al. (2008) which show bald and golden eagles using northcentral
and northeast Pennsylvania as migratory routes. These studies show that bald and golden eagles
are migrating northward through Pennsylvania. However, these raptor surveys do not show the
large number of eagles migrating such as is noted at hawk watch sites throughout Pennsylvania.
Four sites have had their raptor risk increased, however only one site increased due to the results
of the raptor surveys. Two sites had their raptor risk increased because of the golden eagle data
collected through the research of Katzner et al. (2008) and one site was increased because of the
discovery of an eagle nest in the vicinity of the project.
Several low risk sites documented greater total number of raptors observed than some high and
moderate risk sites. Low risk sites 6-1, 6-3, and 2-1 experienced greater total raptors observed
than many high and moderate risk sites during both fall and spring surveys implying they are

11
located along previously unknown raptor migration corridors. However, these sites also had
longer survey duration, which could explain the increased total raptor count.
Birds: Breeding Bird Survey Results A total of 29 breeding bird surveys were conducted between 2006 and 2011 at 24
proposed wind sites (Appendix C). No breeding bird surveys were conducted at proposed wind
sites prior to 2006. Five sites conducted more than one year of surveys because the protocol was
not followed, the project area was not adequately covered, or changes to the project area required
additional points. Breeding bird surveys consisted of point counts, area searches, or a
combination of point counts and area searches.
The 29 breeding bird surveys consisted of 26 point count surveys and 19 area search surveys.
Ten sites recorded at least one Pennsylvania threatened or endangered bird species during point
counts (Appendix D) and two sites detected at least one Pennsylvania threatened or endangered
bird species during area searches (Appendix E). All of the point counts and area searches
documented at least one WAP priority bird species (Appendices D & E). The number of species
detected varied considerably for both point counts (26 to 90) and area searches (9 to 78).
The state-listed endangered birds observed during breeding bird surveys included yellow-bellied
flycatcher (Empidonax flaviventris), blackpoll warbler (Setophaga striata), American bittern
(Botaurus lentiginosus), and upland sandpiper (Bartramia longicauda). All of the blackpoll
warbler and yellow-bellied flycatcher observations were deemed to be migrants based on the
lack of appropriate breeding habitat in the area. The observations of American bitterns were
auditory and resonated from outside of the proposed project area. One site also documented
upland sandpipers during breeding bird surveys. A habitat suitability index was requested to
delineate suitable habitat in the vicinity of the project area. The PGC has not yet received the
results of the index for all potential habitat at this site. The state-listed threatened species
observed during breeding bird surveys include ospreys (Pandion haliaetus) and Northern
harriers. The osprey observations were of individuals flying over, and not of confirmed
breeders. Two sites documented Northern harriers during breeding bird surveys prior to
becoming listed as threatened. For confirmed breeding threatened and endangered species, the
PGC will work with the Cooperator to best avoid the area, minimize negative impacts, and
mitigate for any negative impacts to the species and its habitat. The PGC will be tracking all of
the sites that have documented migrant or breeding state-listed species during pre-construction
breeding bird surveys to see if mortality of these species occurs at these sites post-construction.
Although inconsistencies in methodology and reporting preclude rigorous analysis of the
breeding bird data, the species lists generated from point counts and area searches are indicative
of species that are likely to be adversely impacted by changes in land cover. This is best
exemplified by those sites that found species known to be indicators of high quality forests with
structural diversity that are also sensitive to edge effects, created by forest fragmentation, such as
blue-headed vireo (Vireo solitaries), black-throated blue warbler (Setophaga caerulescens),
black-throated green warbler (Setophaga virens), worm-eating warbler (Helmitheros
vermivorum), and scarlet tanager (Piranga olivacea) (Pennsylvania Game Commission 2005).
The PGC will continue to investigate how changes in habitat type affect the bird communities
documented at wind sites.

12
The PGC breeding bird protocols were designed to target breeding seasons of threatened,
endangered, and Wildlife Action Plan species of special concern birds. Failure to follow
protocols was a consistent issue from 2006 to 2009 with 15 of 22 surveys not adhering to PGC
protocols (see “Comments” in Appendix C). However, since 2010 all breeding bird surveys
conducted have followed the protocols provided in Exhibit A of the Cooperative Agreement.
The PGC continues to emphasize the importance of consulting with the PGC early in the
planning process to determine where point counts and area searches should be located on a
proposed project prior to commencing the surveys. Coordination with the PGC prior to surveys
will help to ensure the entire project area and all habitats are being surveyed adequately and will
reduce the chance that the PGC will have to ask the Cooperator to redo or conduct additional
surveys.
The Cooperative Agreement does not require post-construction breeding bird surveys however
the PGC has recommended post-construction breeding bird surveys when the presence of
threatened, endangered, or species of special concern species have been documented on the
project area. However, none of the sites for which the PGC has requested post-construction
breeding bird surveys have gone to construction or are in the first year of post-construction
monitoring. Thus, no post-construction breeding bird survey data has been provided to the PGC.
Birds: Bird Species of Special Concern Survey Bird species of special concern surveys conducted at proposed wind sites have included
bald eagle nest surveys. Surveys conducted targeting Pennsylvania endangered species include
short-eared owl presence/absence surveys, upland sandpiper surveys, and blackpoll warbler and
yellow-bellied flycatcher habitat surveys. Species specific bird surveys such as these are
requested by the PGC at sites that have known or historical occurrences of the species on or in
the vicinity of the proposed project area. Results of bird species of special concern surveys from
2007 to 2009 were summarized in the 1st and 2
nd summary reports (Capouillez and Librandi
Mumma 2008, Librandi Mumma and Capouillez 2011).
Between 2010 and 2011, upland sandpiper surveys were conducted at two sites. Both sites
conducted a habitat suitability index, which identified suitable habitat. Both sites then conducted
presence/absence surveys on the suitable habitat. One site did not find any upland sandpipers
using the area. The second site found upland sandpipers in the area and the Cooperator is
currently working with the PGC to determine strategies to avoid, minimize, and mitigate any
negative impacts.
One site conducted blackpoll warbler and yellow-bellied flycatcher habitat surveys in 2011.
These surveys resulted from observations of each species during pre-construction breeding bird
surveys. The observations were believed to be migrant birds, but because the species were
observed during the breeding season, the PGC requested habitat surveys to determine if suitable
habitat existed on the project area. The habitat survey did not indentify any habitat on or near
the project area that met specific criteria, such as wetland size and/or elevation, needed for
breeding habitat supporting the conclusion the birds were migrants.

13
Bats: Potential Hibernacula Investigations The investigation of potential hibernacula within the project area is the Cooperators’
responsibility. Potential hibernacula include features such as abandoned mines, subsidence
areas, and abandoned buildings. Since the Cooperative Agreement has been in effect, the PGC
received reports from 24 sites that conducted potential bat hibernacula investigations. Eight of
the 24 sites identified potential bat hibernacula on the project area that subsequently needed to be
sampled for bats. At these eight proposed wind sites, 81 potential bat hibernacula features were
sampled. One of the features investigated was identified as a hibernaculum of concern as
defined in the Cooperative Agreement (Exhibit C) due to the fact that one of the four bat species
captured was an Indiana bat (Myotis sodalis), a federal and state endangered species. Nineteen
of the 81 features trapped documented at least one northern long-eared bat (Myotis
septentrionalis), a species of special concern. The other features trapped did not result in
evidence of being a hibernaculum of concern. A hibernaculum of concern is currently defined
as a hibernaculum which houses a large number of bats (1000+ in an internal survey or 100+
captured via trapping), one that supports a diverse number of bat species (four or more species),
or which houses the state threatened eastern small-footed bat (Myotis leibii) or the state and
federally listed endangered Indiana bat.
The PGC investigates potential bat hibernacula within five miles of the proposed project area.
Since the Cooperative Agreement has been in effect, a total of 556 mine features were
investigated by PGC staff. A total of 39 features were identified as potential bat hibernacula.
Five of these features were trapped and none identified as a hibernaculum of concern. The PGC
plans to trap the remaining features in the future, as time and resources allow.
Since the Cooperative Agreement was implemented in 2007, white-nose syndrome has
devastated cave dwelling bat species in the northeastern United States, including Pennsylvania.
Interior hibernacula counts are used in Pennsylvania to monitor trends in cave dwelling bats.
Interior hibernacula surveys pre- and post-exposure of white-nose syndrome in Pennsylvania
have revealed an overall decline of 98% of cave dwelling bat species (Turner et al. 2011).
Because of the effects of white-nose syndrome on resident bat species, the criteria for
hibernacula of concern should be revised. The current criteria for defining hibernacula of
concern should be updated to reflect the overall 98% decline in Pennsylvania cave dwelling bat
species attributed to white-nose syndrome.
Bats: Acoustic Monitoring We received reports and data from 30 pre-construction bat acoustic surveys conducted at
24 individual sites between 2005 and 2011. Cooperators used the following models of bat
acoustic detectors to conduct pre-construction bat acoustic surveys (No. surveys): Pettersson
D500x (3), Anabat II (16), Anabat SD1 (3), AR 125 (3), and five used both Anabat II and Anabat
SD1. Calls per hour varied between 0.1 and 5.6 per project with an average of 1.0 calls/hour and
a standard deviation of 1.4. Since 19 of the 30 surveys did not adhere to PGC protocol these
summary statistics should be interpreted with caution. Deviations from the PGC protocol were
previously summarized in the 2nd
summary report (Librandi Mumma and Capouillez 2011) and
thus will not be discussed here. The average number of calls/hour for the 11 surveys that did
follow protocol ranged from 0.1 - 4.7, with an average of 1.2 and a standard deviation of 1.4.

14
Caution should be used when interpreting these data because differences in technology and
detection zones of the various acoustic detectors make comparing them difficult.
The number of detectors at each project varied, ranging from 1 to 36 detectors with an average of
5. Likewise, the height of detectors deployed varied. Height level of detectors fall into one of
the following categories: ground level <5 m, low level 5 - 10 m, moderate level >10 - 40 m, and
high level 40+ m. The percent of surveys conducted that had at least one detector at each of the
following detector levels was as follows: ground = 50%, low = 27%, moderate = 50% and high =
67%. Nineteen of the 30 surveys (63%) used multiple detectors at different heights and 11
surveys (37%) used detectors at one height only. Of the 11 surveys using detectors at only one
height, five were used at ground level, and six were used at high level.
In addition to requiring that acoustic detectors on all MET towers be installed as close to the
rotor swept zone as possible, PGC protocol (Exhibit B of the Cooperative Agreement) states that
“detectors should record from 30 minutes prior to sunset to 30 minutes following sunrise every
day.” For the 19 surveys that did not follow protocol, 50% did not survey from 30 minutes prior
to sunset to 30 minutes following sunrise every day, 67% did not survey within the correct dates,
and 29% did not have at least one detector on a MET tower at the highest level (40+m). The
correct dates of a survey is dictated by the site’s bat risk level, for low risk sites it is July 15 –
October 15, for moderate risk it is April 1 - 30 and July 15 – November 15, and for high risk
sites it is April 1 – November 15.
Between 2005 and 2007 only seven of 14 surveys had detectors that were operational for the
entire survey period. This prompted the PGC to implement an 80% detector success rate (i.e.
80% of the nights with detectors operational and able to collect data). In 2008, the first year
Cooperators targeted the 80% detector success rate, four of nine surveys did not meet the 80%
detector success threshold because of equipment failure, memory card issues, and battery
failures. Eight acoustic surveys were completed since 2009, of which all have achieved detector
success of at least 80% (92%). Only two acoustic surveys were completed between 2010 and
2011, both achieved detector success of 92% each.
Of the 30 pre-construction bat acoustic surveys performed, only eight followed the PGC
protocols by deploying a minimum of one high level detector, surveying the correct times and
season, and achieving 80% detector success. Using data from these eight sites, some general
trends can be derived. An average of 69% (60% - 82%) of all bat activity at three high bat
risk sites occurred between July 1 and September 30 (Figure 3). Only three high risk sites
were included in this seasonal analysis since these sites followed all protocols and were required
to collect acoustic data from April 1 to November 15. Of the low and moderate sites, bat activity
peaked between August and September, with sharp decreases in bat activity beginning in
October. These data suggest that any efforts to minimize bat mortality should be focused
between July 1 and September 30.

15
Figure 3. Seasonal patterns of bat activity at three high bat risk Pennsylvania wind sites
observed during pre-construction acoustic monitoring, 2007-2011.
Figure 4. Hourly bat activity at eight Pennsylvania wind sites observed during pre-construction
acoustic monitoring, 2007-2011.
The data also shows that 59% (range 48% - 69%) of the documented bat activity occurred when
wind speeds were less than 6 meters per second (Figure 5). Additionally, 76% (range 72% -
92%) of bat activity occurred when wind speeds were less than 7 meters per second, which
corresponds with the U.S. Fish and Wildlife Service’s 6.9 meters per second cut in speed
0%
5%
10%
15%
20%
25%
AP
R 1
- 1
5
AP
R 1
6 -
30
MA
Y 1
- 1
5
MA
Y 1
6 -
31
JUN
1 -
15
JUN
16
- 3
0
JUL
1 -
15
JUL
16
- 3
1
AU
G 1
- 1
5
AU
G 1
6 -
31
SE
P 1
- 1
5
SE
P 1
6 -
30
OC
T 1
- 1
5
OC
T 1
6 -
31
NO
V 1
- 1
5
Per
cen
tag
e o
f T
ota
l B
at
Act
ivit
y
Seasonal Interval
0%
5%
10%
15%
20%
25%
1 2 3 4 5 6 7 8 9 10 11 12 13 14
Per
cen
tag
e o
f o
f T
ota
l B
at
Act
ivit
y
Detector Hour

16
recommendation for sites with increased risk to endangered Indiana bats (Beech Ridge Energy
LLC 2012). Because the PGC protocol does not designate which species or species groups
should be identified, the species data provided to the PGC is not standardized. This limits the
ability of the PGC to determine species activity or species detection rates for these sites.
Figure 5. Bat activity by wind speed at eight Pennsylvania wind sites observed during pre-
construction acoustic monitoring, 2007-2011.
In response to inconsistencies with reporting of bat acoustic data, the PGC released Best
Management Practices for Acoustic Monitoring at Pennsylvania Wind Energy Facilities in 2011.
These management practices provide detailed instructions on what to report and how to fill out
the datasheets. No sites have completed pre-construction acoustics since the Acoustic BMP’s
have been released, however these management practices are anticipated to reduce the
inconsistencies in reporting that will provide a more robust dataset for analysis.
In early 2012 the U.S. Fish & Wildlife Service released its draft Rangewide Indiana Bat (Myotis
sodalis) Summer Survey Guidelines for review. The PGC provided the Service with comments
regarding the draft protocol. In addition, Cooperators were asked to provide the PGC with raw
acoustic bat call data from pre-construction surveys so the PGC could test the new automated bat
call software. All Cooperators submitted their acoustic bat call files to the PGC however, delays
in release of the automated software has prevented the PGC from completing an in depth review
of the software. The PGC anticipates providing the Service with comments once the PGC has
completed its review of the software in 2013.
Bats: Mist Net Surveys Mist net surveys are conducted based on the Cooperative Agreement criteria for high
potential bat risk projects and also in response to U.S. Fish and Wildlife Service (USFWS)
0
2
4
6
8
10
12
14
16
18
20
0
2
4
6
8
10
12
14
16
18
20
1
2
3
4
5
6
7
8
9
10
11
12
13
14
15
16
Per
cen
tag
e o
f T
ota
l T
ime
Per
cen
tag
e o
f T
ota
l B
at
Act
ivit
y
Wind Speed (m/s)
% Bat Activity % Time

17
requests. Cooperators generally complete these surveys early in the planning stage. Mist net
surveys provide valuable data to the PGC because they identify what cave species are present in
the project area and indicate breeding populations, if juveniles or reproductive females are
captured. Two sites in 2010 had their bat risk increased from low to high because of threatened
and/or endangered species captured during mist netting. In addition, mist net surveys provide
critical information about threatened and endangered species because telemetry is conducted on
these species if captured. Consulting with the PGC, and if applicable, the USFWS prior to
conducting mist net surveys is critical to avoid having to redo or conduct additional surveys due
to inappropriately placed or too few mist net sites. Additionally, early coordination ensures
protocols are followed regarding survey hours, duration, and utilization of qualified surveyors.
The PGC has rejected surveys that did not follow protocol. Thus some Cooperators have had to
conduct additional surveys in order to meet the Cooperative Agreement’s criteria and obtain
clearance from USFWS and/or PGC for their project.
A summary of mist net survey results can be found in Appendix F. Between 2004 and 2011 the
PGC received results from 39 bat mist net surveys conducted on 33 wind sites in Pennsylvania.
Six sites conducted two years of mist net surveys; three sites changed their project areas and
sampled the new areas of the proposed project, two sites did not adequately sample the project
area, which required additional netting, and one site captured a threatened and/or endangered
species, which required additional netting for telemetry. On average, five bat species were
captured during each survey (range 4 – 7 species). Between 2004 and 2011 mist net effort
averaged 12 bats per 1000 units of effort (range 3 – 45 bats). A unit effort is defined as one
square meter of net in place for one hour. In other words, it took 1000 square meters of nets in
place for one hour to capture 12 bats. Mist net effort in Pennsylvania has decreased significantly
since the onset of white nose syndrome. From 2010 to 2011 mist net success averaged 5
bats/1000 units of effort, a 58% decrease. Cave bats (little brown (Myotis lucifugus), big brown
(Eptisicus fuscus), Indiana, tri-colored (Perimyotis subfavus), long-eared (Myotis
septentrionalis), and small-footed bats) generally comprises the majority of bats captured during
mist-netting. Overall, effort required to capture cave bats has increased significantly while the
effort needed to capture migratory tree bats (red (Lasiurus borealis), hoary, and silver-haired
bats (Lasiurus noctivagans)) has remained steady. Mist net capture rates are not anticipated to
correlate with bat risk levels because the capture rates are reliant on site specific mist net
locations. Mist net surveys are designed to determine the presence or absence of threatened and
endangered species, which is a means to obtain specimens for telemetry. Captures of threatened,
endangered, and species of special concern bats during mist net surveys have provided valuable
information about foraging areas, roost locations, and maternity colonies for these species (see
Bat: Telemetry section below).
Bats: Telemetry Nine telemetry surveys have been conducted since the Cooperative Agreement was
established. Telemetry surveys identify foraging areas, roost locations, maternity colonies, and
behaviors that enable the PGC to determine where to best site wind turbines to avoid and
minimize potential adverse impacts to bat species. Since 2007, telemetry was conducted on 44
bats; 34 individual Indiana bats and 10 individual eastern small-footed bats. Because the species
with transmitters attached are endangered, threatened, or species of special concern and due to
the confidentiality clause in the Cooperative Agreement, survey locations will remain

18
confidential. However, this information was submitted for inclusion in the Pennsylvania Natural
Diversity Inventory (PNDI) so that it can be used to better site other development projects.
Between 2010 and 2011, one bat telemetry survey was conducted. At one site in 2010, five
small-footed bats were captured however only one male met the minimum weight criteria to be a
candidate for telemetry. The bat was tracked for four days, documenting two roost locations;
one in a talus pile and the second on the wall of a mine. An emergence count at the talus pile
roost location showed no evidence of a maternity colony. Due to the location of the roost
location on the mine wall, an emergence count was not conducted. The home range (95%
minimum convex polygons) for this male was estimated to be 150 acres (60.79 hectares) and the
core habitat (50% fixed kernel utilization distribution) was about 0.05 acre (0.02 hectare).
Some of the information gathered during the Indiana bat telemetry surveys associated with wind
energy projects revealed that female bats tend to travel farther from roosts to hibernacula than
male bats. Fall trapping at one hibernaculum indicated that female Indiana bats travelled up to
11.8 miles from roost tree to hibernaculum during fall swarming. Additionally, over 71 Indiana
bat roosts were identified, including the state’s second largest maternity colony. It was also
noted that male Indiana bats tended to forage in forested hilly terrain and use smaller riparian
areas compared to females which tended to forage in flatter areas and use larger riparian areas.
Telemetry studies of eastern small-footed bats associated with wind energy projects have
revealed over 14 roost locations including one maternity location. Home ranges of eastern
small-footed bats ranged from 150 acres to over 3,400 acres. This species utilized deciduous
forests primarily for foraging. Roost locations were identified in rocky outcroppings within the
forest, strip mines, spoil piles, and on cliffs.
Telemetry survey results were used by Cooperators to avoid and minimize potential impacts to
the species and their habitats. Avoidance and minimization methods used by Cooperators
include adjusting the placement and/or number of turbines, relocation of proposed turbine
strings, and the abandonment of portions of project areas to avoid impacts to listed bat species.
For sites where impacts could not be completely avoided, mitigation by Cooperators includes
installation of bat gates at known hibernacula to protect hibernating bats from disturbance and
plans to create eastern small-footed bat roosts.
Mammals of Special Concern: Allegheny Woodrat The state listed threatened Allegheny woodrat (Neotoma magister) inhabits steep
rocky/talus slopes, boulder fields, and/or caves in a forest interior matrix within the Appalachian
mountain areas where many wind sites are proposed. The operation of wind turbines is not
known to negatively impact woodrats directly however, the footprint of the project, including
infrastructure and turbines, may fragment and/or destroy their habitat and travel corridors.
Woodrat habitat assessment surveys are required if there are known historic or active sites on the
project area, or if there is potential habitat on the project area (determined by the PGC woodrat
GIS model and field reviews). Allegheny woodrat habitat assessment surveys follow protocols
found in the Allegheny Woodrat: the Environmental Review Process for Pennsylvania
(Pennsylvania Game Commission 2008). The purpose of the habitat assessment survey is to
delineate woodrat habitat and to document the presence of all old and new woodrat sign (e.g.
food caches, latrines).

19
Fifteen woodrat habitat assessment surveys have been completed on proposed wind sites
between 2007 and 2011. Only three proposed wind sites have documented woodrat sign; one
site documented both fresh and old sign and two sites documented only old sign. The
Cooperator for the site where fresh and old woodrat sign was documented has committed to
conducting additional studies, including pre-and post-construction trapping of woodrats, to
determine the impacts of the wind facility on the active population in the area. Pre-construction
surveys were completed in 2009. The results of the pre-construction woodrat monitoring
revealed a total population estimate of 25 woodrats on the project area. The capture of juvenile
woodrats also confirmed breeding on the project area. Post-construction surveys commenced in
2012 and will continue annually until 2016. The Cooperators for sites that documented old
woodrat sign have adjusted their project areas to exclude disturbing the area where old woodrat
sign was observed thereby avoiding potential impacts. For sites at which woodrats and/or
woodrat signs are found, the PGC will work with the Cooperator to avoid and minimize impacts
to the species, and, where necessary, require post-construction monitoring to assess the impacts
of wind development on woodrats and their habitats.
Mammals of Special Concern: Northern Flying Squirrel In Pennsylvania, state listed endangered northern flying squirrels (Glaucomys sabrinus)
are found in habitats characterized by mature mixed deciduous-hemlock stands or around stands
of pure conifer that contain large, mean = 17 inch dbh (44.9cm), conifers and many snags (~10
snags/acre; Mahan et al. 1999, Mahan et al. 2010). Similar to woodrats, direct impacts from
wind turbine operation is not known, but impacts from construction in the form of habitat
removal and fragmentation have the potential to negatively affect northern flying squirrels. At
this time the PGC does not have a presence/absence survey protocol established for northern
flying squirrels, however a habitat assessment is used to delineate any potential habitat. A total
of seven proposed wind sites have had potential impact to northern flying squirrels or their
habitat. One site with potential northern flying squirrel habitat has completed a habitat
assessment thus far and identified potential habitat. The Cooperator for the site has adjusted
their project area by micrositing turbines and utilizing pre-existing trails for construction to
minimize potential impacts to this area. As with other potential impacts to state threatened or
endangered species, the PGC will work with the Cooperator to avoid and minimize impacts to
northern flying squirrel habitat.
Post-construction Results
The PGC requests a minimum of two years of post-construction mortality surveys at each
site. In some circumstances, such as endangered species mortality, exceptionally high mortality
rates, or failure to follow established protocols, the USFWS and/or the PGC may request a third
year of mortality monitoring. Since 2007, one site completed three years of mortality
monitoring, however the site did not follow protocols the first year, and thus the PGC did not
accept the results. Two sites are conducting an additional third year of monitoring in 2012 due to
threatened or endangered species mortality. A total of 24 surveys (a survey is defined as one
year of mortality monitoring at one site) were conducted at 12 wind sites in Pennsylvania
between 2007 and 2011 (Table 6). The PGC requires that all sites conducting post-construction
monitoring acquire a PGC Special Use Permit so that bird and bat carcasses, including state
listed species, can be collected. The Bureau of Wildlife Protection issues the Special Use Permit

20
after the project monitoring plan has been reviewed and approved by the Bureau of Wildlife
Habitat Management, Division of Environmental Planning and Habitat Protection. The Special
Use Permit lists the effective and expiration dates, study methods, reporting requirements, etc.
All 12 sites were issued Special Use Permits to conduct post-construction monitoring surveys
and no Special Use Permits have been revoked.
Mortality Mortality searches were conducted daily from April 1 – November 15 for all sites with
low or moderate raptor risk, with the exception of the one site in 2007 that conducted daily
mortality searches between May 1 and November 17. Three of the four high raptor risk sites
conducted mortality surveys daily from March 1 – December 15, concurrent with raptor
migration surveys. One high raptor risk site conducted surveys from April 1 – December 15
because the site was not accessible in March due to heavy snow cover.
PGC staff validated the identification of all carcasses from all surveys, with few exceptions.
Estimated mortality was calculated from daily searches conducted at ten turbines, or 20% of
turbines, whichever was greater at each site. The Erickson et al. (2004) estimator, which corrects
for searcher efficiency and scavenger removal (SESR) biases, was used to calculate mortality
estimates for birds and bats. There are a few different estimators used currently, but for
standardization, the PGC asks that all sites use the Erickson estimator to allow for comparisons
among sites. However, because the Erickson estimator likely results in an underestimation of
mortality, the mortality estimates provided in Table 6 should be considered minimum estimates,
rather than the total mortality occurring on wind sites.
Bat Mortality A summary of bat mortality estimates for the 12 sites that conducted mortality searches
between 2007 and 2011 can be found in Table 6. All Cooperators are required to report
mortality estimates derived from the Erickson method (Erickson et al 2004). The PGC was
unable to determine what percentage of mortality was due to direct collision versus indirect
causes, such as barotrauma, because carcasses are not tested for barotrauma and evidence of
direct collision (lacerations, broken wing, etc.) is not required to be noted on data sheets. The
average estimated bats/turbine/year for the 19 surveys that followed PGC protocol was 25
(range 5 – 59).
A Friedman’s Test was used to compare bat mortality among risk categories. Results showed no
statistical difference among the risk groups in terms of mortality (Q = 2.9221, p = 0.2320).
Some sites designated as low bat risk had higher estimated bat mortality than sites designated as
high bat risk. Site 24-1, which was designated as low risk, had the highest estimated bat
mortality at 59 bats per turbine per year. Based on data collected thus far, the extent of bat
mortality cannot be predicted based on current bat risk levels. Furthermore, bat risk designations
do not correlate with threatened and endangered species mortality. Five high risk bat sites have
completed mortality monitoring and documented no threatened or endangered species.
However, one Indiana bat fatality was documented at a low bat risk site (see Threatened and/or
Endangered Species Mortality: Bats section).

21
Table 6. Summary of bat mortality estimates for the 12 sites that conducted mortality searches in
2007-2011. Bat risk, H = high, M = moderate, L = low; CI = confidence interval. Gray boxes
indicate no data was provided to the PGC.
Site
Code
Bat
Risk Year
PGC Protocol
Followed?
Estimated
Bats/Turbine/
Year
95% CI
Low
95% CI
High
Estimated
Bats/MW/Year
6-3 H 2007 Yes 30a
21
6-3 H 2008 Yes 27b
17
2-2 H 2008 Yes 19 15 23 22
2-2 H 2009 Yes 13 10 16 22
2-14 L 2008 Noc 7 2
e 13
e 3
2-14 L 2009 Yes 7 4 12 3
2-10 L 2008 Noc 16 7
e 29
e 8
2-10 L 2010 Yes 5 3 7 2
2-4 L 2009 Yes 29 20 38 12
2-4 L 2010 Yes 32 17 47 13
5-5 M 2009 Nod 13 7 21 7
5-5 M 2010 Yes 11 6 15 5
24-3 L 2009 Nod 12 1 5 6
24-3 L 2010 Yes 38 8 68 19
24-3 L 2011 Yes 19 13 27 10
6-1 H 2009 Yes 28 25 32 15
6-1 H 2010 Yes 29 25 32 14
35-1 L 2010 Yes 22 15 30 15
35-1 L 2011 Yes 11 8 14 7
24-1 L 2010 Yes 59 39 78 29
24-1 L 2011 Yes 30 23 39 15
2-19 H 2010 Yes 31 20 41 21
2-19 H 2011 Yes 14 8 21 10
6-16 L 2011 Nod 32
20
a Alternate analysis provided by developer, originally reported 43 bats/turbine/year
b Alternate analysis provided by developer, originally reported 34 bats/turbine/year
c Operational issues at site; less than 10 turbines searched
d Various aspects of PGC protocols were not followed
e 90% confidence interval
Mortality estimates varied between years for most sites. The general trend appears to be higher
overall bat mortality during the first year of monitoring (mean=33, standard deviation=12.7)
followed by lower mortality the second year of monitoring (mean=23, standard deviation=9.5).
However the difference in mortalities between years is not statistically significant (U (11) =148,
p = >0.05). Eight of the 11 sites that have completed multiple years of mortality monitoring
have greater mortality the first year compared to subsequent years. Four of the eight sites did not
follow PGC protocols during the first year of mortality monitoring reducing the confidence in the

22
first year mortality estimate. It is unknown why there appears to be reduced mortality during the
second year of monitoring. Potential explanations include bats recognizing and avoiding
turbines, the mortality from the first year reducing the overall number of bats thereby reducing
the mortality during subsequent years, and natural fluctuations of populations of bat species.
Three of the 11 sites that have completed multiple years of mortality monitoring showed an
increase in bat mortality from year one to year two. One of these three sites (Site 24-3) did not
follow PGC protocols during the first year of surveys, and a decrease in bat mortality occurred
between the second and third year of monitoring. Because PGC protocols were not followed the
first year, it is difficult to determine if the increase in bat mortality the second year was accurate
or if the mortality estimate for the first year was low due to deviations from the PGC protocols.
A total of 2,820 bat carcasses were found during standardized searches at Pennsylvania wind
sites conducting mortality monitoring between 2007 and 2011. The majority of bat carcasses
found during standardized searches since 2007 were adult males (Figure 6). One site (6-16) had
much higher than average female mortality, with females making up 43% of carcasses found.
This site has not yet completed the second year of monitoring. Likewise, two sites (6-1 and 6-
16) had higher than average juvenile mortality compared to other sites. In 2009, 25% of all bats
documented at site 6-1 were juveniles however, only 8% of bat mortalities found at this site
during the second year of monitoring were juveniles. In 2011, site 6-16 documented 51% of all
bats found during monitoring were juveniles; this site has not yet conducted a second year of
mortality monitoring. The greater proportions of juvenile mortality at these sites could be
indicative of a maternity colony in the vicinity of the project, however because one site was low
risk and the second site was grandfathered in to the Cooperative Agreement, no mist-net surveys
were conducted to verify the presence of a maternity colony.
Figure 6. Sex and age composition of all bat mortality documented during standard searches at
the wind sites that followed PGC protocol, 2007-2011.
Migratory tree bats (hoary, red, silver-haired, and Seminole (Lasiurus seminoles) bats)
comprised 76% of all documented mortality, while cave bats (tri-colored (Perimyotis subflavus),
little brown, big brown, northern long-eared, and Indiana bats) comprised 23% of all documented
mortality, and 1% of all documented mortality was unknown due to degraded carcass condition
which precluded species identification. Migratory tree bats were the majority of bat species
documented each year consistently from 2007 (Table 7).
83%
12%
5%
Adult
Juvenile
Unknown
29%
59%
12%
Female
Male
Unknown

23
Table 7. Percent composition of migratory tree bats and cave bats found during daily searches at
Pennsylvania wind sites during mortality surveys conducted in 2007-2011, by year (No. sites
conducting mortality monitoring), and overall.
Percent (%) of Total Bat Mortality
2007
(1)
2008
(4)
2009
(6)
2010
(8)
2011
(5)
2007-2011
(12)
Migratory Tree Bats 75 74 61 83 81 76
Cave Bats 24 25 38 16 18 23
Unknown Bats 1 1 1 1 1 1
Species composition of migratory tree bats varied among years (Table 8), with the majority of
migratory tree bats documented being Hoary bats. Seminole bats were the least frequently found
tree bat at Pennsylvania wind sites. Nine adult Seminole bats (5 males, 3 females, and one
unknown sex) were found at six different wind sites. All suspected Seminole bats were sampled
and confirmed via genetic analysis. The six sites represented five different regions of
Pennsylvania, which indicates Seminole bats may frequent Pennsylvania more than previously
thought. Between 2007 and 2009 tri-colored bats were the most commonly documented cave bat
species found at Pennsylvania wind sites. Between 2009 and 2010 the proportion of tri-colored
bats dropped significantly. Similarly the proportion of little brown bats declined during the same
time period. This is most likely attributed to the effects of white nosed syndrome. While white
nosed syndrome is believed to have first surfaced in Pennsylvania in 2009, the effects of the
fungus were not realized on the bat populations until 2010. Interestingly, the proportion of big
brown bat mortality documented at Pennsylvania wind sites has increased. The increased
proportion of big brown bat mortality may be attributed to big brown bats being less susceptible
to white nose syndrome (Turner et al. 2011). Therefore, because overall numbers of big brown
bat mortalities are not decreasing at the same rate as little brown bats, their proportions are
increasing.
Table 8. Percent species composition of bat carcasses found during daily searches at
Pennsylvania wind sites during mortality surveys conducted in 2007-2011, by year (No. sites
conducting mortality monitoring), and overall.
Percent (%) of Total Bat Mortality
2007
(1)
2008
(4)
2009
(6)
2010
(8)
2011
(5)
2007-2011
(12)
Hoary 31 34 27 30 39 31
Eastern Red 33 18 15 39 26 28
Silver-haired 12 22 19 14 16 16
Seminole 0 0 <1 <1 <1 <1
Tri-colored 16 14 15 4 3 8
Little Brown 4 8 17 6 4 8
Big Brown 3 2 6 6 11 6
Northern Long-eared 0 0 <1 0 0 <1
Indiana 0 0 0 0 <1 <1
Unknown 1 1 1 1 1 1

24
Species composition varied among sites (Table 9). Generally hoary, red, or silver-haired bats
were the most frequently documented bat species. Interestingly, species composition also varied
between years for most sites. For example, site 2-10 documented a majority of hoary and silver-
haired bat mortalities during the first year of monitoring, however red bats consisted of the
majority of bat species documented during the second year of monitoring. It is currently
unknown whether a site’s yearly variation in species composition is due to species’ population
trends or if the variation could be attributed to operational impacts.
Table 9. Percent composition of bat carcasses found during standardized searches at
Pennsylvania wind sites during mortality surveys conducted in 2007-2011, by site, and overall.
Threatened and endangered species are not listed in the table due to the sensitivity of the data.
One Indiana bat fatality has been documented at a Pennsylvania wind site between 2007 and
2011. LACI = Hoary bat, LABO = Eastern red bat, LANO = Silver-haired bat, MYLU = Little
brown bat, PESU = Tri-colored bat, EPFU = Big brown bat, MYSE = Northern long-eared bat,
LASE = Seminole bat, UNK = Unknown.
Site Year LACI LABO LANO MYLU PESU EPFU MYSE LASE UNK
6-3 2007 31 33 12 4 16 3 0 0 1
6-3 2008 36 19 19 6 16 2 0 0 1
2-2 2008 33 17 26 10 12 3 0 0 1
2-2 2009 30 14 24 17 11 3 0 2 0
2-14 2008 40 0 20 0 0 20 0 0 20
2-14 2009 38 16 19 9 6 3 3 0 6
2-10 2008 24 18 24 18 18 0 0 0 0
2-10 2010 18 42 6 12 3 0 0 0 18
2-4 2009 31 21 22 11 9 5 0 0 1
2-4 2010 34 42 10 5 5 4 0 0 0
5-5 2009 20 22 32 12 4 10 0 0 0
5-5 2010 35 24 35 0 2 4 0 0 0
6-1 2009 20 10 13 24 24 8 0 0 <1
6-1 2010 35 29 12 5 10 10 0 <1 0
24-3 2009 48 14 18 9 9 2 0 0 0
24-3 2010 34 38 20 4 1 2 0 1 0
2-19 2010 26 44 10 10 2 6 0 0 1
2-19 2011 41 24 17 2 6 7 0 <1 1
24-1 2010 32 41 14 3 3 8 0 0 1
24-1 2011 51 25 13 1 3 5 0 0 1
24-3 2011 43 27 12 9 4 5 0 0 0
35-1 2010 24 43 16 9 1 7 0 1 1
35-1 2011 32 27 27 3 0 10 0 0 0
6-16 2011 12 29 8 4 0 47 0 <1 0
Overall 31 28 16 8 8 6 <1 <1 <1

25
Two sites (6-1 and 6-16) documented greater that 50% of cave bats during mortality monitoring.
Site 6-1 documented mortality comprised of 56% cave bats during the first year of mortality
monitoring. During the second year of monitoring in 2010, only 25% of the total bat mortality
was cave bats. This dramatic decrease in cave bat mortality is most likely attributed to the
effects of white-nose syndrome; however the overall mortality observed remained similar as
there was an increase in migratory tree bat mortality during the second year. Site 6-16 also
documented a greater that average proportion of cave bat mortality in 2011, specifically big
brown mortality. This site has not yet conducted the second year of mortality monitoring, so a
comparison between years is not possible. This site also experienced higher than average
juvenile and female bat mortality, which may indicate a maternity colony in the area. No known
hibernacula exist in the area of this site, and no mist net surveys were required pre-construction
of this site due to its low bat risk designation. However the site is located near a waterway that
could serve as a travel and/or foraging corridor to bats, likewise the site is in the relative vicinity
of an urban area that may contain undocumented maternity colonies in attics or abandoned
buildings.
Overall 23% of the bat mortality consisted of cave bats; little brown bats (8%), tri-colored bats
(8%), big brown bats (6%), Indiana bats (<1%), and northern long-eared bats (<1%) (Table 9).
Threatened and endangered species are not listed in Table 9 due to the sensitivity of the data.
One Indiana bat fatality has been documented at a Pennsylvania wind site between 2007 and
2011, see the Threatened and/or Endangered Species: Bats section for more information. More
than 50% of documented mortality consisted of cave bats at two sites (6-1 and 6-16). Site 6-1
documented high cave bat mortality during the first year only and the second site (6-16) has not
yet completed the second year of post-construction mortality monitoring. White nose syndrome
research in the vicinity of site 6-1 located several previously unknown bat hibernacula in close
proximity to the site, explaining why the majority of bat fatalities were cave bats during the first
year of monitoring. Site 6-16 is not located near any known bat hibernacula however the project
is in the vicinity of an urban area, which may contain undocumented maternity colonies. An
additional four sites documented greater than average proportions of cave bat species, although
not a majority. Sites 2-10, 2-14, 2-2, and 5-5 all had higher than average proportions of little
brown, tri-colored, or big brown bat mortality. Sites 2-14, 2-2, and 5-5 have identified
hibernacula containing these three species within five miles of the project. Additionally all of
the sites that experienced greater than average proportions of cave bat mortality have streams,
rivers, or ponds in the vicinity of the project. Overall, less than one percent of bat carcasses
found were classified as unknown. Unknown bat carcasses were typically in poor condition
(disintegrated, missing parts of the carcass that contain key identification characteristics, etc.)
which precluded the ability to identify to the species level. Sites 2-10 and 2-14 show unknown
bat carcasses at a much higher proportion than other sites. This can be attributed to the low
overall bat mortality at these sites, which results in the few unknown bat carcasses representing a
large proportion of species composition.
Distributions of bat mortality by Julian date are shown in Figure 7. Julian date was chosen to
standardize the data because 2008 was a leap year.
Seasonal distribution of bat mortality varies among species, however the peak of mortality of all
species tend to occur in the fall (Figure 8). Note that Indiana and northern long-eared bats are

26
not represented in the figure. One mortality has been documented for each species, both of these
mortalities occurred in September.
Figure 7. Patterns of bat mortality, by Julian date, for the bat carcasses found at the 12 wind sites
that conducted post-construction mortality searches in Pennsylvania, 2007-2011.
Figure 8. Distribution of bat mortality by species and month, 2007-2011.
Ninety-eight percent of all bat mortality occurred between May and October, whereas 79%
mortality occurred between July and September (Table 10). There is some variation in peak
mortality among species. Mortality peaks in early August for all bat species except the silver-
haired bat, which peaks in September. The later peak in mortality of silver-haired bats are
similar to other studies that demonstrate migration times of migratory tree bats (Dzal et al 2009,
0
10
20
30
40
50
60
70
80 93
107
116
124
132
140
149
157
165
173
181
189
197
205
213
221
229
237
245
253
261
269
277
285
293
302
No
. B
at
Ca
rca
sses
Julian Date
0
10
20
30
40
50
60
Per
cen
tage o
f B
at
Mort
ali
ty
Month
Big brown
Red
Hoary
Silver-haired
Seminole
Little brown
Tri-colored
All Bats

27
McGuire et al 2012). Because Seminole bats represent a very small sample size, it is difficult to
determine peak mortality for this species. However, all of the Seminole bat mortalities at
Pennsylvania wind sites have occurred in August and September. These data suggest that
minimization efforts focused between July 1 and September 30 would maximize the
effectiveness of such efforts, thereby reducing the risk to all bat species.
Table 10. Percent of species composition by bi-weekly time period for bat carcasses
documented during standardized searches at Pennsylvania wind facilities from 2007-2011.
Percent (%) of Species Composition
Bi-weekly Period Big
bro
wn
Red
Hoar
y
Sil
ver
-hai
red
Sem
inole
Lit
tle
bro
wn
Nort
her
n
long
-ear
ed
India
na
Tri
-colo
red
Unknow
n
Tota
l
April 1 - April 14 0 0 1 1 0 0 0 0 0 4 0
April 15 - April 30 1 <1 2 4 0 3 0 0 3 0 1
May 1 - May 14 0 0 2 4 0 0 0 0 4 0 2
May 15 - My 31 6 2 3 4 0 3 0 0 5 0 3
June 1 - June 14 7 2 3 6 0 6 0 0 3 4 4
June 15 -June 30 9 3 6 3 0 6 0 0 5 9 5
July 1 - July 14 4 5 5 1 0 8 0 0 8 0 6
July 15 - July 31 18 11 10 1 0 10 0 0 7 0 9
August 1 - August 14 22 16 16 2 17 14 0 0 15 0 14
August 15 - August 31 18 30 24 16 33 22 0 0 30 22 25
September 1- September 14 6 12 17 19 33 15 100 0 12 30 15
September 15 - September 30 6 11 10 23 17 10 0 100 6 27 12
October 1 - October 14 1 4 1 14 0 2 0 0 1 0 4
October 15 - October 31 1 2 0 2 0 1 0 0 1 4 1
November 1 - November 14 0 1 0 0 0 0 0 0 0 0 0
November 15 - November 30 0 0 <1 0 0 0 0 0 0 0 0
Mortality trends are similar between migrating and cave bat species with 80% of all migratory
bat and 78% of all cave bat mortality occurring between July 1 and September 30, peaking in
August (Figures 7, 8, and 9). These results also support focusing minimization efforts on July 1
to September 30 to reduce the risk to all bat species. Less than 3% of the total bat mortality
occurred in the months of April and November. April bat mortality occurred at all 12 sites that
conducted mortality monitoring between 2007 and 2011. The following species were found
during the April bat mortality surveys: hoary, silver-haired, red, tri-colored, big brown, and little
brown. Of the 12 sites, seven documented cave bat mortality in April. Four of the seven sites
that documented cave bat mortality in April were high risk and three low risk. No cave bats
were documented during mortality monitoring in November, only hoary and red bats. Because
bats are exiting bat hibernacula in April and entering during late October/early November, it
could be inferred that increases in bat mortality during April and/or late October/early November

28
may indicate the presence of a nearby hibernaculum. It is unknown at this time as to what level
of mortality during April and/or late October/early November may be an indicator of the
presence of a nearby hibernaculum.
Figure 9. Distribution of bat mortality by month.
Because bat risk levels are determined by presence or absence of threatened and endangered
species, the PGC recommends that the post-construction mortality monitoring survey period
remain April 1 – November 15 for high risk sites. Of the cave bat mortality, which occurred
during April, 78% occurred at high risk sites, which are designated as such due to the presence of
hibernacula within five miles of the project. The data provides some evidence to show that bats
entering or exiting hibernacula are at risk. For low risk bat sites, the PGC may consider reducing
mortality monitoring in the future (e.g. May 1- October 31), since 98% of mortality occurs
during this time period. Note that reduced monitoring would only be considered if there are no
potential risks to birds.
Bird Mortality An average of 4 birds/turbine/year died for 19 surveys that followed PGC protocol was (1 –
10). Bird mortality estimates varied by site and among years of monitoring (Table 11). Of the
11 sites that conducted more than one year of mortality monitoring, five sites experienced
increased bird mortality during the second year of monitoring, two sites experienced decreases,
and four sites went unchanged. However the changes in bird morality between years for each
site were not statistically significant, except for site 2-4 (X2 = 5.14, p = 0.0233). The reason for
the increased bird mortality for the first year at site 2-4 is unknown as the landcover and
topography is similar to other wind facilities in Pennsylvania.
Although raptor risk is determined by known raptor migration, features used by raptors are often
similar to those used by other birds. A Freidman’s test was used to compare bird mortality
among raptor risk groups. Interestingly, there appears to be a weak correlation between raptor
risk and estimated bird mortality (Q = 5.1473, p = 0.0763). A Wilcoxon test revealed that low
and medium risk were similar (S = 66.5, p = 0.4569), medium and high risk were similar (S =
0
5
10
15
20
25
30
35
40
45
Per
cen
tag
e o
f T
ota
l B
at
Mo
rta
lity
Month
MTB
CAVE

29
64.0, p = 0.1961), but low and high risk are different (S = 79.0, p = 0.0083). Although there is a
weak association between the estimated bird mortality and raptor risk, the extent of bird
mortality cannot be predicted using raptor risk.
Table 11. Bird mortality estimates for the 12 sites that conducted mortality searches in 2007-
2011. Raptor risk, H = high, M= moderate, L=low; CI = confidence interval. Gray boxes
indicate information that was not included in the annual report for that site.
Site
Code
Raptor
Risk Year
PGC
Protocol
Followed?
Estimated
Birds/Turbine
/ Year
95%
CI
Low
95%
CI
High
Estimated
Birds/MW/Year
6-3 L 2007 Yes 2 1
6-3 L 2008 Yes 2 1
2-2 L 2008 Yes 2 1 4 2
2-2 L 2009 Yes 4 3 6 3
2-14 M 2008 Noa 7 4
c 10
c 3
2-14 M 2009 Yes 5 3c 7
c 2
2-10 M 2008 Noa 1 0
c 3
c 1
2-10 M 2010 Yes 2 1 3 1
6-1 L 2009 Yes 2 1 3 1
6-1 L 2010 Yes 2 1 3 1
5-5 M 2009 Nob 1 0 2 1
5-5 M 2010 Yes 1 0 2 1
2-4 M 2009 Yes 10 3 12 5
2-4 M 2010 Yes 3 1 4 1
24-3 H 2009 Nob 3 1 5 1
24-3 H 2010 Yes 3 1 4 1
24-3 H 2011 Yes 3 1 4 1
35-1 L 2010 Yes 2 1 3 2
35-1 L 2011 Yes 3 2 4 2
24-1 H 2010 Yes 4 1 7 2
24-1 H 2011 Yes 7 3 12 3
2-19 H 2010 Yes 3 1 6 2
2-19 H 2011 Yes 5 1 8 3
6-16 H 2011 Nob 5 2
a Operational issues at site; less than 10 turbines searched
b Various aspects of PGC protocols were not followed
c 90% confidence interval
A total of 409 bird carcasses were found during standardized searches at Pennsylvania wind sites
during mortality monitoring between 2007 and 2011. Overall bird mortality was composed of
mostly Passeriformes (73%), the remaining 27% were Galliformes (4%), Accipitriformes (3%),

30
Piciformes (2%), Cuculiformes (2%), Anseriformes (1%), Apodiformes (1%), Columbiformes
(1%), Charadriiformes (1%), Gruiformes (<1%), Coraciformes (<1%), and 12% unknown birds
(Appendix G). Overall the composition of bird Order remains consistent, with Passeriformes
comprising the majority of bird carcasses documented each year (Table 12).
Table 12. Percent composition of bird carcasses found during daily searches at Pennsylvania
wind sites during mortality surveys conducted in 2007-2011, by year (No. sites conducting
mortality monitoring), and overall.
Percent (%) of Total Bird Mortality
Bird Order 2007 (1) 2008 (4) 2009 (6) 2010 (8) 2011 (5) 2007-11 (12)
Accipitriformes* 0 2 2 6 0 3
Anseriformes 0 0 2 0 0 1
Apodiformes 10 0 2 1 1 1
Charadriiformes 0 0 1 3 0 1
Columbiformes 0 2 2 1 0 1
Coraciiformes 0 0 0 0 1 0
Cuculiformes 0 4 3 1 0 2
Galliformes 0 2 4 5 6 4
Gruiformes 0 0 1 0 1 0
Passeriformes 80 70 72 66 81 73
Piciformes 0 3 1 3 2 2
Unknown 10 17 10 14 8 12
*sensu Chesser et al. 2010
Red-eyed vireos (Vireo olivaceus) were the most frequently documented passerine species as
well as overall bird species (25%) observed as mortalities at Pennsylvania wind sites. Red-eyed
vireos are considered common and abundant in Pennsylvania that can be attributed to its ability
to successfully utilize a variety of habitats. Results from the Pennsylvania Breeding Bird Atlas
(Brauning 1992) report red-eyed vireo observations in every county of Pennsylvania. Unlike
other passerines such as the golden-crowned kinglet (Regulus satrapa) and magnolia warbler
(Setophaga magnolia), red-eyed vireo mortality is not limited to migration periods. Red-eyed
vireo mortality has been documented from May to October. The exact reason for the increased
mortality of red-eyed vireos is not understood, however it could be attributed to overall species
abundance in Pennsylvania, life history as a bird that inhabits the upper forest canopy, and
breeding in the vicinity of wind turbines, which raises the risk throughout spring, summer, and
fall. Golden-crowned kinglets, magnolia warblers, and ruby-crowned kinglets (Regulus
calendula) were also documented in higher numbers compared to other passerines at
Pennsylvania wind sites. Mortality of these species is limited to spring and fall migration
periods of April to May and September to November. Overall the mortality of these species can
most likely be attributed to wind sites being constructed on ridges historically used as migration
pathways however it remains unknown why certain species appear to be more at risk than others
are.

31
Bird taxonomic Order composition varied among sites and by year for each site (Table 13). The
variation of composition appears dramatic for some sites; however the small sample size
exaggerates this in general. For example, if one year a site had 25% Anseriformes and the
second year had 0% Anseriformes, the 25% may account for one bird. Passeriformes were
documented at all sites between 2007 and 2011. Passeriformes were found during all surveys
except one site (2-10) in 2008. Site 2-10 documented only one bird mortality in 2008, which
could not be identified to species due to the condition of the carcass.
Table 13. Composition of bird Orders found during standardized searches at Pennsylvania wind
sites during mortality surveys conducted in 2007-2011, by site, and overall.
Order
Site Code Year Acc
ipit
rifo
rmes
Anse
rifo
rmes
Apodif
orm
es
Char
adri
iform
es
Colu
mbif
orm
es
Cora
ciif
orm
es
Cucu
lifo
rmes
Gal
lifo
rmes
Gru
iform
es
Pas
seri
form
es
Pic
iform
es
Unknow
n
6-3 2007 0 0 10 0 0 0 0 0 0 80 0 10
6-3 2008 6 0 0 0 6 0 0 0 0 82 0 6
2-2 2008 0 0 0 0 0 0 6 0 0 57 6 31
2-2 2009 0 0 7 3 3 0 0 0 0 76 0 11
2-14 2008 0 0 0 0 0 0 8 8 0 76 0 8
2-14 2009 0 0 4 0 0 0 4 7 4 70 0 11
2-10 2008 0 0 0 0 0 0 0 0 0 0 0 100
2-10 2010 0 0 0 17 0 0 0 8 0 42 0 33
2-4 2009 0 6 0 0 4 0 4 2 0 76 0 8
2-4 2010 0 0 8 0 0 0 0 8 0 84 0 0
5-5 2009 0 0 0 0 0 0 0 33 0 33 17 17
5-5 2010 25 0 0 0 0 0 0 0 0 50 25 0
24-3 2009 30 0 0 0 0 0 0 0 0 50 0 20
24-3 2010 17 0 0 0 0 0 8 8 0 59 0 8
24-3 2011 0 0 0 0 0 0 0 18 6 53 0 23
6-1 2009 0 0 0 0 0 0 7 0 0 80 0 13
6-1 2010 0 0 0 0 9 0 0 0 0 91 0 0
35-1 2010 14 0 0 5 0 0 0 9 0 48 5 19
35-1 2011 0 0 4 0 0 4 0 0 0 85 7 0
24-1 2010 0 0 0 0 0 0 0 0 0 91 9 0
24-1 2011 0 0 0 0 0 0 0 8 0 84 0 8
2-19 2010 4 0 0 0 0 0 0 0 0 68 0 28
2-19 2011 0 0 0 0 0 0 0 3 0 88 0 9
6-16 2011 0 0 0 0 0 0 0 0 0 100 0 0
Overall 3 1 1 1 1 <1 2 4 <1 73 2 12

32
Between 2007 and 2011, five of the 12 sites conducting mortality monitoring documented raptor
mortality. Eleven raptor mortalities have been documented; one broad-winged hawk, seven red-
tailed hawks, and three turkey vultures. Of the five sites that documented raptor mortality, two
were high risk, one moderate risk, and two low risk. The raptor fatalities were documented in
March, April, May, July, October, and November. An additional 13 raptor casualties were found
incidentally, consisting of one American kestrel, two broad-winged hawks, one Cooper’s hawk,
seven red-tailed hawks, and two unknown hawks. Incidental raptor fatalities were documented
in March, April, May, July, September, and November. There does not appear to be any
relationship between PGC raptor risk and raptor mortality (r (3) = 0.30, p > 0.05) as several low
risk sites documented mortality while some high risk sites did not.
Forty-eight percent of bird mortality was between June and September and 86% of mortality
occurred between May and October (Table 14). Bird mortality is spread throughout the survey
season (Figure 10); however there was a significant statistical difference in bird mortality
between each month (X2=235, p = < 0.01). May and September are peaks in the bird mortality,
corresponding to migration periods. However, September’s mortality is significantly higher than
mortality documented in May (X2 = 12, p = < 0.01).
Table 14. Bird mortality by month found during standardized searches at 12 Pennsylvania wind
sites conducted 2007-2011.
Month
Percentage of Bird
Mortality
March <1
April 10
May 16
June 5
July 7
August 8
September 28
October 22
November 4
December 0
There was little to no bird mortality in March and December, however bird mortality was
documented in April (10%) and November (4%). Surveys have been requested at high risk
raptor sites in March and December in an attempt to document all bird mortality that may be
occurring during raptor migration, particularly eagles to correspond to concurrent raptor
migration surveys. However, no eagle mortality was documented at any Pennsylvania wind site,
and only one raptor mortality has been found during March and November. Additionally
weather conditions at wind sites during these months are harsh, often resulting in several missed
search days. Based on data collected over the past five years, extended mortality monitoring in
March and December is not warranted due to the absence of carcasses, weather conditions, and
safety issues.

33
Figure 10. Bird mortality, by Julian date, at 12 wind sites that conducted post-construction
mortality searches in Pennsylvania, 2007-2011.
Figure 11. Bird mortality by month, by year, and overall, 2007-2011.
0
2
4
6
8
10
12
14
16
75
97
111
119
125
132
138
147
155
166
182
192
200
213
226
233
241
250
257
263
269
276
283
290
298
306
312
No
. o
f B
ird
Ca
rca
sses
Julian Date
0
5
10
15
20
25
30
35
40
45
50
Per
cen
tage o
f A
nn
ual
Bir
d M
ort
ali
ty
Month
2007
2008
2009
2010
2011
% of Total Bird
Carcasses

34
Mortality in Relation to Turbine Ninety-six percent of detected bat carcasses found during standardized searches occurred
within 50 meters of the closest turbine and 85% of the bird carcasses occurred within 50 meters.
Eighty-seven percent of bat fatalities fell within 40 meters of the closest turbine and 71% of bird
fatalities were found within 40 meters (Figure 12). Current PGC protocols require a 120m x
120m search plot centered on the turbine. This size search plot provides for complete coverage
of 60 meters around the turbine, with greater distance at the corners of the search plot. Rarely is
the entire 120m x 120m search plot considered searchable due to steep terrain, water sources,
and thick vegetation. Based on the data collected since 2007, the PGC recommends that the
search plot remain 120m x 120m to ensure that the majority of bird and bat carcasses are
available to be located.
Figure 12. Distance from turbines of bird and bat carcasses found during standardized searches
at the 12 Pennsylvania wind sites that conducted mortality monitoring from 2007-2011.
Bird carcass distribution in all four quadrants surrounding the turbines was statistically equal (X2
= 6.65, p > 0.05) (Figure 13). Distribution of bat carcasses appear slightly skewed to the east of
the turbines (X2
= 54.71, p < 0.01). This is most likely attributed to a predominately western
aspect of the prevailing winds. There was no statistical difference between the number of bat
carcasses found north or south of the turbine, however there was a statistical difference between
the number of bats found in the northeast compared to the southeast (X2 = 7.78, p = <. 001).
Although more carcasses were found in the northeast quadrant of the search plot, the difference
only amounted to 3% of all of the carcasses found. Because bird mortalities are occurring
equally in all directions surrounding the turbine, and the increased bat mortality in the northeast
quadrant of the search plot accounts for such a low percentage of the total bat mortality, these
data do not support shifting the search plot off of the turbine or searching only certain quadrants
of the search plot.
0
5
10
15
20
25
30
0 - 9.9 10 - 19.9 20 - 29.9 30 -39.9 40 - 49.9 50 - 59.9 60 +
Per
cen
t of
Tota
l
Distance to Turbine (m)
Bats
Birds

35
Figure 13. Spatial distribution of bird (A) and bat (B) carcasses found during standard searches
in 2007-2011 at the 12 Pennsylvania wind sites. Concentric circles are at 20 meter intervals
from turbine center.
Searcher Efficiency Searcher efficiency trials were conducted at all 12 sites. Carcasses of birds and bats were
placed in random locations throughout the search area in and were blind to the searchers. Trials
occurred in all visibility classes, at all searched turbines, and for all searchers with few
exceptions. Searcher efficiency rates varied among sites, years, and visibility classes, and also
between bat and bird carcasses (Table 15 & 16).
Overall, searcher efficiency rates were slightly higher for birds than for bats (Table 15).
Searcher efficiency rates for bats averaged 32% (range 15 - 70%) for 11 sites that reported
searcher efficiency; while for birds it averaged 39% (range 15 – 70%) for 12 sites that reported
searcher efficiency rates. The increased searcher efficiency rate for birds could be attributed to
the overall larger size of birds compared to bats and brighter coloration making for easier
observation.
Searcher efficiency rates varied among sites (Table 15). This variation is not likely attributed to
searcher differences. There was also variation in searcher efficiency for the same searcher
among years for each site. This is most likely attributed to the ability of the individual searcher
to locate carcasses. The range of individual searcher efficiency is not always provided to the
PGC. The searcher efficiency range for individuals varied greatly among all consultants.

36
Table 15. Searcher efficiency rates (percent) for bats and birds and range of average searcher
efficiency of searchers at 12 Pennsylvania wind sites during standardized surveys conducted in
2007-2011. Grey boxes indicate no data provided to the PGC.
Bats Birds
Site
Code Year
SE %
Average
(1-day)
Range
of SE by
Searcher
SE %
Average
(1-day)
Range
of SE by
Searcher
6-3 2007 25 23
6-3 2008 31 64
2-2 2008 52
2-2 2009 46
2-14 2008 17 27-50 23 35-100
2-14 2009 24 10-50 30 0-78
2-10 2008 17 11-50 23 18-100
2-10 2010 38 33-50 40 34-50
2-4 2009 47 53
2-4 2010 35 27
5-5 2009 30 48
5-5 2010 30 44
24-3 2009 15 15
24-3 2010 33 59
24-3 2011 27 27
6-1 2009 46 45
6-1 2010 70 70
35-1 2010 20 20-20 42 24-55
25-1 2011 24 20-28 36 21-46
24-1 2010 28 28
24-1 2011 30 18
2-19 2010 41 35
2-19 2011 26 30
6-16 2011 29 6-100 70 0-100
Searcher efficiency also varied among visibility classes (Table 16). Searcher efficiency trials
were to test the searchers ability to locate carcasses in all visibility classes. As expected,
searcher efficiency was generally highest for visibility class I. Again there was also variation in
searcher efficiency for visibility classes between the first and second year of a site. There also
appears to be a slight difference in searcher efficiency between birds and bats in each visibility
class.

37
Table 16. Searcher efficiency (SE) rates for bats and birds by visibility (vis.) class at 12
Pennsylvania wind sites during standardized surveys conducted in 2007-2011. Grey boxes
indicate no data provided to the PGC.
Bat SE Bird SE
Site
Code Year
Vis.
Class 1
Vis.
Class 2
Vis.
Class 3
Vis.
Class 4
Vis.
Class 1
Vis.
Class 2
Vis.
Class 3
Vis.
Class 4
6-3 2007 30 11 22 29
6-3 2008 35 6 64 64
2-2 2008
2-2 2009
2-14a 2008 100 35 35 0 100 35 35 0
2-14a 2009 34 18 20 13 34 18 20 13
2-10 2008 50 19 11 0 50 18 31 0
2-10 2010 48 30 29 57 47 52 29 21
2-4 2009 71 41 24 89 64 20
2-4 2010 74 25 1 77 21 0
5-5 2009
5-5 2010 59 40 11 10 87 52 20 0
24-3 2009
24-3 2010 62 42 11 32 50 80 71 25
24-3 2011 61 36 14 0 100 13 33 13
6-1 2009
6-1 2010
35-1 2010 33 31 7 0 65 38 10 13
35-1 2011 48 21 14 4 70 17 25 17
24-1 2010 63 28 10 2 63 36 0 14
24-1 2011 81 35 10 0 50 0 0 0
2-19a 2010 83 55 20 4 83 55 20 4
2-19a 2011 64 31 9 2 64 31 9 2
6-16 2011
a Sites 2-14 and 2-19 provided combined bird and bat searcher efficiency rates for each visibility
class, which are shown in Table 16.
It appears there are several factors that influence searcher efficiency rates. The habitat at each
turbine (i.e. proportions of each visibility class) can impact overall searcher efficiency. For
example, a site that is predominately Visibility Class 4 would be expected to have a lower
searcher efficiency rate than a site that is predominately Visibility Class 1. This may explain the
decrease in a site’s searcher efficiency rates from the first to second year, as vegetation
regenerates and visibility decreases. It appears that individual searcher efficiency is the most
influential factor in searcher efficiency rates. Ensuring search personnel are well trained and
experienced is the most effective method to obtaining quality searcher efficiency rates for more
accurate mortality estimates.

38
With few exceptions, all carcasses must be validated by the PGC before being used in searcher
efficiency trials, and only carcasses in fair or excellent condition are returned by the PGC for use
in trials. In order for this verification to occur, all carcasses are frozen. This precludes the
ability of the PGC to determine trends regarding fresh versus frozen carcasses and quality of the
carcass that may be influencing the searcher efficiency. However, it is imperative that the
identification of carcasses are correct thus the PGC does not allow for carcasses to be used for
searcher efficiency and/or carcass removal trials until they are validated by the PGC.
Carcass Removal Carcass removal trials were conducted at all sites to monitor for removal by scavengers.
Carcasses were placed in random locations throughout the search area in all vegetation classes,
but were not blind to the searchers. Carcasses were left in place for a minimum of 14 days and
monitored for scavenger removal. Because the carcasses were monitored for a minimum of 14
days, the data is right censored which was compensated for by estimating the mean time to
removal using a maximum likelihood estimator.
Carcass removal at all sites for bat carcasses averaged 12 days (4 - 34) and 13 days (4 – 48) for
bird carcasses (Table 17). Average time for scavenger removal at those sites that followed
protocol was 14 days for bat carcasses (6 – 34) and 13 days for bird carcasses (5 – 25). A list of
previously identified scavenger species can be found in the 2nd
summary report (Librandi
Mumma and Capouillez 2011).
Seven of the 12 sites that conducted scavenger removal trials documented carcasses persisting
longer the second year of monitoring compared to the first. Four sites experienced shorter
persistence times the second year of monitoring. One site has not yet completed a second year of
monitoring so no comparison can be made. It is unclear why some sites have higher scavenger
rates than others. Carcass removal can be influenced by over seeding trial carcasses. Smallwood
et al. 2010 noted that placing too many trial carcasses near wind turbines, which already supply
scavengers with carcasses, may cause scavengers to be unable to remove the trail carcasses. This
oversaturation results in inflated carcass removal times. Carcass removal times are most likely
influenced by relative populations of scavengers around these wind sites.
With few exceptions, all carcasses must be validated by the PGC before being used in carcass
removal trials, and only carcasses in fair or excellent condition are returned by the PGC for use
in trials. This precludes the ability to determine trends regarding fresh versus frozen carcasses
and quality of the carcass that may be influencing scavenger removal.
The PGC has been asked by Cooperators if the frequency of mortality monitoring can be reduced
to less than daily searches based on site specific carcass removal rates. The carcass removal
rates reported (Table 17) are averaged for the entire mortality monitoring season however
scavenger removal rates throughout the entire monitoring period are not consistent. Data from
sites that reported carcass removal by season revealed no trends; increased carcass removal
occurred randomly throughout the monitoring year. Additionally, of the 12 sites that have
conducted post-construction mortality monitoring and carcass removal trials, all have
documented some amount of carcasses removed during the first night of a trial. The majority of
the carcass removal trials completed in Pennsylvania were placed in groups, meaning batches of

39
carcasses are placed at one time, with several batches being placed throughout the monitoring
season. The PGC attempted to minimize oversaturation by limiting the number of carcasses
allowed to no more than 20 trial carcasses placed throughout the site during one time. However,
Smallwood et al (2010) demonstrated that by using less than 10 trial carcasses on the site at one
time, oversaturation was reduced and carcass removal rates increased. These results could imply
that the PGC may need to reduce the maximum number of carcasses placed at any given time in
the future. Although the PGC validates all carcasses before use in trials with few exceptions,
research conducted by Arnett (2005) found that fresh carcasses were removed almost twice as
fast as frozen carcasses at one study site. Hence, wind sites using frozen carcasses for trials may
be documenting longer carcass removal rates than is actually occurring with turbine mortality
carcasses. This idea further supports the PGC’s belief that search frequency intervals should not
be increased solely on the average carcass removal averages.
Table 17. Average scavenger removal rates for bats and birds at 12 Pennsylvania wind sites
conducted in 2007-2011.
Site
Code Year
PGC
protocols
followed?
Bat SR
average
(days)
Bird SR
average
(days)
6-3 2007 Yes 10 10
6-3 2008 Yes 13 13
2-2 2008 Yes 32 13
2-2 2009 Yes 23 5
2-14 2008 Noa 5 5
2-14 2009 Yes 9 17
2-10 2008 Noa 4 4
2-10 2010 Yes 8 6
6-1 2009 Yes 10 14
6-1 2010 Yes 6 6
5-5 2009 Nob 9 13
5-5 2010 Yes 15 16
2-4 2009 Yes 11 11
2-4 2010 Yes 34 25
24-3 2009 Nob 4 4
24-3 2010 Yes 10 7
24-3 2011 Yes 13 14
35-1 2010 Yes 9 9
35-1 2011 Yes 7 8
24-1 2010 Yes 10 10
24-1 2011 Yes 10 13
2-19 2010 Yes 23 25
2-19 2011 Yes 11 16
6-16 2011 Nob 6 48
a operational issues at site; less than 10 turbines searched
b various aspects of PGC protocols were not followed

40
Incidental Mortality Incidentals are defined as carcasses found outside scheduled search times and/or
designated search plots during. An incidental can be reported by anyone including maintenance
personnel at any turbine on the site, not just in the vicinity of a searched turbine. The species
and percentages of the birds and bats found during scheduled searches versus incidental finds are
similar (Tables 18 and 19), suggesting that the searched turbines are an accurate representation
of the wind site. However, there were slightly more tri-colored and little brown bats found as
incidentals than during standard searches. This is most likely attributed to one site (6-1) which
searched additional turbines for carcasses for use in searcher efficiency and carcass removal
trials. The seasonal distribution of incidental bat mortality follows a similar pattern to that of
standardized searches with a large majority of bat mortality between July 1 and September 30
(84%). The peak of bat mortality in August, accounting for 45% of the total incidental bat
mortality. While incidental trends appear similar to trends identified via standardized searches,
these trends should be interpreted with caution as incidental carcasses are not collected via
standardized protocols.
Table 18. Composition of bat carcasses identified through standard searches and found
incidentally from 2007-2011.
Bat Species
Standard
Searches
Incidental
Finds
Hoary 31% 32%
Eastern Red 28% 25%
Silver-haired 16% 13%
Tri-colored 8% 12%
Little Brown 8% 11%
Big Brown 6% 5%
Unknown 1% 1%
Northern long-eared <1% 0%
Seminole <1% <1%
Fifty-six different bird species have been found as incidental mortalities between 2007 and 2011.
Overall, birds of unknown species were the most frequently found (24%) followed by red-eyed
vireo (11%), blackpoll warbler (7%), ovenbird (6%), and rose-breasted grosbeak (6%). The
species composition is biased to one location due to a large mortality event in which 73% of all
incidental bird carcasses were found. Excluding the large mortality event, 39 bird species were
found as incidental mortalities with the most frequently observed species being red-eyed vireo
(14%), Unknown (14%), rose-breasted grosbeak (12%), and red-tailed hawk (7%). The red-
tailed hawks are large and relatively easy to see, making their incidental mortalities more likely
to be found by maintenance workers outside of the search areas and times compared smaller
birds.
Incidental mortality was documented during all months of mortality monitoring, from March
through November. Excluding data from the large mortality event, incidental bird mortality is
the highest in May (18% of total incidental mortality) and September (19% of total incidental
mortality), which corresponds to the spring and fall migration periods, while August had the least
accounting for 6% of the total incidental bird mortality. Species diversity among incidental

41
mortality varied throughout the months with the greatest diversity documented during the month
of May (16 species) and March and November documented the least (5 species each).
Table 19. Composition of bird mortality identified through standard searches versus incidentals,
those found outside standard search areas and times from 2007-2011.
Bird Order Standard Searches Incidental Finds
Passeriformes 73% 65%
Unknown 12% 24%
Galliformes 4% 4%
Accipitriformes* 3% 3%
Cuculiformes 2% 2%
Piciformes 2% 0%
Apodiformes 1% 1%
Columbiformes 1% <1%
Anseriformes 1% <1%
Charadriiformes 1% <1%
Gruiformes <1% <1% *sensu Chesser et al. 2010
Post-construction Raptor Migration Survey One goal of the Wind Energy Voluntary Cooperative Agreement is to determine if any
post-construction raptor migration observations can be correlated with mortality. Post-
construction raptor surveys were completed at eight wind sites between 2007 and 2011. There
were five spring raptor surveys and eight fall raptor surveys completed (Appendix H). Species
composition observed varied by site and season.
The presence of turbines does not appear to influence the overall number of raptors using the
ridge or the species composition. Two of the eight sites that conducted post-construction raptor
surveys also completed pre-construction raptor surveys (6-16 and 2-4). Site 6-16 observed less
raptors overall during post-construction surveys compared to pre-construction surveys for both
spring and fall. Species composition for site 6-16 was similar between pre and post-construction
with turkey vultures being the most prevalent species during spring surveys followed by black
vultures (Coragyps atratus) and red-tailed hawks; during the fall surveys turkey vultures were
again the most prevalent species followed by black vultures, then bald eagles. Site 2-4 also
documented similar species composition during both pre and post-construction surveys with
turkey vultures and red-tailed hawks being the most prevalent during spring surveys and turkey
vultures, red-tailed hawks, and broad-winged hawks being the most prevalent during fall
surveys. Site 2-4 documented similar overall raptor numbers between pre and post-construction
surveys.
Three high raptor risk wind sites found raptor mortality during standardized mortality monitoring
while conducting concurrent post-construction raptor surveys. One site (24-1) documented one
turkey vulture fatality during spring raptor surveys. Two sites documented raptor mortality
during fall raptor surveys; site 24-3 found two red-tailed hawks during standard mortality

42
monitoring and site 2-19 found one turkey vulture. Interestingly, the raptor species being killed
are not the most frequently observed species at each at these sites. Site 24-1 documented one
turkey vulture during spring raptor monitoring; the most prevalent species observed was red-
tailed hawk.
Pre- and post-construction raptor migration survey results have similar implications. First, the
PGC assigned raptor risk levels were not good indicators of the overall number of raptors
observed during migration surveys. For example, high raptor risk site 24-1 observed the least
number of migrating raptors during spring surveys. On the other hand, moderate raptor risk site
2-14 observed more raptors than several high raptor risk sites during fall surveys. Also similar to
pre-construction surveys, post-construction survey results cannon be correlated with raptor
fatality (r (8) = 0.24, p = 0.50). Site 24-1, which observed the fewest raptors during spring
surveys, documented raptor mortality. Conversely, site 6-16 observed high numbers of raptors,
yet did not document any raptor mortality.
Post-construction Bat Acoustic Surveys Another goal of the WEVCA is to determine if post-construction bat acoustic data can be
correlated with mortality. A total of six post-construction bat acoustic surveys have been
performed at Pennsylvania wind sites between 2007 and 2011. Results of the five post-
construction bat acoustic surveys between 2007 and 2009 are summarized in the 2nd
summary
report (Librandi Mumma and Capouillez 2011).
Of the six post-construction bat acoustic surveys performed between 2007 and 2011, two surveys
had issues with turbines not operating during the survey, one survey had issues with acoustic
detectors not operating, and two surveys did not survey the entire April 1 to November 15
season. Additionally, detectors were not all placed in the rotor swept zone or at the same height,
making comparisons between sites and mortality data challenging.
In 2010 one moderate bat risk site (5-5) conducted post-construction bat acoustics following
PGC protocols. This site was grandfathered into the Cooperative Agreement and thus was not
obligated to perform pre-construction bat acoustic surveys. Therefore, no comparison of bat
activity could be performed between pre and post-construction surveys. Because the exact time
of bat mortality is not known, and relative “freshness” of a carcass is subjective, it is difficult to
determine if any correlation exists between bat activity and mortality for each night. A Pearson
product-moment correlation coefficient was computed to assess the relationship between
biweekly bat activity observed and biweekly bat mortality for the site. There was a positive
correlation between bat mortality and bat activity at this site (r = 0.83, n = 15, p = <0.01), so as
overall bat activity increased so did bat mortality. A correlation between bat activity and
mortality by species was precluded because of a lack of species specific acoustic data. These
results should be taken with caution since the bat activity at this site was monitored at 10 meters,
well below the rotor swept zone where bat mortality occurs. However, these results are similar
to sites that did monitor bat activity closer to the rotor swept zone by having increased bat
activity during July, August, and September, which corresponds to when the majority of bat
mortality occurs throughout the state. The results from this site support targeting minimization
efforts between July 1 and September 30 to maximize the effectiveness.

43
Post-construction Radar Surveys Two post-construction radar surveys have been performed at Pennsylvania wind sites
between 2007 and 2011 and are summarized in the 2nd
summary report (Librandi Mumma and
Capouillez 2011). The Cooperative Agreement does not currently request radar surveys and no
additional radar surveys have been performed in Pennsylvania.
Post-construction Woodrat Surveys A multi-year woodrat study is being conducted at one Pennsylvania site by a Cooperator
to determine the potential effects of disturbing habitat in proximity to an active population area.
This site conducted pre-construction surveys to obtain baseline data and will be conducting
several years of post-construction surveys. The post-construction studies commenced in 2012
and will include trapping, telemetry, food availability, and predator presence. The purpose of
this study is to compare the pre- and post-construction results to identify whether wind turbine
construction and/or operation has any impacts on Allegheny woodrats.
Threatened and/or Endangered Species Mortality: Birds Five sites documented a total of 31 state endangered bird mortalities between 2007 and
2011, including: three state endangered bird mortalities in 2009 (two blackpoll warblers and
one yellow-bellied flycatcher), three in 2010 (three blackpoll warblers), and 25 in 2011 (24
blackpoll warblers and one yellow-bellied flycatcher). Four of the 31 state endangered bird
mortalities were documented during scheduled searches and 27 were incidentals, of which 24
were at the large mortality event (see Large Mortality Events section). All 31 of the state
endangered bird mortalities were determined to be migrants (i.e. not from the local breeding
population) by the PGC due to the lack of breeding habitat in the vicinity and the time of year
mortalities occurred. All of the blackpoll warbler fatalities occurred in September and October,
with the two yellow-bellied flycatcher fatalities found in August and September.
All five sites that documented state endangered bird mortality are currently working with the
PGC on mitigation. Upon notification of an endangered bird mortality the site is required to
provide an incident report that includes the species of the mortality, weather patterns during the
night prior to discovery, any special or critical habitat in the area of the project, and
documentation of Best Management Practices were implemented prior to the mortality. The
PGC does not currently have a standard mitigation method, however most sites opt for
compensatory mitigation for the protection of the state endangered species and their habitat.
Threatened and/or Endangered Species Mortality: Bats In 2011, one state and federally endangered Indiana bat was documented at Duke
Energy’s North Allegheny wind facility. A juvenile female bat was found by searchers on
September 26, 2011. Upon species confirmation by the PGC and USFWS, North Allegheny
wind site curtailed all night time operation of the turbines until November 15, 2011. No bat
mortality was reported while night time curtailment was implemented. Because Indiana bats are
federally listed species, the PGC defers to USFWS. Duke Energy is currently in consultation
with the USFWS and is developing a Habitat Conservation Plan as part of the process of
obtaining incidental take coverage.

44
Due to the Cooperative Agreement and particularly the Cooperators’ effort to avoid and
minimize potential impacts, the PGC has not filed any formal actions against any Cooperators
for any of the endangered bird or bat mortalities and are working with the Cooperators to
mitigate for these fatalities.
The PGC has been petitioned to list little brown, tri-colored, and northern long-eared bats in
Pennsylvania. The PGC requested public comments regarding the potential listing of these
species via the PA Bulletin. Based on comments received, the PGC decided on October 4, 2012
not to pursue listing of these species at this time, as it was determined that additional research is
needed. While Pennsylvania is not currently pursuing the listing of these three species, the
USFWS is undertaking a species review to determine if the eastern small-footed, little brown,
and northern long-eared bats warrant protection under the Endangered Species Act. In regards to
mortality of the above bat species at Pennsylvania wind energy facilities, no eastern small-footed
bat mortality has been documented, 8 of the 12 sites currently operating have documented tri-
colored bat mortality, one site has documented northern long-eared bat mortality, and all sites
have documented little brown bat mortality. In the event that these species are added as state or
federally listed species, further coordination with the PGC and USFWS will be required to
determine methods to further minimize mortality to these species.
Large Mortality Events There was one large mortality event in October 2011. It was the only large mortality
event documented between 2007 and 2011. On October 7, 2011 the PGC was notified of a
possible large mortality event at one wind site. This site had already completed two years of
monitoring and was not conducting mortality monitoring in 2011. The PGC visited the site on
October 7th
and 11th
and collected 258 bird and 2 bat carcasses. The PGC investigated the
incident and concluded the event was caused by lighting conditions at or near the turbine in
combination with a low cloud ceiling during peak bird migration. This conclusion was based on
the mortality occurring only at the turbine nearest to the lighted substation, as well as no other
large mortality events observed at any other wind facilities in the vicinity. At the time of the
mortality event, this particular site was not following the PGC’s endorsed Best Management
Practices pertaining to lighting;
Keep lighting at both operation and maintenance facilities and substations to the minimum
required.
a. Use lights with motion or heat sensors and switches to keep lights off when not required.
b. Lights should be hooded downward and directed to minimize horizontal and skyward
illumination.
The lighting at a nearby substation was lit with photovoltaic sodium vapor lights instead of being
on a switch or using motion or heat sensor lighting. Bird mortality caused by weather and
lighting is well documented. Mannville (2000) noted that low cloud ceilings can cause migrating
birds to fly at lower altitudes increasing the chance of collision with large structures.
Additionally, Gehring et al (2009) found that birds can become disoriented by steady burning
light refraction causing the birds to circle closer and closer to the light. Another large bird
mortality caused by all night lighting at a substation and inclement weather conditions was
documented during the same time of year at a facility in West Virginia (Steelhammer 2011).

45
However, unlike the mortality event in Pennsylvania, the bird deaths in West Virginia were
believed to be caused by exhaustion and collisions with the substation as opposed to the turbines.
The PGC concluded that the large mortality event that occurred in Pennsylvania could have been
greatly reduced, if not prevented, if the above Best Management Practices pertaining to lighting
had been fully implemented. The Cooperator is working with the PGC to mitigate for the
mortalities as well as ensure the BMP’s are implemented to prevent further mortality.
The bird species documented at the large mortality event are: 18% Unknown, 9% blackpoll
warbler, red-eyed vireo, and ovenbird (Seiurus aurocapilla), 8% rose-breasted grosbeak, 7%
gray catbird (Dumetella carolinensis), Swainson’s thrush (Catharus ustulatus), and unknown
thrush, 4% wood thrush (Hylocichla mustelina), 3% unknown warbler and yellow-billed cuckoo
(Coccyzus americanus), 2% gray-cheeked thrush (Catharus minimus), magnolia warbler, and
common yellowthroat (Geothlypis trichas), 1% bay-breasted warbler (Setophaga castanea),
black-throated blue warbler (Setophaga caerulescens), Tennessee warbler (Oreothlypis
peregrina), black-throated green warbler (Setophaga virens), chestnut-sided warbler (Setophaga
pensylvanica), indigo bunting (Passerina cyanea), and mourning warbler (Geothlypis
philadelphia), <1% Cape May warbler (Setophaga tigrina), common moorhen (Gallinula
chloropus), house wren (Triglodytes aedon), northern parula (Setophaga americana),
Philadelphia vireo (Vireo philadelphicus), scarlet tanager (Piranga olivacea), unknown duck,
and Wilson’s warbler (Cardellina pusilla).
The large percentage of unknown carcasses was due to the poor condition of the carcass upon
collection. Because this site was not conducting mortality monitoring no special use permit was
issued granting this Cooperator permission to collect the carcasses. The PGC was notified of the
large mortality event on a Friday before a long holiday weekend. Not all of the carcasses were
collected before the weekend, and due to construction surrounding the substation, many
carcasses were crushed by vehicle traffic over the long weekend.
The bat species documented include one little brown and one red bat. Bats do not appear to be
impacted as significantly as birds by lighting and inclement weather conditions. This could be
because bats rely on echolocation more than vision for navigation, which would eliminate the
lighting effects on the bats. Additionally, bats are generally not as active in poor weather. Voigt
et al (2011) noted that bats use more energy when flying in rainy conditions.
CORRELATION BETWEEN PRE-CONSTRUCTION BREEDING BIRD SURVEYS
AND POST-CONSTRUCTION MORTALITY
The PGC does not have sufficient data at this time to determine any relationship between
pre-construction breeding bird surveys and breeding bird mortality. For the 12 sites that the PGC
has mortality data on, ten sites were grandfathered into the Cooperative Agreement and thus did
not conduct breeding bird surveys, and two sites conducted breeding bird surveys but did not
adhere to the PGC’s protocols. The common issues with the breeding bird surveys included
surveying during different times and following different methods, resulting in data that cannot be
correlated with mortality. One site that conducted pre-construction breeding bird surveys
documented a state endangered species (migrant not breeding), but did not document any
mortality of this species. The second site, which conducted pre-construction breeding bird

46
surveys, documented a state endangered species (migrant not breeding) and documented this
species during mortality monitoring. A habitat survey was conducted at this site for the
endangered bird species in question and it was determined that because of a lack of suitable
breeding habitat and the time of year when the mortality occurred, the bird was a migrant. Two
sites conducted post-construction breeding bird surveys in 2012, which will allow comparison to
pre-construction breeding bird surveys to determine any effects of the turbines on breeding birds.
CAN MORTALITY BE PREDICTED?
The PGC does not yet have enough pre- and post-construction data to develop a mortality
prediction model to estimate the extent of bird or bat mortality. Most of the sites in operation
were grandfathered into the Cooperative Agreement and not required to conduct pre-construction
monitoring. Of the few sites that are operational and did conduct pre-construction monitoring,
deviations from standardized PGC protocols make comparisons nearly impossible.
Raptors Between 2007 and 2011 a total of 24 raptors were found during mortality monitoring, 11
during standardized searches and 13 as incidentals. Of the 12 sites that conducted post-
construction mortality monitoring, seven have completed pre-construction raptor surveys. There
does not appear to be any correlation between the total number of raptors observed during pre-
construction raptor surveys and raptor mortality (r (7) = 0.12, p = 0.75), nor is there a correlation
between raptors per hour observed during pre-construction surveys and raptor mortality (r (7) =
0.28, p = 0.45). Likewise, there does not appear to be any correlation between total number of
raptors observed during post-construction raptor surveys and mortality (r (8) = 0.24, p = 0.50)
nor between raptors per hour observed during post-construction raptor surveys and mortality (r
(8) = 0.01, p = 0.90). Based on data collected during raptor surveys from 2007 to 2011, there is
no indication that large numbers of migrating raptors will lead to large numbers of raptor
mortality. Additionally, the raptor mortality that has been documented was not limited to
migration periods, which indicates that residential raptors may be at risk in the vicinity of
operating turbines. Therefore, pre-construction and post-construction raptor migration surveys
do not appear to be good indicators of raptor mortality.
Birds Of the 12 sites that have conducted mortality monitoring between 2007 and 2011, only
three sites conducted pre-construction breeding bird surveys. One site conducted breeding bird
surveys before the protocols of the WEVCA were implemented, therefore the methods for this
survey did not follow PGC protocols. During pre-construction breeding bird surveys a total of
57 species were observed at this site. A total of 23 species of birds were documented during
mortality monitoring. Only nine species were observed during both pre-construction surveys and
mortality monitoring. Red-eyed vireos were the most prevalent species found during mortality
monitoring and were the second most abundant species observed during breeding bird surveys.
Both of the other sites conducted point counts following PGC protocols, however did not follow
protocols during area searches. During point counts these sites recorded 79 and 93 bird species
and documented 23 and 25 bird species during mortality monitoring. Red-eyed vireo fatalities
were the predominate species found during mortality searches at both sites. During breeding
bird surveys red-eyed vireos were the fourth and second most frequently observed species

47
respectively. At this time, the PGC does not have sufficient data to determine if pre-construction
breeding bird surveys can predict mortality. Based on the results of three sites, neither the
species composition nor the extent of mortality could be predicted based on pre-construction
breeding bird survey results. However, trends in bird mortality data throughout Pennsylvania
indicate the majority of bird mortality (76%) occurs during the months of April, May,
September, and October.
Bats The PGC does not have enough standardized pre-construction data or a model to predict
the extent of bat mortality at wind sites. However the data does show trends on when bat activity
is the greatest. Four pre-construction acoustic surveys that followed the PGC protocols and
deployed acoustic detectors above 40m showed that 69% of all bat activity occurred between
July 1 and September 30 (range 60% to 82%). The one post-construction acoustic survey
conducted in 2010 yielded similar results in which the majority of the acoustic bat calls recorded
occurred during the same time frame. This corresponds to the 24 post-construction mortality
surveys in which 79% of all bat mortality was found between July 1 and September 30. Based
on data collected between 2007 and 2011 the PGC cannot predict the extent of bat mortality for a
given site. However the PGC can predict that the majority of bat mortality will occur between
July 1 and September 30 and thus minimization efforts should be employed during this
timeframe to obtain the greatest effect.
WILDLIFE INCIDENT REPORTING SYSTEM
One of the Best Management Practices endorsed by the PGC is the implementation of a
Wildlife Incident Reporting System (WIRS) for each wind facility in Pennsylvania. The WIRS
is a plan for site employees to receive training in monitoring, response, and reporting of
wildlife injuries and fatalities after the completion of standard mortality monitoring. A WIRS
is not a substitute for standard mortality monitoring, but rather an organized reporting system for
incidental mortality. The WIRS provides additional data that can be used to determine trends in
mortality as well as document any important events, such as a threatened or endangered species
mortality or large mortality event. The importance of this reporting system is best demonstrated
by the large mortality event that occurred in 2011, after standard mortality monitoring
concluded. The PGC is currently working with all Cooperators that have active wind sites to
make sure they have a WIRS implemented prior to the completion of their 2 years of post-
construction mortality monitoring.
CONTRIBUTIONS TO OTHER WIND RELATED STUDIES
A total of 369 samples (100 tissues and 269 hair) were collected from 140 bat carcasses
found at Pennsylvania wind sites in 2010 and 2011. The samples were submitted to Eric Britzke
of United States Army Corps of Engineers, Engineer Research and Development Center,
Vicksburg, MS (who is working with Susan Loeb, Southern Research Station, United States
Forest Service, Clemson University, Clemson, SC and Maarten Vonhof, Department of
Biological Sciences, Western Michigan University, Kalamazoo, MI) or David Nelson of the
University of Maryland Center for Environmental Science Appalachian Laboratory for use in

48
various ongoing bat genetic studies. Since 2007, the PGC has submitted 1,478 (593 tissues and
885 hair) bat samples from wind energy facilities for research use.
SIGNIFICANT FINDINGS FROM COOPERATORS’ SURVEYS
Significant findings from Cooperators’ surveys conducted from 2007 to 2009 can be
found in the 2nd
summary report (Librandi Mumma and Capouillez 2011). The following
significant findings occurred in 2010 and 2011.
A total of nine confirmed Seminole bat fatalities were documented at Pennsylvania wind sites
between 2007 and 2011 at six different wind sites. All suspected Seminole bats were sampled
and sent for genetic analysis to confirm species identification. Three bats were confirmed in
2009, four were confirmed in 2010, and two were confirmed in 2011. These wind sites were
located throughout the state, which implies that Seminole bats are not limited to any one
portion of the state. These results may indicate that Seminole bats, while rare, inhabit
Pennsylvania more than previously believed. See the Post-Construction: Bats section for more
information.
In 2011 Pennsylvania experienced its first state and federally endangered Indiana bat mortality at
a wind facility. A juvenile female was discovered on September 26, 2011. This site was
previously ranked by the PGC as low risk to bats. The nearest known Indiana bat hibernaculum
is over 10 miles from this project. A radio telemetry study of 17 Indiana bats during fall
swarming showed that both male and female bats travel greater than 5 miles from the
hibernaculum during swarming. This event and radio telemetry results suggest an increased risk
to cave hibernating bats further than the five miles currently assessed under the Cooperative
Agreement, especially during the fall swarming period. See the Threatened and Endangered
Species Mortality section for additional information.
In 2011 Pennsylvania experienced its first large mortality event at a wind facility. The large
mortality event was believed to be caused by dusk to dawn lighting at a substation, within close
proximity to a turbine, in combination with inclement weather conditions. This mortality event
supports the PGC’s Endorsed Best Management Practices, which include lighting practices. It is
believed that implementing the lighting Best Management Practices could have greatly reduced
the bird mortality during this event. See the Large Mortality Events section for additional
information.
Data collected over the past five years has provided bat mortality patterns. The majority of all
bat mortality occurs between July 1 and September 30. These data show that the July 1 to
September 30 timeframe is consistent throughout Pennsylvania, not just regionally. This
finding is important because if adjustments to cut-in speeds are needed, this timeframe will
provide the greatest benefit to bats while minimizing costs to operators.

49
AVOIDANCE, MINIMIZATION, AND MITIGATION BY COOPERATORS
Avoidance efforts Since 2007, several proposed wind sites have been abandoned in Pennsylvania due to
potential wildlife impacts. Several more sites were abandoned with no specific reason given.
The PGC supports wind developers who recognize negative impacts to wildlife and do not
proceed with development of those areas. However, many of the sites abandoned by wind
developers for wildlife reasons are targeted by other wind developers who do not recognize the
potential negative impacts.
Minimization efforts In addition to the minimization efforts listed in the 2
nd summary report (Librandi Mumma
and Capouillez 2011) Cooperators have also used the following:
1. Minimizing impacts to core forested areas by utilizing pre-existing roadways and
infrastructure.
2. Elimination of planned turbines near known bat hibernacula and roost areas.
3. Implementing riparian buffers to protect sensitive habitats and travel corridors.
4. Following seasonal timbering restrictions to minimize direct impacts to bat species and
breeding birds.
5. Minimizing impacts by using pre-construction survey results to avoid and minimize impacts
to bat roosts and foraging areas.
Mitigation efforts Plans for monetary compensation to be used for protection of endangered species have
been proposed by developers who have documented endangered species mortality. The PGC is
working with these developers to determine what level of compensation is appropriate for these
mortalities and will use these funds to purchase and/or enhance habitat for endangered species.
RESEARCH
Research conducted between 2007 and 2009 are summarized in the 1st and 2
nd summary
reports (Capouillez and Librandi Mumma 2008, Librandi Mumma and Capouillez 2011). There
was one research project conducted since 2009.
Evaluating the effectiveness of an ultrasonic acoustic deterrent for reducing bat fatalities at
wind turbines (Arnett et al. 2011) – The goal of this project was to test the effectiveness of
ultrasonic acoustic deterrents for reducing bat mortality at wind turbines. The study occurred
at two Pennsylvania wind farms between 2009 and 2010. The study found that between 2 and
64% fewer bats were documented at turbines where acoustic deterrents were deployed than at
control sites with no acoustic deterrents. The researchers note several limitations such as
influences of humidity and malfunctioning acoustic units, which may have reduced the overall
effectiveness of the treatments. The results are encouraging and the researchers plan to use the
information gathered during this study to modify and improve the acoustic deterrent and conduct
further research in the near future.

50
Suggested research needs: There has been a tremendous amount of information regarding wind energy impacts on
wildlife presented since the Cooperative Agreement began in 2007, however there is still
research needed to better help avoid and minimize these impacts. Some research topics still
needed include:
1. Mitigation experiments – One curtailment study has been completed in Pennsylvania. The
results show that increased cut-in speeds reduce overall bat mortality. Future research needs
include curtailment at various sites to determine if this method is effective state-wide or if it
is site specific. Various cut-in speeds and time of year should also be tested so Cooperators
can optimize the protection to bats while minimizing the monetary costs.
2. Impacts to bat populations – Population estimates are needed to determine how much
mortality can be sustained. In the absence of a bat population estimates, some sort of index
is needed to determine trends.
OVERALL SUCCESSES/CHALLENGES
Successes 1. Avoidance or abandonment of high risk sites to avoid wildlife impacts.
2. Pro-active Cooperators are seeking PGC input earlier in their planning stages and for pre-
construction surveys. This early coordination helps developers make better decisions
regarding wind facility siting.
3. Cooperators are implementing the PGC approved Best Management Practices. These
practices are helping to further avoid and minimize potential negative impacts to wildlife.
4. Research on minimization efforts such as bat deterrents and curtailment shows promise to
reduce bat mortality at operational wind sites.
5. Pre- and post-construction data assists in avoiding and minimizing potential impacts, as well
as documenting the extent of impacts from operations. This data is used to assist with
determining methods to best minimize operational impacts to wildlife.
Challenges 1. Some wind developers with proposed and/or active sites in Pennsylvania have not yet signed
the Cooperative Agreement and are not following suggested PGC monitoring and
avoidance/minimization processes.
2. Some Cooperators are not updating the PGC on the status of projects, as in providing up-to-
date maps; this inhibits the PGC’s ability to provide a complete review of project. As a
proposed solution, the PGC encourages Cooperators to delineate larger initial project areas
rather than smaller ones to ensure that all potential wildlife impacts are identified early on in
the planning stages.
3. Protecting sites that were abandoned by responsible developers due to very high risk of
wildlife impacts from being developed by less concerned developers.
4. PGC staff observing at least one day/night of each survey conducted. Because of vacancies
in the PGC wind program and last minute survey coordination by developers, it has been
difficult to observe all surveys conducted. These visits give the consultant the opportunity to

51
ask questions and the PGC the opportunity to verify that the standardized protocols are being
adhered to.
5. Some Cooperators continue to submit survey work plans last minute. The work plans should
be submitted to the PGC at least one month prior to the start of the surveys. This enables the
PGC to review the work plan to ensure that it fulfills the purpose of the surveys.
6. Determining what is an acceptable level of bat mortality, taking into account all cumulative
effects on bat trends, which can sustain healthy resident and migratory bat populations.
7. Working with Cooperators to implement some level of voluntary curtailment. For sites that
documented high bat mortality, site specific data should be used to determine when to
increase cut in speeds to minimize the economic cost and risk to wildlife.
8. Develop methods to avoid and minimize bird mortality. Estimated bird mortality is much
lower than bats, however it appears that Passerines are the birds most at risk from wind
energy. Much research has been conducted on methods to avoid and minimize bat mortality,
however little has been done to determine methods for reducing bird mortality.
FUTURE
Since the implementation of the Cooperative Agreement, the PGC has garnered a vast
amount of information from pre-and post-construction surveys. A total of 45 sites have provided
data from either pre- and/or post-construction surveys. Information collected from these surveys
provides insight into which species are at risk from wind energy development and helps all
involved parties determine the best ways to avoid and minimize impacts to birds and mammals.
The PGC is committed to making sure all wind energy projects are employing feasible measures
to protect and minimize adverse impacts, to the Commonwealth’s bat and bird resources. The
Best Management Practices are employed at many sites to the maximum extent practicable and
are further reducing negative impacts to wildlife.
Because of the unprecedented decline in cave hibernating bats due to white nose syndrome
several bat species have been petitioned to be added to the federal and state endangered species
lists. If additional bat species get listed, Cooperators that continue to work with the PGC to
avoid and minimize impacts to bats will be better able to deal with new regulations than non-
Cooperators.
The PGC recognizes that each project is unique and remains committed to all Cooperators to
keep the Cooperative Agreement both flexible and adaptive. After five years of data collection
and the implications of white nose syndrome, the PGC recognizes that updates to the
Cooperative Agreement are necessary. Thus, a Cooperators meeting to discuss changes to
current surveys and standards will occur in 2013. At that time the PGC and Cooperators will
identify and discuss necessary changes. In addition, the PGC and Cooperators, at that meeting
will determine what if any, additional data analysis is needed and how best to complete the
additional data analysis.
The PGC’s Wind Energy Voluntary Cooperative Agreement was created to avoid, minimize and
mitigate for negative impacts of wind energy development on wildlife. Through the
collaborative efforts of the wind industry in Pennsylvania and the PGC, we continue to find ways

52
to meet these goals. The Cooperative Agreement has allowed Pennsylvania to become one of the
national leaders in determining and addressing wildlife impacts from wind energy development.
The Cooperators should be commended for their efforts and have set an example that all
industries should aspire to follow.

53
REFERENCES Arnett, E. B., C. D. Hein, M. R. Schirmacher, M. Baker, M. M. P. Huso, and J. M. Szewczak.
2011. Evaluating the effectiveness of an ultrasonic acoustic deterrent for reducing bat
fatalities at wind turbines. A final report submitted to the Bats and Wind Energy
Cooperative. Bat Conservation International. Austin, Texas, USA.
Arnett, E. B., technical editor. 2005. Relationships between bats and wind turbines in
Pennsylvania and West Virginia: an assessment of bat fatality search protocols, patterns
of fatality, and behavioral interactions with wind turbines. A final report submitted to the
Bats and Wind Energy Cooperative. Bat Conservation International. Austin, Texas,
USA.
Beech Ridge Energy LLC. 2012. Beech Ridge Wind Energy Project Habitat Conservation Plan
Greenbrier and Nicholas Counties, West Virginia. Prepared by Beech Ridge Energy
LLC, Chicago, Illinois. May 2012.
Brauning, D. 1992. Atlas of Breeding Birds of Pennsylvania, University of Pittsburgh Press,
Pittsburgh.
Capouillez, W. A. and T. M. Librandi Mumma. 2008. Pennsylvania Game Commission Wind
Energy Voluntary Cooperative Agreement First Summary Report. Pennsylvania Game
Commission. Harrisburg, Pennsylvania, USA. http://www.pgc.state.pa.us
Capouillez, W. A., D. Gross, G. Turner. 2007. Pennsylvania Game Commission Wind Energy
Voluntary Cooperative Agreement. Pennsylvania Game Commission. Harrisburg,
Pennsylvania, USA. http://www.pgc.state.pa.us
Chesser, R. T., R. C. Banks, F. K. Barker, C. Cicero, J. L. Dunn, A. W. Kratter, I. J. Lovette, P.
C. Rasmussen, J. V. Remsen, J. D. Rising, D. F. Stotz, K. Winker. 2010. Fifty-first
supplement to the American Ornithologists' Union Check-List of North American Birds.
Auk 127(3):726-744.
Dzal, Y., L. A. Hooton, E. L. Clare, and M. B. Fenton. 2009. Bat Activity and Genetic Diversity
at Long Point, Ontario, and Important Bird Stopover Site. Acta Chiropterologica.
11(2):307-315.
Erickson, W. P., J. Jeffrey, K. Kronner, and K. Bay. 2004. Stateline Wind Project Wildlife
Monitoring Final Report, July 1 – December 2003. Technical report peer-reviewed by
and submitted to FPL Energy, the Oregon Energy Siting Council, and the Stateline
Technical Advisory Committee.
Farmer, C. J., R. J. Bell, B. Drolet, L. J. Goodrich, E. Greenstone, D. Grove, D. J. T. Hussell, D.
Mizrahi, F. J. Nicoletti, and J. Sodergren. 2008. Trends in autumn counts of migratory
raptors in northeastern North America, 1974-2004. Pages 179-215 in K. L. Bildstein, J. P.
Smith, E. R. Inzunza, and R. R. Veit, editors. State of North America’s Birds of Prey.

54
Series in Ornithology, No. 3. Nuttall Ornithological Club and the American
Ornithologists’ Union. Cadmus Communications, Lancaster, Pennsylvania, USA.
Gehring, J., P. Kerlinger and A. M. Manville II. 2009. Communications towers, lights, and
birds: successful methods of reducing the frequency of avian collisions. Ecological
Applications. 19(2):505-514.
Gross, D. A. 2010 Bald Eagle Breeding and Wintering Surveys. Annual Job Report (2010).
Pennsylvania Game Commission. Harrisburg, Pennsylvania, USA.
Hawk Migration Association of North America. 2012. HMANA homepage.
<http://www.hmana.org>. Accessed 10 Aug 2012.
Katzner, T., Brandes, D., Lanzone, M., Miller, T., and D. Ombalski. 2008. Raptors and wind
energy development in the central Appalachians: where we stand on the issue. National
Aviary. Version 2.0. Pittsburgh, Pennsylvania, USA.
Librandi Mumma, T.M. and W. A. Capouillez. 2011. Pennsylvania Game Commission Wind
Energy Voluntary Cooperative Agreement Second Summary Report. Pennsylvania
Game Commission. Harrisburg, Pennsylvania, USA. http://www.pgc.state.pa.us
Mahan, C. G., M. A. Steele, M. J. Patrick, and G. L. Kirkland. 1999. The Status of the Northern
Flying Squirrel (Glaucomys sabrinus) in Pennsylvania. J. Pennsylvania Academy
Science 73(1):15-21.
Mahan, C. G., J. Bishop, M. A. Steele, G. G. Turner, and W. Myers. 2010. Habitat
Characteristics and Revised Gap Landscape Analysis for the Northern Flying Squirrel
(Glaucomys sabrinus), a state endangered species in Pennsylvania. Unpublished Report
to the Pennsylvania Game Commission, State Wildlife Grants Program. American
Midland Naturalist: 164(2):283-295.
McGuire, L. P., C. G. Guglielmo, S. A. Mackenzie, and P. D. Taylor. 2012. Migratory stopover
in the long-distance migrant silver-haired bat, Lasionycteris noctivagans. The Journal of
Animal Ecology. 81:377-385.
Pennsylvania Game Commission. 2008. Allegheny woodrat (Neotoma magister): the
environmental review process for Pennsylvania. Pennsylvania Game Commission.
Harrisburg, Pennsylvania, USA.
Pennsylvania Game Commission, Pennsylvania Fish and Boat Commission. 2005.
Pennsylvania’s Wildlife Action Plan. Harrisburg, Pennsylvania, USA.
Smallwood, K.S., Bell, D.A., Snyder, S.A., and Didonato, J.E. 2010. Novel scavenger removal
trials increase wind turbine-caused avian fatality estimates. The Journal of Wildlife
Management. 74:1089-1096.

55
Steelhammer, R. “Hundreds of Migrating Birds Die at Laurel Mountain Wind Farm.” West
Virginia Gazette [Charleston] 29 Oct. 2011. Print.
Turner, G. G., Reeder, D. M., and J. T. H. Coleman. 2011. A Five-year Assessment of Mortality
and Geographic Spread of White-Nose Syndrome in North American Bats, with a Look
at the Future. Update of White-Nose Syndrome in bats. Bat Research News, 52:13-27.
Voigt, C.C., K. Schneeberger, S.L. Voigt-Heucke, and D. Leanzik. 2011. Rain increases the
energy cost of bat flight. Biol. Lett., published ahead of print May 4, 2011.
Williams, L., et al., editors. 2005. Pennsylvania Comprehensive Wildlife Conservation Strategy.
Pennsylvania Game Commission and Pennsylvania Fish and Boat Commission. Version
1.0. Harrisburg, Pennsylvania, USA.

56
APPENDICES

57
APPENDIX A: Summary of pre-construction fall raptor migration surveys done at Pennsylvania wind sites, 2004 – 2011.
Raptor species are designated by AMKE=American kestrel, BAEA=Bald eagle, BLVU=Black vulture, BWHA=Broad-winged
hawk, COHA=Cooper’s hawk, GOEA=Golden eagle, MERL=Merlin, NOGO=Northern Goshawk, NOHA=Northern harrier,
OSPR=Osprey, PEFA=Peregrine falcon, RSHA=Red-shouldered hawk, RTHA=Red-tailed hawk, RLHA=Rough-legged hawk,
SSHA=Sharp-shinned hawk, TUVU=Turkey vulture, and UNRA=Unidentified raptor.
Wind Site
Raptor
Risk Year Dates
#
days
Avg.
hrs/
day
Total
observation
hours
Raptors/
hr
Total #
raptor
spp
Total #
raptors
observed
2-2 L 2004 10/7-11/15 37 7 251 4.0 13 997
3-2 H 2005 10/09-12/14 54 6 348 2.3 12 792
6-1 & 6-3 L 2006 9/1-11/15 62 7 445 4.6 16 2058
2-1 L 2006 9/14-10/13 10 6 60 10.4 10 622
2-7 L 2006 9/1-11/15 33 7 245 2.3 13 552
2-15 L 2006 10/25-12/1 34 7 253 1.3 8 322
5-6 M 2006 9/15-11/14 28 7 206 3.0 14 616
3-4 H 2007 8/25-12/14 67 8 507 4.0 15 2014
24-2 H 2007 8/24-12/14 67 7 478 2.8 14 1332
2-18 H 2007 8/26-12/14 76 8 586 2.1 16 1207
35-1 L 2007 9/13-9/19 2 8 16 6.3 12 101
3-6 L 2007 9/17-12/16 14 8 109 1.4 10 147
5-15 L 2007 9/16-12/17 5 8 40 3.6 10 144
2-4 & 2-5 M 2007 9/10-12/18 51 6 310 1.4 15 419
4-3 M 2007 8/24-12/14 74 8 584 0.9 13 514
6-11 H 2008 8/15-12/15 76 8 598 6.6 16 3940
6-12 H 2008 8/15-12/15 76 8 1170 2.8 16 3268
5-14 L 2008 9/23-12/14 5 8 41 3.3 11 137
5-8 L 2008 9/7-10/31 9 4 36 2.4 5 86
2-25 L 2008 9/16-12/15 10 8 80 2.6 9 209
5-18 L 2008 10/15 - 11/7 5 6 32 1.9 7 61
6-10 M 2008 9/3-11/24 28 6 158 1.7 12 276
6-16 H 2009 8/18-12/15 77 8 647 10.4 14 6733
2-24 L 2009 8/31-10/22 10 8 80 2.8 11 220
6-10 M 2009 8/19-12/15 81 8 617 2.2 16 1367
2-9 M 2009 8/15-12/15 77 8 623 0.3 7 167
3-17 H 2011 8/15 - 12/15 79 8 631 2.6 15 1618
6-22 M 2011 8/15-12/15 75 7 1068 3.6 15 3839
Total 33758

58
APPENDIX A (continued): Summary of percent in flight for pre-construction fall raptor migration surveys done at Pennsylvania
wind sites, 2004 – 2011t. Raptor species are designated by AMKE=American kestrel, BAEA=Bald eagle, BLVU=Black vulture,
BWHA=Broad-winged hawk, COHA=Cooper’s hawk, GOEA=Golden eagle, MERL=Merlin, NOGO=Northern Goshawk,
NOHA=Northern harrier, OSPR=Osprey, PEFA=Peregrine falcon, RSHA=Red-shouldered hawk, RTHA=Red-tailed hawk,
RLHA=Rough-legged hawk, SSHA=Sharp-shinned hawk, TUVU=Turkey vulture, and UNRA=Unidentified raptor.
Percent in Flight
Wind
Site AM
KE
BA
EA
a
BL
VU
BW
HA
b
CO
HA
GO
EA
c
ME
RL
NO
GO
d
NO
HA
e
OS
PR
f
PE
FA
g
RS
HA
h
RT
HA
RL
HA
SS
HA
i
TU
VU
UN
RA
2-2 1.6 0.4 2.3 0.0 4.3 0.5 0.0 0.3 8.4 0.5 0.0 1.3 41.3 0.5 5.4 32.2 0.9
3-2 0.0 1.1 0.0 0.0 1.3 6.6 0.0 0.1 0.8 0.3 0.6 0.6 33.8 2.8 1.1 43.7 7.2
6-1 & 6-3 1.4 0.9 5.9 20.4 1.5 0.0 1.4 0.1 2.7 0.8 0.5 1.7 21.0 0.1 4.9 30.4 6.2
2-1 1.4 0.5 0.0 56.3 0.5 0.0 0.0 0.0 2.3 1.0 0.0 0.3 5.0 0.0 7.1 24.6 1.1
2-7 0.4 0.4 3.4 9.8 2.4 0.4 0.4 0.0 0.7 1.6 0.2 0.0 11.8 0.0 4.2 59.6 4.9
2-15 0.9 0.0 0.0 0.0 5.3 0.3 0.6 0.3 8.1 0.0 0.3 1.6 68.0 0.0 6.2 8.4 0.0
5-6 2.3 3.1 0.0 6.8 3.9 0.3 3.9 0.0 0.6 2.3 1.5 0.5 20.9 0.8 29.2 21.9 1.9
3-4 0.6 2.1 0.8 23.2 2.3 3.6 0.2 0.0 1.9 1.9 0.0 0.6 23.1 0.1 18.5 20.0 1.0
24-2 0.4 1.4 0.0 17.9 2.2 3.0 0.2 0.1 1.1 1.7 0.0 0.4 33.1 0.2 16.6 19.8 2.0
2-18 0.7 0.7 0.2 18.4 4.0 3.5 0.2 0.2 1.2 1.0 0.2 1.9 38.8 0.3 16.9 10.0 1.7
35-1 5.0 4.0 0.0 29.7 5.9 1.0 3.0 0.0 2.0 2.0 0.0 1.0 7.9 0.0 10.9 26.7 1.0
3-6 0.0 0.7 0.0 53.1 2.0 2.0 0.0 0.7 1.4 0.0 0.0 1.4 21.1 0.0 2.0 14.3 1.4
5-15 0.7 0.0 0.0 41.7 4.2 0.0 1.4 2.8 1.4 1.4 0.0 1.4 26.4 0.0 0.0 11.8 6.9
2-4 & 2-5 7.2 1.0 0.0 11.5 1.0 1.0 1.4 1.0 10.0 0.2 0.2 1.4 15.8 0.5 5.0 34.1 8.8
4-3 1.2 0.8 11.7 19.1 1.4 1.0 0.0 0.0 0.6 1.0 0.0 0.2 14.0 0.2 8.8 38.3 1.9
6-11 1.1 6.3 7.3 16.6 1.8 0.9 0.3 0.3 1.5 2.3 0.6 1.3 21.0 0.1 14.0 23.3 1.4
6-12 1.4 1.4 6.2 27.0 2.0 0.7 0.3 0.1 0.9 1.6 0.2 0.7 17.1 0.0 21.0 18.8 0.6
5-14 1.5 0.0 0.0 4.4 16.8 1.5 0.0 1.5 2.2 0.7 0.0 0.7 29.2 0.0 9.5 14.6 17.5
5-8 0.0 0.0 0.0 7.0 0.0 0.0 0.0 0.0 0.0 0.0 0.0 1.2 25.6 0.0 4.7 45.3 16.3
2-25 0.5 0.0 6.2 6.7 5.3 0.0 0.0 0.0 1.0 0.0 0.0 0.5 18.2 0.0 1.4 34.9 23.9
3-18 0.0 1.6 0.0 0.0 1.6 0.0 0.0 0.0 19.7 0.0 1.6 0.0 59.0 1.6 0.0 6.6 8.2
6-10 6.5 1.8 5.1 36.6 7.6 0.0 0.4 0.0 5.8 4.3 0.0 1.8 10.9 0.0 11.2 8.0 0.0
6-16 1.1 8.3 18.0 0.6 0.3 0.0 0.2 0.0 0.1 0.4 0.1 0.1 1.5 0.0 0.0 69.1 0.3
2-24 15.9 1.4 3.2 6.8 2.3 0.5 0.9 0.0 3.6 0.0 0.0 0.0 7.3 0.0 5.5 45.5 7.3
6-10 3.1 1.7 3.1 8.6 2.9 0.7 0.1 0.5 1.7 1.6 0.0 2.5 27.9 0.0 13.8 30.4 1.3
2-9 0.0 0.0 0.0 4.8 1.8 0.0 0.0 0.0 2.4 0.6 0.0 0.0 24.6 0.0 9.0 55.7 1.2
3-17 1.2 0.8 0.1 51.8 1.7 0.0 0.1 0.1 0.7 1.1 0.2 0.9 20.3 0.0 6.4 8.3 3.6
6-22 2.4 1.8 4.2 32.9 2.4 0.2 0.4 0.0 0.4 1.7 0.0 0.2 13.0 0.0 15.2 25.1 0.1
Total 1.5 3.3 6.5 17.9 2.0 1.0 0.4 0.1 1.5 1.3 0.2 0.8 18.0 0.2 10.4 33.1 1.9
a Pennsylvania threatened; Pennsylvania Wildlife Action Plan high level concern; b Pennsylvania Wildlife Action Plan maintenance concern; c
Pennsylvania Wildlife Action Plan PA vulnerable; d Pennsylvania Wildlife Action Plan PA vulnerable; e Pennsylvania threatened; f Pennsylvania
threatened; Pennsylvania Wildlife Action Plan Pennsylvania vulnerable; g Pennsylvania endangered; Pennsylvania Wildlife Action Plan high level
concern; h Pennsylvania Wildlife Action Plan maintenance concern; i Pennsylvania Wildlife Action Plan maintenance concern.

59
APPENDIX B: Summary of pre-construction spring raptor migration surveys done at Pennsylvania wind sites, 2006 – 2011.
Raptor species are designated by AMKE=American kestrel, BAEA=Bald eagle, BLVU=Black vulture, BWHA=Broad-
winged hawk, COHA=Cooper’s hawk, GOEA=Golden eagle, MERL=Merlin, NOGO=Northern Goshawk, NOHA=Northern
harrier, OSPR=Osprey, PEFA=Peregrine falcon, RSHA=Red-shouldered hawk, RTHA=Red-tailed hawk, RLHA=Rough-
legged hawk, SSHA=Sharp-shinned hawk, TUVU=Turkey vulture, and UNRA=Unidentified raptor.
Wind
Site Risk Year Dates Days
Avg.
hrs/
day
Total
hrs
Raptors/
hr
Total No.
raptor spp
Total No.
raptors
3-2 H 2006 2/25-3-31 34 7.5 254 0.9 12 223
6-1 & 6-3 L 2006 4/20-5/31 37 8.0 295 1.0 12 289
2-7 L 2006 4/3-5/29 28 7.0 197 2.7 10 523
2-1 L 2006 4/6-5/10 7 5.7 40 4.9 10 196
24-2 H 2007 3/1-4/6 32 7.3 232 1.6 14 372
2-18 H 2007 4/24-5/3 8 8.6 69 2.3 9 161
3-4 H 2007 3/2-4/6 30 7.7 230 1.1 10 247
4-3 M 2007 2/27-4/6 34 6.8 230 5.6 14 1292
2-19 H 2007 3/10-4/13 25 7.1 177 5.0 13 894
35-1 L 2007 4/3-4/23 2 6.5 13 3.3 8 43
6-12 H 2008 3/5-4/25 38 10.5 398 0.6 15 246
6-11 H 2008 3/1-4/25 42 7.2 301 1.8 13 550
2-18 H 2008 3/4-4/25 38 7.8 295 1.3 14 388
5-18 M 2008 3/3-5/29 16 6.3 100 1.8 9 177
2-4 & 2-5 M 2008 3/11-3/31 15 7.6 114 0.9 10 101
3-6 L 2008 3/10-3/29 6 7.7 46 1.6 5 74
6-16 H 2009 3/3-4/1 22 7.9 174 5.8 12 1006
2-24 L 2010 3/17-5/5 10 8.0 80 3.1 10 248
Total 7030
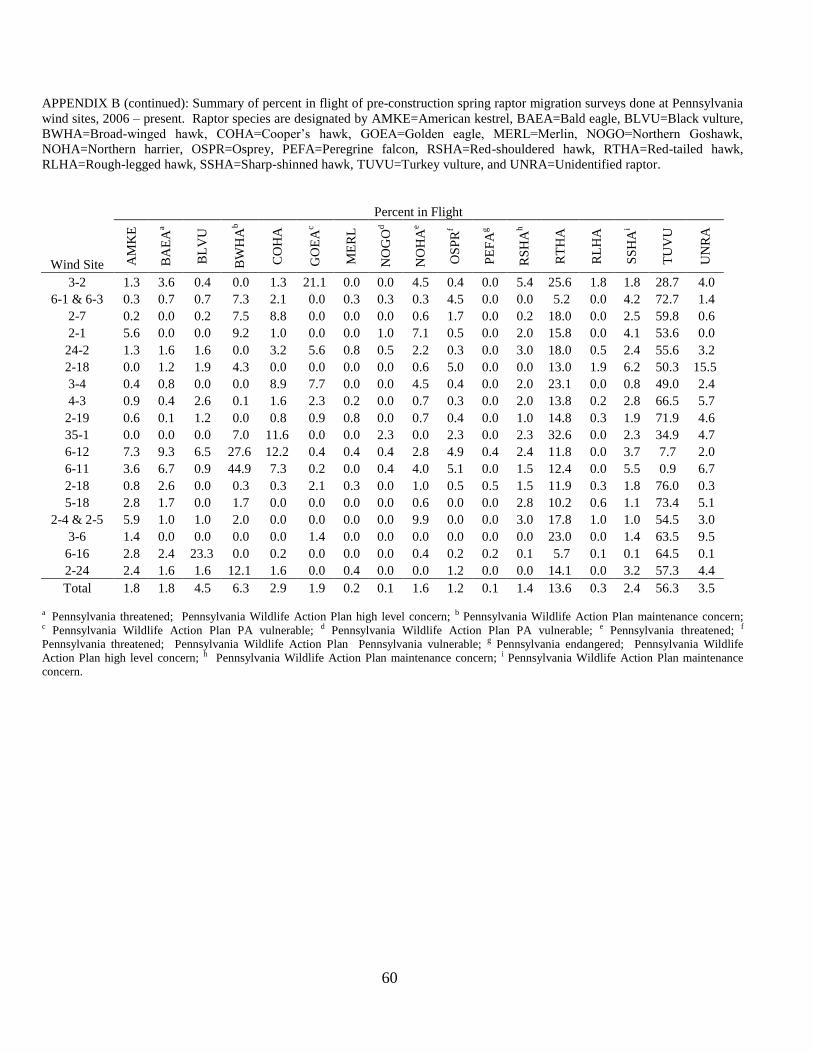
60
APPENDIX B (continued): Summary of percent in flight of pre-construction spring raptor migration surveys done at Pennsylvania
wind sites, 2006 – present. Raptor species are designated by AMKE=American kestrel, BAEA=Bald eagle, BLVU=Black vulture,
BWHA=Broad-winged hawk, COHA=Cooper’s hawk, GOEA=Golden eagle, MERL=Merlin, NOGO=Northern Goshawk,
NOHA=Northern harrier, OSPR=Osprey, PEFA=Peregrine falcon, RSHA=Red-shouldered hawk, RTHA=Red-tailed hawk,
RLHA=Rough-legged hawk, SSHA=Sharp-shinned hawk, TUVU=Turkey vulture, and UNRA=Unidentified raptor.
Percent in Flight
Wind Site AM
KE
BA
EA
a
BL
VU
BW
HA
b
CO
HA
GO
EA
c
ME
RL
NO
GO
d
NO
HA
e
OS
PR
f
PE
FA
g
RS
HA
h
RT
HA
RL
HA
SS
HA
i
TU
VU
UN
RA
3-2 1.3 3.6 0.4 0.0 1.3 21.1 0.0 0.0 4.5 0.4 0.0 5.4 25.6 1.8 1.8 28.7 4.0
6-1 & 6-3 0.3 0.7 0.7 7.3 2.1 0.0 0.3 0.3 0.3 4.5 0.0 0.0 5.2 0.0 4.2 72.7 1.4
2-7 0.2 0.0 0.2 7.5 8.8 0.0 0.0 0.0 0.6 1.7 0.0 0.2 18.0 0.0 2.5 59.8 0.6
2-1 5.6 0.0 0.0 9.2 1.0 0.0 0.0 1.0 7.1 0.5 0.0 2.0 15.8 0.0 4.1 53.6 0.0
24-2 1.3 1.6 1.6 0.0 3.2 5.6 0.8 0.5 2.2 0.3 0.0 3.0 18.0 0.5 2.4 55.6 3.2
2-18 0.0 1.2 1.9 4.3 0.0 0.0 0.0 0.0 0.6 5.0 0.0 0.0 13.0 1.9 6.2 50.3 15.5
3-4 0.4 0.8 0.0 0.0 8.9 7.7 0.0 0.0 4.5 0.4 0.0 2.0 23.1 0.0 0.8 49.0 2.4
4-3 0.9 0.4 2.6 0.1 1.6 2.3 0.2 0.0 0.7 0.3 0.0 2.0 13.8 0.2 2.8 66.5 5.7
2-19 0.6 0.1 1.2 0.0 0.8 0.9 0.8 0.0 0.7 0.4 0.0 1.0 14.8 0.3 1.9 71.9 4.6
35-1 0.0 0.0 0.0 7.0 11.6 0.0 0.0 2.3 0.0 2.3 0.0 2.3 32.6 0.0 2.3 34.9 4.7
6-12 7.3 9.3 6.5 27.6 12.2 0.4 0.4 0.4 2.8 4.9 0.4 2.4 11.8 0.0 3.7 7.7 2.0
6-11 3.6 6.7 0.9 44.9 7.3 0.2 0.0 0.4 4.0 5.1 0.0 1.5 12.4 0.0 5.5 0.9 6.7
2-18 0.8 2.6 0.0 0.3 0.3 2.1 0.3 0.0 1.0 0.5 0.5 1.5 11.9 0.3 1.8 76.0 0.3
5-18 2.8 1.7 0.0 1.7 0.0 0.0 0.0 0.0 0.6 0.0 0.0 2.8 10.2 0.6 1.1 73.4 5.1
2-4 & 2-5 5.9 1.0 1.0 2.0 0.0 0.0 0.0 0.0 9.9 0.0 0.0 3.0 17.8 1.0 1.0 54.5 3.0
3-6 1.4 0.0 0.0 0.0 0.0 1.4 0.0 0.0 0.0 0.0 0.0 0.0 23.0 0.0 1.4 63.5 9.5
6-16 2.8 2.4 23.3 0.0 0.2 0.0 0.0 0.0 0.4 0.2 0.2 0.1 5.7 0.1 0.1 64.5 0.1
2-24 2.4 1.6 1.6 12.1 1.6 0.0 0.4 0.0 0.0 1.2 0.0 0.0 14.1 0.0 3.2 57.3 4.4
Total 1.8 1.8 4.5 6.3 2.9 1.9 0.2 0.1 1.6 1.2 0.1 1.4 13.6 0.3 2.4 56.3 3.5
a Pennsylvania threatened; Pennsylvania Wildlife Action Plan high level concern; b Pennsylvania Wildlife Action Plan maintenance concern; c Pennsylvania Wildlife Action Plan PA vulnerable; d Pennsylvania Wildlife Action Plan PA vulnerable; e Pennsylvania threatened; f
Pennsylvania threatened; Pennsylvania Wildlife Action Plan Pennsylvania vulnerable; g Pennsylvania endangered; Pennsylvania Wildlife
Action Plan high level concern; h Pennsylvania Wildlife Action Plan maintenance concern; i Pennsylvania Wildlife Action Plan maintenance
concern.

61
APPENDIX C: Summary of breeding bird surveys done pre-construction at proposed wind sites in Pennsylvania, 2006 – 2011. “Not in report” designation means the
information was not specifically provided in the survey report but does not mean that particular information was not collected.
Wind Site
Survey
Year
Point Count
Dates
No. Point
Counts
Area Search
Dates
No. Area
Searches Comments
Total No.
Species
No. PA Endangered
Species
No. PA Threatened
Species
No. PA WAP
Species
Total No. Individual
Records Habitat
2-1a 2006
June 1-2;
8-9 16 not in report
not in
report
Point counts not conducted in May and the survey did not
adequately cover the project
area 38 0 0 9 348
forest interior/
grassland/
successional
2-19b 2006 N/A N/A May 2 - July 6 2
Point counts and area searches
did not adequately cover the project area; survey conducted
off project area 73 0 0 16
not in
report
grassland/
forest edge
2-4 & 2-5 2007
May 23-24; June
6-7; 13-
14 20
May 23-24;
June 6-7; 13-
14 14
Area searches not conducted in
mid-March to April period 81 1 0 19 910
grassland/
forest
3-4 2007
May 8-9;
June 5-8 42 not in report
not in
report
Second round of point counts
not conducted in June 86 0 0 15 5876
forest-interior/
forest edge
35-1 2007
May 23-24; June
5-6; 19-
22 34
May 23-24;
June 5-6; 19-
22 13
Area searches not conducted in
mid-March to April period 97 1 0 20 1346
field/ forest edge/ riparian/
wetland/ mixed
forest
24-2 2007
May 10-
11 28 not in report
not in
report
Two rounds of point counts not
conducted in June 106 0 0 23 3567
grassland/
forest-interior/
forest edge
2-18c 2007
May 31; June 7;
18-19 N/A N/A N/A
Neither point counts or area searches conducted; transects
walked 69 1 0 16
not in
report
Forest-interior/
forest edge
2-7 2007
May 22-
23; June 27-30 28 April 23-24
not in report
Area searches not conducted in
May or June nor were second
round of point counts in June 1 - July 10 95 1 1 20 1630
forest-interior/
forest edge/grassland
2-15 2007
May 19;
June 17-
18 18
April 17-27;
May 19; June
17-18
not in
report
Area searches not conducted in May or June nor were second
round of point counts in June 1
- July 10 97 1 1 18 2691
grassland/
forest-interior/
forest edge
4-3 2007
May 20-21; June
19-22 28 April 21-22
not in
report
Area searches not conducted in
May or June nor were second round of point counts in June 1
- July 10 91 1 1 20 3099
forest-interior/
forest edge

62
APPENDIX C (continued): Summary of breeding bird surveys done pre-construction at proposed wind sites in Pennsylvania, 2006 - present. “Not in report” designation
means the information was not specifically provided in the survey report but does not mean that information was not collected.
Wind
Site
Survey
Year
Point Count
Dates
No. Point
Counts
Area Search
Dates
No. Area
Searches Comments
Total No.
Species
No. PA Endangered
Species
No. PA Threatened
Species
No. PA WAP
Species
Total No. Individual
Records Habitat
5-15 2008
May 31; June 19;
June 27 10 N/A N/A 26 0 0 4 190
reclaimed mine/
forest
5-18 2007
June 9-11; June 29-
30; July 3-
4 33 N/A N/A May point counts not conducted 58 0 0 5 1986
forest-interior/
forest edge
5-14 2008
May 28-
30; June
17-18; June 25-
26 31
May 28; June
18; June 26 1 42 0 0 4
not in
report
reclaimed mine/
forest
3-6 2008
May 20-
21; June 10 & 13;
June 24-
25 28
May 20-21;
June 10 & 13;
June 24-25 13
No area searches conducted
during the mid-March to April
period 82 0 0 16
980 (p.c.
only)
forested/
agriculture
2-25 2008
May 28-
29; June 6-9; June
26-28 30
June 7-8; June
27-28 6
No area searches conducted during the mid-March to April
and May period 74 0 0 9 1437
forested/
agriculture
2-25 2009
June 16-
19; June
25-28 36 N/A N/A
Second year of survey conducted to survey new project
areas. May point counts not
conducted 51 0 0 8 679
forested/
agriculture
4-3 2009
May 21;
June 4; June 18 11
Apr 16; May
21; June 4; June 18 2
Second year of survey
conducted to adequately cover the project area. 90 1 1 20 494
forest-interior/ forest edge
6-12 2009
May 27-
30; June
11-14; June 23-
26 56
May 27-30; June 11-14;
June 23-26
not in
report
No area searches conducted during the Mid-March to April
Period 35 0 0 5 1578
forest - interior/
forest edge
2-9 2009
May 27;
June 3;
June 10 3 N/A N/A 40 0 0 7 239 forested
13-1 2009
May 18-
20; June
1-3, 5; June 15-
17, 19 47
April 14-15,
17; May 18-20; June 1-3, 5;
June 15-17, 19 9 107 1 0 25 2735
field/ forest edge/
riparian/ mixed forest/ reclaimed
mine

63
APPENDIX C (continued): Summary of breeding bird surveys done pre-construction at proposed wind sites in Pennsylvania, 2006 - present. “Not in report” designation
means the information was not specifically provided in the survey report but does not mean that particular information was not collected.
Wind Site
Survey
Year
Point Count
Dates
No. Point
Counts
Area Search
Dates
No. Area
Searches Comments
Total No.
Species
No. PA Endangered
Species
No. PA Threatened
Species
No. PA WAP
Species
Total No. Individual
Records Habitat
2-5 2009 N/A N/A
April 30;
March 28;
June 7 3
Area searches conducted
only in new locations. Searches conducted in one
of each of the three survey
periods 24 0 0 4 48 forested
6-10 2009
May 28-
31; June 9-11; June
23-25 115 N/A N/A 70 2 0 13 2761 reclaimed mine/ forest
2-24 2010
May 14-
16; June 8-11;
June 20-
22 58
April 30;
May 21;
June 23 2 89 0 1 19 1938
mixed
forest/agriculture/reclaimed
grassy/shrub
2-36 2010
May 18-
21; June
2-5; June 17-
19 38 N/A N/A 84 0 1 20 1727
agriculture/forest
edge/reclaimed mine
3-18 2010
May 14-31; June
1-10;
June 15-23 181
April 27;
May 20; June 17-23 5 117 2 1 26 2815
deciduous forest/
coniferous forest/ agriculture
3-18 2011
May 11-
20; June 6-11; June
20-25 59
April 28; May 18; June 10-
23 2
Second year of surveys completed to survey new
project areas. 103 0 1 24 3820
deciduous forest/agriculture/
pasture/reclaimed mine
3-17 2011
May 7-21;
June 1-9;
June17-25 100
April 27-28:
May 22-23;
June 13-14 6 96 1 0 23 5220
mixed forest/field/edge/
riparian
2-27 2010
May 22-
25;
June 6-10; June 20-
23 48 N/A N/A 83 0 0 22 1905
forested/wetlands/
reclaimed mine
2-27 2011 N/A N/A
April 25-26;
May 24-25;
June 11-12 6
Second year of surveys
completed to survey new
project areas. 78 0 0 15 721
forested/wetlands/
reclaimed mine
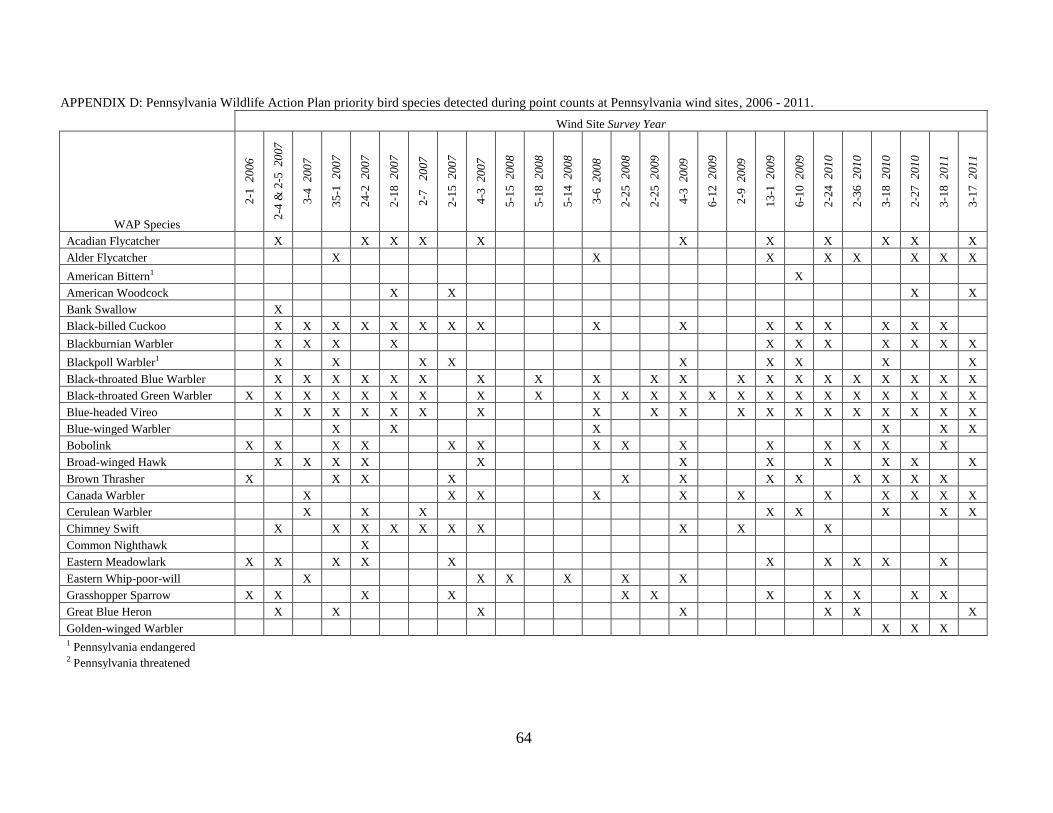
64
APPENDIX D: Pennsylvania Wildlife Action Plan priority bird species detected during point counts at Pennsylvania wind sites, 2006 - 2011.
Wind Site Survey Year
WAP Species
2-1
20
06
2-4
& 2
-5 20
07
3-4
20
07
35
-1 2
00
7
24
-2 2
00
7
2-1
8 2
00
7
2-7
2
007
2-1
5 2
00
7
4-3
20
07
5-1
5 2
00
8
5-1
8 2
00
8
5-1
4 2
00
8
3-6
20
08
2-2
5 2
00
8
2-2
5 2
00
9
4-3
20
09
6-1
2 2
00
9
2-9
20
09
13
-1 2
00
9
6-1
0 2
00
9
2-2
4 2
01
0
2-3
6 2
01
0
3-1
8 2
01
0
2-2
7 2
01
0
3-1
8 2
01
1
3-1
7 2
01
1
Acadian Flycatcher X X X X X X X X X X X
Alder Flycatcher X X X X X X X X
American Bittern1 X
American Woodcock X X X X
Bank Swallow X
Black-billed Cuckoo X X X X X X X X X X X X X X X X
Blackburnian Warbler X X X X X X X X X X X
Blackpoll Warbler1 X X X X X X X X X
Black-throated Blue Warbler X X X X X X X X X X X X X X X X X X X X
Black-throated Green Warbler X X X X X X X X X X X X X X X X X X X X X X X
Blue-headed Vireo X X X X X X X X X X X X X X X X X X X
Blue-winged Warbler X X X X X X
Bobolink X X X X X X X X X X X X X X
Broad-winged Hawk X X X X X X X X X X X
Brown Thrasher X X X X X X X X X X X X
Canada Warbler X X X X X X X X X X X
Cerulean Warbler X X X X X X X X
Chimney Swift X X X X X X X X X X
Common Nighthawk X
Eastern Meadowlark X X X X X X X X X X
Eastern Whip-poor-will X X X X X X
Grasshopper Sparrow X X X X X X X X X X X
Great Blue Heron X X X X X X X
Golden-winged Warbler X X X 1 Pennsylvania endangered 2 Pennsylvania threatened

65
APPENDIX D (continued): Pennsylvania Wildlife Action Plan priority bird species detected during point counts at Pennsylvania wind sites, 2006 - 2011.
Wind Site Survey Year
WAP Species 2
-1 20
06
2-4
& 2
-5 20
07
3-4
20
07
35
-1 2
00
7
24
-2 2
00
7
2-1
8 2
00
7
2-7
2
007
2-1
5 2
00
7
4-3
20
07
5-1
5 2
00
8
5-1
8 2
00
8
5-1
4 2
00
8
3-6
20
08
2-2
5 2
00
8
2-2
5 2
00
9
4-3
20
09
6-1
2 2
00
9
2-9
20
09
13
-1 2
00
9
6-1
0 2
00
9
2-2
4 2
01
0
2-3
6 2
01
0
3-1
8 2
01
0
2-2
7 2
01
0
3-1
8 2
01
1
3-1
7 2
01
1
Henslow's Sparrow X X X
Kentucky Warbler X X X X
Louisiana Waterthrush X X
Northern Bobwhite X
Northern Harrier2 X X X
Osprey2 X
Pine Siskin X
Prairie Warbler X X X X X X X X X X X X
Prothonotary Warbler X
Red-headed Woodpecker X X X X X X
Red-shouldered Hawk X X X X X X X X
Scarlet Tanager X X X X X X X X X X X X X X X X X X X X X X X X X X
Sharp-shinned Hawk X X X X X X X
Swainson's Thrush X X X X X X
Upland Sandpiper1 X X
Willow Flycatcher X X X X X X X X
Winter Wren X X X X X
Wood Thrush X X X X X X X X X X X X X X X X X X X X X X X X
Worm-eating Warbler X X X X X X X X X X
Yellow-bellied Flycatcher1 X X
Yellow-breasted Chat X X X X X
Yellow-throated Vireo X X X X
# POINT COUNTS 16 20 42 34 28 n/a 28 18 28 10 33 31 28 30 30 11 56 3 47 115 58 38 122 48 37 100
TOTAL WAP PRIORITY
SPECIES 9 18 13 20 18 16 11 12 16 4 5 3 12 9 6 20 5 7 21 13 19 20 26 22 24 23
TOTAL SPECIES
RECORDED 43 71 64 90 77 69 52 68 61 26 58 35 65 62 45 90 35 40 90 70 85 84 89 83 79 87 1 Pennsylvania endangered
2 Pennsylvania threatened

66
APPENDIX E: Wildlife Action Plan priority bird species detected during area searches at Pennsylvania wind sites, 2006 - 2011.
Wind Site Survey Year
WAP species
2-1
9 2
006
2-4
& 2
-5
20
07
3-4
2
007
35
-1 2
00
7
24
-2 2
007
2-7
2
007
2-1
5 2
007
4-3
20
07
5-1
4 2
008
3-6
20
08
2-2
5 2
008
4-3
2
009
6-1
2 2
009
13
-1 2
009
2-2
4 2
01
0
3-1
8 2
01
0
3-1
8 2
01
1
3-1
7
201
1
2-2
7 2
011
Acadian Flycatcher X X
Alder Flycatcher X X
American Bittern
American Black Duck X
American Woodcock X X X X
Bank Swallow X
Black-billed Cuckoo X X
Blackburnian Warbler X X X X X
Blackpoll Warbler1 X
Black-throated Blue Warbler X X X X X X
Black-throated Green Warbler X X X X X X X X X X X
Blue-headed Vireo X X X X X X X X X
Blue-winged Warbler X
Bobolink X X X X X X X X
Broad-winged Hawk X X X X X
Brown Thrasher X X X X X X X
Canada Warbler X X X X
Cerulean Warbler X X
Chimney Swift X X
Common Nighthawk
Eastern Meadowlark X X X X X X
Eastern Whip-poor-will
Grasshopper Sparrow X X X X X X
Great Blue Heron X X X X
1 Pennsylvania endangered 2 Pennsylvania threatened

67
APPENDIX E (continued): Wildlife Action Plan priority bird species detected during area searches at Pennsylvania wind sites, 2006 - 2011.
Wind Site Survey Year
WAP species
2-1
9 2
006
2-4
& 2
-5
20
07
3-4
2
007
35
-1 2
00
7
24
-2 2
007
2-7
2
007
2-1
5 2
007
4-3
20
07
5-1
4 2
008
3-6
20
08
2-2
5 2
008
4-3
2
009
6-1
2 2
009
13
-1 2
009
2-2
4 2
01
0
3-1
8 2
01
0
3-1
8 2
01
1
3-1
7
201
1
2-2
7 2
011
Henslow's Sparrow X
Kentucky Warbler X
Louisiana Waterthrush X X X
Northern Bobwhite
Northern Goshawk X
Olive-sided Flycatcher X
Osprey2 X X
Pine Siskin X
Prairie Warbler X X X
Red-headed Woodpecker
Red-shouldered Hawk X X
Scarlet Tanager X X X X X X X X X X X
Sharp-shinned Hawk X X X X X X
Solitary Sandpiper X X X X
Swainson's Thrush X
Willow Flycatcher X X
Winter Wren X X X X
Wood Thrush X X X X X X X X X X
Worm-eating Warbler X X X X
Yellow-breasted Chat X
Yellow-throated Vireo X X X X X
TOTAL WAP PRIORITY
SPECIES 15 10 3 12 6 14 1 4 1 7 9 8 1 15
4 11 6 10 15
TOTAL SPECIES RECORDED 64 45 22 54 30 63 25 29 9 48 43 44 9 72 32 62 30 67 78
1 Pennsylvania endangered
2 Pennsylvania threatened

68
APPENDIX F. Wind energy project mist net survey results, 2004 – 2011. Bat species are designated by MYLU=Myotis
lucifugus, MYSE=Myotis septentrionalis, EPFU=Eptesicus fuscus, PESU=Perimyotis subflavus, LABO=Lasiurus borealis,
LACI=Lasiurus cinereus, LANO=Lasiurus noctivagans, MYLE=Myotis leibii, MYSO=Myotis sodalis, UNK = unknown
(flew away before identified). Bat risk is designated by H=High, M=Moderate, and L=Low.
W
ind
Sit
e
Bat
Ris
k
Yea
r
Dat
es o
f S
urv
ey
No
. S
ites
No
. B
ats
Cap
ture
d
No
. S
pec
ies
MY
LU
MY
SE
a
EP
FU
PE
SU
LA
BO
b
LA
CI b
LA
NO
c
MY
LE
d
MY
SO
e
UN
K
Bat
s/ 1
00
0 U
nit
s o
f
Eff
ort
f
2-2 H 2004 7/28-8/5 6 170 6 31 12 103 4 16 0 0 3 0 1 20
5-6 H 2005 7/11-8/4 9 87 5 41 19 23 1 3 0 0 0 0 0 14
24-3 L 2005 8/10-8/14 4 84 6 34 16 23 3 7 1 0 0 0 0 17
2-7 H 2006 7/30-8/4 10 138 4 13 75 41 0 9 0 0 0 0 0 11
2-10 L 2006 8/5-8/6 4 62 5 14 28 15 1 4 0 0 0 0 0 10
2-4 L 2006 7/9-7/12 4 66 5 18 6 24 0 14 4 0 0 0 0 8
24-1 L 2006 8/10-8/12 4 71 4 34 24 11 0 2 0 0 0 0 0 9
2-14 L 2006 8/3-8/5 5 103 5 19 37 38 0 8 1 0 0 0 0 16
2-19 H 2007 7/7-7/17 13 107 6 50 39 10 1 5 2 0 0 0 0 5
2-18 H 2007 6/2-8/16 27 388 7 167 92 98 1 22 6 0 0 2 0 10
4-3 H 2007 7/25-7/30 7 201 4 69 13 110 0 9 0 0 0 0 0 23
24-2 L 2007 6/20-6/25 7 71 4 23 32 12 0 1 0 0 0 0 3 10
35-1 L 2007 7/18-8/6 28 429 6 197 174 44 0 10 1 3 0 0 0 10
2-1 L 2007 7/31-8/5 8 250 4 73 22 146 0 9 0 0 0 0 0 21
3-4 L 2007 8/7-8/9 5 200 6 60 17 82 2 36 3 0 0 0 0 23
4-3 H 2008 6/27-7/2 5 23 5 5 15 1 0 1 0 0 1 0 0 4
5-18 H 2008 5/29-8/3 50 574 6 146 104 306 0 12 4 0 2 0 0 9
6-6 H 2008 7/17-7/29 5 64 5 7 39 15 1 2 0 0 0 0 0 5
2-9 H 2008 9/3 - 9/4 3 44 4 24 3 16 1 0 0 0 0 0 0 13
5-15 H 2008 7/17-7/18 3 45 5 7 24 8 4 2 0 0 0 0 0 11
2-18 H 2008 6/16-6/28 21 228 7 67 75 66 0 11 0 1 2 2 4 8
a PA Wildlife Action Plan responsibility species
b PA Wildlife Action Plan maintenance concern
c PA Wildlife Action Plan high level concern
d PA state listed threatened; PA Wildlife Action Plan immediate concern
e PA state and federally listed endangered; PA Wildlife Action Plan immediate concern
f Unit of effort is defined as 1 square meter of net in place for one hour

69
APPENDIX F (continued): Wind energy project mist net survey results, 2004 – 2011. Bat species are designated by
MYLU=Myotis lucifugus, MYSE=Myotis septentrionalis, EPFU=Eptesicus fuscus, PESU=Perimyotis subflavus,
LABO=Lasiurus borealis, LACI=Lasiurus cinereus, LANO=Lasiurus noctivagans, MYLE=Myotis leibii,
MYSO=Myotis sodalis, UNK = unknown (flew away before identified). The last row of the table shows column totals
with the exceptions of No. Species and Bats/1000 Units of Effort being column averages. Bat risk is designated by
H=High, M=Moderate, and L=Low.
Win
d S
ite
Bat
Ris
k
Yea
r
Dat
es o
f S
urv
ey
No
. S
ites
No
. B
ats
Cap
ture
d
No
. S
pec
ies
MY
LU
MY
SE
a
EP
FU
PE
SU
LA
BO
b
LA
CI b
LA
NO
c
MY
LE
d
MY
SO
e
UN
K
Bat
s/ 1
00
0 U
nit
s o
f
Eff
ort
f
6-12 H 2008 7/20-7/27 13 255 4 57 60 124 0 13 0 0 0 0 1 14
5-14 H 2008 7/18-7/29 22 475 7 118 149 180 3 17 4 0 4 0 0 14
6-11 H 2008 7/17-7/20 9 533 7 269 15 216 6 23 1 1 0 0 2 45
24-2 L 2008 8/9-8/14 11 198 6 86 39 65 1 5 1 0 0 0 1 15
3-6 L 2008 6/21-8/10 21 525 7 260 207 25 1 27 3 2 0 0 0 30
2-24 H 2009 7/31-8/14 18 173 5 37 48 71 5 12 0 0 0 0 0 9
5-14 H 2009 5/15-8/13 19 298 6 158 52 58 15 8 0 0 7 0 0 10
3-2 L 2009 6/23-7/1 19 145 4 27 111 5 0 0 0 2 0 0 0 14
13-1 L 2009 7/27-8/14 36 410 6 45 81 249 1 24 1 0 0 0 9 9
3-4 L 2009 7/11-7/16 21 256 5 40 29 171 1 9 0 0 0 0 6 10
3-18 L 2009 7/23-8/8 38 629 6 252 289 19 0 23 26 20 0 0 0 10
2-5 L 2009 7/9-7/18 13 269 6 178 37 40 1 12 1 0 0 0 0 13
2-25 M 2009 7/23-8/15 32 326 7 38 159 96 3 21 8 0 1 0 0 7
6-10 L 2010 5/24-7/5 43 238 7 20 118 63 4 23 5 0 5 0 0 3
2-27 L 2010 5/19-5/28 13 116 6 41 32 35 0 4 0 1 3 0 0 5
2-36 L 2010 5/16-5/22 6 58 4 24 14 17 0 3 0 0 0 0 0 5
3-17 L 2011 7/9-7/20 25 227 5 7 59 126 0 34 1 0 0 0 0 5
3-18 L 2011 7/30-8/1 13 132 6 21 71 30 1 8 1 0 0 0 0 7
600 8668 5 2777 2436 2782 61 449 74 30 28 4 27 12
a PA Wildlife Action Plan responsibility species
b PA Wildlife Action Plan maintenance concern
c PA Wildlife Action Plan high level concern
d PA state listed threatened; PA Wildlife Action Plan immediate concern
e PA state and federally listed endangered; PA Wildlife Action Plan immediate concern
f Unit of effort is defined as 1 square meter of net in place for one hour

70
Appendix G. Species composition by common and scientific name of total bird mortality documented at Pennsylvania wind sites, 2007-2011.
% of
Bird
Mortality Common Name Scientific Name
% of
Bird
Mortality Common Name Scientific Name
25 Red-eyed Vireo Vireo olivaceus
1 Turkey Vulture Cathartes aura
12 Unknown Bird
1 Killdeer Charadrius vociferus
7 Golden-crowned Kinglet Regulus satrapa
1 Black-billed Cuckoo Coccyzus erythropthalmus
4 Magnolia Warbler Setophaga magnolia
1 American Crow Lophostrix cristata
4 Ruffed Grouse Bonasa umbellus
1 American Robin Turdus migratorius
2 European Starling Sturnus vulgaris
1 Common Yellowthroat Geothlypis trichas
2 Ruby-crowned Kinglet Regulus calendula
1 Philadelphia Vireo Vireo philadelphicus
2 Red-tailed Hawk Buteo jamaicensis
1 Pine Warbler Setophaga pinus
2 Unknown Warbler
1 Rose-breasted Grosbeak Pheucticus ludovicianus
1 Blue-headed Vireo Cyanophaia bicolor
1 Tennessee Warbler Vermivora peregrina
1 Ruby-throated Hummingbird Archilochus colubris
1 Warbling Vireo Vireo gilvus
1 Mourning Dove Zenaida macroura
<1 Broad-winged Hawk Buteo platypterus
1 Blackburnian Warbler Setophaga fusca
<1 Blue-winged Teal Anas discors
1 Black-throated Blue Warber Setophaga caerulescens
<1 Wood Duck Aix sponsa
1 Black-throated Green Warbler Setophaga virens
<1 Chimney Swift Chaetura pelagica
1 Swainson's Thrush Catharus ustulatus
<1 American Woodcock Scolopax minor
1 Unknown Vireo
<1 Belted Kingfisher Megaceryle alcyon
1 Veery Catharus fuscescens
<1 Ring-necked Pheasant Phasianus colchicus
1 Yellow-bellied Sapsucker Sphyrapicus varius
<1 Wild Turkey Meleagris gallopavo
1 Yellow-billed Cuckoo Coccyzus americanus
<1 Sora Porzana carolina
1 American Redstart Setophaga ruticilla
<1 Baltimore Oriole Icterus galbula
1 Cedar Waxwing Bombycilla cedrorum
<1 Black-and-white Warbler Mniotilta varia
1 Wood Thrush Hylocichla mustelina <1 Brown-headed Cowbird Molothrus ater
Appendix G (continued): Species composition by common and scientific name of total bird mortality documented at Pennsylvania
wind sites, 2007-2011.

71
% of
Bird
Mortality Common Name Scientific Name
% of
Bird
Mortality Common Name Scientific Name
<1 Blue Jay Cyanocitta cristata
<1 Indigo Bunting Passerina cyanea
<1 Blackpoll Warbler Setophaga striata
<1 Mourning Warbler Geothlypis philadelphia
<1 Barn Swallow Hirundo rustica
<1 Northern Parula Setophaga americana
<1 Bobolink Dolichonyx oryzivorus
<1 Northern Waterthrush Seiurus noveboracensis
<1 Brown Creeper Certhia americana
<1 Palm Warbler Setophaga palmarum
<1 Brown Thrasher Toxostoma rufum
<1 Red-breasted Nuthatch Sitta canadensis
<1 Blue-winged Warbler Vermivora pinus
<1 Red-winged Blackbird Agelaius phoeniceus
<1 Chipping Sparrow Spizella passerina
<1 Song Sparrow Melospiza melodia
<1 Common Raven Corvus corax
<1 Swainson's Warbler Limnothlypis swainsonii
<1 Chestnut-sided Warbler Setophaga pensylvanica
<1 Tree Sparrow Spizella arborea
<1 Eastern Bluebird Sialia sialis
<1 Winter Wren Troglodytes troglodytes
<1 Eastern Phoebe Sayornis phoebe
<1 White-throated Sparrow Zonotrichia albicollis
<1 Eastern Towhee Pipilo erythrophthalmus
<1 Yellow-bellied Flycatcher Empidonax flaviventris
<1 Eastern Wood-pewee Contopus virens
<1 Yellow-throated Warbler Setophaga dominica
<1 Field Sparrow Spizella pusilla
<1 Yellow Warbler Setophaga petechia
<1 Great-crested Flycatcher Myiarchus crinitus
<1 Yellow-shafted Flicker Colaptes a. auratus
<1 Gray Catbird Dumetella carolinensis
<1 Unknown Flycatcher
<1 Henslow's Sparrow Ammodramus henslowii
<1 Unknown Woodpecker
<1 House Sparrow Passer domesticus
Appendix H. Summary of post-construction spring and fall raptor migration surveys completed at Pennsylvania wind sites, 2007 –
2011. Raptor species are designated by AMKE=American kestrel, BAEA=Bald eagle, BLVU=Black vulture, BWHA=Broad-winged

72
hawk, COHA=Cooper’s hawk, GOEA=Golden eagle, MERL=Merlin, NOGO=Northern Goshawk, NOHA=Northern harrier,
OSPR=Osprey, PEFA=Peregrine falcon, RSHA=Red-shouldered hawk, RTHA=Red-tailed hawk, SSHA=Sharp-shinned hawk,
TUVU=Turkey vulture, and UNKN=Unidentified raptor.
Wind Site
Raptor
Risk Year
Total
No.
Raptors
Percent in Flight
Survey AM
KE
BA
EA
a
BL
VU
BW
HA
b
CO
HA
GO
EA
c
ME
RL
NO
GO
d
NO
HA
e
OS
PR
f
PE
FA
g
RS
HA
h
RT
HA
SS
HA
i
TU
VU
UN
KN
24-3 H 2009 Spring 346 2 1 0 0 5 4 0 0 1 0 0 1 33 7 46 0
5-5 M 2010 Spring 175 5 16 1 0 3 2 0 1 5 1 1 2 7 3 31 22
24-1 H 2010 Spring 18 17 6 0 0 6 17 0 0 0 0 0 0 39 0 11 6
2-4 M 2010 Spring 190 2 2 0 0 1 1 0 1 3 0 1 2 24 1 57 7
6-16 H 2011 Spring 863 0 5 32 0 0 0 0 0 0 1 0 0 5 0 55 2
2-14 M 2008 Fall 1056 0 0 1 20 2 0 0 0 1 1 0 1 10 8 48 7
2-10 M 2008 Fall 778 0 1 0 9 3 0 0 0 2 1 0 0 23 1 48 11
5-5 M 2009 Fall 630 1 4 1 31 2 1 1 0 4 5 1 1 21 11 10 3
24-1 H 2010 Fall 874 2 1 1 48 2 0 1 0 2 2 1 3 12 6 16 3
24-3 H 2010 Fall 814 2 2 0 27 3 1 1 0 2 1 0 1 26 8 22 2
2-4 M 2010 Fall 327 4 0 0 14 4 0 0 0 13 0 1 1 22 5 34 2
2-19 H 2010 Fall 3127 2 1 0 50 4 1 0 0 1 0 0 1 21 11 4 4
6-16 H 2011 Fall 1629 4 9 10 5 0 0 0 0 0 0 0 0 3 1 66 0 a Pennsylvania threatened; Pennsylvania Wildlife Action Plan high level concern; b Pennsylvania Wildlife Action Plan maintenance concern; c Pennsylvania Wildlife Action Plan
PA vulnerable; d Pennsylvania Wildlife Action Plan PA vulnerable; e Pennsylvania threatened; f Pennsylvania threatened; Pennsylvania Wildlife Action Plan Pennsylvania
vulnerable; g Pennsylvania endangered; Pennsylvania Wildlife Action Plan high level concern; h Pennsylvania Wildlife Action Plan maintenance concern; i Pennsylvania Wildlife
Action Plan maintenance concern.