penta-ocean construction annual report 2012 · 2012-08-30 · explanation the penta-ocean group’s...
TRANSCRIPT

www.penta-ocean.co.jp
Printed in Japan
Penta-O
cean C
on
structio
n A
nn
ual R
ep
ort 2
012
Annual Report 2012Year Ended March 31, 2012
Penta-Ocean Construction

Consolidated Financial Highlights
Message from the President
Medium-Term Management Plan
Overseas Projects
Domestic Projects
..................................................................................
............................................................................................
...................................................................................
..............................................................................................................
..............................................................................................................
1
2
4
6
8
Corporate Governance / CSR Activities
Consolidated Financial Statements
Non-Consolidated Financial Statements
Company Data
......................................................
.............................................................
...................................................
.................................................................................................
10
11
41
45
Corporate Message
Corporate Policy
Corporate Visions
Committed company guaranteeing solid quality
Creative company for land and seaAs a leading contractor in coastal and waterfront areas, we seek to create attractive environments and pursue customer satisfaction
and social contribution as an engineering-oriented company.
We build trustful relationships with our customers and society through providing high quality workmanship and safe products backed
by solid technologies.
We establish quality and nurture rich environments throughout the course of our corporate activities and pass on our dreams,
hopes and possibilities to the next generations.
Future-oriented company creating rich environments for the future generations
Since its establishment in 1896 in Kure City, Hiroshima Prefecture, Penta-Ocean Construction
has grown with society by contributing an enterprising, up-and-coming spirit and leading-
edge construction technologies. Today, more than 100 years after our founding, a mentality of
continually seeking challenges in new fields remains part of our corporate DNA. A spirit of
accepting challenges that never varies, even as times change, and the power of flexible
self-innovation to respond to the needs of each new era. At Penta-Ocean, we are never satisfied
with things as they are, and we continue to move steadily forward, step by step.
Creatinga Nature-RichEnvironment
Affiliating withSociety
Cherishinga Pioneering
Spirit
Contents
Millions of yen Thousands of U.S. dollars
2011 2012 2012
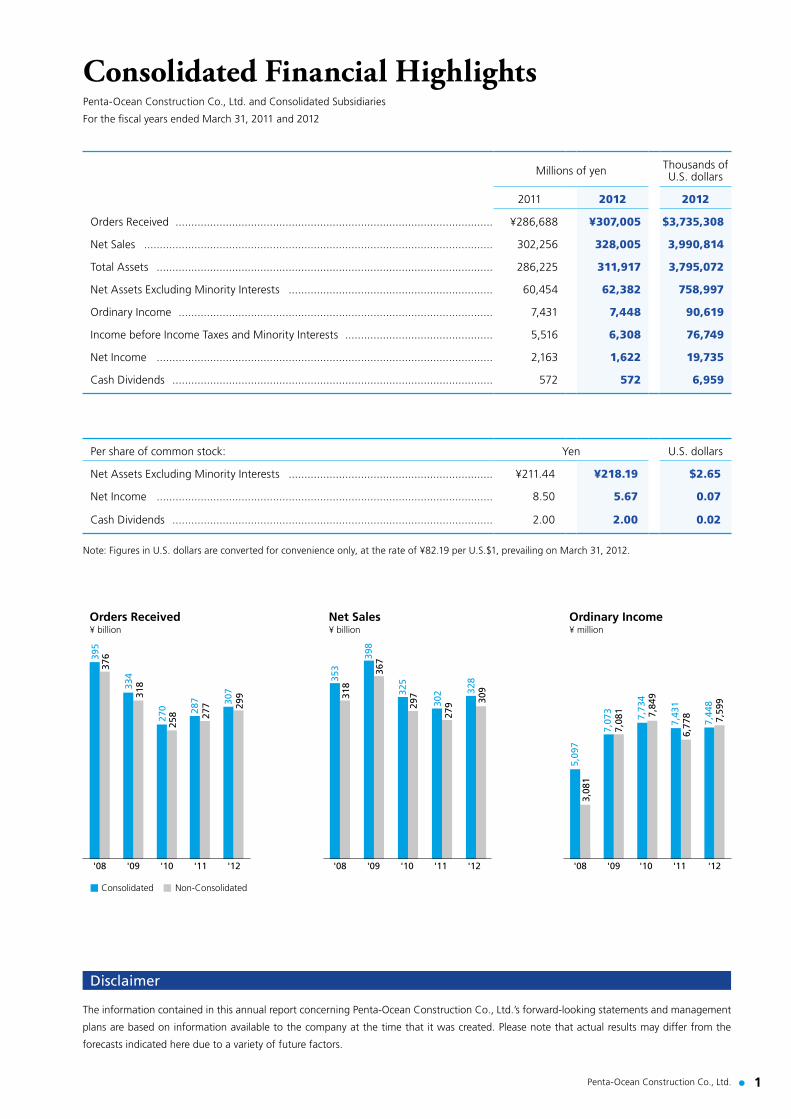
Orders Received ..................................................................................................... ¥286,688 ¥307,005 $3,735,308
Net Sales ............................................................................................................... 302,256 328,005 3,990,814
Total Assets ........................................................................................................... 286,225 311,917 3,795,072
Net Assets Excluding Minority Interests ................................................................. 60,454 62,382 758,997
Ordinary Income .................................................................................................... 7,431 7,448 90,619
Income before Income Taxes and Minority Interests ............................................... 5,516 6,308 76,749
Net Income ........................................................................................................... 2,163 1,622 19,735
Cash Dividends ...................................................................................................... 572 572 6,959
Per share of common stock: Yen U.S. dollars
Net Assets Excluding Minority Interests ................................................................. ¥211.44 ¥218.19 $2.65
Net Income ........................................................................................................... 8.50 5.67 0.07
Cash Dividends ...................................................................................................... 2.00 2.00 0.02
Note: Figures in U.S. dollars are converted for convenience only, at the rate of ¥82.19 per U.S.$1, prevailing on March 31, 2012.
Penta-Ocean Construction Co., Ltd. and Consolidated Subsidiaries
For the fiscal years ended March 31, 2011 and 2012
Consolidated Financial Highlights
'12'11'10'09 '12'11'10'09'08
Orders Received¥ billion
Ordinary Income¥ million
Consolidated Non-Consolidated
'08
376
318
395
334
25827
0
277287
3,08
1
7,08
1 7,84
9
5,09
7
7,07
3
7,73
4
6,77
87,
43129
930
7
'12'11'10'09'08
Net Sales¥ billion
318
367
353
398
29732
5
27930
2
30932
8
7,59
97,
448
Disclaimer
The information contained in this annual report concerning Penta-Ocean Construction Co., Ltd.’s forward-looking statements and management
plans are based on information available to the company at the time that it was created. Please note that actual results may differ from the
forecasts indicated here due to a variety of future factors.
Penta-Ocean Construction Co., Ltd. 1

Penta-Ocean Construction Co., Ltd.2
During the fiscal year ended March 31, 2012, manufacturing recovered in Japan following the restoration of the domestic supply chain, which had been affected by the Great East Japan Earthquake. However, a slowdown in the global economy caused by Europe’s debt problems and the impact of the stubbornly high yen created a situation in which it would take some time before a full-fledged recovery took hold in Japan.
In the domestic construction industry, the implementation of the national budget for restoration and recovery projects related to the Great East Japan Earthquake led to projections of an increase in public works projects. Residential investment, which had slowed in the aftermath of the earthquake, showed signs of recovering, particularly in metropolitan areas. Still, investment levels as a whole remained low. Efforts to restore the supply chain created some capital investment demand, and investment levels were low, reflecting uncertain economic trends. Meanwhile, construction demand was strong in the Penta-Ocean Construction Group’s main overseas markets in Southeast Asia, mainly in the area of social infrastructure development.
In this business climate, the Group is targeting continued growth as the “No. 1 contractor in coastal and waterfront areas,” and is striving to achieve the goals of its Medium-Term Management Plan. As a result, the Group’s consolidated net sales came to ¥328,005 million (US$3,990.8 million), an increase of 8.5% year-on-year. Operating income amounted to ¥8,983 million (US$109.3 million), a decrease of ¥8.2 million year-on-year, and ordinary income totaled ¥7,448 million (US$90.6 million), an increase of 0.2% year-on-year. The Group recorded income before income taxes and minority interests of ¥6,308 million (US$76.7 million), an increase
of 14.4% year-on-year. Consolidated net income came to ¥1,622 million (US$19.7 million), a decline of 25.0% year-on-year.
Penta-Ocean’s Medium-Term Management Plan (2012-2014) sets forth diverse and stable funding as one of the basic strategies for strengthening the Group’s business foundation. As part of this effort, we completed our first offering of unsecured bonds amounting to ¥10,000 million (US$121.7 million) in October 2011. The proceeds will be used to repay loans.
Looking at the domestic construction market in the fiscal year ending in March 31, 2013, we anticipate the steady implementation of major projects that will allow the Group to make full use of its strengths. These include disaster recovery-related public works projects, which are being implemented in spite of Japan’s fiscal challenges, and projects related to the development of strategic international ports and remote islands. While we expect to see a gradual recovery in private-sector construction projects, actual conditions will be heavily influenced by economic trends. Careful monitoring of such factors as exchange rates and the electricity supply are therefore necessary.
Elsewhere, the Group expects infrastructure development and the construction of medical and educational facilities to remain strong in Singapore, Hong Kong and other Southeast Asian markets.
The Penta-Ocean Group’s corporate message is “Going Further.” These words embody the future vision we must strive for, and our resolve as we face tomorrow. As the No. 1 frontrunner in coastal and waterfront areas, we will aim to enhance our corporate value, to develop and grow in a sustainable manner that harmoniously blend with the society and to be an attractive business, all while keeping our sights firmly fixed on “Going Further” and even beyond.
Message from the President
Targeting Further Growth as the “No. 1 Contractor in Coastal and Waterfront Areas”
President, Chief Executive Officer and Representative Director
Penta-Ocean Construction Co., Ltd. 3
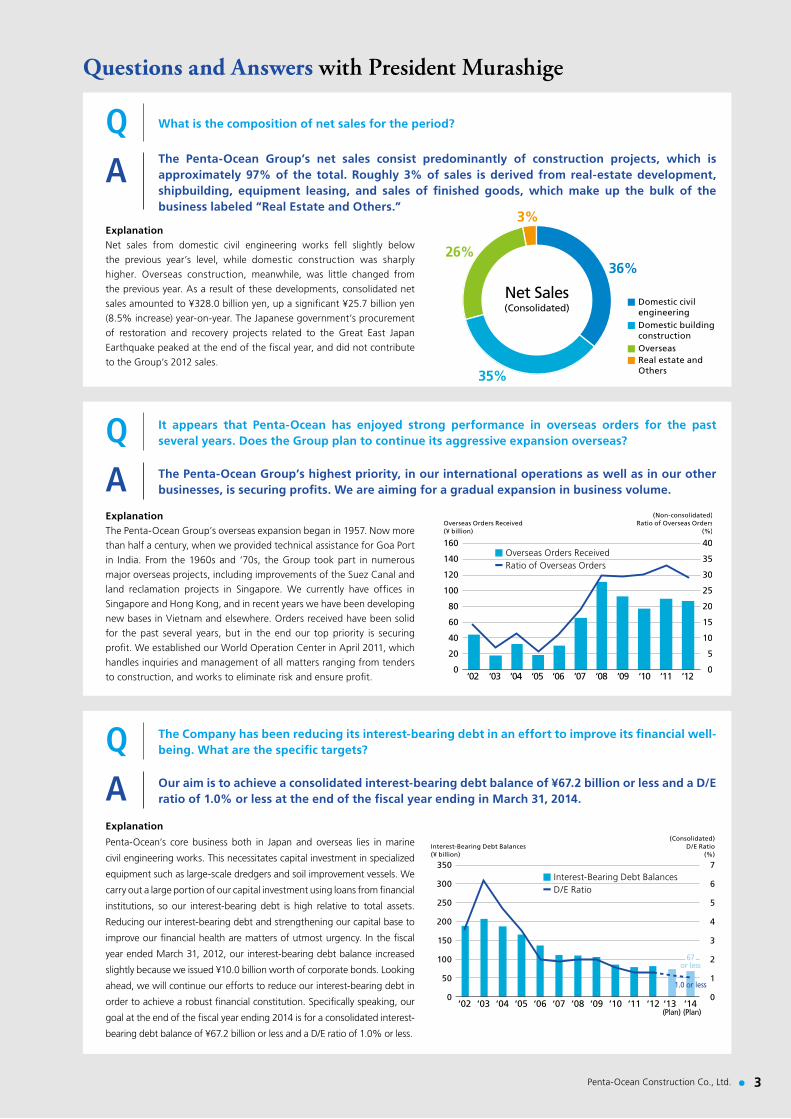
What is the composition of net sales for the period?
Questions and Answers with President Murashige
It appears that Penta-Ocean has enjoyed strong performance in overseas orders for the past several years. Does the Group plan to continue its aggressive expansion overseas?
The Company has been reducing its interest-bearing debt in an effort to improve its financial well-being. What are the specific targets?
The Penta-Ocean Group’s net sales consist predominantly of construction projects, which is approximately 97% of the total. Roughly 3% of sales is derived from real-estate development, shipbuilding, equipment leasing, and sales of finished goods, which make up the bulk of the business labeled “Real Estate and Others.”
The Penta-Ocean Group’s highest priority, in our international operations as well as in our other businesses, is securing profits. We are aiming for a gradual expansion in business volume.
Our aim is to achieve a consolidated interest-bearing debt balance of ¥67.2 billion or less and a D/E ratio of 1.0% or less at the end of the fiscal year ending in March 31, 2014.
ExplanationNet sales from domestic civil engineering works fell slightly below
the previous year’s level, while domestic construction was sharply
higher. Overseas construction, meanwhile, was little changed from
the previous year. As a result of these developments, consolidated net
sales amounted to ¥328.0 billion yen, up a significant ¥25.7 billion yen
(8.5% increase) year-on-year. The Japanese government’s procurement
of restoration and recovery projects related to the Great East Japan
Earthquake peaked at the end of the fiscal year, and did not contribute
to the Group’s 2012 sales.
ExplanationThe Penta-Ocean Group’s overseas expansion began in 1957. Now more
than half a century, when we provided technical assistance for Goa Port
in India. From the 1960s and ‘70s, the Group took part in numerous
major overseas projects, including improvements of the Suez Canal and
land reclamation projects in Singapore. We currently have offices in
Singapore and Hong Kong, and in recent years we have been developing
new bases in Vietnam and elsewhere. Orders received have been solid
for the past several years, but in the end our top priority is securing
profit. We established our World Operation Center in April 2011, which
handles inquiries and management of all matters ranging from tenders
to construction, and works to eliminate risk and ensure profit.
Explanation
Penta-Ocean’s core business both in Japan and overseas lies in marine
civil engineering works. This necessitates capital investment in specialized
equipment such as large-scale dredgers and soil improvement vessels. We
carry out a large portion of our capital investment using loans from financial
institutions, so our interest-bearing debt is high relative to total assets.
Reducing our interest-bearing debt and strengthening our capital base to
improve our financial health are matters of utmost urgency. In the fiscal
year ended March 31, 2012, our interest-bearing debt balance increased
slightly because we issued ¥10.0 billion worth of corporate bonds. Looking
ahead, we will continue our efforts to reduce our interest-bearing debt in
order to achieve a robust financial constitution. Specifically speaking, our
goal at the end of the fiscal year ending 2014 is for a consolidated interest-
bearing debt balance of ¥67.2 billion or less and a D/E ratio of 1.0% or less.
Q
Q
Q
A
A
A
Net Sales(Consolidated)
Domestic civilengineering
36%
35%
26%
3%
Domestic buildingconstructionOverseasReal estate andOthers
40
35
30
25
20
15
10
5
0
160
140
120
100
80
60
40
20
0‘02 ‘03 ‘04 ‘05 ‘06 ‘07 ‘08 ‘09 ‘10 ‘11 ‘12
Overseas Orders ReceivedRatio of Overseas Orders
(Non-consolidated)Ratio of Overseas Orders
(%)Overseas Orders Received(¥ billion)
‘02 ‘03 ‘04 ‘05 ‘06 ‘07 ‘08 ‘09 ‘10 ‘11 ‘12 ‘13 (Plan)
‘14 (Plan)
350
300
250
200
150
100
50
0
7
6
5
4
3
2
1
0
(Consolidated)D/E Ratio
(%)Interest-Bearing Debt Balances(¥ billion)
Interest-Bearing Debt BalancesD/E Ratio
1.0 or less
67or less

Construction Market Outlook Target Earnings under Our Management Plan
Short-Term Outlook Medium-Term OutlookPublic Works Projects: Declining trend; selection and focus; budgetary allocations to disaster-preparation and other fields related to public comfort and securityPrivate-Sector Demand:Corporate earnings slacken, primarily among manufacturers, due to the major earthquake damage and Thai floodsLarge-Scale Projects:Large-Scale projects seen starting second-half of the fiscal year ending 2013Overseas:Southeast Asia brisk growth to continue with projects such as MRT in Singapore and 10 major infrastructure projects in Hong Kong
Public Works Projects: Declining trend to ease temporarily on disaster-recovery projects, but the Group will undertake further selection and focus on business in preparation for the future Private-Sector Demand:Gradual economic recovery, growing capital investment and recovery of housing market, but with disparities among industries, firms and regionsLarge-Scale Projects:Progress on projects such as airports/harbor hubs, the Linear Chuo Shinkansen (bullet train), environment-related works and renewable energyOverseas:Singapore and Hong Kong remain strong; new business opportunities in Southeast and South Asia
Time of technology and price competitionin which only firms with superior technology and
project planning skills can survive
Medium-Term Management Plan Basic Policies
1. Maintain business volume“No. 1 Contractor in Coastal and Waterfront Areas”Transition from general contractor model to core business-integrated model
2. Build competitiveness
3. Further improve quality of operations
4. Enter new fields, undertake capital investment
5. Strengthen the operating base
Shareholder Dividend
• Stable shareholder dividend
• Planned 2013 year-end dividend: ¥2 per share
Major Targets (Consolidated)
• 2013: Ordinary Income: ¥6.6 billion or greater
Debt-Equity Ratio: 1.1% or less
• 2014: Ordinary Income: ¥8.4 billion or greater
Debt-Equity Ratio: 1.0% or less
Target Firm Image Basic Management Policies
Consolidated Financial Targets
Medium-Term Management Plan2013 Plan 2014 Plan
Consolidated Non-consolidated Consolidated
(¥ billion)
Non-consolidated
Target Earning Construction Orders Received
Net Sales
Gross Profit
SG&A
Operating Income
Ordinary Income
Net Income
ROE (%)
Interest-Bearing Debt (¥ billion)
D/E Ratio (%)
¥ —
347.0
23.8
15.3
8.5
6.6
1.7
22% or greater
¥72.2 or less
1.1% or less
23% or greater
¥67.2 or less
1.0% or less
¥ —
327.0
25.3
14.8
10.5
8.4
2.6
¥ 305.0
327.0
22.7
14.0
8.7
7.0
2.3
¥ 305.0
306.0
23.5
13.5
10.0
8.0
2.5
Shareholders’ Equity / Interest-Bearing Debt (¥ billion)
‘12‘11‘10‘09‘08‘07‘06‘05 ‘13 (Plan) ‘14 (Plan)
‘12‘11‘10‘09‘08‘07‘06‘05 ‘13 (Plan) ‘14 (Plan)
30
25
20
15
10
25
20
15
10
5
0
200
150
100
50
500
400
300
200
100
0
66.9 57.6 53.9 52.2 54.4 60.562.4
47.6
11.6%
165.2
135.7
110.5 109.1 105.2
85.878.7
81.2
67.2or less
72.2or less17.2%
16.2% 15.8% 15.4% 18.5%
21.1%20.0%
22%or greater
23%or greater
302.3324.8
398.5
352.8323.3
354.7345.3 328.0347.0
327.0
12.0
8.9
2.4
14.2
11.3
3.9 4.6
8.8
10.8 10.89.8 9.0
7.4 7.4
2.21.6
8.5
6.6
1.72.6
7.7
1.7
10.5
8.47.1
-3.3
5.1
2.62.1
-5.9
Shareholders’ Equity (%)
Net Sales Operating Income Ordinary Income Net Income
Shareholders’ Equity (%)
Operating / Ordinary / Net Income (¥ billion) Net Sales (¥ billion)
Shareholders’ Equity Interest-Bearing Debt
Major Operating Trends/Projection (Consolidated)
0
Medium-Term Management Plan (For the Fiscal Years Ending March 31, 2013 and 2014)
Japan’s First Large-Scale Self-propelled Multi-purpose Working VesselCP-5001, a large-scale Self-propelled Multi-purpose working vessel, went into
service in June 2012. It is a working ship designed for offshore civil engineering
works, and first of its kind vessel in Japan capable of navigating itself through
coastal waters. It is equipped with a 500t-class all-swivel crane, and can handle
various tasks, such as dredging to excavate soil from the seabed or steel pipe pile
driving. CP-5001 is equipped with marine broadband and other systems employing
the most up-to-date technologies, and was designed with workers’ comfort as
well as energy-savings and other environmental considerations in mind. Penta-
Ocean Group is bolstering its mainstay offshore civil engineering sector with
the introduction of cutting-edge equipment. Toward this end, the Group used
proceeds from its initial public offering to begin construction of CP-5001 in 2011.
And we are currently in the process of building a self-propelled cutter dredger. We
will continue to strive to increase our competitive strengths.
Penta-Ocean Construction Co., Ltd.4

Construction Market Outlook Target Earnings under Our Management Plan
Short-Term Outlook Medium-Term OutlookPublic Works Projects: Declining trend; selection and focus; budgetary allocations to disaster-preparation and other fields related to public comfort and securityPrivate-Sector Demand:Corporate earnings slacken, primarily among manufacturers, due to the major earthquake damage and Thai floodsLarge-Scale Projects:Large-Scale projects seen starting second-half of the fiscal year ending 2013Overseas:Southeast Asia brisk growth to continue with projects such as MRT in Singapore and 10 major infrastructure projects in Hong Kong
Public Works Projects: Declining trend to ease temporarily on disaster-recovery projects, but the Group will undertake further selection and focus on business in preparation for the future Private-Sector Demand:Gradual economic recovery, growing capital investment and recovery of housing market, but with disparities among industries, firms and regionsLarge-Scale Projects:Progress on projects such as airports/harbor hubs, the Linear Chuo Shinkansen (bullet train), environment-related works and renewable energyOverseas:Singapore and Hong Kong remain strong; new business opportunities in Southeast and South Asia
Time of technology and price competitionin which only firms with superior technology and
project planning skills can survive
Medium-Term Management Plan Basic Policies
1. Maintain business volume“No. 1 Contractor in Coastal and Waterfront Areas”Transition from general contractor model to core business-integrated model
2. Build competitiveness
3. Further improve quality of operations
4. Enter new fields, undertake capital investment
5. Strengthen the operating base
Shareholder Dividend
• Stable shareholder dividend
• Planned 2013 year-end dividend: ¥2 per share
Major Targets (Consolidated)
• 2013: Ordinary Income: ¥6.6 billion or greater
Debt-Equity Ratio: 1.1% or less
• 2014: Ordinary Income: ¥8.4 billion or greater
Debt-Equity Ratio: 1.0% or less
Target Firm Image Basic Management Policies
Consolidated Financial Targets
Medium-Term Management Plan2013 Plan 2014 Plan
Consolidated Non-consolidated Consolidated
(¥ billion)
Non-consolidated
Target Earning Construction Orders Received
Net Sales
Gross Profit
SG&A
Operating Income
Ordinary Income
Net Income
ROE (%)
Interest-Bearing Debt (¥ billion)
D/E Ratio (%)
¥ —
347.0
23.8
15.3
8.5
6.6
1.7
22% or greater
¥72.2 or less
1.1% or less
23% or greater
¥67.2 or less
1.0% or less
¥ —
327.0
25.3
14.8
10.5
8.4
2.6
¥ 305.0
327.0
22.7
14.0
8.7
7.0
2.3
¥ 305.0
306.0
23.5
13.5
10.0
8.0
2.5
Shareholders’ Equity / Interest-Bearing Debt (¥ billion)
‘12‘11‘10‘09‘08‘07‘06‘05 ‘13 (Plan) ‘14 (Plan)
‘12‘11‘10‘09‘08‘07‘06‘05 ‘13 (Plan) ‘14 (Plan)
30
25
20
15
10
25
20
15
10
5
0
200
150
100
50
500
400
300
200
100
0
66.9 57.6 53.9 52.2 54.4 60.562.4
47.6
11.6%
165.2
135.7
110.5 109.1 105.2
85.878.7
81.2
67.2or less
72.2or less17.2%
16.2% 15.8% 15.4% 18.5%
21.1%20.0%
22%or greater
23%or greater
302.3324.8
398.5
352.8323.3
354.7345.3 328.0347.0
327.0
12.0
8.9
2.4
14.2
11.3
3.9 4.6
8.8
10.8 10.89.8 9.0
7.4 7.4
2.21.6
8.5
6.6
1.72.6
7.7
1.7
10.5
8.47.1
-3.3
5.1
2.62.1
-5.9
Shareholders’ Equity (%)
Net Sales Operating Income Ordinary Income Net Income
Shareholders’ Equity (%)
Operating / Ordinary / Net Income (¥ billion) Net Sales (¥ billion)
Shareholders’ Equity Interest-Bearing Debt
Major Operating Trends/Projection (Consolidated)
0
Penta-Ocean Construction Co., Ltd. 5

Overseas Projects
Pohnpei International Airport (Federated States of Micronesia)
International Cruise Terminal (Singapore)
Pohnpei International Airport, where Penta-Ocean took charge of the reclamation work for capital airport of Federated
States of Micronesia (FSM), was inaugurated in 1969 and has been utilized by approximately 40,000 passengers
annually. With the passing of over 40
years, its entire facilities have been
depreciated due to old condition and
the extension of runway was craved
and now, it is completely renewed
including other facilities after the
rehabilitation programs.
Extension of runway and the newly-
built terminal building, etc. were funded
under the Japanese Grant Aid Program,
while the pavement improvement
of existing runway and newly-built
Aircraft Rescue & Fire Fighting Building
(ARFF), etc. were funded by the Federal
Aviation Administration (FAA). The
construction of both projects was
awarded to Penta-Ocean.
Penta-Ocean completed the construction of an international cruise terminal in the Marina Bay area, where redevelopment
projects are ongoing. This project resolved a number of issues with the previous cruise terminal, which was unable to meet
the growing demand for cruise tourism and could not accommodate large cruise vessels.
The new cruise terminal consists
of two berths and a terminal building.
To enable docking by passenger ships
on both sides, Penta-Ocean also built
a wharf measuring 300 meters long
and 120 meters wide and an access
deck. The ANDROMEDA V, our large
drag suction dredger, was employed to
meet the extremely short construction
schedule of 27 months.
This new cruise terminal is capable
of simultaneously accommodating two
ships in the world’s largest passenger
liner class for further boosting
Singapore’s attraction as a destination
for cruise tourism.
Penta-Ocean Construction Co., Ltd.6

Foster Electric Factory (Vietnam)
Diocesan Girls’ School (Hong Kong)
Rapid economic progress of Vietnam draws so much interest
from many foreign companies seeking for global business
opportunities and better business resource environment.
The Japanese manufacturers are not exceptions and
many of them are making decision to invest their business
resource in setting up new production line in Vietnam.
Some aimed to expand their future business operation or a
move to survive the tough market. Foster Electric is one of
companies that put up a new factory.
Though the required overall construction period of only
9 months was a tight schedule, we successfully completed
this new factory on time. It was the first enterprise built
in a newly developed industrial park, located 20 km from
Hanoi, the capital city of Vietnam.
The new facility has a modern exterior design giving
an outstanding impression more than a just conventional
designed factory and attracting people as an icon of the
new industrial park.
Penta-Ocean renovated the schoolhouse for one of Hong Kong’s
most prestigious girls’ schools, the Diocesan Girls’ School.
The existing schoolhouse had a long and rich history,
but had fallen into a state of disrepair. For this reason, on the
occasion of the 150th anniversary of the school’s founding in
2010, this renovation project was planned for transforming
the schoolhouse into a building accommodating a recital
hall with a capacity of around 1,200 people and other
features that fit the proud tradition and accomplishments
of this renowned school.
The building that fully occupied a triangular-shaped
site, is situated in one of Hong Kong’s famous shopping and
entertainment districts. It required adjustment of the carry-
in routes and material yard based on the work progress,
and as a result, the work had to be managed based on the
daily progressing conditions of the site. Our local staff and
Japanese staff worked in close coordination to bring the
construction project to a successful completion.
Orders received by the segment included construction projects for an underground railway line
in Singapore, the Hong Kong Stock Exchange’s new data center, as well as dredging and
reclamation project in Malaysia. However, orders received by our overseas divisions as a whole
declined by 4.0% from the previous �scal year, when the sector received orders for numerous
projects, including the construction of a large-scale hospital in Singapore.
Overseas Project: 2012 Orders Received by Sectors (Non-Consolidated)
37%36%
27%
Singapore
Hong Kong
Others
Penta-Ocean Construction Co., Ltd. 7
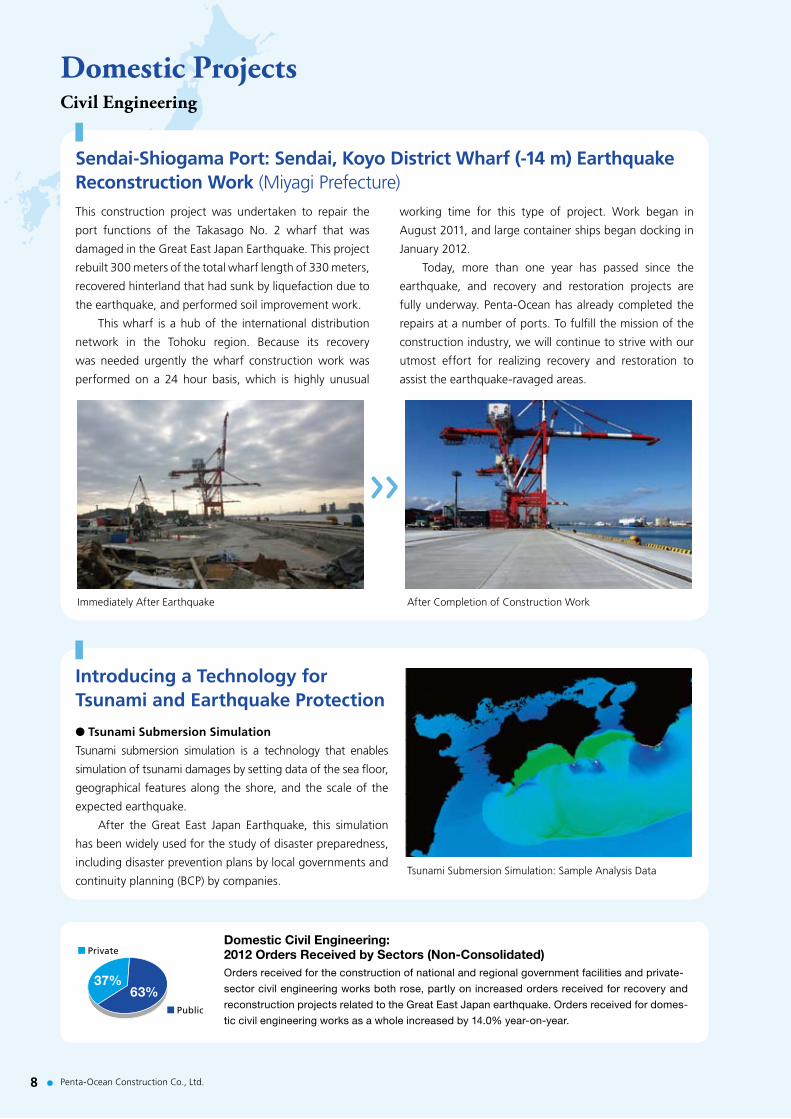
Sendai-Shiogama Port: Sendai, Koyo District Wharf (-14 m) Earthquake Reconstruction Work (Miyagi Prefecture)
Introducing a Technology for Tsunami and Earthquake Protection
This construction project was undertaken to repair the
port functions of the Takasago No. 2 wharf that was
damaged in the Great East Japan Earthquake. This project
rebuilt 300 meters of the total wharf length of 330 meters,
recovered hinterland that had sunk by liquefaction due to
the earthquake, and performed soil improvement work.
This wharf is a hub of the international distribution
network in the Tohoku region. Because its recovery
was needed urgently the wharf construction work was
performed on a 24 hour basis, which is highly unusual
working time for this type of project. Work began in
August 2011, and large container ships began docking in
January 2012.
Today, more than one year has passed since the
earthquake, and recovery and restoration projects are
fully underway. Penta-Ocean has already completed the
repairs at a number of ports. To fulfill the mission of the
construction industry, we will continue to strive with our
utmost effort for realizing recovery and restoration to
assist the earthquake-ravaged areas.
l Tsunami Submersion Simulation
Tsunami submersion simulation is a technology that enables
simulation of tsunami damages by setting data of the sea floor,
geographical features along the shore, and the scale of the
expected earthquake.
After the Great East Japan Earthquake, this simulation
has been widely used for the study of disaster preparedness,
including disaster prevention plans by local governments and
continuity planning (BCP) by companies.
Domestic ProjectsCivil Engineering
Orders received for the construction of national and regional government facilities and private-
sector civil engineering works both rose, partly on increased orders received for recovery and
reconstruction projects related to the Great East Japan earthquake. Orders received for domes-
tic civil engineering works as a whole increased by 14.0% year-on-year.
Domestic Civil Engineering: 2012 Orders Received by Sectors (Non-Consolidated)
37%63%
Public
Private
Immediately After Earthquake After Completion of Construction Work
Tsunami Submersion Simulation: Sample Analysis Data
Penta-Ocean Construction Co., Ltd.8

Makabe Denshokan Museum (Ibaraki Prefecture)
Preservation and Restoration of Former Russo-Asiatic Bank Yokohama Branch Building (Kanagawa Prefecture)
Penta-Ocean completed the construction of a cultural facility in the village of Makabe
in Sakuragawa, Ibaraki prefecture, a home to the remnants of an Edo era castle town.
The surrounding area of this building is a region with a long and distinguished history,
and the town has been designated as an important preservation district for historical
buildings in Japan. Built on the former site of a community center that had fallen
into disrepair over time, this new building was constructed with a design that blends
harmoniously with the surrounding town.
The external appearance features black and white tones
to match the surrounding storehouses made of soil and
mortar, as well as the stones, and the south and west sides
which are exposed to sunlight has cedar board paneling.
The building itself has a unique design with three connected
wings, and the structure uses steel sheets walls for providing
earthquake resistance and also features a distinctive building
interior without pillars for enabling a wide range of usage.
This building was awarded the Architectural Institute of
Japan (AIJ) Prize for 2012.
Designated as a tangible cultural property by the city of
Yokohama, the Russo-Asiatic Bank Yokohama Branch
building was renovated for use as a wedding hall. Built
around 1921 and later converted into consulate and
business offices, this building withstood the Great
Kanto Earthquake and possesses a high architectural
and historical value. It combines a highly distinctive
design with grace and elegance in appearance, but had
aged and deteriorated to the point where it required
preservation and restoration.
This construction project aimed to maintain as much
of its original building’s appearance as possible while
providing earthquake reinforcement work and external
and internal repairs at the same time.
The building has been newly renovated as a wedding
hall. The large marble staircase at the entrance that
ascends to the second floor is used as the wedding aisle,
and the bank safe is used as the gallery.
Building Construction
Orders received for large-scale redevelopment projects fueled a signi�cant
increase in orders received for residential construction. This offset a decline in
orders received for non-residential construction, which resulted as orders
received for large-scale projects shrank from the previous year. Orders received
for domestic building construction overall rose by 12.0% year-on-year.
Domestic Building Construction:2012 Orders Received by Sectors (Non-Consolidated)
ResidencesLogistics & WarehousesFactoriesOfficesEducational/Cultural facilitiesMedical/WelfarefacilitiesOthers
24%
23%
20%
9%7%4%
13%
Before Restoration After Restoration
Penta-Ocean Construction Co., Ltd. 9

Corporate Governance / CSR ActivitiesCorporate Governance
CSR Activities
Our Basic Stance on Corporate Governance
CSR Policy
Structure and Enhancement
Basic internal control policies and implementation of a practical internal
control system
Effective corporate auditor audits, internal audits and financial statement audits
Adoption of an executive officer system and
performance evaluation system
Dignified Business Conduct
Coexistence with the Environment
and NatureHuman Propriety
Information Transparency
Double Honors for Safety (Singapore)In July 2011, Penta-Ocean received a pair of awards for its work on Contract
485, part of the Marina Coastal Expressway project in Singapore. The
first was the Safety and Health Award Recognition for Projects under the
Workplace Safety and Health Performance Awards organized by Singapore’s
Workplace Safety and Health (WSH) Council, with the support of the
Ministry of Manpower (MOM). The Company also received a Certificate of
Merit (Environmental) as part of the 2011 Annual Safety Award Convention
organized by Singapore’s Land Transport Authority (LTA). This project was
selected from among numerous workplaces and job sites. The awards are
significant honors recognizing both Penta-Ocean’s commitment to creating
a model workplace in terms of safety, environment and unified efforts of
its workers.
Column
The Company positions effective Corporate Governance as a priority management issue for its enduring
growth and development. And, with the goal of overall, Group-wide optimization, we are working to
strengthen our Corporate Governance to enable the thorough implementation of management strategies,
not only from the perspective of internal controls but also from a technological viewpoint. Specifically, we are
implementing enhanced enterprise management-related audit and oversight functions, the promotion of risk
management, and enhanced disclosure as policies of paramount importance.
* For more information on the status of the Company’s Corporate Governance efforts, please visit our website: http://www.penta-ocean.co.jp/english/company/management/index.html
Penta-Ocean Construction Group views that its greatest contribution to society is the construction of
superior infrastructure. We aim to be a respectable and highly attractive group of companies not only to
our shareholders, customers, business partners and employees, but also to local communities by providing
solid, quality workmanship backed by advanced technologies developed with a high regard for safety and
ecological considerations.
Penta-Ocean Construction Co., Ltd.10
11Penta-Ocean Construction Co., Ltd.
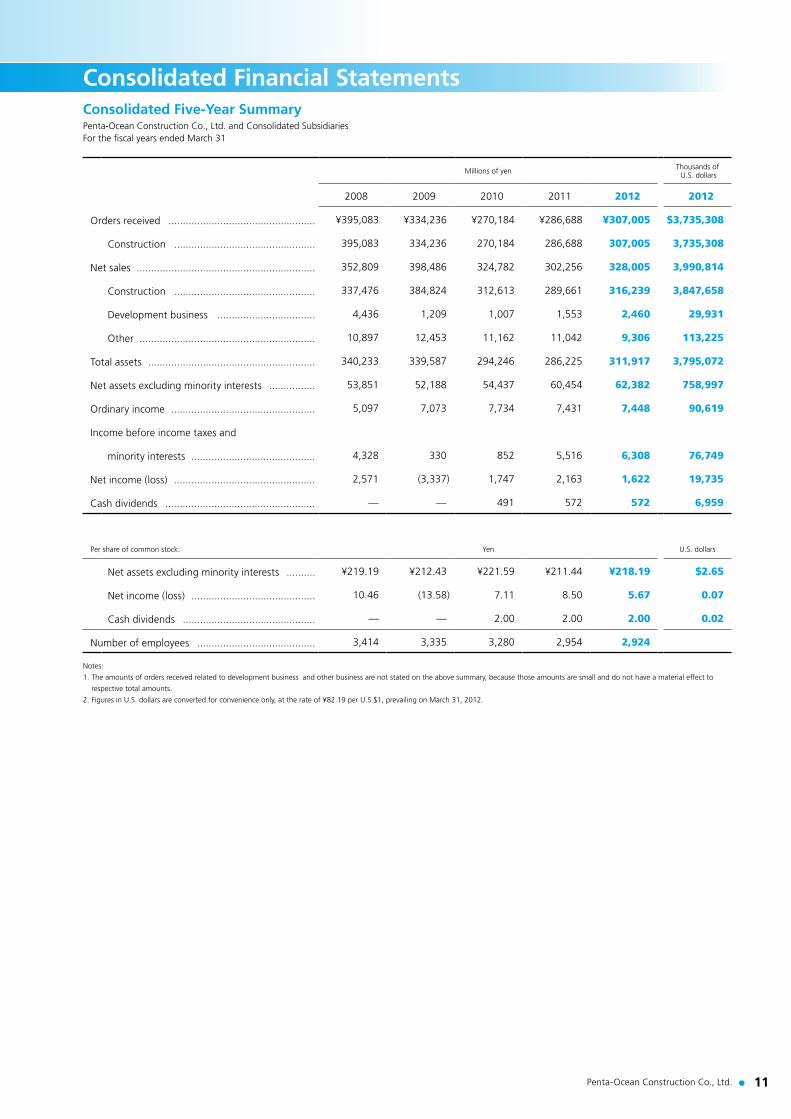
Consolidated Five-Year SummaryPenta-Ocean Construction Co., Ltd. and Consolidated SubsidiariesFor the fiscal years ended March 31
Consolidated Financial Statements
Millions of yen Thousands of U.S. dollars
2008 2009 2010 2011 2012 2012
Orders received ................................................... ¥395,083 ¥334,236 ¥270,184 ¥286,688 ¥307,005 $3,735,308
Construction ................................................. 395,083 334,236 270,184 286,688 307,005 3,735,308
Net sales .............................................................. 352,809 398,486 324,782 302,256 328,005 3,990,814
Construction ................................................. 337,476 384,824 312,613 289,661 316,239 3,847,658
Development business .................................. 4,436 1,209 1,007 1,553 2,460 29,931
Other ............................................................. 10,897 12,453 11,162 11,042 9,306 113,225
Total assets .......................................................... 340,233 339,587 294,246 286,225 311,917 3,795,072
Net assets excluding minority interests ................ 53,851 52,188 54,437 60,454 62,382 758,997
Ordinary income .................................................. 5,097 7,073 7,734 7,431 7,448 90,619
Income before income taxes and
minority interests ........................................... 4,328 330 852 5,516 6,308 76,749
Net income (loss) ................................................. 2,571 (3,337) 1,747 2,163 1,622 19,735
Cash dividends .................................................... — — 491 572 572 6,959
Per share of common stock: Yen U.S. dollars
Net assets excluding minority interests .......... ¥219.19 ¥212.43 ¥221.59 ¥211.44 ¥218.19 $2.65
Net income (loss) ........................................... 10.46 (13.58) 7.11 8.50 5.67 0.07
Cash dividends .............................................. — — 2.00 2.00 2.00 0.02
Number of employees ......................................... 3,414 3,335 3,280 2,954 2,924
Notes:
1. The amounts of orders received related to development business and other business are not stated on the above summary, because those amounts are small and do not have a material effect to
respective total amounts.
2. Figures in U.S. dollars are converted for convenience only, at the rate of ¥82.19 per U.S.$1, prevailing on March 31, 2012.

12 Penta-Ocean Construction Co., Ltd.
Financial Review
'11'10'09'08 '12 '11'10'09'08 '12
308
340
27529
4307
340
29431
2
4752 50
54
4954
5862
(3,1
16)
(12.
7)
(3,3
37)
1,39
02,
571
2,22
81,
747
10.5
7.1
(13.
6)
5.7
9.1
Total Assets¥ billion
Total Net Assets¥ billion
Net Income¥ million
Net Income per Share
Yen
ConsolidatedNon-Consolidated
ConsolidatedNon-Consolidated
'10
'09
'08 '12'11
26828
6
5660 1,
9242,
163
8.5
7.6
2,08
31,
622
'10
'09
'08 '12'11
5.7
7.3
Business PerformanceNet sales for the Group amounted to ¥328,005 million (US$3,990.8
million) during the consolidated fiscal year ended in March 2012, a
year-on-year increase of ¥25,749 million (US$313.3 million), or 8.5%.
Operating income came to ¥8,983 million (US$109.3 million), a year-
on-year decrease of ¥799 million (US$9.7 million), or 8.2%. Ordinary
income amounted to ¥7,448 million (US$90.6 million), an increase
of ¥17 million (US$0.2 million), or 0.2%, as non-operating income
improved. Net income totaled ¥1,622 million (US$19.7 million), a
decrease of ¥541 million (US$6.6 million), or 25.0%. Corporate tax
adjustments increased compared to the prior fiscal year in line with
revisions to Japanese tax laws, offsetting an improvement in the
Group’s extraordinary loss.
Segment InformationIn our domestic Civil Engineering Business, the implementation of
a supplementary budget for restoration and reconstruction projects
related to the Great East Japan Earthquake spurred expectations of
increased spending on public works. But orders received for such
projects were concentrated in the second half of the fiscal year.
As a result, the segment recorded net sales of ¥118,539 million
(US$1,442.3 million), a decrease of ¥3,496 million (US$42.5 million)
or 2.9% compared to the prior fiscal year. Operating income totaled
¥7,329 million (US$89.2 million) a year-on-year decrease of ¥2,596
million (US$31.6 million) or 26.2%.
Our domestic Building Construction Business recorded net sales
of ¥115,188 million (US$1,401.5 million), an increase of ¥25,765
million (US$313.5 million) or 28.8%, compared to the prior fiscal year.
The segment posted an operating loss of ¥1,284 million (US$15.6
million), compared to a loss of ¥2,078 million (US$25.3 million) in
the prior fiscal year. Housing investment slumped immediately after
the earthquake, but there were signs of a recovery later on, mainly
in urban centers. Meanwhile, the restoration of Japan’s industrial
supply chain fueled private-sector demand for capital investment.
However, investment levels were low, reflecting uncertainty about
the economy.
In our main overseas markets in Southeast Asia, including
Singapore and Hong Kong, demand remained strong for construction
projects centering on social infrastructure development. Net sales
in our Overseas Business segment amounted to ¥83,716 million
(US$1,018.6 million), an increase of ¥1,375 million (US$16.7 million)
or 1.7% compared to the prior fiscal year. Operating income totaled
¥3,500 million (US$42.6 million), a year-on-year increase of ¥839
million (US$10.2 million) or 31.5%.
Net sales in our domestic Development Business amounted
to ¥2,621 million (US$31.9 million), an increase of ¥940 million
(US$11.4 million), or 55.9%, compared to the prior fiscal year. The
segment posted an operating loss of ¥448 million (US$5.5 million), as
compared to a loss of ¥1,606 million (US$19.5 million) for the prior
fiscal year.
Net sales in the Group’s Other Business segment, which centers on
shipbuilding, equipment leasing and sales of finished goods, came
to ¥12,066 million (US$146.8 million), an increase of ¥1,273 million
(US$15.5 million), or 11.8%, compared to the prior fiscal year. Due to
the deterioration of the revenue-expenditure balance in our shipbuild-
ing business, operating income came to ¥18 million (US$0.2 million),
a decrease of ¥850 million (US$10.3 million), or 98.0%, compared to
the prior fiscal year.
Orders Received and Contract BacklogNon-consolidated construction orders received for domestic civil
engineering works increased by 12.2% compared to the prior fiscal
year to ¥108,477 million (US$1,319.8 million) on growth in orders
received from both the private sector and government agencies.

13Penta-Ocean Construction Co., Ltd.
'11'10'09'08 '12 '11'10'09'08 '12
308
340
27529
4307
340
29431
2
4752 50
54
4954
5862
(3,1
16)
(12.
7)
(3,3
37)
1,39
02,
571
2,22
81,
747
10.5
7.1
(13.
6)
5.7
9.1
Total Assets¥ billion
Total Net Assets¥ billion
Net Income¥ million
Net Income per Share
Yen
ConsolidatedNon-Consolidated
ConsolidatedNon-Consolidated
'10
'09
'08 '12'11
26828
6
5660 1,
9242,
163
8.5
7.6
2,08
31,
622
'10
'09
'08 '12'11
5.7
7.3
Orders received for domestic building construction increased by
13.1% to ¥101,561 million (US$1,235.7 million), as an expansion
in private-sector construction projects outweighed a decline in
public construction projects. The company received orders for
large land-based civil engineering and construction projects in
Singapore, yet orders received for overseas construction projects
overall decreased by 4.8% to ¥86,474 million (US$1,052.1 million).
In total, construction orders received during the period under review
increased by 7.1% to ¥296,513 million (US$3,607.7 million).
Financial PositionTotal assets for the Group increased by ¥25,692 million (US$312.6
million) compared to the prior consolidated fiscal year, to ¥311,917
million (US$3,795.1 million) on factors including an increase to
cash and deposits. Total liabilities expanded by ¥23,766 million
(US$289.2 million) to ¥249,531 million (US$3,036.0 million) as the
Group recorded increases in notes payable and accounts payable
for construction projects. Net assets increased by ¥1,926 million
(US$23.4 million) to ¥62,386 million (US$759.0 million) compared to
the prior fiscal year. This resulted as the Group recorded increases in
both consolidated net income and the revaluation reserve for land,
net of taxes.
Cash FlowsCash flows from operating activities increased by ¥24,823 million
(US$302.0 million) for a net inflow of ¥26,740 million (US$325.3
million) during the period under review (as compared to a net inflow
of ¥1,917 million, or US$23.3 million in the prior consolidated fiscal
year). The primary factor was ¥6,308 million (US$76.7 million) in net
income before income taxes (¥5,516 million, or US$67.1 million in the
prior consolidated fiscal year).
With respect to cash flows from investing activities, the Group
recorded a ¥2,442 million (US$29.7 million) year-on-year increase
in outlays due to purchases of property, plant and equipment. The
result was a net outflow of ¥11,586 million (US$141.0 million), as
compared to a net outflow of ¥9,144 million (US$111.3 million) in the
prior consolidated fiscal year.
Cash flows from financing activities underwent a ¥4,980 million
(US$60.6 million) increase compared to the prior consolidated fiscal
year, resulting in a net inflow of ¥1,738 million (US$21.1 million). This
was due to the Group’s issuance of corporate bonds, and compares
to a net outflow of ¥3,242 million (US$39.4 million) in the prior
consolidated fiscal year.
As a result of the foregoing, consolidated cash and cash equivalents
amounted to ¥62,712 million (US$763.0 million) as of the end of
the consolidated fiscal year under review, a year-on-year increase of
¥17,049 million (US$207.4 million), or 37.3%.
DividendsThe Company’s basic policy with respect to dividends is to offer
long-term, stable payouts to shareholders as circumstances allow, while
building a stronger management foundation for the future, and taking
into account the business environment, our earnings performance and
other factors. Furthermore, the Company’s policy is to utilize internal
reserves to invest in technological development, capital expenditures
and other value-enhancing activities, and to reward shareholders
through the future development of our business.
Having given full consideration to our earnings performance in the
fiscal year ended 2012, the progress made on strengthening our fiscal
health, and the future development of our business, the Company
distributed a shareholder dividend of ¥2 (US$0.02) per share.

14 Penta-Ocean Construction Co., Ltd.
Penta-Ocean Construction Co., Ltd. and Consolidated Subsidiaries
As of March 31, 2011 and 2012
Consolidated Balance Sheets
Millions of yen Thousands of U.S. dollars
2011 2012 2012
Current assets:
Cash and deposits (Note 22) ............................................................................................... ¥ 46,121 ¥ 63,371 $ 771,031
Short-term investment securities (Notes 3 (3), 5, 6 and 22) ....................................................... 2 — —
Trade receivables: (Note 22)
Notes .......................................................................................................................... 3,599 10,993 133,751
Accounts .................................................................................................................... 116,989 118,225 1,438,435
Inventories: (Note 3 (5))
Costs on uncompleted construction contracts ............................................................ 11,148 11,128 135,394
Real estate for sale and development projects in progress .......................................... 13,708 11,041 134,335
Other .......................................................................................................................... 2,429 1,864 22,679
Deferred tax assets (Note 18) .............................................................................................. 4,242 3,801 46,247
Other ................................................................................................................................ 2,953 2,331 28,360
Allowance for doubtful accounts (Note 3 (9)) ...................................................................... (1,346) (1,227) (14,929)
Total current assets ..................................................................................................... 199,845 221,527 2,695,304
Property, plant and equipment: (Notes 3 (6) and 3(8))
Land ................................................................................................................................. 41,762 43,613 530,636
Buildings and structures ................................................................................................... 31,205 31,768 386,519
Machinery, equipment and vehicles .................................................................................. 16,860 17,322 210,756
Dredgers and vessels ........................................................................................................ 49,460 51,185 622,764
Construction in progress .................................................................................................. 454 5,475 66,614
Total property, plant and equipment .......................................................................... 139,741 149,363 1,817,289
Less: accumulated depreciation ........................................................................................ (78,906) (80,856) (983,769)
Property, plant and equipment – net .......................................................................... 60,835 68,507 833,520
Intangible assets: (Note 3 (7)) ................................................................................................ 623 637 7,750
Investments and other assets:
Investment securities (Notes 3 (3), 5, 6 and 22) ......................................................................... 10,795 10,823 131,683
Long-term loans receivables ............................................................................................. 301 286 3,480
Deferred tax assets (Note 18) .............................................................................................. 9,480 6,807 82,820
Other (Notes 3 (12) and 21) ...................................................................................................... 12,334 9,568 116,413
Allowance for doubtful accounts (Note 3 (9)) ...................................................................... (7,988) (6,238) (75,897)
Total investments and other assets ............................................................................. 24,922 21,246 258,499
Total assets ........................................................................................................................ ¥286,225 ¥311,917 $3,795,072

15Penta-Ocean Construction Co., Ltd.
Millions of yen Thousands of U.S. dollars
2011 2012 2012
Current liabilities:
Short-term loans payable (Notes 7 and 22) ........................................................................... ¥ 27,422 ¥ 24,933 $ 303,358
Current portion of long-term loans payable (Notes 7 and 22) ............................................... 25,565 20,754 252,512
Trade payable: (Note 22)
Notes ......................................................................................................................... 24,916 32,164 391,337
Accounts ................................................................................................................... 71,082 83,481 1,015,708
Advance received on uncompleted construction contracts .............................................. 25,842 25,330 308,188
Deposits received ............................................................................................................ 9,166 11,014 134,007
Income taxes payable ...................................................................................................... 1,265 1,179 14,345
Provision for loss on construction contracts (Note 3 (11)) ..................................................... 2,233 2,939 35,759
Provision for warranties for completed construction (Note 3 (10)) ....................................... 720 642 7,811
Other provision ................................................................................................................ 1,015 1,225 14,904
Other ............................................................................................................................... 2,151 2,337 28,434
Total current liabilities ................................................................................................ 191,377 205,998 2,506,363
Non-current liabilities:
Bonds payable (Notes 7 and 22) ............................................................................................ — 10,000 121,669
Long-term loans payable (Notes 7 and 22) ............................................................................ 25,685 25,483 310,050
Provision for retirement benefits (Notes 3 (12) and 21) ............................................................ 333 324 3,942
Provision for directors’ retirement benefits (Note 3 (13)) ...................................................... 144 137 1,667
Deferred tax liabilities for land revaluation (Note 19 (2)) ...................................................... 7,156 6,251 76,055
Provision for loss on litigation (Note 3 (14)) ......................................................................... — 350 4,259
Other ............................................................................................................................... 1,070 988 12,021
Total non-current liabilities ........................................................................................ 34,388 43,533 529,663
Total liabilities ............................................................................................................ 225,765 249,531 3,036,026
Net assets: (Note 20)
Shareholders’ equity:
Capital stock ............................................................................................................. 30,450 30,450 370,483
Authorized - 599,135,000 shares
Issued shares
March 31, 2012 286,013,910 shares
March 31, 2011 286,013,910 shares
Capital surplus (Note 19 (1)) .......................................................................................... 18,387 18,387 223,714
Retained earnings (Note 19 (1)) ...................................................................................... 6,384 7,453 90,680
Less: treasury stock ................................................................................................... (23) (23) (280)
Total shareholders’ equity .......................................................................................... 55,198 56,267 684,597
Accumulated other comprehensive income:
Valuation difference on available-for-sale securities (Notes 3 (3) and 19 (3)) ...................... (126) (107) (1,302)
Deferred losses on hedges ......................................................................................... (8) (10) (122)
Revaluation reserve for land (Note 19 (2)) ...................................................................... 5,328 6,195 75,374
Foreign currency translation adjustments (Note 3 (2)) ................................................... 62 37 450
Total accumulated other comprehensive income ....................................................... 5,256 6,115 74,400
Minority interests ........................................................................................................... 6 4 49
Total net assets .......................................................................................................... 60,460 62,386 759,046
Total liabilities and net assets ......................................................................................... ¥286,225 ¥311,917 $3,795,072
Commitments and contingent liabilities (Note 17)
See accompanying Notes to Consolidated Financial Statements.

16 Penta-Ocean Construction Co., Ltd.
Penta-Ocean Construction Co., Ltd. and Consolidated Subsidiaries
For the two years ended March 31, 2012
Consolidated Statements of Income
Millions of yen Thousands of U.S. dollars
2011 2012 2012
Construction business: (Note 3(15))
Net sales ......................................................................................................................... ¥289,661 ¥316,239 $3,847,658
Cost of sales ................................................................................................................... 264,554 292,109 3,554,070
Gross profit ................................................................................................................... 25,107 24,130 293,588
Development business and other:
Net sales ......................................................................................................................... 12,595 11,766 143,156
Cost of sales ................................................................................................................... 12,401 11,712 142,499
Gross profit ................................................................................................................... 194 54 657
Total:
Total net sales ................................................................................................................. 302,256 328,005 3,990,814
Total cost of sales ........................................................................................................... 276,955 303,821 3,696,569
Total gross profit ............................................................................................................... 25,301 24,184 294,245
Selling, general and administrative expenses ............................................................... 15,519 15,201 184,949
Operating income .............................................................................................................. 9,782 8,983 109,296
Non-operating income:
Interest and dividends income ........................................................................................ 194 278 3,382
Other (Note 8) .................................................................................................................. 570 502 6,107
764 780 9,489
Non-operating expenses:
Interest expenses ............................................................................................................ 2,205 1,812 22,046
Other (Note 9) .................................................................................................................. 910 503 6,120
3,115 2,315 28,166
Ordinary income ................................................................................................................ 7,431 7,448 90,619
Extraordinary gain (Note 10) ............................................................................................... 1,196 437 5,317
Extraordinary loss (Note 11) ............................................................................................... 3,111 1,577 19,187
Income before income taxes and minority interests ..................................................... 5,516 6,308 76,749
Income taxes: (Notes 3 (19) and 18)
Current ......................................................................................................................... 1,671 1,593 19,382
Deferred ......................................................................................................................... 1,669 3,095 37,657
3,340 4,688 57,039
Income before minoity interests ..................................................................................... 2,176 1,620 19,710
Minority interests in income (loss) .................................................................................. 13 (2) (25)
Net income ......................................................................................................................... ¥ 2,163 ¥ 1,622 $ 19,735
Net income per share of common stock (Notes 3 (18) and 24) Yen U.S. dollars
Primary ..................................................................................................................... ¥8.50 ¥5.67 $0.07
See accompanying Notes to Consolidated Financial Statements.
17Penta-Ocean Construction Co., Ltd.
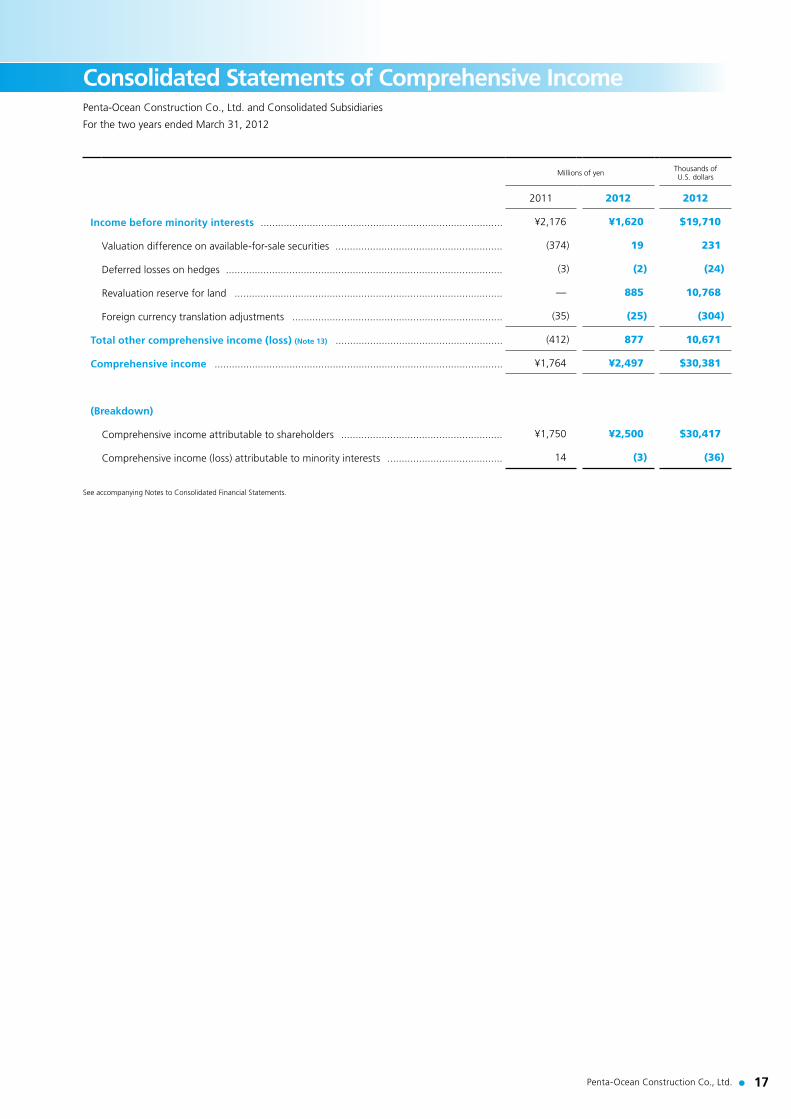
Penta-Ocean Construction Co., Ltd. and Consolidated Subsidiaries
For the two years ended March 31, 2012
Consolidated Statements of Comprehensive Income
Millions of yen Thousands of U.S. dollars
2011 2012 2012
Income before minority interests .................................................................................... ¥2,176 ¥1,620 $19,710
Valuation difference on available-for-sale securities .......................................................... (374) 19 231
Deferred losses on hedges ................................................................................................ (3) (2) (24)
Revaluation reserve for land ............................................................................................. — 885 10,768
Foreign currency translation adjustments ......................................................................... (35) (25) (304)
Total other comprehensive income (loss) (Note 13) .......................................................... (412) 877 10,671
Comprehensive income .................................................................................................... ¥1,764 ¥2,497 $30,381
(Breakdown)
Comprehensive income attributable to shareholders ........................................................ ¥1,750 ¥2,500 $30,417
Comprehensive income (loss) attributable to minority interests ........................................ 14 (3) (36)
See accompanying Notes to Consolidated Financial Statements.
18 Penta-Ocean Construction Co., Ltd.
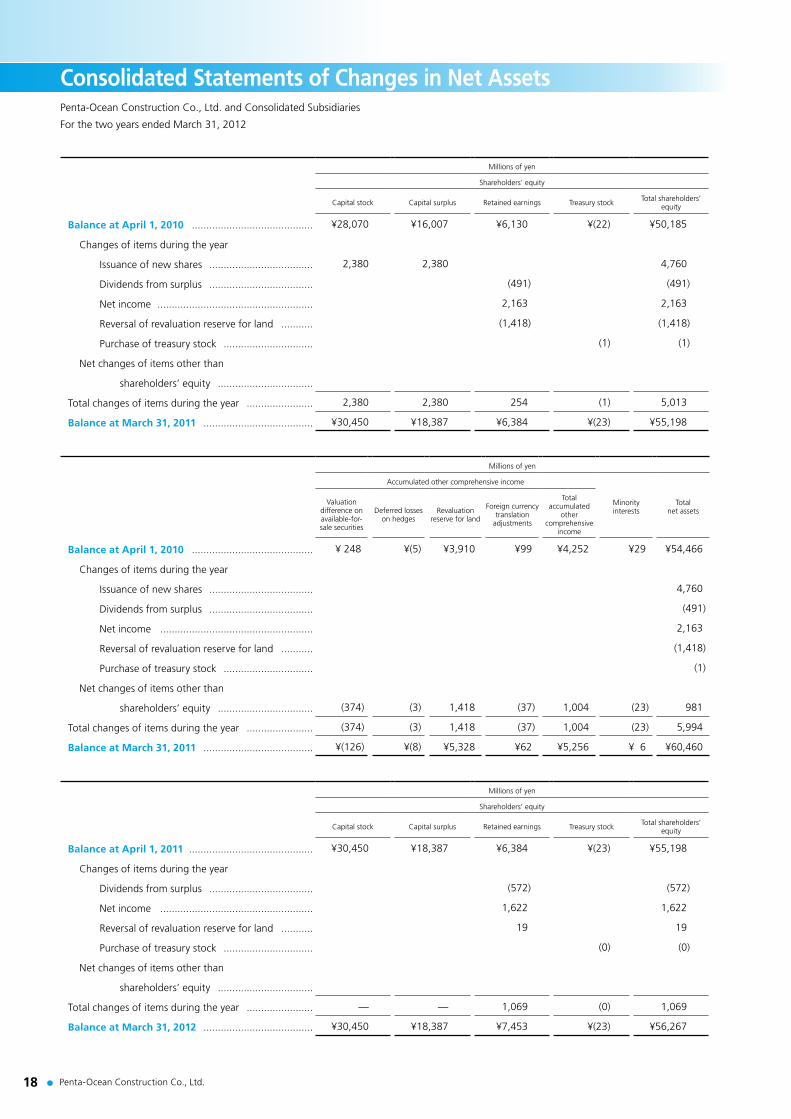
Penta-Ocean Construction Co., Ltd. and Consolidated Subsidiaries
For the two years ended March 31, 2012
Consolidated Statements of Changes in Net Assets
Millions of yen
Shareholders’ equity
Capital stock Capital surplus Retained earnings Treasury stock Total shareholders’ equity
Balance at April 1, 2010 .......................................... ¥28,070 ¥16,007 ¥6,130 ¥(22) ¥50,185
Changes of items during the year
Issuance of new shares .................................... 2,380 2,380 4,760
Dividends from surplus .................................... (491) (491)
Net income ...................................................... 2,163 2,163
Reversal of revaluation reserve for land ........... (1,418) (1,418)
Purchase of treasury stock ............................... (1) (1)
Net changes of items other than
shareholders’ equity .................................
Total changes of items during the year ....................... 2,380 2,380 254 (1) 5,013
Balance at March 31, 2011 ...................................... ¥30,450 ¥18,387 ¥6,384 ¥(23) ¥55,198
Millions of yen
Accumulated other comprehensive income
Minority interests
Total net assets
Valuation difference on available-for-sale securities
Deferred losses on hedges
Revaluation reserve for land
Foreign currency translation
adjustments
Total accumulated
other comprehensive
income
Balance at April 1, 2010 .......................................... ¥ 248 ¥(5) ¥3,910 ¥99 ¥4,252 ¥29 ¥54,466
Changes of items during the year
Issuance of new shares .................................... 4,760
Dividends from surplus .................................... (491)
Net income ..................................................... 2,163
Reversal of revaluation reserve for land ........... (1,418)
Purchase of treasury stock ............................... (1)
Net changes of items other than
shareholders’ equity ................................. (374) (3) 1,418 (37) 1,004 (23) 981
Total changes of items during the year ....................... (374) (3) 1,418 (37) 1,004 (23) 5,994
Balance at March 31, 2011 ...................................... ¥(126) ¥(8) ¥5,328 ¥62 ¥5,256 ¥ 6 ¥60,460
Millions of yen
Shareholders’ equity
Capital stock Capital surplus Retained earnings Treasury stock Total shareholders’ equity
Balance at April 1, 2011 ........................................... ¥30,450 ¥18,387 ¥6,384 ¥(23) ¥55,198
Changes of items during the year
Dividends from surplus .................................... (572) (572)
Net income ..................................................... 1,622 1,622
Reversal of revaluation reserve for land ........... 19 19
Purchase of treasury stock ............................... (0) (0)
Net changes of items other than
shareholders’ equity .................................
Total changes of items during the year ....................... — — 1,069 (0) 1,069
Balance at March 31, 2012 ...................................... ¥30,450 ¥18,387 ¥7,453 ¥(23) ¥56,267
19Penta-Ocean Construction Co., Ltd.
Millions of yen
Accumulated other comprehensive income
Minority interests
Total net assets
Valuation difference on available-for-sale securities
Deferred losses on hedges
Revaluation reserve for land
Foreign currency translation
adjustments
Total accumulated
other comprehensive
income
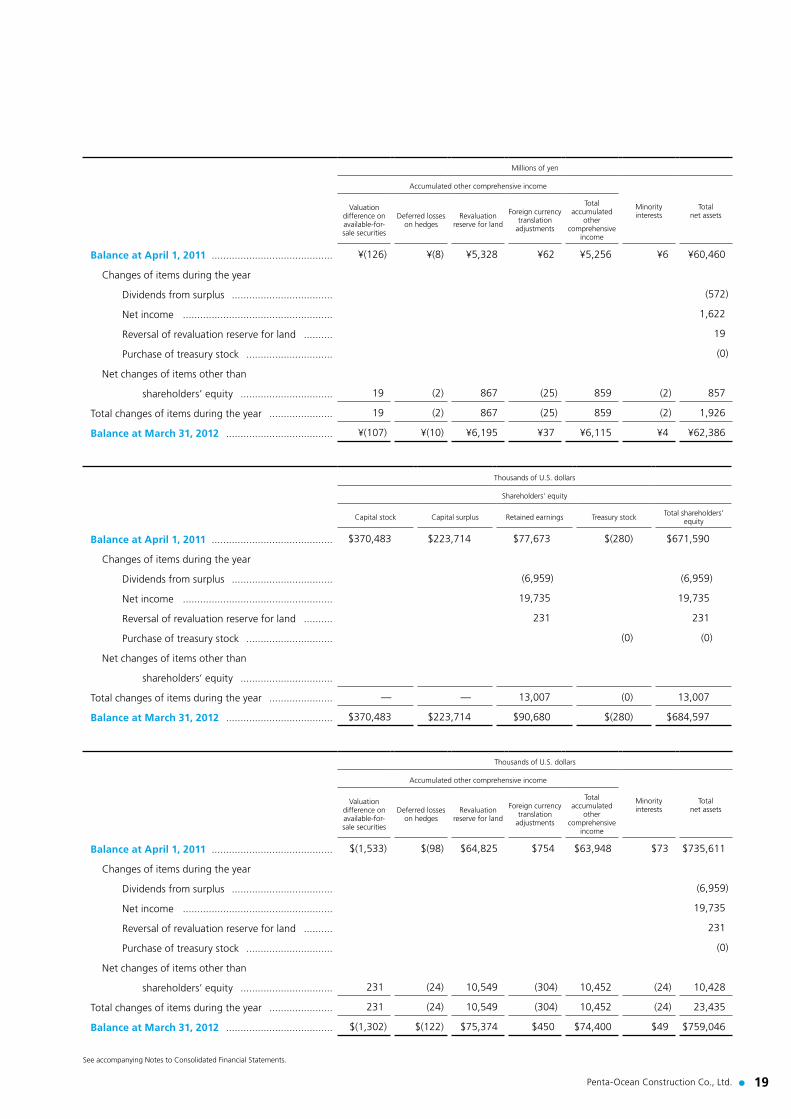
Balance at April 1, 2011 .......................................... ¥(126) ¥(8) ¥5,328 ¥62 ¥5,256 ¥6 ¥60,460
Changes of items during the year
Dividends from surplus ................................... (572)
Net income .................................................... 1,622
Reversal of revaluation reserve for land .......... 19
Purchase of treasury stock .............................. (0)
Net changes of items other than
shareholders’ equity ................................ 19 (2) 867 (25) 859 (2) 857
Total changes of items during the year ...................... 19 (2) 867 (25) 859 (2) 1,926
Balance at March 31, 2012 ..................................... ¥(107) ¥(10) ¥6,195 ¥37 ¥6,115 ¥4 ¥62,386
Thousands of U.S. dollars
Shareholders’ equity
Capital stock Capital surplus Retained earnings Treasury stock Total shareholders’ equity
Balance at April 1, 2011 .......................................... $370,483 $223,714 $77,673 $(280) $671,590
Changes of items during the year
Dividends from surplus ................................... (6,959) (6,959)
Net income .................................................... 19,735 19,735
Reversal of revaluation reserve for land .......... 231 231
Purchase of treasury stock .............................. (0) (0)
Net changes of items other than
shareholders’ equity ................................
Total changes of items during the year ...................... — — 13,007 (0) 13,007
Balance at March 31, 2012 ..................................... $370,483 $223,714 $90,680 $(280) $684,597
Thousands of U.S. dollars
Accumulated other comprehensive income
Minority interests
Total net assets
Valuation difference on available-for-sale securities
Deferred losses on hedges
Revaluation reserve for land
Foreign currency translation
adjustments
Total accumulated
other comprehensive
income
Balance at April 1, 2011 .......................................... $(1,533) $(98) $64,825 $754 $63,948 $73 $735,611
Changes of items during the year
Dividends from surplus ................................... (6,959)
Net income .................................................... 19,735
Reversal of revaluation reserve for land .......... 231
Purchase of treasury stock .............................. (0)
Net changes of items other than
shareholders’ equity ................................ 231 (24) 10,549 (304) 10,452 (24) 10,428
Total changes of items during the year ...................... 231 (24) 10,549 (304) 10,452 (24) 23,435
Balance at March 31, 2012 ..................................... $(1,302) $(122) $75,374 $450 $74,400 $49 $759,046
See accompanying Notes to Consolidated Financial Statements.
20 Penta-Ocean Construction Co., Ltd.
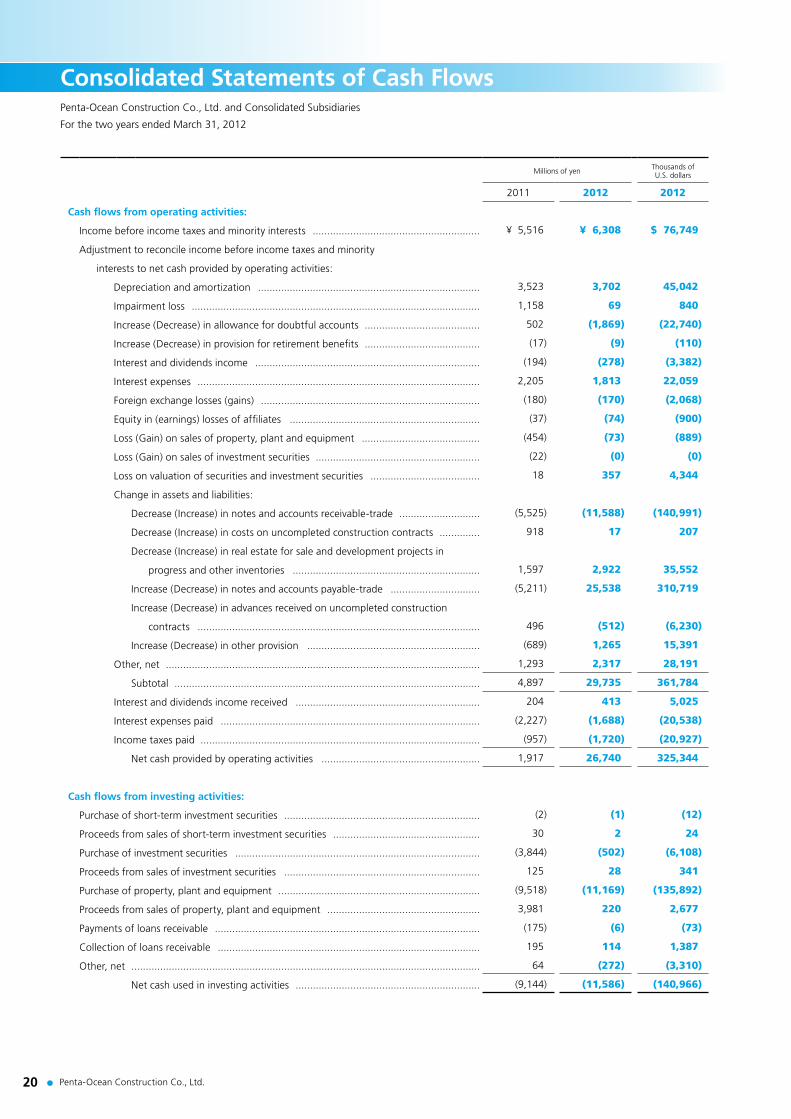
Penta-Ocean Construction Co., Ltd. and Consolidated Subsidiaries
For the two years ended March 31, 2012
Consolidated Statements of Cash Flows
Millions of yen Thousands of U.S. dollars
2011 2012 2012
Cash flows from operating activities:
Income before income taxes and minority interests .......................................................... ¥ 5,516 ¥ 6,308 $ 76,749
Adjustment to reconcile income before income taxes and minority
interests to net cash provided by operating activities:
Depreciation and amortization ............................................................................. 3,523 3,702 45,042
Impairment loss .................................................................................................... 1,158 69 840
Increase (Decrease) in allowance for doubtful accounts ........................................ 502 (1,869) (22,740)
Increase (Decrease) in provision for retirement benefits ........................................ (17) (9) (110)
Interest and dividends income .............................................................................. (194) (278) (3,382)
Interest expenses .................................................................................................. 2,205 1,813 22,059
Foreign exchange losses (gains) ............................................................................ (180) (170) (2,068)
Equity in (earnings) losses of affiliates .................................................................. (37) (74) (900)
Loss (Gain) on sales of property, plant and equipment ......................................... (454) (73) (889)
Loss (Gain) on sales of investment securities ......................................................... (22) (0) (0)
Loss on valuation of securities and investment securities ...................................... 18 357 4,344
Change in assets and liabilities:
Decrease (Increase) in notes and accounts receivable-trade ............................ (5,525) (11,588) (140,991)
Decrease (Increase) in costs on uncompleted construction contracts .............. 918 17 207
Decrease (Increase) in real estate for sale and development projects in
progress and other inventories ................................................................. 1,597 2,922 35,552
Increase (Decrease) in notes and accounts payable-trade ............................... (5,211) 25,538 310,719
Increase (Decrease) in advances received on uncompleted construction
contracts .................................................................................................. 496 (512) (6,230)
Increase (Decrease) in other provision ............................................................ (689) 1,265 15,391
Other, net ............................................................................................................. 1,293 2,317 28,191
Subtotal .......................................................................................................... 4,897 29,735 361,784
Interest and dividends income received ................................................................ 204 413 5,025
Interest expenses paid .......................................................................................... (2,227) (1,688) (20,538)
Income taxes paid ................................................................................................. (957) (1,720) (20,927)
Net cash provided by operating activities ....................................................... 1,917 26,740 325,344
Cash flows from investing activities:
Purchase of short-term investment securities .................................................................... (2) (1) (12)
Proceeds from sales of short-term investment securities ................................................... 30 2 24
Purchase of investment securities ..................................................................................... (3,844) (502) (6,108)
Proceeds from sales of investment securities .................................................................... 125 28 341
Purchase of property, plant and equipment ...................................................................... (9,518) (11,169) (135,892)
Proceeds from sales of property, plant and equipment ..................................................... 3,981 220 2,677
Payments of loans receivable ............................................................................................ (175) (6) (73)
Collection of loans receivable ........................................................................................... 195 114 1,387
Other, net ......................................................................................................................... 64 (272) (3,310)
Net cash used in investing activities ................................................................ (9,144) (11,586) (140,966)

21Penta-Ocean Construction Co., Ltd.
Millions of yen Thousands of U.S. dollars
2011 2012 2012
Cash flows from financing activities:
Net increase (decrease) in short-term loans payable ......................................................... (602) (2,490) (30,296)
Proceeds from long-term loans payable ............................................................................ 19,090 20,571 250,286
Repayment of long-term loans payable ............................................................................ (25,657) (25,582) (311,254)
Proceeds from issuance bonds payable ............................................................................. — 10,000 121,669
Proceeds from issuance of common stock ........................................................................ 4,760 — —
Cash dividends paid .......................................................................................................... (483) (565) (6,874)
Other, net ......................................................................................................................... (350) (196) (2,385)
Net cash provided by (used in) financing activities (3,242) 1,738 21,146
Effect of exchange rate change on cash and cash equivalents .................................... 201 157 1,910
Net increase (decrease) in cash and cash equivalents .................................................. (10,268) 17,049 207,434
Cash and cash equivalents at the beginning of the period .......................................... 55,931 45,663 555,579
Cash and cash equivalents at the end of the period ..................................................... ¥45,663 ¥62,712 $763,013
(Note) Cash and cash equivalents are comprised as follows:
Cash and deposits ............................................................................................................ ¥46,121 ¥63,371 $771,031
Less-Time deposits with maturity over three months ....................................................... (458) (659) (8,018)
Cash and cash equivalents (Note 3(17)) ................................................................................. ¥45,663 ¥62,712 $763,013
See accompanying Notes to Consolidated Financial Statements.

22 Penta-Ocean Construction Co., Ltd.
Penta-Ocean Construction Co., Ltd. and Consolidated Subsidiaries
Notes to Consolidated Financial Statements
1. Basis of preparation of consolidated financial statements
The accompanying consolidated financial statements of Penta-Ocean
Construction Co., Ltd. (the “Company”) and consolidated subsidiaries
are prepared on the basis of accounting principles generally accepted
in Japan, which are different in certain respects as to the application
and disclosure requirements of International Financial Reporting
Standards, and are compiled from the consolidated financial
statements prepared by the Company as required by the Financial
Instruments and Exchange Law of Japan.
The accounting principles and practices adopted by the overseas
consolidated subsidiaries conform to those adopted by the Company.
The figures in these financial statements are shown in U.S. dollars
at the conversion rate of U.S.$1=¥82.19, the exchange rate prevailing
on March 31, 2012. This is solely for the convenience of readers
outside Japan and does not mean that assets and liabilities originating
in yen can be converted into or settled in dollars at the above rate.
2. Consolidation
(1) Scope of consolidation and application of equity method
The Company has 24 subsidiaries and 3 affiliated companies as at
March 31, 2012.
The Company consolidated all subsidiaries and applied the equity
method to 2 affiliated companies.
One affiliated company was not included in the scope of equity
method, since it has a small impact on consolidated financial
statements and insignificant on the whole.
(2) Consolidated closing date
Consolidated closing date is March 31.
Closing date for the Company, 10 domestic subsidiaries and 7
overseas subsidiaries including Andromeda Five Pte Ltd. is March 31.
Closing date for other 7 overseas subsidiaries is December 31. The
Company compiled the consolidated financial statements using the
financial statements of each company’s closing date, and adjustments
were made for any material difference incurred between the closing
date and the consolidated closing date.
(3) Goodwill
Goodwill is amortized over five years by the straight-line method.
3. Summary of significant accounting policies
(1) Conversion method of foreign currency transactions of
the Company and its domestic subsidiaries and affiliated
companies
Transactions in foreign currencies are converted into yen at the
exchange rate prevailing at the time of the transactions. Monetary
receivables and payables denominated in foreign currencies including
foreign cash are converted into yen at the exchange rate prevailing
on the closing date. Non-monetary items denominated in foreign
currencies are converted into yen at the historical rate. Held-to-
maturity bonds denominated in foreign currencies are translated into
yen at the exchange rate prevailing on the closing date, securities
for purpose of sale and investment securities other than the
above are converted into yen from the fair value based on foreign
currencies at the exchange rate prevailing on the closing date and
stock of subsidiaries and affiliated companies at the exchange rate
prevailing at the time of acquisition by the Company, and those are
written down, when declined remarkably. The valuation amount of
derivative financial instruments resulting from derivative transactions
denominated in foreign currencies are translated at the exchange rate
prevailing on the closing date based on the fair value or the actual
value estimated in foreign currencies excluding those applying hedge
accounting. Exchange gains or losses, realized or unrealized, are
included in current income.
(2) Conversion method of financial statements of overseas
subsidiaries stated in foreign currency
Financial statements stated in foreign currency are translated into
yen at the exchange rate prevailing on the closing date except for
the components of Net assets which are translated at the exchange
rate prevailing at the time of acquisition by the Company and at the
historical rate to their increase thereafter.
Exchange differences arising from conversion of balance sheet
accounts are stated as foreign currency translation adjustments in
Net assets.
(3) Investment securities
Held-to-maturity bonds are determined by the amortized cost
method.
Other securities with fair value are stated at fair value based on the
market price at the closing date. Valuation differences are included in
Net assets as valuation difference on available-for-sale securities and
cost of sales are determined by the moving average method.
Other investment securities with no fair value are stated at moving
average cost.
(4) Derivative financial transactions
Derivative financial instruments are stated at fair value.
Hedge accounting is adopted for derivative financial instruments
which conform to requirements of hedge accounting.

23Penta-Ocean Construction Co., Ltd.
(5) Inventories
Inventories are stated at identified cost, except for raw materials and
supplies which are stated at cost determined by the first-in first-out
method.
In the case that the net realizable value falls below the historical
cost at the end of the year, inventories except for cost on uncompleted
construction contracts are carried at the net realizable value on the
closing date.
(6) Property, plant, equipment and Depreciation (excluding
leased assets)
Property, plant and equipment are stated at cost and for the Company
and domestic subsidiaries. Depreciation is calculated using the
declining balance method, except for buildings (other than building
fixtures) acquired on and after April 1, 1998, which are calculated
by the straight-line method. The straight-line method is applied to
property, plant and equipment of overseas subsidiaries.
The Company and domestic subsidiaries primarily use the useful
lives and the residual value in accordance with the Corporation
Tax Law.
(7) Research and development costs and computer software
Research and development costs are charged to income as incurred.
Computer software purchased for internal use is amortized by the
straight-line method over 5 years, the estimated useful life.
(8) Leased assets
For leased assets under finance lease transactions that transfer
ownership, the depreciation expense is calculated based on the
same depreciation method as is applied to fixed assets owned by the
Company and subsidiaries.
For leased assets under finance lease transactions that do not
transfer ownership, the depreciation expense is calculated under the
straight-line method based on the assumption that the useful life
equals to the lease term and the residual value equals to zero.
(9) Allowance for doubtful accounts
Allowance for doubtful accounts is accounted for using the estimated
doubtful account ratio determined based on the past actual bad debt
losses for general receivable and the individual estimated uncollectible
amount for any specific doubtful receivables.
(10) Provision for warranties for completed construction
The Company provides provision for the costs of repairs for damages
related to completed construction works based on actual damages
in the past and estimated amount of compensation for damages in
the future.
(11) Provision for loss on construction contracts
The Company provides provision for future losses from construction
contracts outstanding at the fiscal year end.
(12) Provision for retirement benefits
Provision for retirement benefits is provided for on an accrual basis
based on the projected benefit obligations and pension fund assets
at end of the fiscal year.
However, in case the amount of pension fund assets exceeds the
amount of retirement benefit obligations plus/minus unrecognized
transition obligations and unrecognized actuarial gains or losses, the
balance is recorded as Prepaid Pension Cost on the Investments and
other assets. Regarding lump-sum severance indemnity plan for some
of the consolidated subsidiaries, the amount is calculated based on
simplified method (method to assume required payment amount
based on voluntary termination of employment on the closing date as
retirement benefit obligations).
Effects of the application of the new accounting standards for
retirement benefits are equally amortized over 15 years.
Prior service costs are recognized as an expense when incurred.
Actuarial gains or losses are equally amortized by the straight-line
method over the average remaining employees’ service years, which
should be within 10 years and its amortization starts in the next year
of the respective accrual years.
(Additional information)
Effective from the current fiscal year ended March 31, 2012, the
company has revised its retirement benefit rules. In line with this
revision, prior service cost increased by ¥290 million (U.S. $3,528
thousand).
(13) Provision for directors’ retirement benefits
Some subsidiaries provide provision for the amount required to be
paid in accordance with internal rules for payment of severance
benefits to directors and statutory auditors on the closing date.
(14) Provision for loss on litigation
To provide provision for losses on litigation, the estimated amount to
be incurred in the future is calculated.
(15) Recognition of sales and cost of sales
The Company recognizes revenue by applying the percentage-of-
completion method for the construction projects with condition
that the outcome of the construction activity is deemed certain
at the end of the reporting year. To estimate the progress of such
construction projects, the method to calculate the percentage of the
cost incurred to the estimated total cost (= cost proportion method)
has been applied.
For other construction projects, the completed-contract method
has been applied.
(16) Hedge accounting
1) Derivative transactions are accounted for primarily using deferral
hedge accounting. The special method is applied to interest
rate swap agreements that meet the requirements for special
treatment.

24 Penta-Ocean Construction Co., Ltd.
2) Hedge instruments and hedged items
Hedge instruments are interest rate swap agreements and forward
exchange contracts.
Hedged items are interest on bank loans and monetary
receivables and payables denominated in foreign currencies.
3) The Company enters into interest rate swap agreements and
forward exchange contracts to hedge risk from fluctuations in
interest rate and forward exchange rates, respectively.
4) Evaluation of the effectiveness of hedge accounting
Control procedures for hedge transactions are executed according
to the Company’s bylaw. The Examination Committee of Derivative
Instruments and the Financial Division in the Company periodically
evaluates the effectiveness of hedging.
(17) Cash and cash equivalents
Cash and cash equivalents in the statements of cash flows, consist
of cash, deposits which can be drawn out freely and easily converted
into cash and short-term investments which have an original
maturity of three months or less and are not exposed to significant
valuation risks.
(18) Net income per share
Primary net income per share is calculated by the weighted average
number of outstanding common stocks during the year.
Net income per share assuming full dilution is not presented
because there were no potential stocks as of March 31, 2012.
(19) Income taxes
The Company and consolidated domestic subsidiaries declare
corporation and other taxes on the basis of taxable income calculated
under the provisions of the Corporation Tax Law and other tax
regulations. Taxable income thus calculated is different from earnings
in the account book.
Japanese corporation and other taxes applicable to the Company
and consolidated domestic subsidiaries comprise (a) corporation tax
of 30.0 percent on taxable income, (b) enterprise tax of 7.6 percent
on taxable income after certain adjustments, and (c) prefectural and
municipal taxes averaging 20.4 percent of corporation tax. Enterprise
tax paid is deductible for income tax purposes.
Foreign subsidiaries declare income taxes at the rate applicable
in each country. Foreign tax credit related to the amount of income
taxes paid to foreign tax offices by the Company directly or indirectly,
is subject to certain limitations in accordance with Japanese tax
regulations.
(20) Consumption tax
Consumption tax is eliminated from sales and purchases stated in the
statements of income. Consumption tax is usually levied at the rate of
5 percent on all transactions in connection with sales and purchases,
except for tax-free transactions.
(21) Adoption of consolidated taxation system
Effective from the current fiscal year, the Company and some of its
consolidated subsidiaries have adopted consolidated taxation system.
(22) Reclassifications
Certain amounts in prior year’s consolidated financial statements and
related footnotes have been reclassified to conform to the presenta-
tion in the current year.
(23) Accounting method for deferred assets
Stock issuance cost is recognized as an expense when incurred.
4. Additional information
Effective from the current fiscal year, Accounting Standards Board
of Japan Statement No.24, “Accounting Standard for Accounting
Changes and Error Corrections” and Accounting Standards Board
of Japan Statement Guidance No.24 “Guidance on Accounting
Standard for Accounting Changes and Error Corrections” both issued
on December 4, 2009 have been adopted.

25Penta-Ocean Construction Co., Ltd.
5. Investment securities
(1) Held-to maturity debt securities
As of March 31, 2011 Millions of yen
Book value on consolidated B/S Fair value Difference
Securities whose book value on consolidated B/S exceeds their fair value:
National and local government bonds ....................................................................... ¥113 ¥116 ¥ 3
Corporate bonds ....................................................................................................... — — —
Other ......................................................................................................................... — — —
Subtotal ..................................................................................................................... ¥113 ¥116 ¥ 3
Securities whose book value on consolidated B/S doesn’t exceed their fair value:
National and local government bonds ....................................................................... ¥ 69 ¥ 68 ¥(1)
Corporate bonds ....................................................................................................... 10 10 —
Other ......................................................................................................................... — — —
Subtotal ..................................................................................................................... ¥ 79 ¥ 78 ¥(1)
Total ................................................................................................................ ¥192 ¥194 ¥ 2
As of March 31, 2012 Millions of yen
Book value on consolidated B/S Fair value Difference
Securities whose book value on consolidated B/S exceeds their fair value:
National and local government bonds ....................................................................... ¥183 ¥189 ¥ 6
Corporate bonds ....................................................................................................... — — —
Other ......................................................................................................................... — — —
Subtotal ..................................................................................................................... ¥183 ¥189 ¥ 6
Securities whose book value on consolidated B/S doesn’t exceed their fair value:
National and local government bonds ....................................................................... ¥ 8 ¥ 8 ¥(0)
Corporate bonds ....................................................................................................... 10 10 —
Other ......................................................................................................................... — — —
Subtotal ..................................................................................................................... ¥ 18 ¥ 18 ¥(0)
Total ................................................................................................................ ¥201 ¥207 ¥ 6
As of March 31, 2012 Thousands of U.S. dollars
Book value on consolidated B/S Fair value Difference
Securities whose book value on consolidated B/S exceeds their fair value:
National and local government bonds ....................................................................... $2,227 $2,300 $73
Corporate bonds ....................................................................................................... — — —
Other ......................................................................................................................... — — —
Subtotal ..................................................................................................................... $2,227 $2,300 $73
Securities whose book value on consolidated B/S doesn’t exceed their fair value:
National and local government bonds ....................................................................... $ 97 $ 97 $ (0)
Corporate bonds ....................................................................................................... 122 122 —
Other ......................................................................................................................... — — —
Subtotal ..................................................................................................................... $ 219 $ 219 $ (0)
Total ................................................................................................................ $2,446 $2,519 $73

26 Penta-Ocean Construction Co., Ltd.
(2) Other securities
As of March 31, 2011 Millions of yen
Book value on consolidated B/S Acquisition cost Difference
Securities whose book value on consolidated B/S exceeds their acquisition cost:Stock ......................................................................................................................... ¥2,051 ¥1,598 ¥ 453 Bonds ........................................................................................................................ National and local government bonds ................................................................. — — — Corporate bonds ................................................................................................. — — — Other ................................................................................................................... — — —Other ......................................................................................................................... 82 61 21 Subtotal ..................................................................................................................... ¥2,133 ¥1,659 ¥ 474
Securities whose book value on consolidated B/S doesn’t exceed their acquisition cost:Stock ......................................................................................................................... ¥4,902 ¥5,493 ¥(591)Bonds ........................................................................................................................ National and local government bonds ................................................................. — — — Corporate bonds ................................................................................................. — — — Other ................................................................................................................... — — —Other ......................................................................................................................... 223 233 (10)Subtotal ..................................................................................................................... ¥5,125 ¥5,726 ¥(601)
Total ................................................................................................................ ¥7,258 ¥7,385 ¥(127)
(Note) Since unlisted stocks and investments in silent partnership for development investment business (balance on consolidated balance sheet ¥3,131 million) have no market value, have no estimated
future cash flows and are quite difficult to determine the fair value, they are not included in “Other securities” above.
As of March 31, 2012 Millions of yen
Book value on consolidated B/S Acquisition cost Difference
Securities whose book value on consolidated B/S exceeds their acquisition cost:Stock ......................................................................................................................... ¥2,562 ¥1,974 ¥ 588 Bonds ........................................................................................................................ National and local government bonds ................................................................. — — — Corporate bonds ................................................................................................. — — — Other ................................................................................................................... — — —Other ......................................................................................................................... 76 61 15 Subtotal ..................................................................................................................... ¥2,638 ¥2,035 ¥ 603
Securities whose book value on consolidated B/S doesn’t exceed their acquisition cost:Stock ......................................................................................................................... ¥4,527 ¥5,227 ¥(700)Bonds ........................................................................................................................ National and local government bonds ................................................................. — — — Corporate bonds ................................................................................................. 100 100 — Other ................................................................................................................... — — —Other ......................................................................................................................... 127 137 (10)Subtotal ..................................................................................................................... ¥4,754 ¥5,464 ¥(710)
Total ................................................................................................................ ¥7,392 ¥7,499 ¥(107)
As of March 31, 2012 Thousands of U.S. dollars
Book value on consolidated B/S Acquisition cost Difference
Securities whose book value on consolidated B/S exceeds their acquisition cost:Stock ......................................................................................................................... $31,172 $24,018 $7,154 Bonds ........................................................................................................................ National and local government bonds ................................................................. — — — Corporate bonds ................................................................................................. — — — Other ................................................................................................................... — — —Other ......................................................................................................................... 925 742 183 Subtotal ..................................................................................................................... $32,097 $24,760 $7,337
Securities whose book value on consolidated B/S doesn’t exceed their acquisition cost:Stock ......................................................................................................................... $55,080 $63,597 $(8,517)Bonds ........................................................................................................................ National and local government bonds ................................................................. — — — Corporate bonds ................................................................................................. 1,217 1,217 — Other ................................................................................................................... — — —Other ......................................................................................................................... 1,545 1,667 (122)Subtotal ..................................................................................................................... $57,842 $66,481 $(8,639)
Total ................................................................................................................ $89,938 $91,240 $(1,302)
(Note) Since unlisted stocks (balance on consolidated balance sheet ¥3,124 million (U.S. $38,009 thousand) have no market value, have no estimated future cash flows and are quite difficult to
determine the fair value, they are not included in “Other securities” above.

27Penta-Ocean Construction Co., Ltd.
(3) Other securities sold during the fiscal year
As of March 31, 2011 Millions of yen
Sales value Total of gain on sale Total of loss on sale
Stock ......................................................................................................................... ¥22 ¥22 ¥—
Bonds ........................................................................................................................
National and local government bonds ................................................................. — — —
Corporate bonds ................................................................................................. — — —
Other ................................................................................................................... — — —
Other ......................................................................................................................... — — —
Total ................................................................................................................ ¥22 ¥22 ¥—
As of March 31, 2012 Millions of yen
Sales value Total of gain on sale Total of loss on sale
Stock ......................................................................................................................... ¥28 ¥0 ¥—
Bonds ........................................................................................................................
National and local government bonds ................................................................. — — —
Corporate bonds ................................................................................................. — — —
Other ................................................................................................................... — — —
Other ......................................................................................................................... — — —
Total ................................................................................................................ ¥28 ¥0 ¥—
As of March 31, 2012 Thousands of U.S. dollars
Sales value Total of gain on sale Total of loss on sale
Stock ......................................................................................................................... $341 $0 $—
Bonds
National and local government bonds ................................................................. — — —
Corporate bonds ................................................................................................. — — —
Other ................................................................................................................... — — —
Other ......................................................................................................................... — — —
Total ................................................................................................................ $341 $0 $—
(4) Impairment of investment securities
Millions of yen Thousands of U.S. dollars
2011 2012 2012
Other securities
Stock ................................................................................................................... ¥18 ¥357 $4,344
6. Pledged assets
The following assets are pledged for fulfillment of construction contracts at March 31, 2011 and 2012.
Millions of yen Thousands of U.S. dollars
2011 2012 2012
Short-term investment securities ................................................................................... ¥ 1 ¥ — $ —
Investment securities ..................................................................................................... 280 272 3,309
Total .................................................................................................................. ¥281 ¥272 $3,309

28 Penta-Ocean Construction Co., Ltd.
7. Short-term loans, long-term loans and bonds payable
Short-term loans are represented primarily in the form of overdraft facility notes. The weighted average interest rates are 1.45% for the fiscal year
2011 and 1.05% for the fiscal year 2012, respectively. Long-term loans as of March 31, 2011 and 2012 are summarized as follows:
Millions of yen Thousands of U.S. dollars
2011 2012 2012
Long-term loans from banks and insurance companies due through 2026 ..................... ¥51,250 ¥46,237 $562,562
(The weighted average interest rate is 2.40%.)
1.25% unsecured bonds payable due 2014 .................................................................... — 10,000 121,669
Less: current portion ...................................................................................................... (25,565) (20,754) (252,512)
Net ........................................................................................................................... ¥25,685 ¥35,483 $431,719
The aggregate annual maturity of long-term loans and bonds payable after March 31, 2012 is as follows:
Year ending March 31,
2013 ............................................................................................................................................................ ¥20,754 $252,512
2014 ............................................................................................................................................................ 13,900 169,120
2015 ............................................................................................................................................................ 17,224 209,564
2016 ............................................................................................................................................................ 3,099 37,705
2017 ............................................................................................................................................................ 1,144 13,919
2018 and thereafter .................................................................................................................................... 116 1,411
Total ................................................................................................................................................ ¥56,237 $684,231
8. Non-operating income
The composition of Non-operating income–other for the fiscal years ended March 31, 2011 and 2012 is as follows:
Millions of yen Thousands of U.S. dollars
2011 2012 2012
Real estate rent .............................................................................................................. ¥ 67 ¥ 70 $ 852
Equity in earnings of affiliates ......................................................................................... 37 74 900
Other .............................................................................................................................. 466 358 4,356
Total ................................................................................................................... ¥570 ¥502 $6,108
9. Non-operating expenses
The composition of Non-operating expenses–other for the fiscal years ended March 31, 2011 and 2012 is as follows:
Millions of yen Thousands of U.S. dollars
2011 2012 2012
Foreign exchange losses ................................................................................................. ¥230 ¥183 $2,227
Other .............................................................................................................................. 680 320 3,893
Total ................................................................................................................... ¥910 ¥503 $6,120
10. Extraordinary gain
The composition of Extraordinary gain for the fiscal years ended March 31, 2011 and 2012 is as follows:
Millions of yen Thousands of U.S. dollars
2011 2012 2012
Gain on prior period adjustments ................................................................................... ¥ 145 ¥ — $ —
Gain on sales of non-current assets ................................................................................ 463 88 1,071
Reversal of allowance for doubtful accounts .................................................................. 260 — —
Reversal of provision for warranties for completed construction ..................................... 201 — —
Reversal of loss on disaster ............................................................................................. — 304 3,699
Other .............................................................................................................................. 127 45 547
Total ................................................................................................................... ¥1,196 ¥437 $5,317
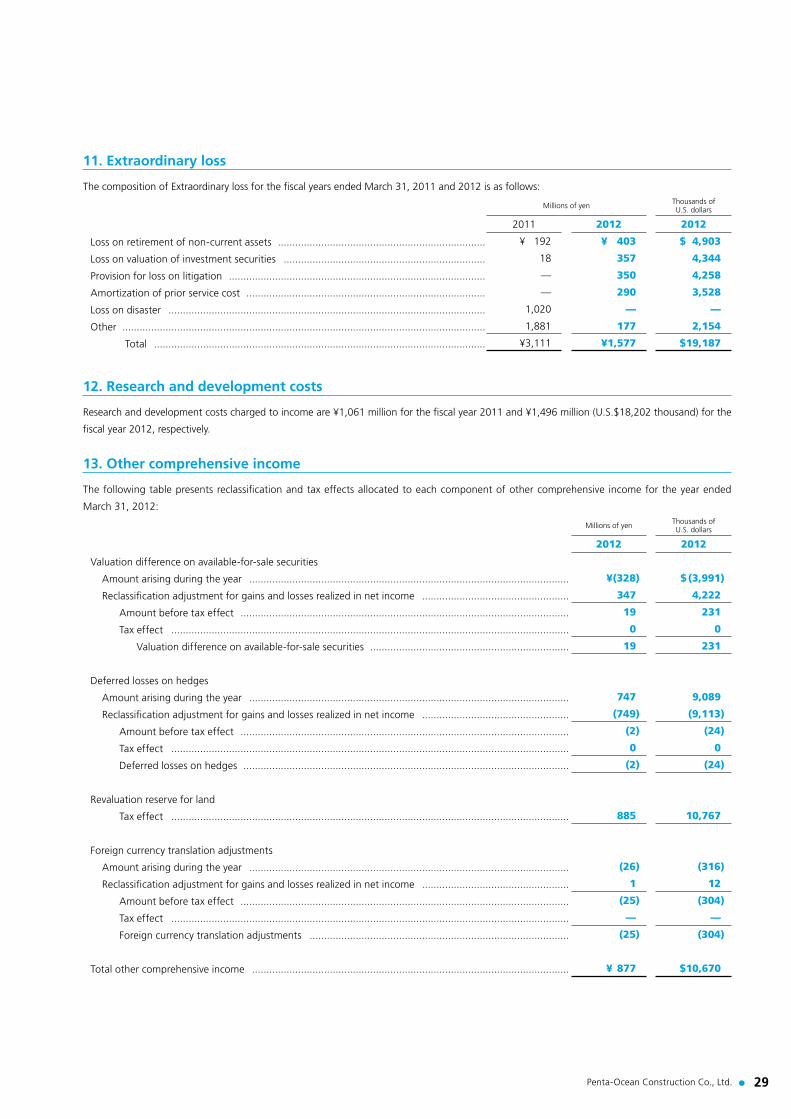
29Penta-Ocean Construction Co., Ltd.
11. Extraordinary loss
The composition of Extraordinary loss for the fiscal years ended March 31, 2011 and 2012 is as follows:
Millions of yen Thousands of U.S. dollars
2011 2012 2012
Loss on retirement of non-current assets ........................................................................ ¥ 192 ¥ 403 $ 4,903
Loss on valuation of investment securities ...................................................................... 18 357 4,344
Provision for loss on litigation ......................................................................................... — 350 4,258
Amortization of prior service cost ................................................................................... — 290 3,528
Loss on disaster .............................................................................................................. 1,020 — —
Other .............................................................................................................................. 1,881 177 2,154
Total ................................................................................................................... ¥3,111 ¥1,577 $19,187
12. Research and development costs
Research and development costs charged to income are ¥1,061 million for the fiscal year 2011 and ¥1,496 million (U.S.$18,202 thousand) for the
fiscal year 2012, respectively.
13. Other comprehensive income
The following table presents reclassification and tax effects allocated to each component of other comprehensive income for the year ended
March 31, 2012:
Millions of yen Thousands of U.S. dollars
2012 2012
Valuation difference on available-for-sale securities
Amount arising during the year ............................................................................................................... ¥(328) $ (3,991)
Reclassification adjustment for gains and losses realized in net income ................................................... 347 4,222
Amount before tax effect .................................................................................................................. 19 231
Tax effect .......................................................................................................................................... 0 0
Valuation difference on available-for-sale securities ..................................................................... 19 231
Deferred losses on hedges
Amount arising during the year ............................................................................................................... 747 9,089
Reclassification adjustment for gains and losses realized in net income ................................................... (749) (9,113)
Amount before tax effect .................................................................................................................. (2) (24)
Tax effect .......................................................................................................................................... 0 0
Deferred losses on hedges ................................................................................................................. (2) (24)
Revaluation reserve for land
Tax effect .......................................................................................................................................... 885 10,767
Foreign currency translation adjustments
Amount arising during the year ............................................................................................................... (26) (316)
Reclassification adjustment for gains and losses realized in net income ................................................... 1 12
Amount before tax effect .................................................................................................................. (25) (304)
Tax effect .......................................................................................................................................... — —
Foreign currency translation adjustments .......................................................................................... (25) (304)
Total other comprehensive income .............................................................................................................. ¥ 877 $10,670

30 Penta-Ocean Construction Co., Ltd.
14. Summary of finance lease transactions
The Company has entered into finance lease contracts on and before March 31, 2008. The finance lease transactions other than those where a title
is transferred to the lessee are summarized as follows:
(1) Estimated acquisition costs, accumulated depreciation, accumulated impairment loss and estimated value of assets leased by the
Company are as follows:
Millions of yen Thousands of U.S. dollars
2011 2012 2012
Estimated acquisition costs
Equipment ................................................................................................................ ¥92 ¥60 $730
Vehicles .................................................................................................................... 12 7 85
103 67 815
Less: accumulated depreciation ...................................................................................... (81) (64) (778)
Estimated value .............................................................................................................. ¥23 ¥ 3 $ 37
(2) Future lease payments on leased assets as of March 31, 2011 and 2012 are as follows:
Millions of yen Thousands of U.S. dollars
2011 2012 2012
Within one year .............................................................................................................. ¥21 ¥3 $37
Over one year ................................................................................................................. 3 0 0
Total ................................................................................................................... ¥24 ¥3 $37
(3) Lease payments, depreciation equivalents and interest expenses equivalents for the years ended March 31, 2011 and 2012 are as
follows:
Millions of yen Thousands of U.S. dollars
2011 2012 2012
Lease payments .............................................................................................................. ¥27 ¥21 $256
Depreciation equivalents ................................................................................................ 25 20 243
Interest expense equivalents ........................................................................................... 1 0 0
15. Summary of operating lease transactions
Future lease payments, about non-cancelable operating lease assets as of March 31, 2012 are as follows:
<Borrower> Millions of yen Thousands of U.S. dollars
2011 2012 2012
Within one year .............................................................................................................. ¥ 453 ¥ 453 $ 5,512
Over one year ................................................................................................................. 2,456 2,002 24,358
Total ................................................................................................................... ¥2,909 ¥2,455 $29,870
<Lender> Millions of yen Thousands of U.S. dollars
2011 2012 2012
Within one year .............................................................................................................. ¥ — ¥132 $1,606
Over one year ................................................................................................................. — 528 6,424
Total ................................................................................................................... ¥ — ¥660 $8,030

31Penta-Ocean Construction Co., Ltd.
16. Derivative financial transactions
(1) Matters concerning derivative financial transactions
The Company and its consolidated subsidiaries have entered into
interest rate swap agreements and forward exchange contracts
only for hedging risks from fluctuation in interest rates and foreign
exchange rates, not for speculative purposes.
The derivative financial transactions are mainly performed by the
Company, and have been made in accordance with the bylaw, which
clearly describes purposes, execution and control for transaction.
(2) Matters concerning fair value
Hedge accounting is applied for all derivative financial transactions for
the year ended March 31, 2011 and 2012 and accordingly fair value
information is waived.
17. Commitments and contingent liabilities
As of March 31, 2012, the Company has liabilities for guarantee
to bank loans made by customers amounting to ¥1,171 million
(U.S.$14,247 thousand).
The Company also has the guarantee amounting to ¥177 million
(U.S.$2,154 thousand) to purchasers concerning deposits for purchase
of the condominium apartments.
The Company has agreements on commitment line with 23 banks
totaling ¥30,000 million (U.S.$365,008 thousand) for the purpose
of flexible financing. There is no amount of loans using the line as of
March 31, 2012.
18. Tax effect accounting
(1) The significant components of deferred tax assets and liabilities are summarized as follows:
Millions of yen Thousands of U.S. dollars
2011 2012 2012
Deferred tax assets
Net operating loss carried forward ............................................................................ ¥ 9,595 ¥ 6,212 $ 75,581
Employees’ retirement benefits trust ........................................................................ 2,788 2,320 28,227
Impairment loss ......................................................................................................... 1,731 1,417 17,241
Loss on valuation of real estate for sale ..................................................................... 1,234 1,264 15,379
Provision for loss on construction contracts ............................................................... 909 1,117 13,590
Allowance for doubtful accounts ............................................................................... 516 430 5,232
Provision for bonuses ................................................................................................ 414 466 5,670
Other ......................................................................................................................... 1,845 1,855 22,569
Total: deferred tax assets ..................................................................................... 19,032 15,081 183,489
Less : valuation allowance ................................................................................... (4,702) (4,003) (48,704)
Deferred tax assets .............................................................................................. ¥14,330 ¥11,078 $134,785
Deferred tax liabilities
Prepaid pension cost ................................................................................................. ¥ (526) ¥ (275) $ (3,346)
Other ......................................................................................................................... (82) (195) (2,372)
Total: deferred tax liabilities ................................................................................. (608) (470) (5,718)
Net: deferred tax assets ....................................................................................... ¥13,722 ¥10,608 $129,067
(2) The principal details of the material differences between the statutory effective tax rate and the actual burden tax rate after
application of tax-effect accounting:
2011 2012
The statutory effective tax rate .................................................................................................................... 40.69% 40.69%
(Adjustments)
Permanent differences (expense) ............................................................................................................ 10.52 8.01
Permanent differences (income) ............................................................................................................. (7.47) (11.38)
Per capita levy on inhabitant tax ............................................................................................................. 4.17 3.26
Consolidated adjustments ...................................................................................................................... (0.54) 2.32
Increase in valuation allowance .............................................................................................................. (3.40) (0.34)
Foreign corporation tax .......................................................................................................................... 17.66 19.90
Downward adjustment of deferred tax assets at the year end due to the change in corporate tax rates .... — 12.69
Other ...................................................................................................................................................... (1.09) (0.83)
Actual burden tax rate after the application of tax effect accounting .......................................................... 60.54 74.32
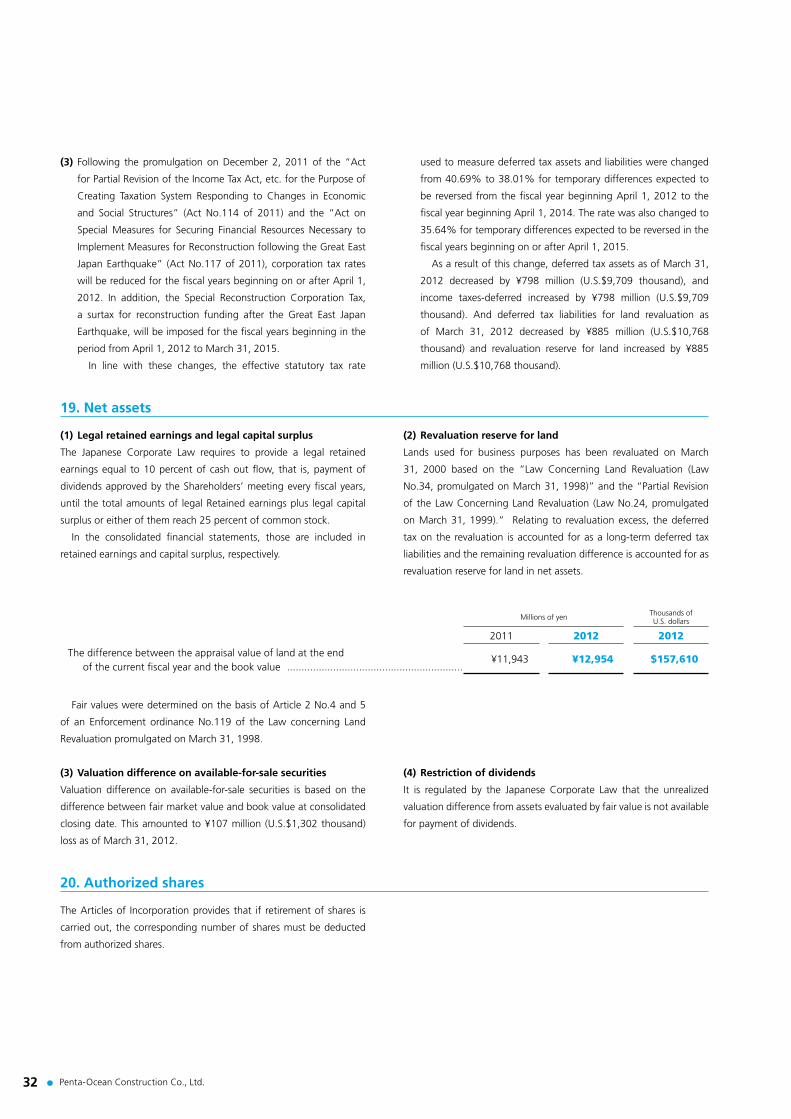
32 Penta-Ocean Construction Co., Ltd.
(3) Following the promulgation on December 2, 2011 of the “Act
for Partial Revision of the Income Tax Act, etc. for the Purpose of
Creating Taxation System Responding to Changes in Economic
and Social Structures” (Act No.114 of 2011) and the “Act on
Special Measures for Securing Financial Resources Necessary to
Implement Measures for Reconstruction following the Great East
Japan Earthquake” (Act No.117 of 2011), corporation tax rates
will be reduced for the fiscal years beginning on or after April 1,
2012. In addition, the Special Reconstruction Corporation Tax,
a surtax for reconstruction funding after the Great East Japan
Earthquake, will be imposed for the fiscal years beginning in the
period from April 1, 2012 to March 31, 2015.
In line with these changes, the effective statutory tax rate
used to measure deferred tax assets and liabilities were changed
from 40.69% to 38.01% for temporary differences expected to
be reversed from the fiscal year beginning April 1, 2012 to the
fiscal year beginning April 1, 2014. The rate was also changed to
35.64% for temporary differences expected to be reversed in the
fiscal years beginning on or after April 1, 2015.
As a result of this change, deferred tax assets as of March 31,
2012 decreased by ¥798 million (U.S.$9,709 thousand), and
income taxes-deferred increased by ¥798 million (U.S.$9,709
thousand). And deferred tax liabilities for land revaluation as
of March 31, 2012 decreased by ¥885 million (U.S.$10,768
thousand) and revaluation reserve for land increased by ¥885
million (U.S.$10,768 thousand).
19. Net assets
(1) Legal retained earnings and legal capital surplus
The Japanese Corporate Law requires to provide a legal retained
earnings equal to 10 percent of cash out flow, that is, payment of
dividends approved by the Shareholders’ meeting every fiscal years,
until the total amounts of legal Retained earnings plus legal capital
surplus or either of them reach 25 percent of common stock.
In the consolidated financial statements, those are included in
retained earnings and capital surplus, respectively.
(2) Revaluation reserve for land
Lands used for business purposes has been revaluated on March
31, 2000 based on the “Law Concerning Land Revaluation (Law
No.34, promulgated on March 31, 1998)” and the “Partial Revision
of the Law Concerning Land Revaluation (Law No.24, promulgated
on March 31, 1999).” Relating to revaluation excess, the deferred
tax on the revaluation is accounted for as a long-term deferred tax
liabilities and the remaining revaluation difference is accounted for as
revaluation reserve for land in net assets.
Millions of yen Thousands of U.S. dollars
2011 2012 2012
The difference between the appraisal value of land at the end of the current fiscal year and the book value .............................................................
¥11,943 ¥12,954 $157,610
Fair values were determined on the basis of Article 2 No.4 and 5
of an Enforcement ordinance No.119 of the Law concerning Land
Revaluation promulgated on March 31, 1998.
(3) Valuation difference on available-for-sale securities
Valuation difference on available-for-sale securities is based on the
difference between fair market value and book value at consolidated
closing date. This amounted to ¥107 million (U.S.$1,302 thousand)
loss as of March 31, 2012.
(4) Restriction of dividends
It is regulated by the Japanese Corporate Law that the unrealized
valuation difference from assets evaluated by fair value is not available
for payment of dividends.
20. Authorized shares
The Articles of Incorporation provides that if retirement of shares is
carried out, the corresponding number of shares must be deducted
from authorized shares.

33Penta-Ocean Construction Co., Ltd.
21. Retirement benefits
I. Retirement benefits obligations
Millions of yen Thousands of U.S. dollars
2011 2012 2012
a. Retirement benefit obligations ................................................................................ ¥(25,894) ¥(25,558) $(310,963)
b. Pension fund assets ................................................................................................. 15,661 16,024 194,963
c. Unfunded retirement benefit obligations ................................................................. (10,233) (9,534) (116,000)
d. Amortization term of effects of the application of
the new accounting standards for retirement benefits ....................................... 5,207 3,905 47,512
e. Unrecognized actuarial gain or loss ......................................................................... 5,985 6,176 75,143
f. Net retirement benefit obligations ........................................................................... 959 547 6,655
g. Prepaid pension cost ............................................................................................... 1,292 871 10,597
h. Provision for retirement benefits .............................................................................. ¥ (333) ¥ (324) $ (3,942)
II. Retirement benefit costs
Millions of yen Thousands of U.S. dollars
2011 2012 2012
a. Service costs ............................................................................................................ ¥1,082 ¥ 963 $11,717
b. Interest costs ........................................................................................................... 655 537 6,534
c. Expected return on pension fund assets .................................................................. (651) (548) (6,667)
d. Amortization term of effects of the application of
the new accounting standards for retirement benefits ....................................... 1,302 1,302 15,841
e. Amortization of actuarial gain or loss ...................................................................... 1,180 948 11,534
f. Amortization of prior service cost ............................................................................ — 290 3,528
g. Retirement benefit costs .......................................................................................... ¥3,568 ¥3,492 $42,487
III. Calculation basis of retirement benefit obligations
a. Recognition method of the projected retirements benefit obligations ..................... Straight-line method
b. Discount rate ........................................................................................................... 1.80%
c. Expected return rate on pension fund assets ........................................................... 3.50%
d. Amortization term of prior service cost ................................................................... Fully recognized as incurred
e. Amortization term of actuarial gain or loss .............................................................. Actuarial gains or losses are amortized by the straight-line method over the average remaining employees’ service years from the next year of the respective accrual years (approximately 10 years)
f. Amortization term of effects of the application of
the new accounting standards for retirement benefits ....................................... 15 years
22. Financial instruments
(1) Policy for acquiring Financial instruments
The Company and consolidated subsidiaries have limited the
instruments of fund investment to short term deposits and
other, and relied on bonds payable or bank loans for fund
procurement.
Regarding credit risk to customers related to notes receivable,
accounts receivable from completed construction contracts and
other, the Company and consolidated subsidiaries’ bylaw has
been applied to reduce the risk. Additionally notes receivable,
accounts receivable from completed construction contracts and
other in foreign currencies are exposed to foreign currency risk,
and the Company enters into forward exchange contracts to
hedge the risk.
Investment securities include mainly stocks, held-to-maturity
bonds and investment trusts and are exposed to fluctuation of
market value. Those fair value, financial status of the issuers and
so on are checked regularly. Accounts receivable-other is mainly
credit other than accounts receivable associated with operating
transactions and most of the accounts are collected in short term
and detail of the balance is reviewed on monthly basis.
Bonds payable and loans payable are mainly for procurement
for operating funds and the Company enters into interest rate
swap agreements and manages to fix its interest cost to hedge the
risk from interest volatility related to long-term loans payable.
Execution and control of derivative transaction is held in
accordance with the Company’s bylaw where its purpose, action
and control of such transaction are clearly stated and derivative
transactions shall not be used for speculative purpose.

34 Penta-Ocean Construction Co., Ltd.
(2) Estimated fair value of financial instruments
Book value on consolidated balance sheet, fair value and the difference as of March 31, 2011 are as follows:
Millions of yen
Book value on consolidated B/S Fair value Difference
Assets
(1) Cash and deposits ..................................................................................................... ¥ 46,121 ¥ 46,121 ¥ —
(2) Notes receivable, accounts receivable from
completed construction contracts and other ....................................................... 107,143 107,113 (30)
(3) Short-term investment securities and investment securities ....................................... 7,450 7,452 2
(4) Accounts receivable-other ......................................................................................... 13,445 13,445 —
Total Assets .................................................................................................................... ¥174,159 ¥174,131 ¥ (28)
Liabilities
(1) Notes payable, accounts payable for construction contracts and other ...................... ¥ 87,419 ¥ 87,419 ¥ —
(2) Short-term loans payable ........................................................................................... 27,422 27,422 —
(3) Long-term loans payable *1 ...................................................................................... 51,249 51,397 148
Total Liabilities ................................................................................................................ ¥166,091 ¥166,239 ¥148
Derivative transaction *2 ................................................................................................ ¥ (13) ¥ (13) ¥ —
*1 Long-term loans payable includes the current portion of long-term loans payable.
*2 The debit and credit balances recorded by derivative transaction are offset each other.
(Note 1) Calculation method of financial instruments’ fair value and
securities and derivative transaction
Assets
(1) Cash and deposits, (4) Accounts receivable-other
Since these items are settled within the short term, the fair
values are nearly equivalent to the book values therefore the
book value is used.
(2) Notes receivable, accounts receivable from completed con-
struction contracts and other
These items’ fair values are the present value, discounted by
using interest rate determined based on the term until maturity
and credit risk with respect to the receivables categorized by a
certain period.
(3) Short-term investment securities and investment securities
The fair value of stocks and bonds present the market values.
The fair value of investment trust is based on the standard price
released to public.
Liabilities
(1) Notes payable, accounts payable for construction contracts
and other (2) Short-term loans payable
Since these items are settled within short term, the fair values
are nearly equivalent to book values, therefore the current
book value is used.
(3) Long-term loans payable
The fair value of long-term loans payable is calculated by
discounting the total of principal and interest using interest
rate calculated assuming the loan is newly made. Long-term
loans payable with floating rate is subject to a special treatment
of interest rate swap and is calculated by discounting the total
of principal and interest, accounted for as if they were integral
part of the interest rate swap, by interest rate that is reasonably
estimated and applied in the case of similar loan.
Derivative transactions
It is forward exchange contracts, and fair value is calculated by
using a forward exchange rate. However the transactions that
apply to a special treatment of interest rate swap are accounted
for as if they were integral part of the hedged long-term loans
payable, its fair value is included in the fair value of long-term
loans payable.
(Note 2) Since unlisted stocks and investments in silent partnership
for development investment business (balance on consolidated
balance sheet ¥3,347 million) have no market value, have no
estimated future cash flows and are quite difficult to recognize the fair
value, they are not included in “(3) Short-term investment securities
and investment securities.”

35Penta-Ocean Construction Co., Ltd.
(Note 3) Redemption schedule for receivables and marketable securities with maturities at March 31, 2011
Millions of yen
Due in one year or less
Due after one year through five years
Due after five years through ten years Due after ten years
Cash and deposits ............................................................................ ¥ 46,085 ¥ — ¥ — ¥ —
Notes receivable, accounts receivable from completed construction contracts and other ..................................................................
102,504 4,639 — —
Short-term investment securities and investment securities
Held-to-maturity bonds
National and local government bonds ...................................... 1 31 149 —
Corporate bonds ...................................................................... — 10 — —
Other marketable securities with maturities
Other .................................................................................... 1 — 112 —
Accounts receivable-other ................................................................ 13,445 — — —
Total ................................................................................................. ¥162,036 ¥4,680 ¥261 ¥ —
Book value on consolidated balance sheet, fair value and the difference as of March 31, 2012 are as follows:
Millions of yen
Book value on consolidated B/S Fair value Difference
Assets
(1) Cash and deposits ..................................................................................................... ¥ 63,371 ¥ 63,371 ¥ —
(2) Notes receivable, accounts receivable from
completed construction contracts and other ....................................................... 118,610 118,591 (19)
(3) Investment securities ................................................................................................. 7,593 7,599 6
(4) Accounts receivable-other ......................................................................................... 10,608 10,608 —
Total Assets .................................................................................................................... ¥200,182 ¥200,169 ¥ (13)
Liabilities
(1) Notes payable, accounts payable for construction contracts and other ¥112,843 ¥112,843 ¥ —
(2) Short-term loans payable ........................................................................................... 24,933 24,933 —
(3) Bonds payable ........................................................................................................... 10,000 9,821 (179)
(4) Long-term loans payable *1 ...................................................................................... 46,238 46,558 320
Total Liabilities ................................................................................................................ ¥194,014 ¥194,155 ¥141
Derivative transaction *2 ................................................................................................ ¥ (15) ¥ (15) ¥ —
Thousands of U.S. dollars
Book value on consolidated B/S Fair value Difference
Assets
(1) Cash and deposits ..................................................................................................... $ 771,031 $ 771,031 $ —
(2) Notes receivable, accounts receivable from
completed construction contracts and other ....................................................... 1,443,120 1,442,888 (232)
(3) Investment securities ................................................................................................. 92,384 92,457 73
(4) Accounts receivable-other ......................................................................................... 129,067 129,067 —
Total Assets .................................................................................................................... $2,435,602 $2,435,443 $ (159)
Liabilities
(1) Notes payable, accounts payable for construction contracts and other ...................... $1,372,953 $1,372,953 $ —
(2) Short-term loans payable ........................................................................................... 303,358 303,358 —
(3) Bonds payable ........................................................................................................... 121,669 119,491 (2,178)
(4) Long-term loans payable *1 ...................................................................................... 562,575 566,468 3,893
Total Liabilities ................................................................................................................ $2,360,555 $2,362,270 $1,715
Derivative transaction *2 ................................................................................................ $ (183) $ (183) $ —
*1 Long-term loans payable includes the current portion of long-term loans payable.*2 The debit and credit balances recorded by derivative transaction are offset each other.

36 Penta-Ocean Construction Co., Ltd.
(Note 1) Calculation method of financial instruments’ fair value and
securities and derivative transaction
Assets
(1) Cash and deposits, (4) Accounts receivable-other
Since these items are settled within the short term, the fair
values are nearly equivalent to the book values, therefore the
book value is used.
(2) Notes receivable, accounts receivable from completed con-
struction contracts and other
These items’ fair values are the present value, discounted by
using interest rate determined based on the term until maturity
and credit risk with respect to the receivables categorized by a
certain period.
(3) Investment securities
The fair value of stocks and bonds present the market values.
The fair value of investment trust is based on the standard price
released to public.
Liabilities
(1) Notes payable, accounts payable for construction contracts
and other (2) Short-term loans payable
Since these items are settled within short term, the fair values
are nearly equivalent to book values, therefore the current
book value is used.
(3) Bonds payable, (4) Long-term loans payable
The fair value of these items are calculated by discounting the
total of principal and interest using interest rate calculated
assuming the loan is newly made or the bond is newly issued.
Long-term loans payable with floating rate is subject to a
special treatment of interest rate swap and is calculated by
discounting the total of principal and interest, accounted for as
if they were integral part of the interest rate swap, by interest
rate that is reasonably estimated and applied in the case of
similar loan.
Derivative transactions
It is forward exchange contracts, and fair value is calculated by
using a forward exchange rate. However the transactions that
apply to a special treatment of interest rate swap are accounted
for as if they were integral part of the hedged long-term loans
payable, its fair value is included in the fair value of long-term
loans payable.
(Note 2) Since unlisted stocks (balance on consolidated balance sheet
¥3,229 million (U.S.$39,287 thousand) have no market value, have no
estimated future cash flows and are quite difficult to recognize the fair
value, they are not included in “(3) Investment securities.”
(Note 3) Redemption schedule for receivables and marketable securities with maturities at March 31, 2012
Millions of yen
Due in one year or less
Due after one year through five years
Due after five years through ten years Due after ten years
Cash and deposits ............................................................................ ¥ 63,344 ¥ — ¥ — ¥ —Notes receivable, accounts receivable from completed construction
contracts and other ..................................................................113,864 4,746 — —
Investment securities Held-to-maturity bonds National and local government bonds ...................................... — 61 130 —
Corporate bonds ...................................................................... — 10 — —
Other marketable securities with maturities Corporate bonds ...................................................................... — — 100 —
Other .................................................................................... — 10 — —
Accounts receivable-other ................................................................ 10,608 — — —
Total ................................................................................................. ¥187,816 ¥4,827 ¥230 ¥ —
As of March 31, 2012 Thousands of U.S. dollars
Due in one year or less
Due after one year through five years
Due after five years through ten years Due after ten years
Cash and deposits ............................................................................ $ 770,702 $ — $ — $ —Notes receivable, accounts receivable from completed construction
contracts and other ..................................................................1,385,375 57,744 — —
Investment securities Held-to-maturity bonds National and local government bonds ...................................... — 742 1,581 —
Corporate bonds ...................................................................... — 122 — —
Other marketable securities with maturities Corporate bonds ...................................................................... — — 1,217 —
Other .................................................................................... — 122 — —
Accounts receivable-other ................................................................ 129,067 — — —
Total ................................................................................................. $2,285,144 $58,730 $2,798 $ —
(Note 4) The redemption schedule for long-term loans payable is disclosed in Note 7.
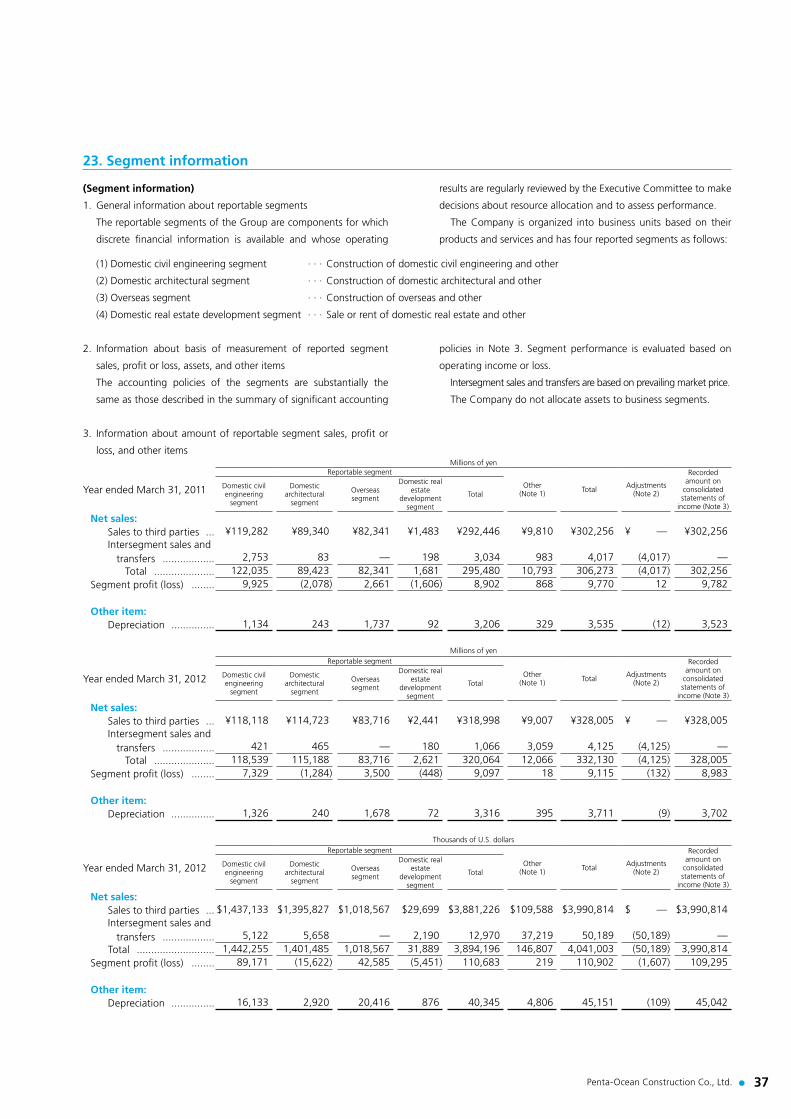
37Penta-Ocean Construction Co., Ltd.
23. Segment information
(Segment information)
1. General information about reportable segments
The reportable segments of the Group are components for which
discrete financial information is available and whose operating
results are regularly reviewed by the Executive Committee to make
decisions about resource allocation and to assess performance.
The Company is organized into business units based on their
products and services and has four reported segments as follows:
(1) Domestic civil engineering segment · · · Construction of domestic civil engineering and other
(2) Domestic architectural segment · · · Construction of domestic architectural and other
(3) Overseas segment · · · Construction of overseas and other
(4) Domestic real estate development segment · · · Sale or rent of domestic real estate and other
2. Information about basis of measurement of reported segment
sales, profit or loss, assets, and other items
The accounting policies of the segments are substantially the
same as those described in the summary of significant accounting
policies in Note 3. Segment performance is evaluated based on
operating income or loss.
Intersegment sales and transfers are based on prevailing market price.
The Company do not allocate assets to business segments.
3. Information about amount of reportable segment sales, profit or
loss, and other itemsMillions of yen
Year ended March 31, 2011
Reportable segment
Other (Note 1) Total Adjustments
(Note 2)
Recorded amount on
consolidated statements of
income (Note 3)
Domestic civil engineering
segment
Domestic architectural
segment
Overseas segment
Domestic real estate
development segment
Total
Net sales: Sales to third parties ... ¥119,282 ¥89,340 ¥82,341 ¥1,483 ¥292,446 ¥9,810 ¥302,256 ¥ — ¥302,256 Intersegment sales and transfers .................. 2,753 83 — 198 3,034 983 4,017 (4,017) — Total ..................... 122,035 89,423 82,341 1,681 295,480 10,793 306,273 (4,017) 302,256 Segment profit (loss) ........ 9,925 (2,078) 2,661 (1,606) 8,902 868 9,770 12 9,782
Other item: Depreciation ............... 1,134 243 1,737 92 3,206 329 3,535 (12) 3,523
Millions of yen
Year ended March 31, 2012
Reportable segment
Other (Note 1) Total Adjustments
(Note 2)
Recorded amount on
consolidated statements of
income (Note 3)
Domestic civil engineering
segment
Domestic architectural
segment
Overseas segment
Domestic real estate
development segment
Total
Net sales: Sales to third parties ... ¥118,118 ¥114,723 ¥83,716 ¥2,441 ¥318,998 ¥9,007 ¥328,005 ¥ — ¥328,005 Intersegment sales and transfers .................. 421 465 — 180 1,066 3,059 4,125 (4,125) — Total ..................... 118,539 115,188 83,716 2,621 320,064 12,066 332,130 (4,125) 328,005 Segment profit (loss) ........ 7,329 (1,284) 3,500 (448) 9,097 18 9,115 (132) 8,983
Other item: Depreciation ............... 1,326 240 1,678 72 3,316 395 3,711 (9) 3,702
Thousands of U.S. dollars
Year ended March 31, 2012
Reportable segment
Other (Note 1) Total Adjustments
(Note 2)
Recorded amount on
consolidated statements of
income (Note 3)
Domestic civil engineering
segment
Domestic architectural
segment
Overseas segment
Domestic real estate
development segment
Total
Net sales: Sales to third parties ... $1,437,133 $1,395,827 $1,018,567 $29,699 $3,881,226 $109,588 $3,990,814 $ — $3,990,814 Intersegment sales and transfers .................. 5,122 5,658 — 2,190 12,970 37,219 50,189 (50,189) — Total ........................... 1,442,255 1,401,485 1,018,567 31,889 3,894,196 146,807 4,041,003 (50,189) 3,990,814 Segment profit (loss) ........ 89,171 (15,622) 42,585 (5,451) 110,683 219 110,902 (1,607) 109,295
Other item: Depreciation ............... 16,133 2,920 20,416 876 40,345 4,806 45,151 (109) 45,042
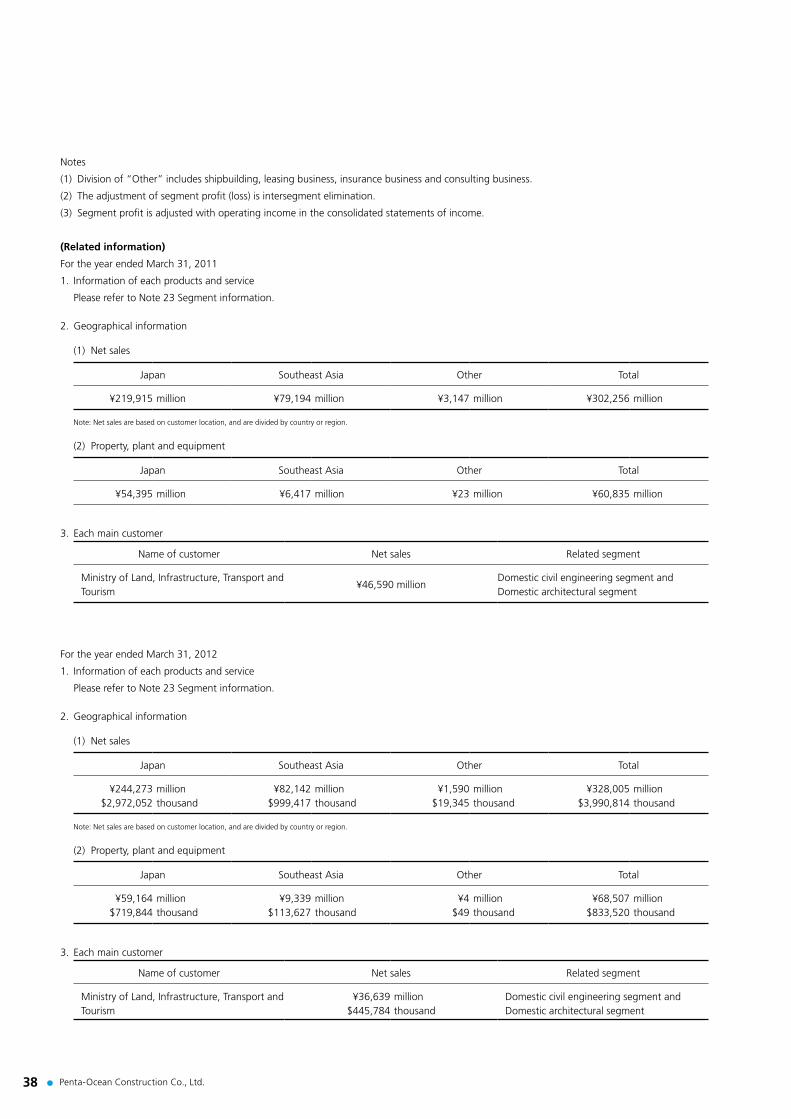
38 Penta-Ocean Construction Co., Ltd.
Notes
(1) Division of “Other” includes shipbuilding, leasing business, insurance business and consulting business.
(2) The adjustment of segment profit (loss) is intersegment elimination.
(3) Segment profit is adjusted with operating income in the consolidated statements of income.
(Related information)
For the year ended March 31, 2011
1. Information of each products and service
Please refer to Note 23 Segment information.
2. Geographical information
(1) Net sales
Japan Southeast Asia Other Total
¥219,915 million ¥79,194 million ¥3,147 million ¥302,256 million
Note: Net sales are based on customer location, and are divided by country or region.
(2) Property, plant and equipment
Japan Southeast Asia Other Total
¥54,395 million ¥6,417 million ¥23 million ¥60,835 million
3. Each main customer
Name of customer Net sales Related segment
Ministry of Land, Infrastructure, Transport and Tourism
¥46,590 millionDomestic civil engineering segment and Domestic architectural segment
For the year ended March 31, 2012
1. Information of each products and service
Please refer to Note 23 Segment information.
2. Geographical information
(1) Net sales
Japan Southeast Asia Other Total
¥244,273 $2,972,052
millionthousand
¥82,142 $999,417
millionthousand
¥1,590 $19,345
millionthousand
¥328,005 $3,990,814
millionthousand
Note: Net sales are based on customer location, and are divided by country or region.
(2) Property, plant and equipment
Japan Southeast Asia Other Total
¥59,164 $719,844
millionthousand
¥9,339 $113,627
millionthousand
¥4 $49
millionthousand
¥68,507 $833,520
millionthousand
3. Each main customer
Name of customer Net sales Related segment
Ministry of Land, Infrastructure, Transport and Tourism
¥36,639 $445,784
millionthousand
Domestic civil engineering segment and Domestic architectural segment

39Penta-Ocean Construction Co., Ltd.
(Information related to Impairment loss on fixed assets by reportable segment)
For the year ended March 31, 2011
There is no impairment loss divided by reportable segment.
For the amount and contents of impairment loss which is not divided by reportable segment is as follows:
Location Classification Impairment loss
Kanto area Leased and other assets (6 objects)Land ........................... ¥ 112 million
Buildings and structure ........................... ¥1,046 million
For the year ended March 31, 2012
There is no impairment loss divided by reportable segment.
For the amount and contents of impairment loss which is not divided by reportable segment is omitted to insignificant amount.
(Information related to the amortization of goodwill and unamortized balances)
This information is omitted, due to insignificant amount.
(Information related to gains on negative goodwill by reportable segments)
For the year ended March 31, 2011
This information is omitted, due to insignificant amount.
For the year ended March 31, 2012
None
24. Amounts per share
1. Per share information is summarized as follows:
Yen U.S. dollars
2011 2012 2012
Net assets per share ...................................................................................................... ¥211.44 ¥218.19 $2.65
Net income per share .................................................................................................... 8.50 5.67 0.07
2. For the years ended March 31, 2011 and 2012, diluted net income per share is not disclosed, because the dilutive potential of shares of common
stock is none.
25. Significant subsequent event
For the year ended March 31, 2012
The following distribution of retained earnings of the Company, which has not been reflected in the accompanying consolidated financial
statements for the year ended March 31, 2012, was approved at the general shareholders’ meeting held on June 28, 2012 and became effective
June 29, 2012:
Millions of yen Thousands of U.S. dollars
2012 2012
Cash dividends (¥2 (U.S.$0.02) per share) ................................................................................................... ¥572 $6,959

40 Penta-Ocean Construction Co., Ltd.
Report of Independent Auditors
The Board of Directors
PENTA-OCEAN CONSTRUCTION CO., LTD.
We have audited the accompanying consolidated financial statements of PENTA-OCEAN CONSTRUCTION CO., LTD. and its
consolidated subsidiaries, which comprise the consolidated balance sheet as at March 31, 2012, and the consolidated statements
of income, comprehensive income, changes in net assets, and cash flows for the year then ended and a summary of significant
accounting policies and other explanatory information, all expressed in Japanese yen.
Management’s Responsibility for the Consolidated Financial Statements
Management is responsible for the preparation and fair presentation of these consolidated financial statements in accordance
with accounting principles generally accepted in Japan, and for designing and operating such internal control as management
determines is necessary to enable the preparation and fair presentation of the consolidated financial statements that are free from
material misstatement, whether due to fraud or error.
Auditor’s Responsibility
Our responsibility is to express an opinion on these consolidated financial statements based on our audit. We conducted our audit
in accordance with auditing standards generally accepted in Japan. Those standards require that we plan and perform the audit
to obtain reasonable assurance about whether the consolidated financial statements are free from material misstatement.
An audit involves performing procedures to obtain audit evidence about the amounts and disclosures in the consolidated financial
statements. The procedures selected depend on the auditor’s judgment, including the assessment of the risks of material misstate-
ment of the consolidated financial statements, whether due to fraud or error. The purpose of an audit of the consolidated financial
statements is not to express an opinion on the effectiveness of the entity’s internal control, but in making these risk assessments
the auditor considers internal controls relevant to the entity’s preparation and fair presentation of the consolidated financial
statements in order to design audit procedures that are appropriate in the circumstances. An audit also includes evaluating the
appropriateness of accounting policies used and the reasonableness of accounting estimates made by management, as well as
evaluating the overall presentation of the consolidated financial statements.
We believe that the audit evidence we have obtained is sufficient and appropriate to provide a basis for our audit opinion.
Opinion
In our opinion, the consolidated financial statements referred to above present fairly, in all material respects, the consolidated
financial position of PENTA-OCEAN CONSTRUCTION CO., LTD. and consolidated subsidiaries as at March 31, 2012, and their
consolidated financial performance and cash flows for the year then ended in conformity with accounting principles generally
accepted in Japan.
Convenience Translation
We have reviewed the translation of these consolidated financial statements into U.S. dollars, presented for the convenience of
readers, and, in our opinion, the accompanying consolidated financial statements have been properly translated on the basis
described in Note 1.
June 28, 2012
Ernst & Young ShinNihon LLC

41Penta-Ocean Construction Co., Ltd.
Non-Consolidated Financial StatementsNon-Consolidated Five-Year SummaryPenta-Ocean Construction Co., Ltd. For the fiscal year ended March 31
Millions of yen Thousands of U.S. dollars
2008 2009 2010 2011 2012 2012
Orders received ................................................... ¥375,945 ¥317,829 ¥257,950 ¥276,936 ¥299,133 $3,639,530
Civil engineering ............................................ 205,839 194,839 167,275 127,903 156,294 1,901,618
Architectural engineering .............................. 167,756 121,212 89,780 147,479 140,219 1,706,035
Development business and other ................... 2,350 1,778 895 1,554 2,620 31,877
Net sales .............................................................. 317,856 366,553 297,438 279,374 308,576 3,754,423
Civil engineering ............................................ 167,482 201,705 185,758 164,706 158,503 1,928,495
Architectural engineering .............................. 145,045 163,653 110,497 113,026 147,452 1,794,038
Development business and other ................... 5,329 1,195 1,183 1,642 2,621 31,890
Contract backlog ................................................. 474,371 406,042 366,094 360,558 349,956 4,257,890
Civil engineering ............................................ 283,685 262,343 243,919 204,470 201,590 2,452,732
Architectural engineering .............................. 190,686 143,116 121,881 155,881 148,160 1,802,652
Development business and other ................... 0 583 294 207 206 2,506
Total assets .......................................................... 307,211 308,078 274,733 268,403 293,775 3,574,340
Net assets ............................................................ 48,710 47,339 50,043 55,860 58,271 708,979
Ordinary income .................................................. 3,081 7,081 7,849 6,778 7,599 92,457
Income before income taxes ................................ 2,810 66 2,518 4,649 6,499 79,073
Net income (loss) ................................................. 1,390 (3,116) 2,228 1,924 2,083 25,344
Cash dividends .................................................... — — 491 572 572 6,959
Per share of common stock: Yen U.S. dollars
Net assets ...................................................... ¥198.26 ¥192.69 ¥203.70 ¥195.37 ¥203.81 $2.48
Net income (loss) ........................................... 5.66 (12.68) 9.07 7.56 7.29 0.09
Cash dividends .............................................. — — 2.00 2.00 2.00 0.02
Number of employees ......................................... 2,778 2,731 2,674 2,390 2,391
Note: Figures in U.S. dollars are converted for convenience only, at the rate of ¥82.19 per U.S.$1, prevailing on March 31, 2012.
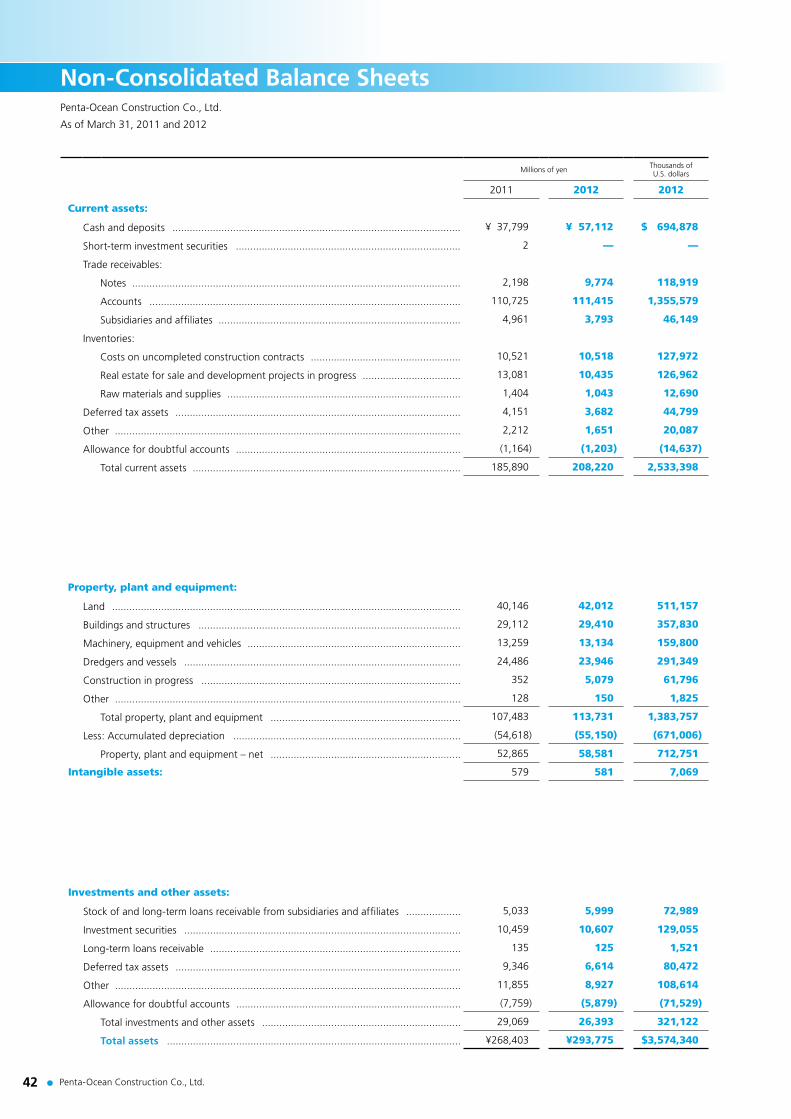
42 Penta-Ocean Construction Co., Ltd.
Penta-Ocean Construction Co., Ltd.
As of March 31, 2011 and 2012
Non-Consolidated Balance Sheets
Millions of yen Thousands of U.S. dollars
2011 2012 2012
Current assets:
Cash and deposits .................................................................................................... ¥ 37,799 ¥ 57,112 $ 694,878
Short-term investment securities .............................................................................. 2 — —
Trade receivables:
Notes .................................................................................................................. 2,198 9,774 118,919
Accounts ............................................................................................................ 110,725 111,415 1,355,579
Subsidiaries and affiliates .................................................................................... 4,961 3,793 46,149
Inventories:
Costs on uncompleted construction contracts .................................................... 10,521 10,518 127,972
Real estate for sale and development projects in progress .................................. 13,081 10,435 126,962
Raw materials and supplies ................................................................................. 1,404 1,043 12,690
Deferred tax assets ................................................................................................... 4,151 3,682 44,799
Other ........................................................................................................................ 2,212 1,651 20,087
Allowance for doubtful accounts .............................................................................. (1,164) (1,203) (14,637)
Total current assets ............................................................................................. 185,890 208,220 2,533,398
Property, plant and equipment:
Land ......................................................................................................................... 40,146 42,012 511,157
Buildings and structures ........................................................................................... 29,112 29,410 357,830
Machinery, equipment and vehicles .......................................................................... 13,259 13,134 159,800
Dredgers and vessels ................................................................................................ 24,486 23,946 291,349
Construction in progress .......................................................................................... 352 5,079 61,796
Other ........................................................................................................................ 128 150 1,825
Total property, plant and equipment .................................................................. 107,483 113,731 1,383,757
Less: Accumulated depreciation ............................................................................... (54,618) (55,150) (671,006)
Property, plant and equipment – net .................................................................. 52,865 58,581 712,751
Intangible assets: 579 581 7,069
Investments and other assets:
Stock of and long-term loans receivable from subsidiaries and affiliates ................... 5,033 5,999 72,989
Investment securities ................................................................................................ 10,459 10,607 129,055
Long-term loans receivable ....................................................................................... 135 125 1,521
Deferred tax assets ................................................................................................... 9,346 6,614 80,472
Other ........................................................................................................................ 11,855 8,927 108,614
Allowance for doubtful accounts .............................................................................. (7,759) (5,879) (71,529)
Total investments and other assets ..................................................................... 29,069 26,393 321,122
Total assets ...................................................................................................... ¥268,403 ¥293,775 $3,574,340
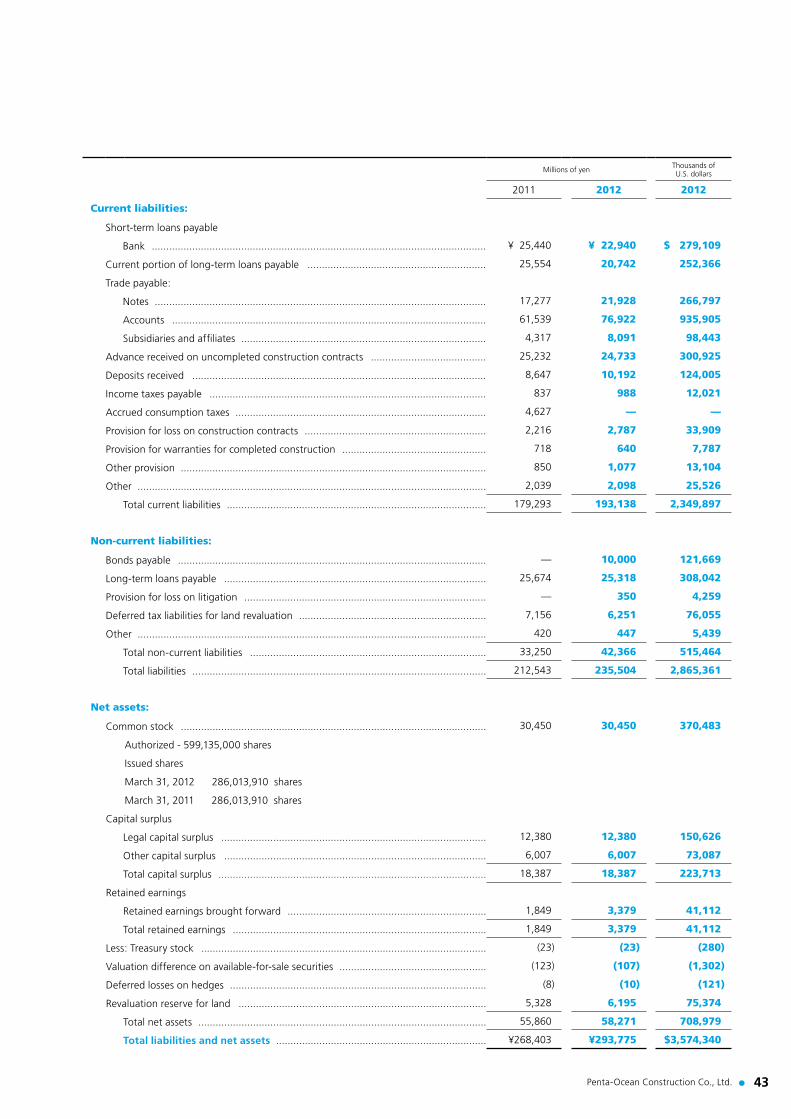
43Penta-Ocean Construction Co., Ltd.
Millions of yen Thousands of U.S. dollars
2011 2012 2012
Current liabilities:
Short-term loans payable
Bank .................................................................................................................... ¥ 25,440 ¥ 22,940 $ 279,109
Current portion of long-term loans payable .............................................................. 25,554 20,742 252,366
Trade payable:
Notes ................................................................................................................... 17,277 21,928 266,797
Accounts ............................................................................................................. 61,539 76,922 935,905
Subsidiaries and affiliates ..................................................................................... 4,317 8,091 98,443
Advance received on uncompleted construction contracts ........................................ 25,232 24,733 300,925
Deposits received ...................................................................................................... 8,647 10,192 124,005
Income taxes payable ................................................................................................ 837 988 12,021
Accrued consumption taxes ....................................................................................... 4,627 — —
Provision for loss on construction contracts ............................................................... 2,216 2,787 33,909
Provision for warranties for completed construction .................................................. 718 640 7,787
Other provision .......................................................................................................... 850 1,077 13,104
Other ......................................................................................................................... 2,039 2,098 25,526
Total current liabilities .......................................................................................... 179,293 193,138 2,349,897
Non-current liabilities:
Bonds payable ........................................................................................................... — 10,000 121,669
Long-term loans payable ........................................................................................... 25,674 25,318 308,042
Provision for loss on litigation .................................................................................... — 350 4,259
Deferred tax liabilities for land revaluation ................................................................. 7,156 6,251 76,055
Other ......................................................................................................................... 420 447 5,439
Total non-current liabilities .................................................................................. 33,250 42,366 515,464
Total liabilities ...................................................................................................... 212,543 235,504 2,865,361
Net assets:
Common stock .......................................................................................................... 30,450 30,450 370,483
Authorized - 599,135,000 shares
Issued shares
March 31, 2012 286,013,910 shares
March 31, 2011 286,013,910 shares
Capital surplus
Legal capital surplus ............................................................................................ 12,380 12,380 150,626
Other capital surplus ........................................................................................... 6,007 6,007 73,087
Total capital surplus ............................................................................................. 18,387 18,387 223,713
Retained earnings
Retained earnings brought forward ..................................................................... 1,849 3,379 41,112
Total retained earnings ........................................................................................ 1,849 3,379 41,112
Less: Treasury stock ................................................................................................... (23) (23) (280)
Valuation difference on available-for-sale securities ................................................... (123) (107) (1,302)
Deferred losses on hedges ......................................................................................... (8) (10) (121)
Revaluation reserve for land ...................................................................................... 5,328 6,195 75,374
Total net assets .................................................................................................... 55,860 58,271 708,979
Total liabilities and net assets ......................................................................... ¥268,403 ¥293,775 $3,574,340

44 Penta-Ocean Construction Co., Ltd.
Non-Consolidated Statements of IncomePenta-Ocean Construction Co., Ltd.
For the two years ended March 31, 2012
Millions of yen Thousands of U.S. dollars
2011 2012 2012
Construction business:
Net sales .................................................................................................................... ¥277,732 ¥305,955 $3,722,533
Cost of sales .............................................................................................................. 253,340 283,100 3,444,458
Gross profit ............................................................................................................... 24,392 22,855 278,075
Development business and other:
Net sales .................................................................................................................... 1,642 2,621 31,890
Cost of sales .............................................................................................................. 2,946 2,882 35,065
Gross loss .................................................................................................................. (1,304) (261) (3,175)
Total:
Total net sales ............................................................................................................ 279,374 308,576 3,754,423
Total cost of sales ...................................................................................................... 256,286 285,982 3,479,523
Total gross profit ......................................................................................................... 23,088 22,594 274,900
Selling, general and administrative expenses ......................................................... 14,043 13,838 168,366
Operating income ........................................................................................................ 9,045 8,756 106,534
Non-operating income:
Interest and dividends income ................................................................................... 179 268 3,261
Interest and dividends income from subsidiaries and affiliates ................................... 197 500 6,083
Other ......................................................................................................................... 458 310 3,772
834 1,078 13,116
Non-operating expenses:
Interest expenses ....................................................................................................... 2,214 1,821 22,156
Other ......................................................................................................................... 887 414 5,037
3,101 2,235 27,193
Ordinary income .......................................................................................................... 6,778 7,599 92,457
Extraordinary gain ...................................................................................................... 719 368 4,477
Extraordinary loss ....................................................................................................... 2,848 1,468 17,861
Income before income taxes ...................................................................................... 4,649 6,499 79,073
Income taxes:
Current ...................................................................................................................... 1,194 1,234 15,014
Deferred .................................................................................................................... 1,531 3,182 38,715
2,725 4,416 53,729
Net income ................................................................................................................... ¥ 1,924 ¥ 2,083 $ 25,344
Net income per share of common stock
Yen U.S. dollars
Primary ................................................................................................................ ¥7.56 ¥7.29 $0.09
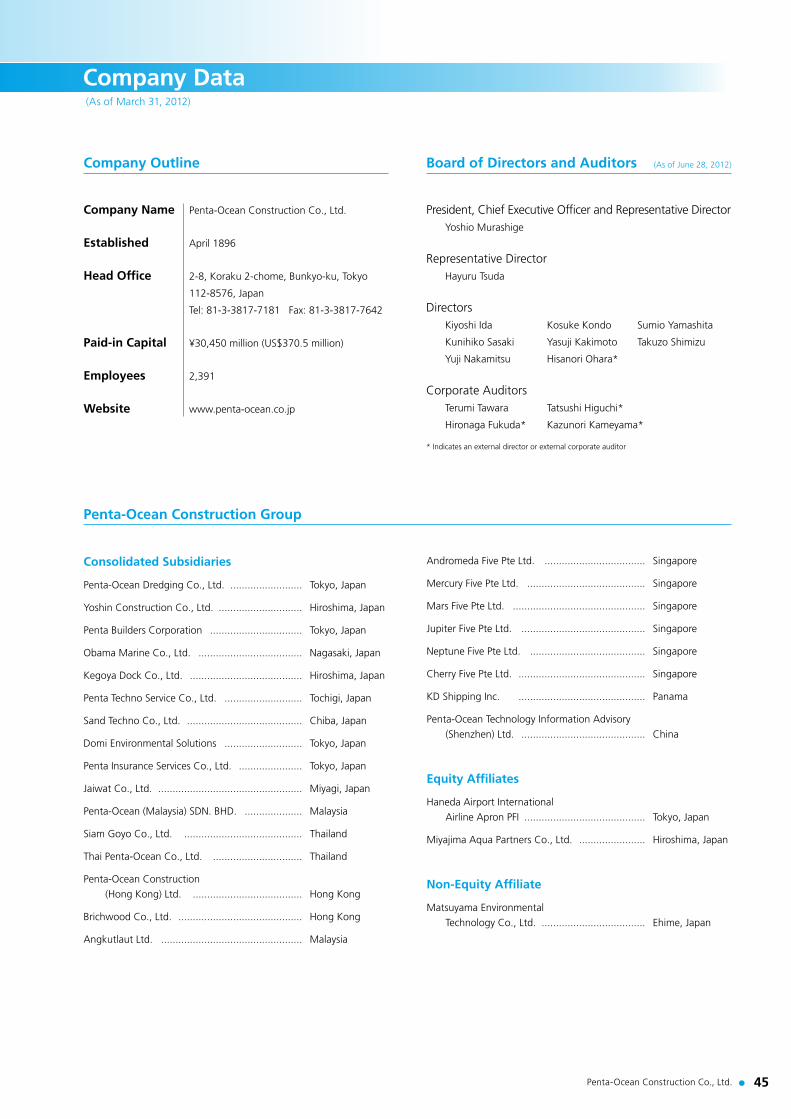
45Penta-Ocean Construction Co., Ltd.
Company Data
Company Name Penta-Ocean Construction Co., Ltd.
Established April 1896
Head Office 2-8, Koraku 2-chome, Bunkyo-ku, Tokyo
112-8576, Japan
Tel: 81-3-3817-7181 Fax: 81-3-3817-7642
Paid-in Capital ¥30,450 million (US$370.5 million)
Employees 2,391
Website www.penta-ocean.co.jp
President, Chief Executive Officer and Representative Director Yoshio Murashige
Representative Director Hayuru Tsuda
Directors Kiyoshi Ida Kosuke Kondo Sumio Yamashita
Kunihiko Sasaki Yasuji Kakimoto Takuzo Shimizu
Yuji Nakamitsu Hisanori Ohara*
Corporate Auditors Terumi Tawara Tatsushi Higuchi*
Hironaga Fukuda* Kazunori Kameyama*
* Indicates an external director or external corporate auditor
Consolidated Subsidiaries
Penta-Ocean Dredging Co., Ltd. ......................... Tokyo, Japan
Yoshin Construction Co., Ltd. ............................. Hiroshima, Japan
Penta Builders Corporation ................................ Tokyo, Japan
Obama Marine Co., Ltd. .................................... Nagasaki, Japan
Kegoya Dock Co., Ltd. ....................................... Hiroshima, Japan
Penta Techno Service Co., Ltd. ........................... Tochigi, Japan
Sand Techno Co., Ltd. ........................................ Chiba, Japan
Domi Environmental Solutions ........................... Tokyo, Japan
Penta Insurance Services Co., Ltd. ...................... Tokyo, Japan
Jaiwat Co., Ltd. .................................................. Miyagi, Japan
Penta-Ocean (Malaysia) SDN. BHD. .................... Malaysia
Siam Goyo Co., Ltd. ......................................... Thailand
Thai Penta-Ocean Co., Ltd. ............................... Thailand
Penta-Ocean Construction
(Hong Kong) Ltd. ...................................... Hong Kong
Brichwood Co., Ltd. ........................................... Hong Kong
Angkutlaut Ltd. ................................................. Malaysia
Andromeda Five Pte Ltd. ................................... Singapore
Mercury Five Pte Ltd. ......................................... Singapore
Mars Five Pte Ltd. .............................................. Singapore
Jupiter Five Pte Ltd. ........................................... Singapore
Neptune Five Pte Ltd. ........................................ Singapore
Cherry Five Pte Ltd. ............................................ Singapore
KD Shipping Inc. ............................................ Panama
Penta-Ocean Technology Information Advisory
(Shenzhen) Ltd. ........................................... China
Equity Affiliates
Haneda Airport International
Airline Apron PFI .......................................... Tokyo, Japan
Miyajima Aqua Partners Co., Ltd. ....................... Hiroshima, Japan
Non-Equity Affiliate
Matsuyama Environmental
Technology Co., Ltd. .................................... Ehime, Japan
Board of Directors and Auditors (As of June 28, 2012)Company Outline
Penta-Ocean Construction Group
(As of March 31, 2012)

46 Penta-Ocean Construction Co., Ltd.
HEAD OFFICE2-8, Koraku 2-chome, Bunkyo-ku, Tokyo 112-8576, JapanTel: 81-3-3817-7181 Fax: 81-3-3817-7642
SINGAPORE OFFICE1 Kim Seng Promenade, #13-01/02, Great World City, East Tower, Singapore 237994Tel: 65-6338-8966 Fax: 65-6337-0987
HONG KONG OFFICEUnit 601, K Wah Center, 191 Java Road, North Point,Hong KongTel: 852-2833-1098 Fax: 852-2572-4080
VIETNAM OFFICE4th Floor, 18 Tran Hung Dao Street, Hanoi, VietnamTel: 84-4-3824-1360 Fax: 84-4-3824-1444
INDONESIA OFFICEMid Plaza II, 24th Floor, JL. Jenderal Sudirman Kav. 10-11,Jakarta 10220, IndonesiaTel: 62-21-570-5484 Fax: 62-21-570-5485
MALAYSIA OFFICE508, 5th Floor, Block A, Kelana Business Centre 97, Jalan SS 7/2, Kelana Jaya, 47301 Petaling Jaya, Selangor Darul Ehsan, MalaysiaTel: 60-3-7492-2208 Fax: 60-3-7492-2209
EGYPT OFFICE27 El Falah Street, off Shehab Street, Flat No. 5, 2nd Floor,Mohandeseen, Giza, EgyptTel: 20-2-3345-3207 Fax: 20-2-3345-3206
COLOMBO OFFICEP.O. Box 383, No. 3-2, CBM House No. 2A, Lake Drive,Colombo 8, Sri LankaTel: 94-11-2690316 Fax: 94-11-2671944
BANGKOK OFFICE11th Floor, Room 1106, Vanit II Building, 1126/2, New Petchburi Road, Makkasan Rajthevee, Bangkok 10400, ThailandTel: 66-2-655-2183 Fax: 66-2-655-2185
DUBAI OFFICEP.O.Box 118791, #102, Al Yamama Bldg., Al Karama, Dubai, U.A.E.Tel: 971-4-342-6930 Fax: 971-4-342-6903
DELHI OFFICENo. 402, 4th Floor, Time Tower, Mehrauli Gurgaon Road,Gurgaon-122002, Haryana, IndiaTel: 91-124-436-8355 Fax: 91-124-436-8356
1
2
3
4
5
6
1
25
3
68
1011
7
9
4
7
8
9
10
11
Penta-Ocean Construction Network

Fiscal Year April 1 - March 31
Common Stock Authorized: 599,135,000
Issued: 286,013,910
Stock Listing First Section of the Tokyo and Nagoya
Stock Exchanges
Shareholders 47,853
Transfer Agency Mizuho Trust & Banking Co., Ltd.
2-8-4, Izumi, Suginami-ku,
Tokyo 168-8507, Japan
Tokyo Civil Engineering BranchCivil Engineering Sector
Technology Strategy Office
2020 DevelopmentBusiness Center
Architectural Sector
CSR Promotion Committee
Marketing Promotion Committee
Risk Management Committee
Central Safety, Health andEnvironment Committee Civil Engineering
Marketing Divisions Group
Urban DevelopmentDivisions Group
Architectural MarketingDivisions Group
Civil Engineering Divisions Group
Quality and EnvironmentalManagement Committee
General Administration Divisions Group
CSR Promotion Office
General Auditing Division
Personnel Division
Corporate Planning Division
Finance Division
Accounting Division
Administration Division
General Affairs Division
Board ofDirectors
Committeeof Auditors
President
Civil Engineering Planning Division
Marketing Division No. 1 – No. 4
Civil Engineering Project Division
Civil Engineering Division
Ship and Machinery Division
Civil Engineering Design Division
Environmental Business Division
Civil Engineering 2020 Development Division
Architectural Planning Division
Urban Development Division
Business Development Division
International Divisions Group
Institute of Technology
Safety, Quality and Environment Divisions Group
Marketing Division
Architectural Divisions Group
Architectural Division
Architectural Design Division
M&E Division
Sapporo Branch
Tohoku Branch
Hokuriku Branch
Nagoya Branch
Osaka Branch
Chugoku Branch
Shikoku Branch
Kyushu Branch
Tokyo Architectural Branch
International Engineering & Marketing Division
International Administration Division
World Operation Center
Civil Engineering R&D Division
Architectural R&D Division
Procurement Division
Safety, Quality and Environment Division
Institute of Environment
Major Shareholders
Shareholders Shares held Voting right (thousands) ratio (%)
Japan Trustee Services Bank, Ltd. (Trust Account) 17,446 6.1
The Master Trust Bank of Japan, Ltd. (Trust Account) 13,691 4.8
Mizuho Corporate Bank, Ltd. 7,059 2.5
Meiji Yasuda Life Insurance Co. 6,656 2.3
Sompo Japan Insurance Inc. 6,113 2.1
Juniper 4,410 1.5
Tokio Marine & Nichido Fire Insurance Co., Ltd. 3,934 1.4
Japan Trustee Services Bank, Ltd. (Trust Account 9) 3,861 1.4
Mizuho Trust & Banking Co., Ltd. 3,470 1.2
Penta-Ocean Employee Stock Ownership Plan 3,410 1.2
New Accounting Standards Project Team
Organization Chart (As of April 1, 2012)
Investor Information (As of March 31, 2012)
Hong Kong Office
Vietnam Office
Singapore Office
Indonesia Office
Malaysia Office
Egypt Office
Colombo Office
Bangkok Office
Dubai Office
Delhi Office

www.penta-ocean.co.jp
Printed in Japan
Penta-O
cean C
on
structio
n A
nn
ual R
ep
ort 2
012
Annual Report 2012Year Ended March 31, 2012
Penta-Ocean Construction